Bioceres Crop Solutions Corp. · NASDAQ:BIOX
Bioceres Crop Solutions — Merger or Acquisition (March 2022)
16 slides from Bioceres Crop Solutions's merger presentation, Mar 17, 2022
Slide 1: Bioceres Crop Solutions Transaction Presentation
Bioceres Crop Solutions Transaction Presentation
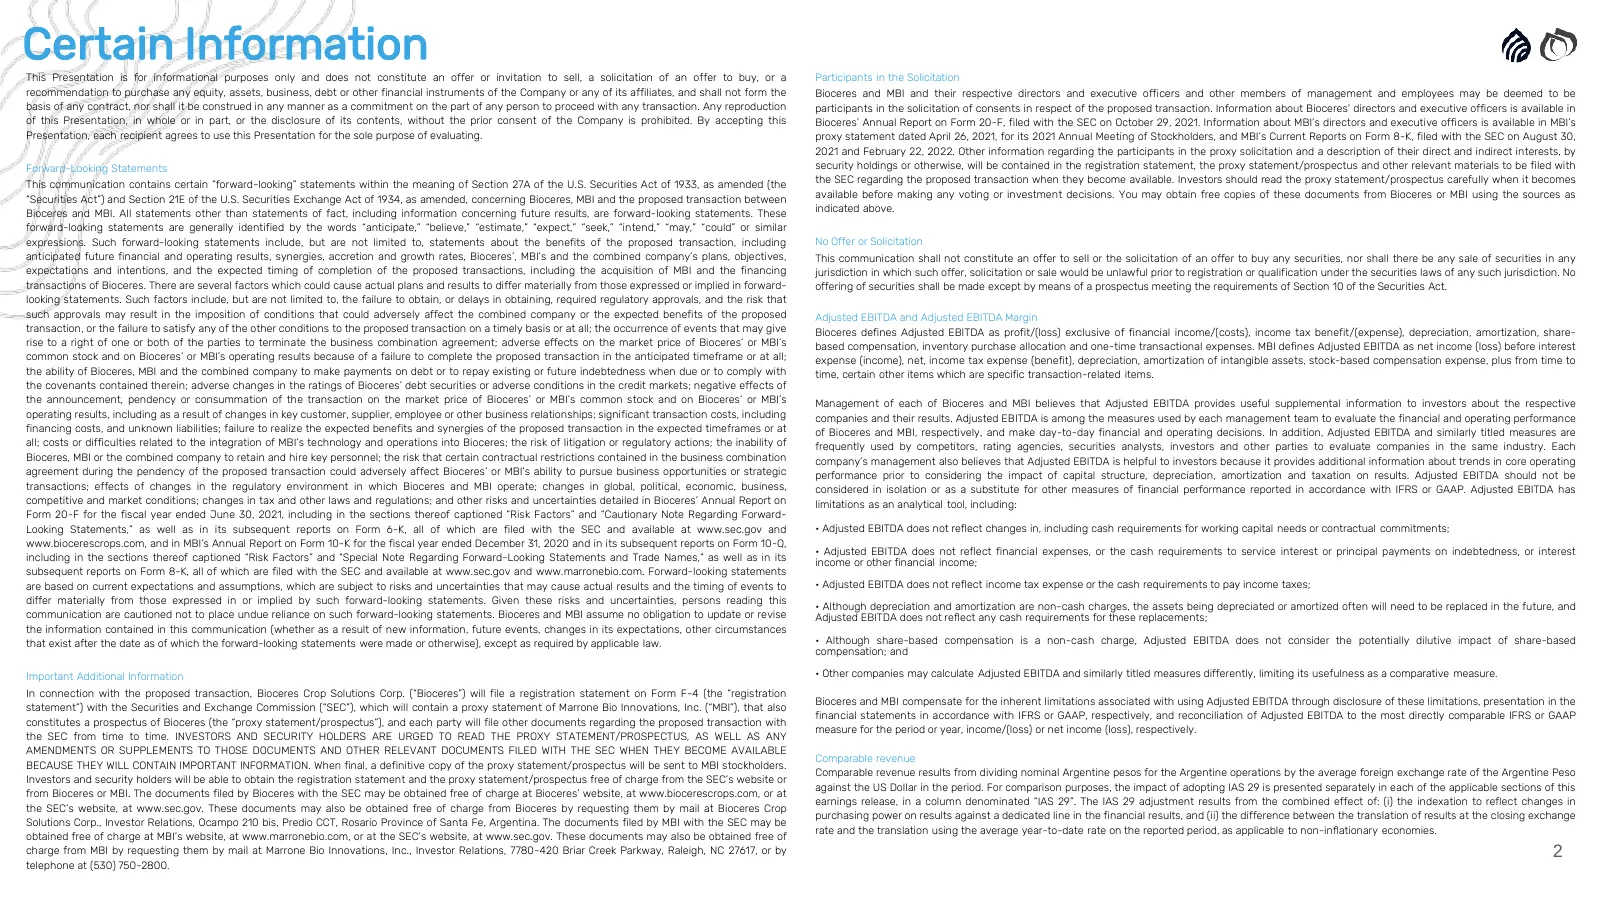
Slide 2: Certain Information and Forward-Looking Statements
Certain Information Participants in the Solicitation This Presentation is for informational purposes only and does not constitute an offer or invitation to sell, a solicitation of an offer to buy, or a recommendation to purchase any equity, assets, business, debt or other financial instruments of th
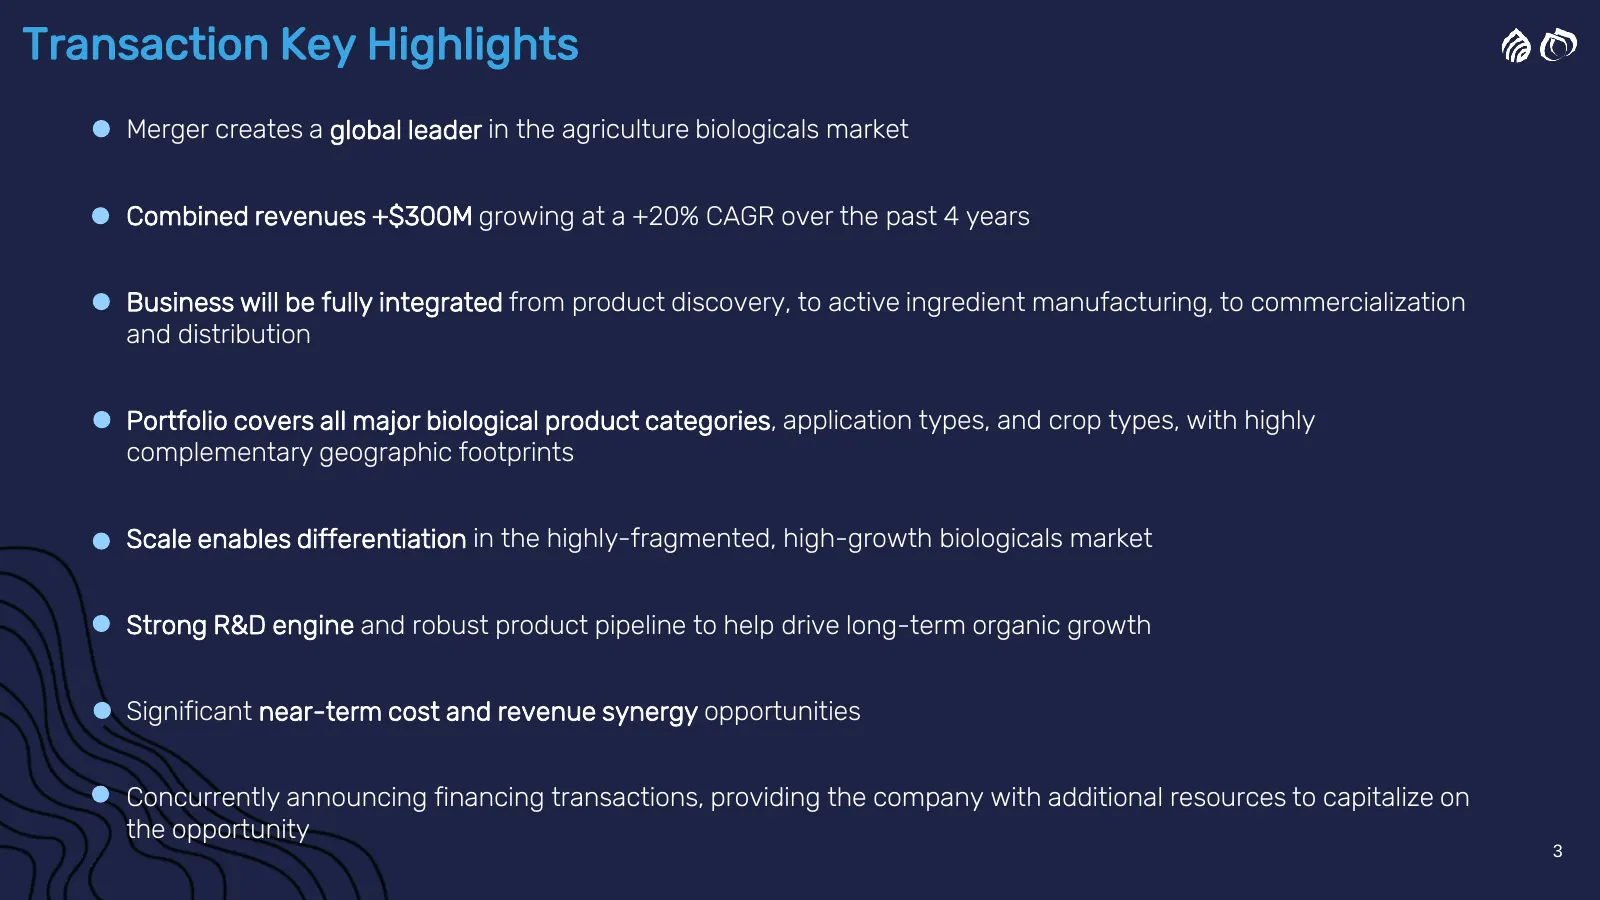
Slide 3: Transaction Key Highlights
Transaction Key Highlights Merger creates a global leader in the agriculture biologicals market Combined revenues +$300M growing at a +20% CAGR over the past 4 years Business will be fully integrated from product discovery, to active ingredient manufacturing, to commercialization and distribution Po
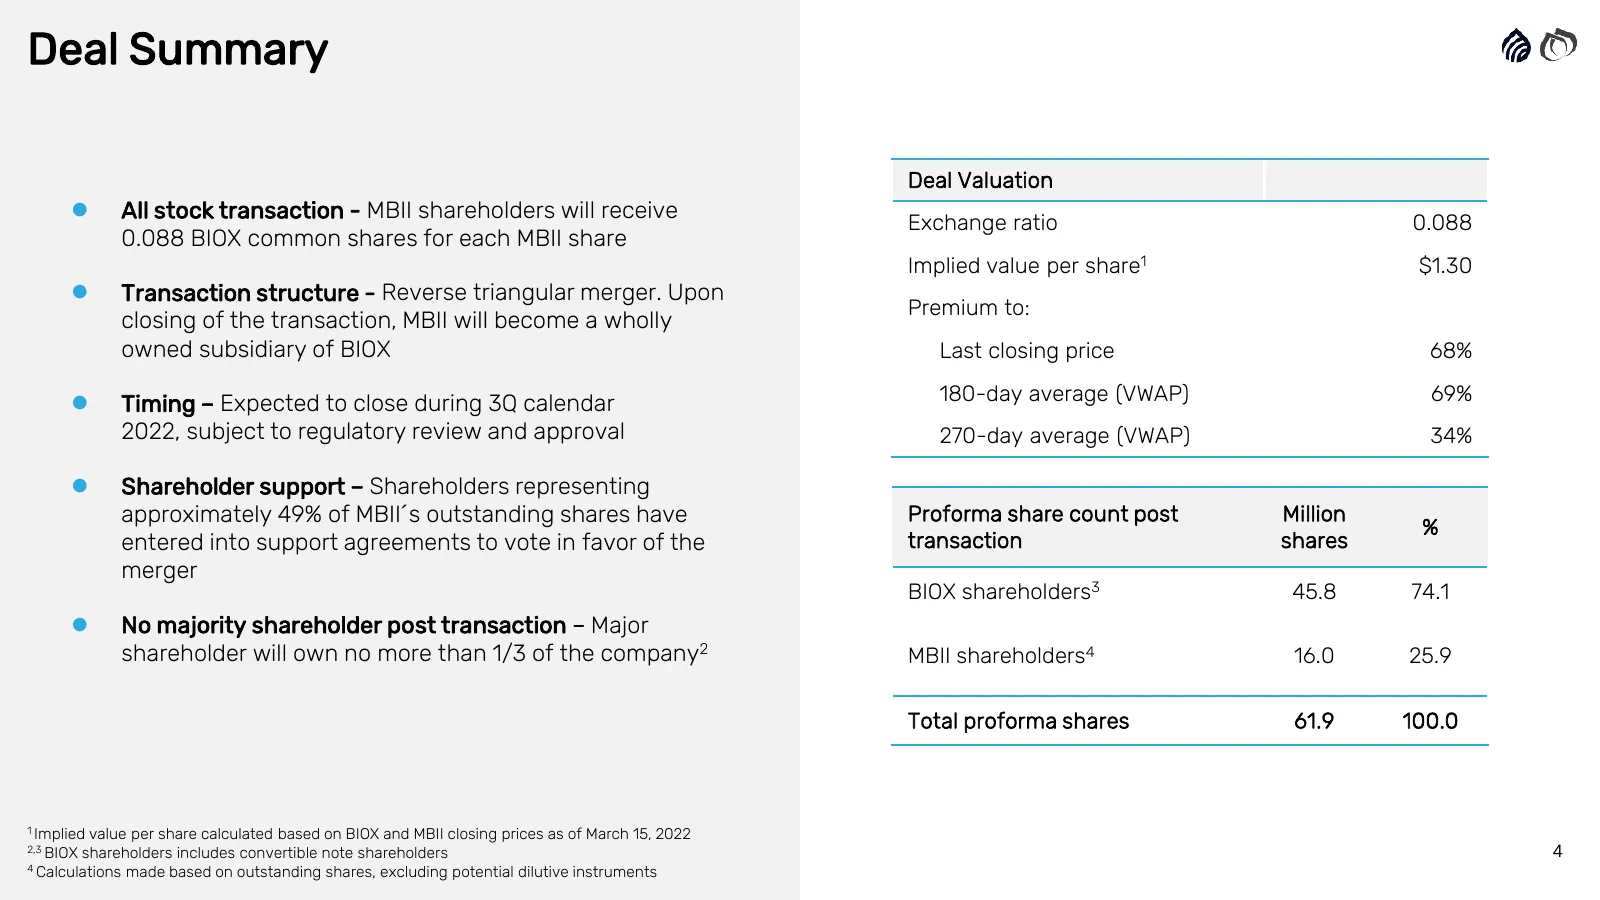
Slide 4: Deal Summary
Deal Summary Deal Valuation ⚫ All stock transaction - MBII shareholders will receive Exchange ratio 0.088 0.088 BIOX common shares for each MBII share Implied value per share1 $1.30 ⚫ Transaction structure - Reverse triangular merger. Upon Premium to: closing of the transaction, MBII will become a w
Slide 5: Companies Overview
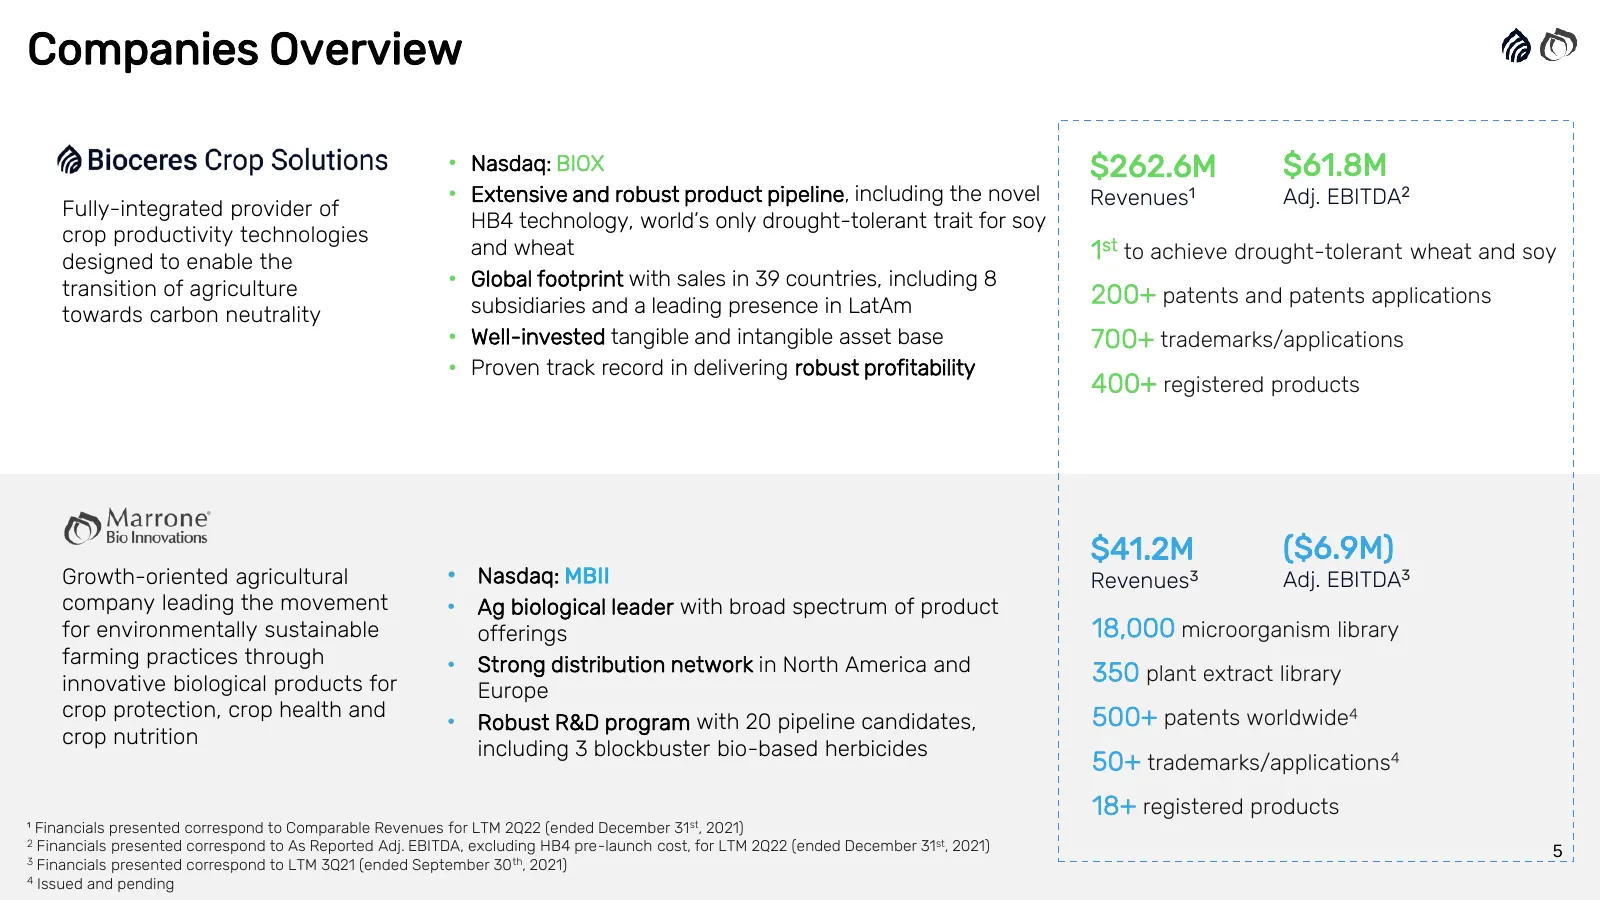
Companies Overview • Nasdaq: BIOX $262.6M $61.8M • Extensive and robust product pipeline, including the novel Revenues1 Adj. EBITDA2 Fully-integrated provider of HB4 technology, world’s only drought-tolerant trait for soy crop productivity technologies designed to enable the and wheat 1st to achieve
Slide 6: Marrone Investment Opportunity
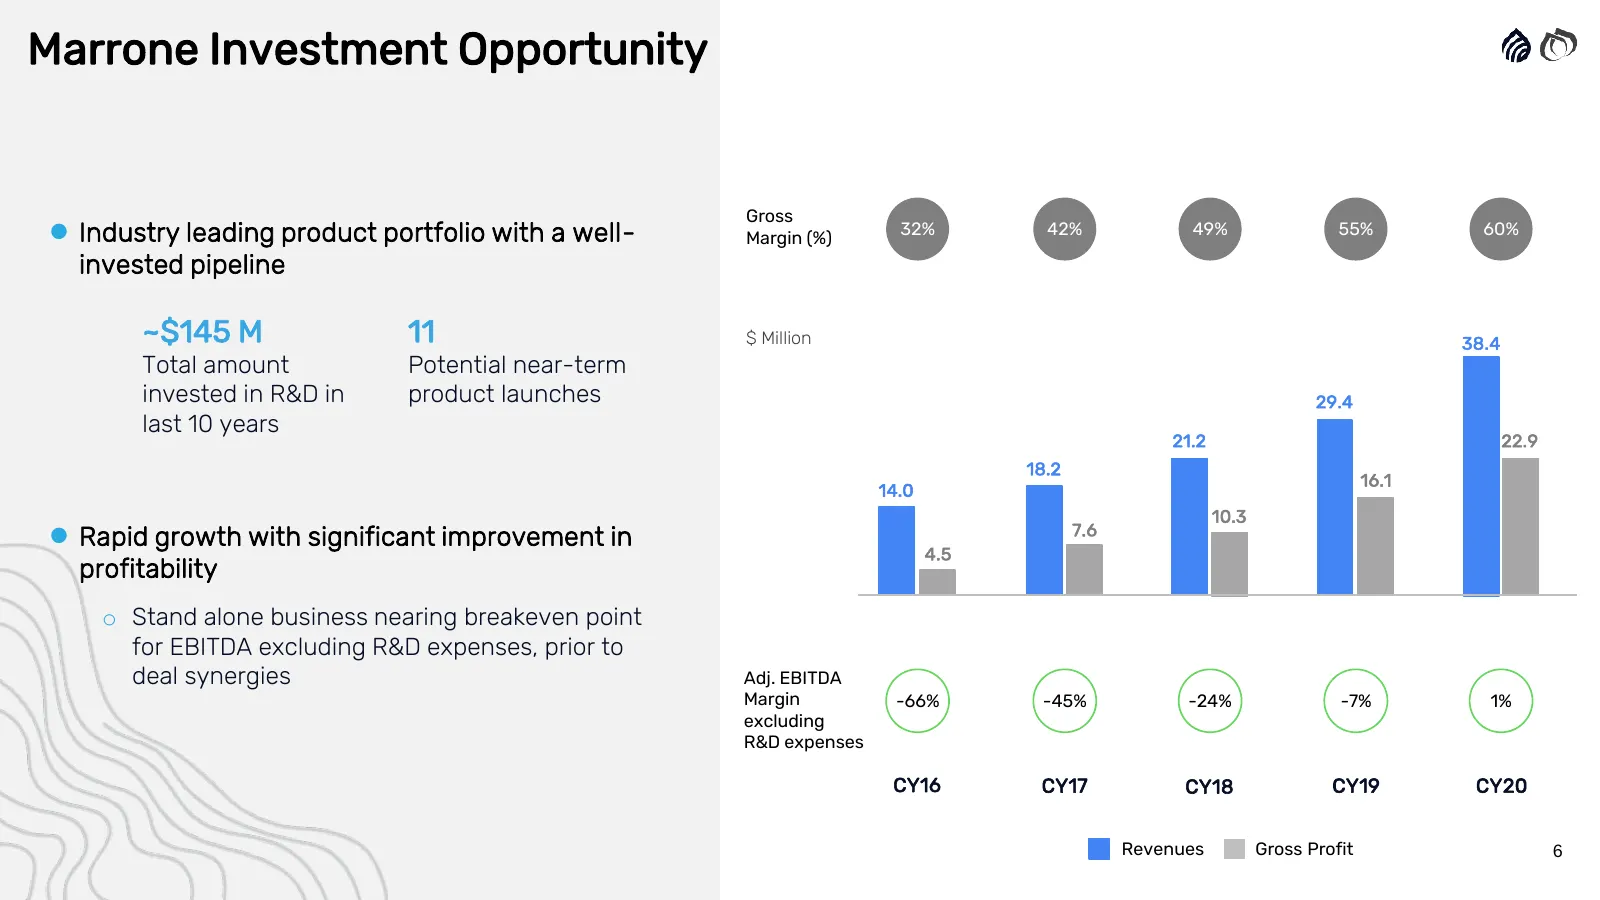
Marrone Investment Opportunity Gross ⚫ Industry leading product portfolio with a well- Margin (%) 32% 42% 49% 55% 60% invested pipeline ~$145 M 11 $ Million 38.4 Total amount Potential near-term invested in R&D in product launches 29.4 last 10 years 21.2 22.9 18.2 16.1 14.0 10.3 7.6 ⚫ Rapid growth w
Slide 7: Biological Growth Opportunity
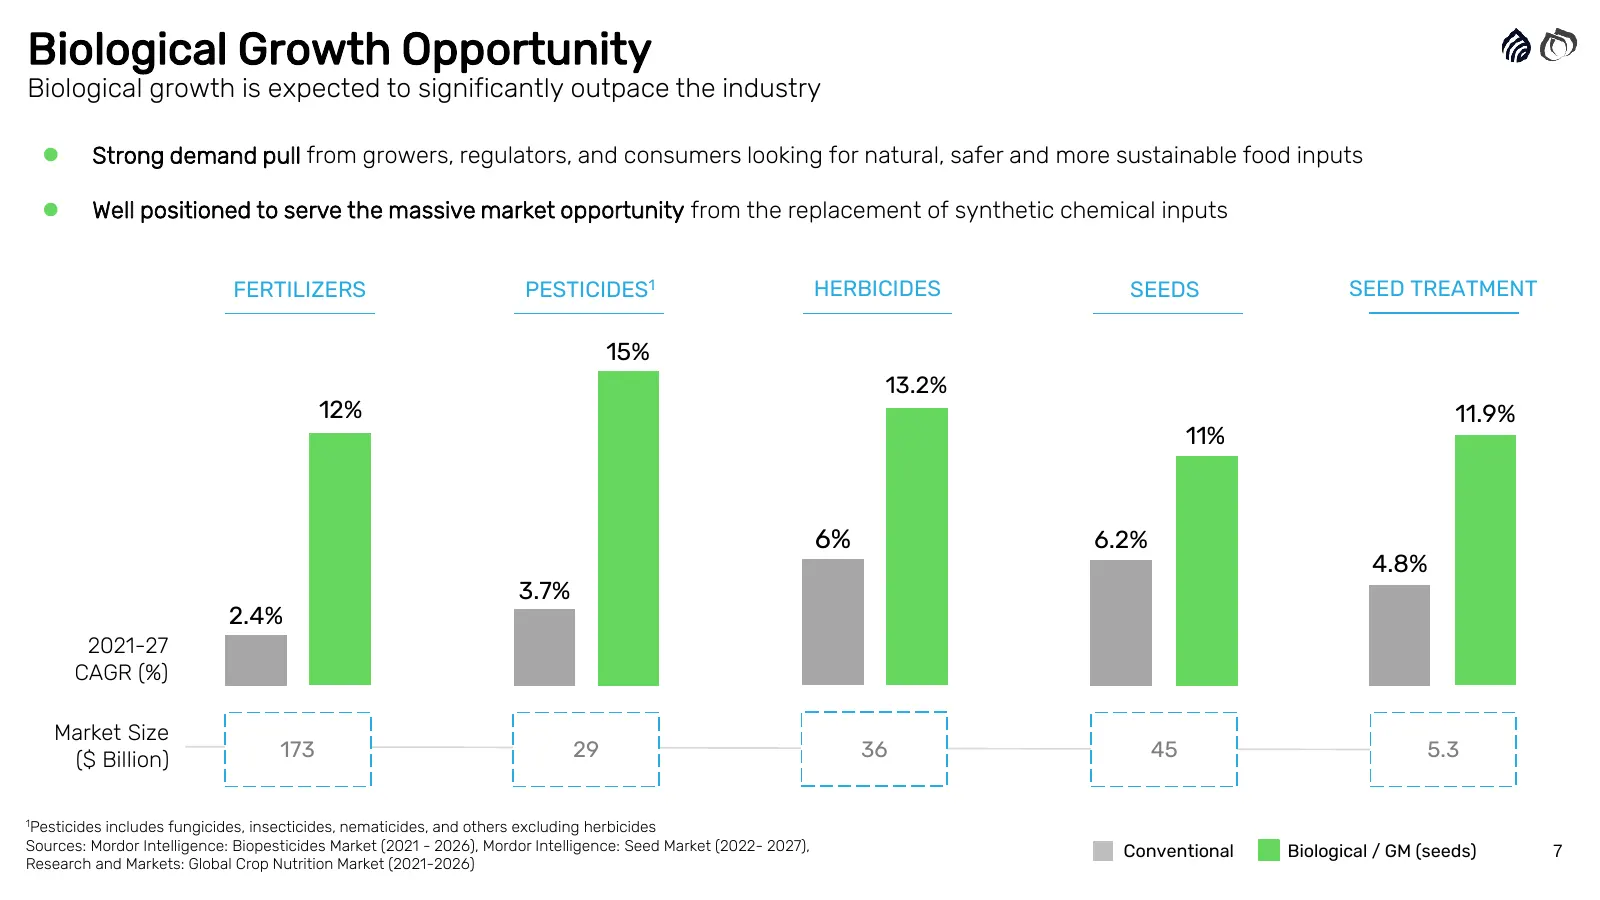
Biological Growth Opportunity Biological growth is expected to significantly outpace the industry ⚫ Strong demand pull from growers, regulators, and consumers looking for natural, safer and more sustainable food inputs ⚫ Well positioned to serve the massive market opportunity from the replacement of
Slide 8: Combined Biological Portfolio
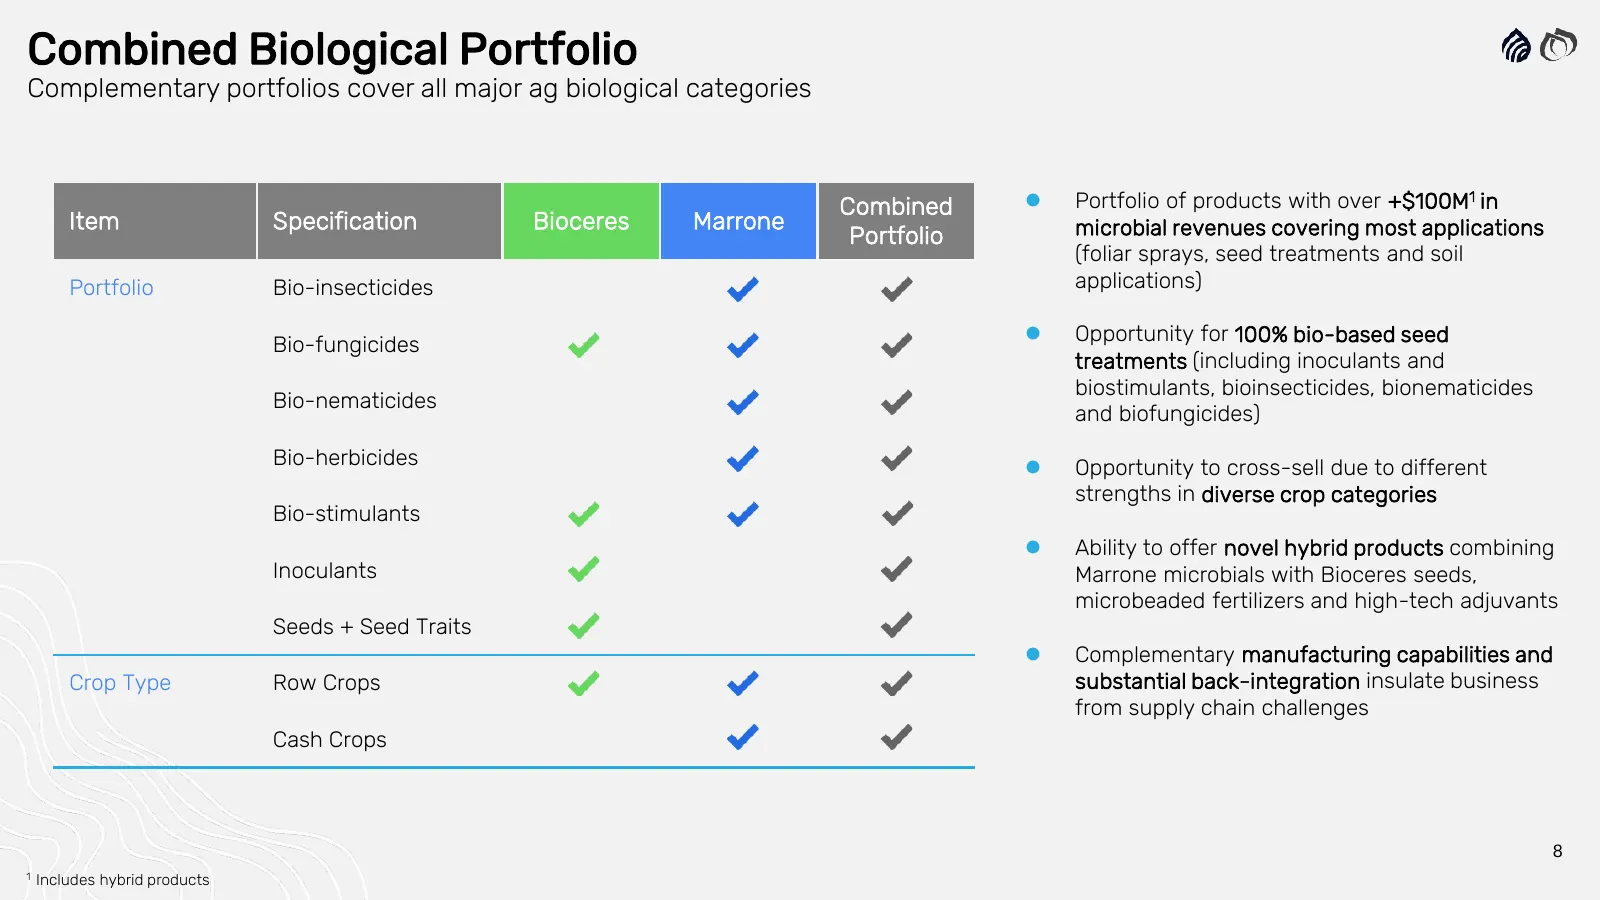
Combined Biological Portfolio Complementary portfolios cover all major ag biological categories Combined ⚫ Portfolio of products with over +$100M1 in Item Specification Bioceres Marrone microbial revenues covering most applications Portfolio (foliar sprays, seed treatments and soil Portfolio Bio-ins
Slide 9: Combination Creates Global Distribution Coverage
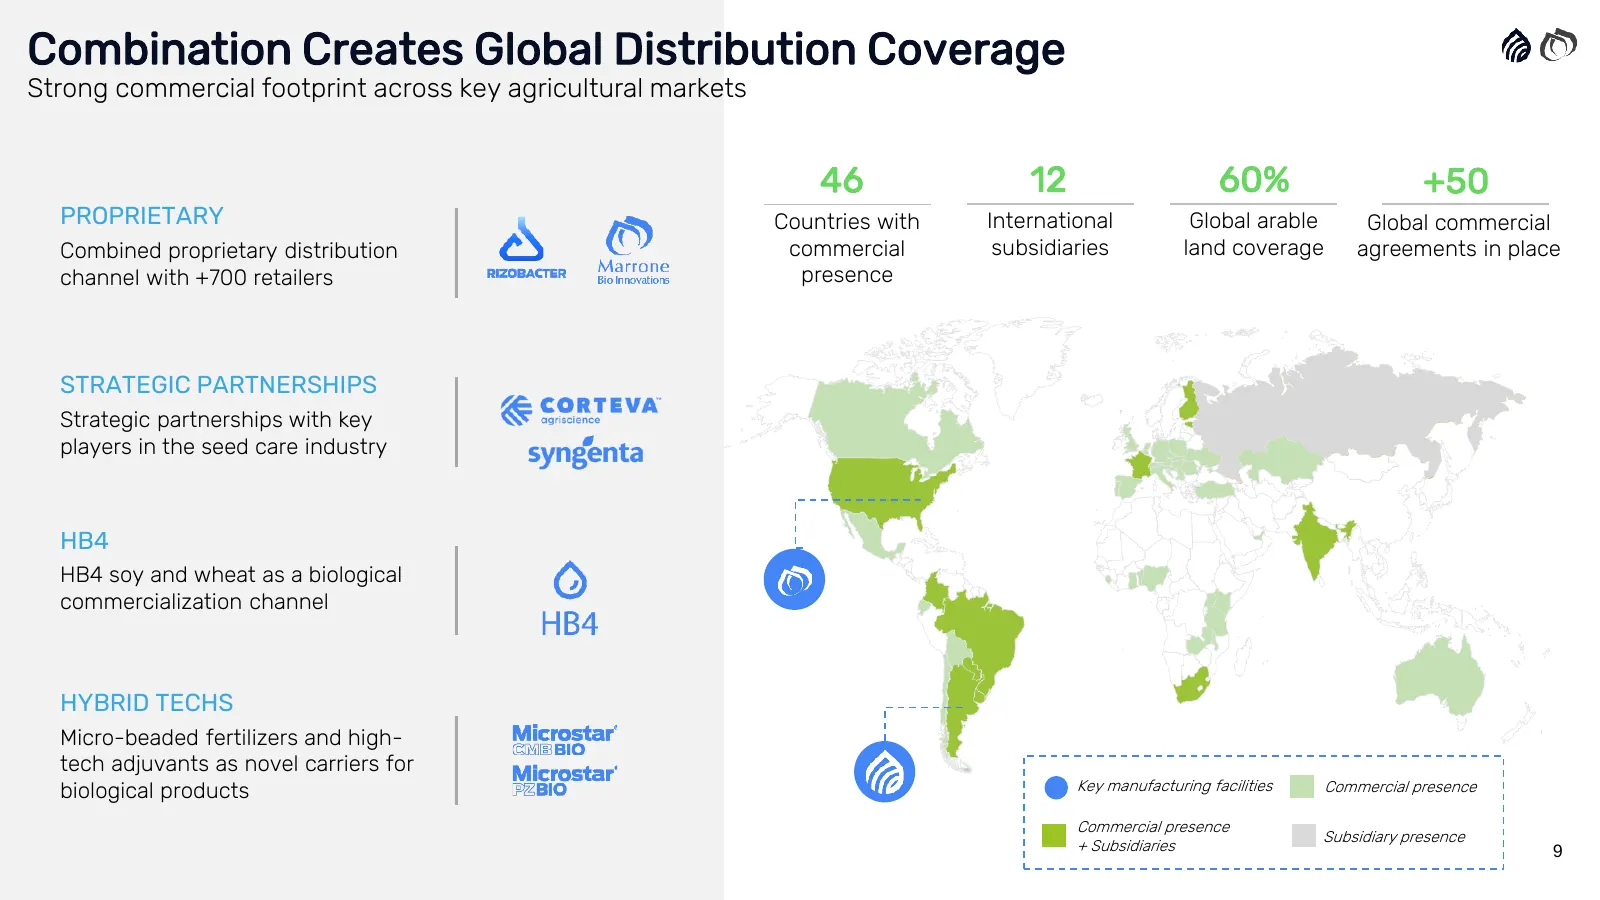
Combination Creates Global Distribution Coverage Strong commercial footprint across key agricultural markets 46 12 60% +50 PROPRIETARY Countries with International Global arable Global commercial Combined proprietary distribution commercial subsidiaries land coverage agreements in place channel with
Slide 10: Upcoming Pipeline Commercial Launches
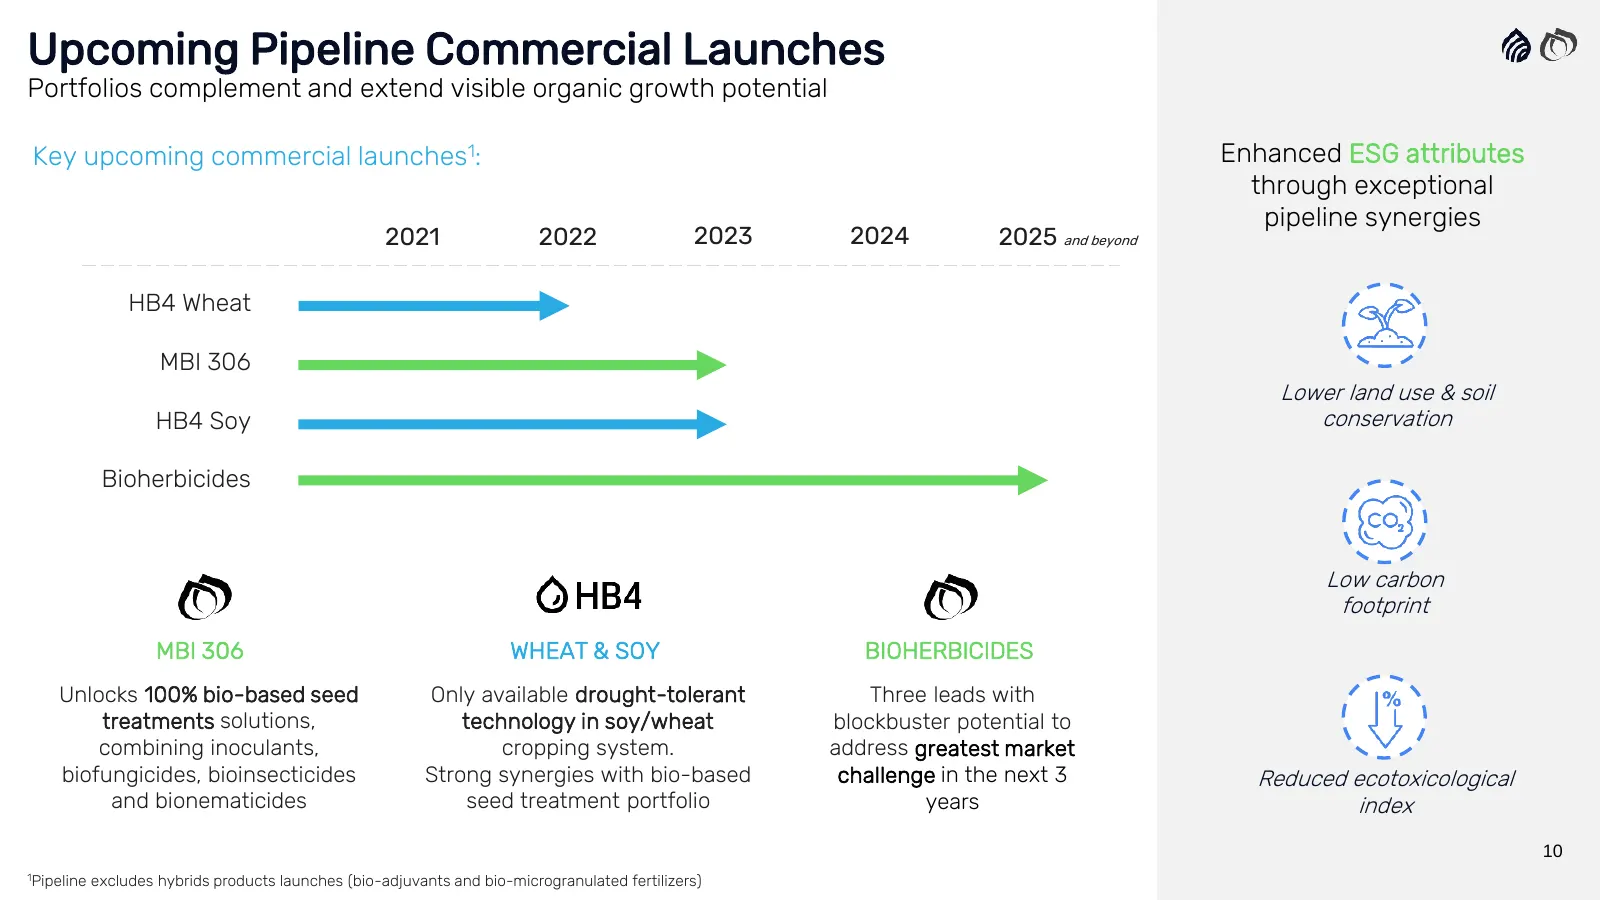
Upcoming Pipeline Commercial Launches Portfolios complement and extend visible organic growth potential Key upcoming commercial launches1: Enhanced ESG attributes through exceptional pipeline synergies 2021 2022 2023 2024 2025 and beyond HB4 Wheat MBI 306 Lower land use & soil HB4 Soy conservation B
Slide 11: Financial Synergies
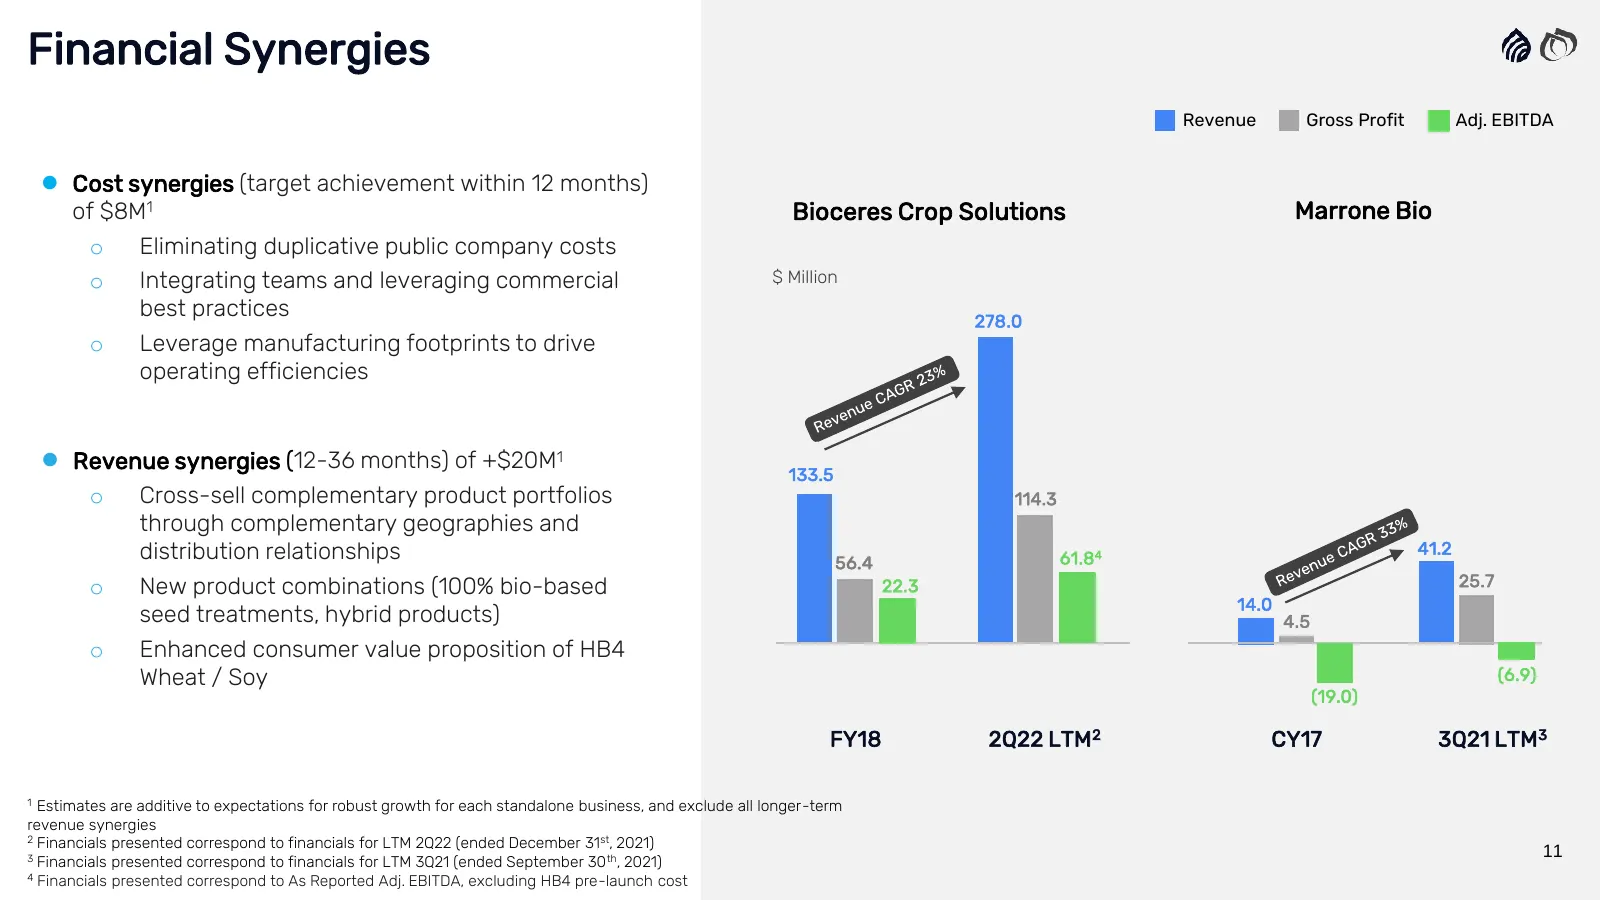
Financial Synergies Revenue Gross Profit Adj. EBITDA ⚫ Cost synergies (target achievement within 12 months) of $8M1 Bioceres Crop Solutions Marrone Bio o Eliminating duplicative public company costs o Integrating teams and leveraging commercial $ Million best practices 278.0 o Leverage manufacturing
Slide 12: Rizobacter Case Study
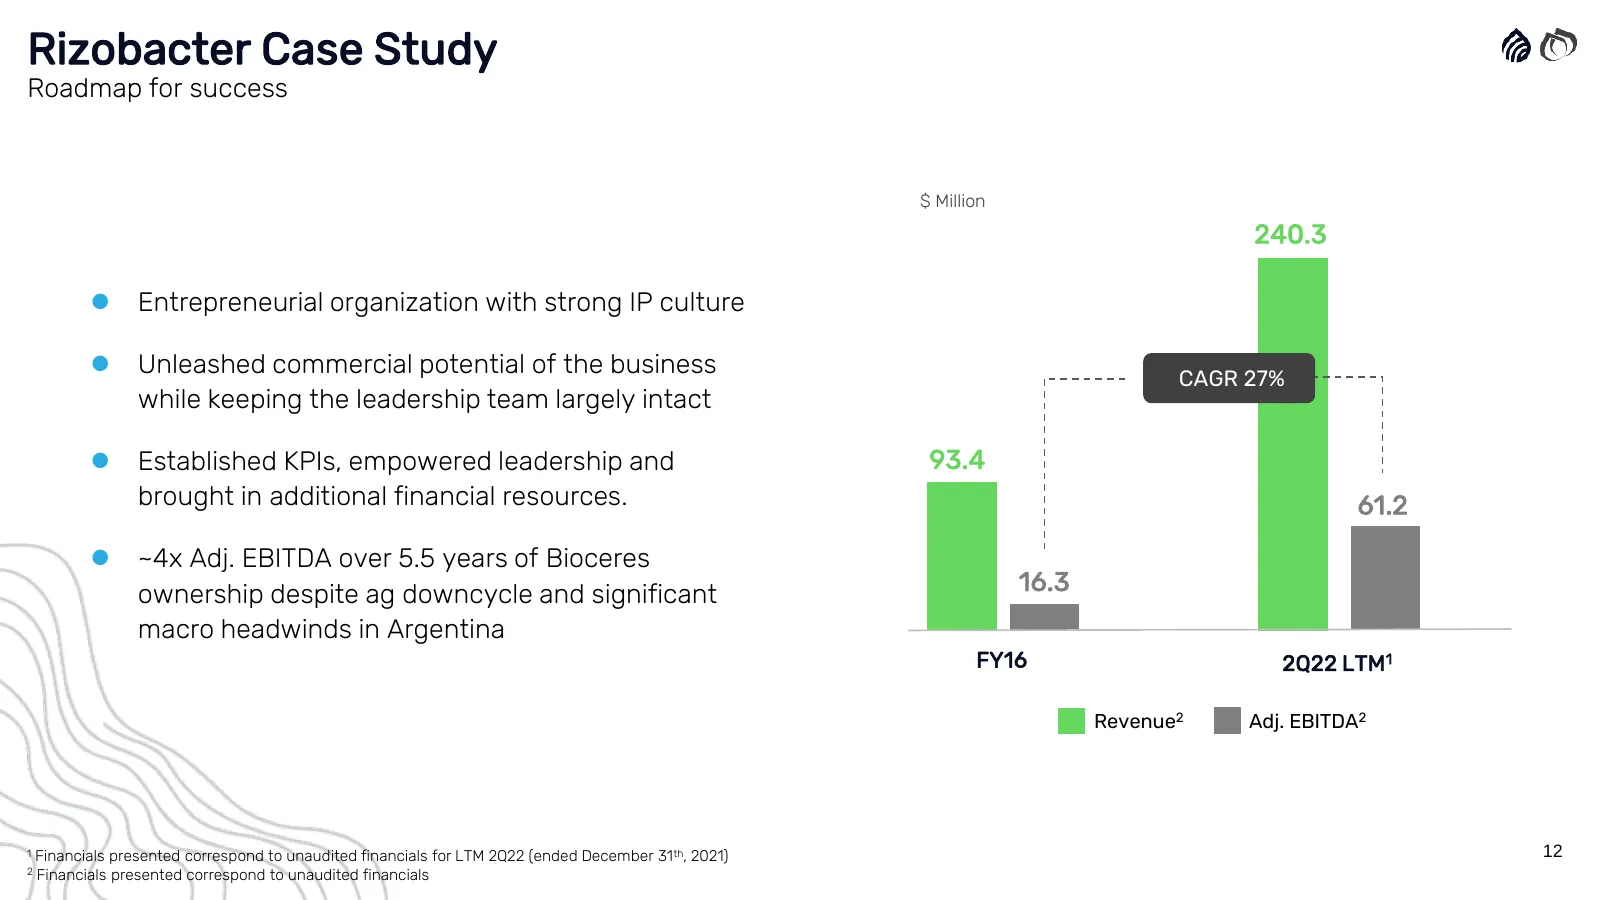
Rizobacter Case Study Roadmap for success $ Million 240.3 ⚫ Entrepreneurial organization with strong IP culture ⚫ Unleashed commercial potential of the business CAGR 27% while keeping the leadership team largely intact ⚫ Established KPIs, empowered leadership and 93.4 brought in additional financial
Slide 13: Financing Update
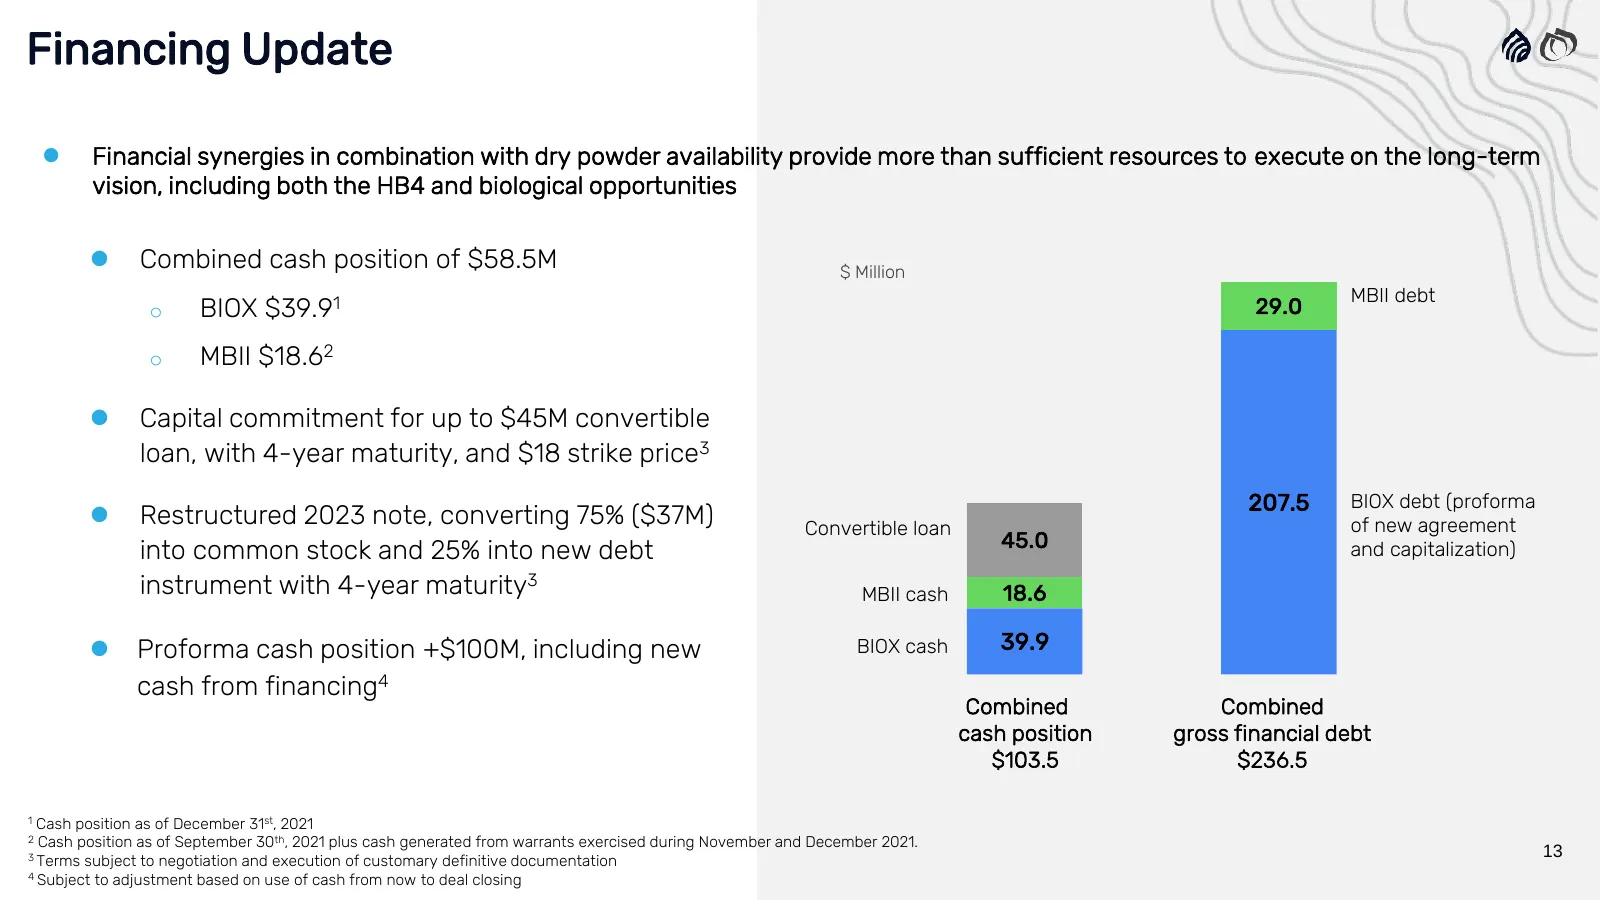
Financing Update ⚫ Financial synergies in combination with dry powder availability provide more than sufficient resources to execute on the long-term vision, including both the HB4 and biological opportunities ⚫ Combined cash position of $58.5M $ Million MBII debt o BIOX $39.91 29.0 o MBII $18.62 ⚫
Slide 14: Contact Us
Contact Us Bioceres Crop Solutions Investorrelations@biocerescrops.com Investors.biocerescrops.com Marrone Bio Innovations info@marronebio.com investors.marronebio.com 14
Slide 15: Appendix I: Marrone Bio Adj. EBITDA reconciliation
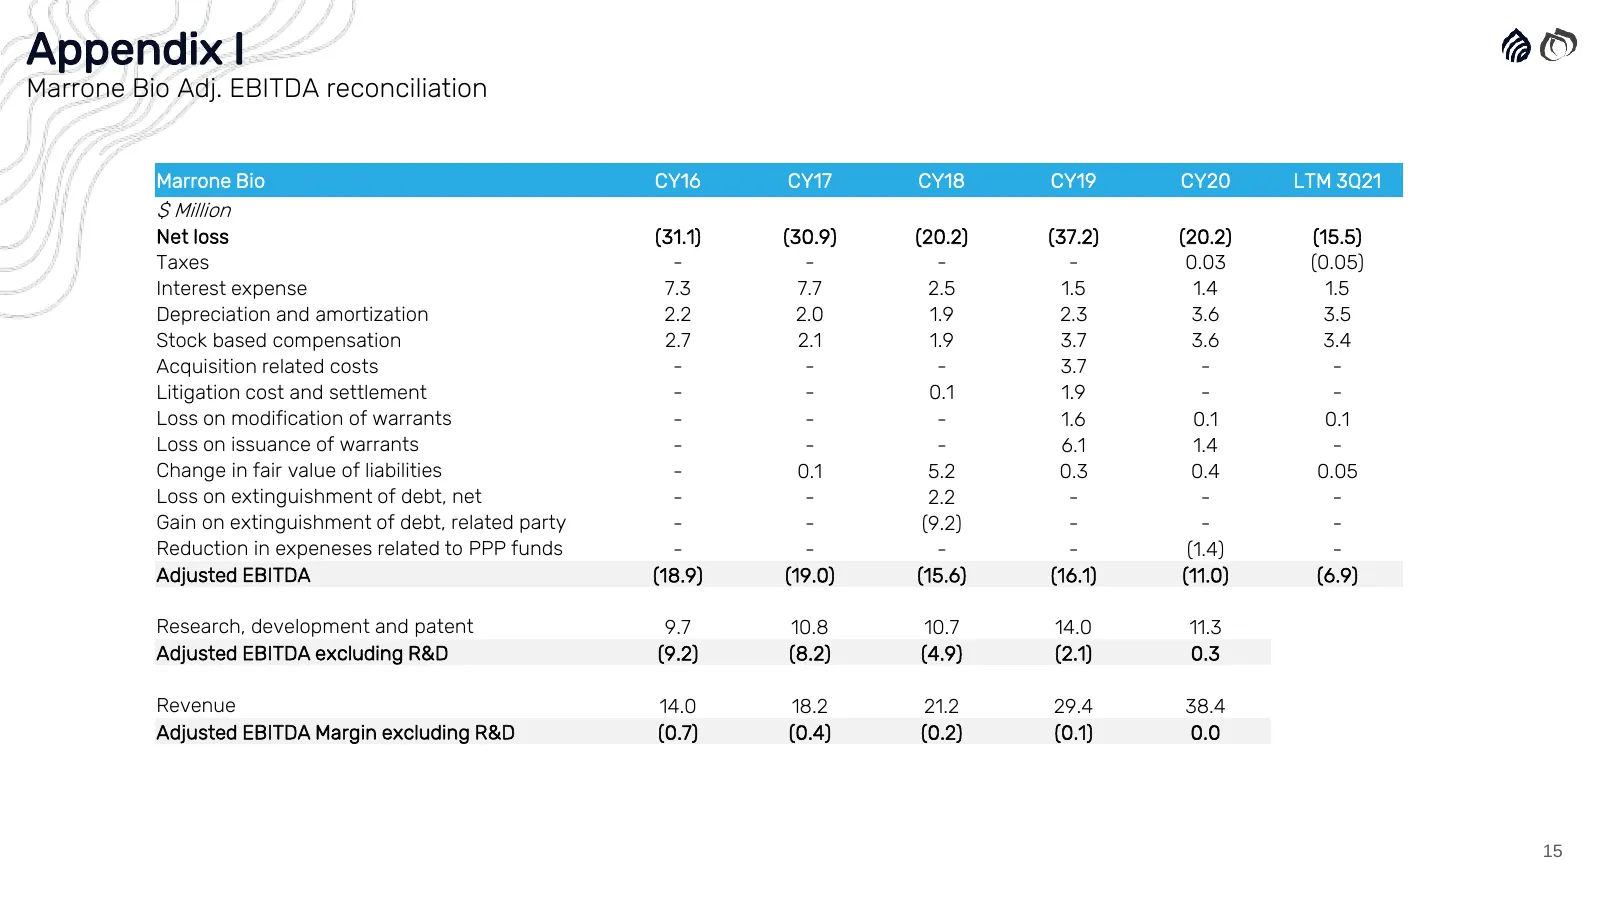
Appendix I Marrone Bio Adj. EBITDA reconciliation Marrone Bio CY16 CY17 CY18 CY19 CY20 LTM 3Q21 $ Million Net loss (31.1) (30.9) (20.2) (37.2) (20.2) (15.5) Taxes - - - - 0.03 (0.05) Interest expense 7.3 7.7 2.5 1.5 1.4 1.5 Depreciation and amortization 2.2 2.0 1.9 2.3 3.6 3.5 Stock based compensati
Slide 16: Appendix II: BIOX and Rizobacter Adj. EBITDA reconciliation
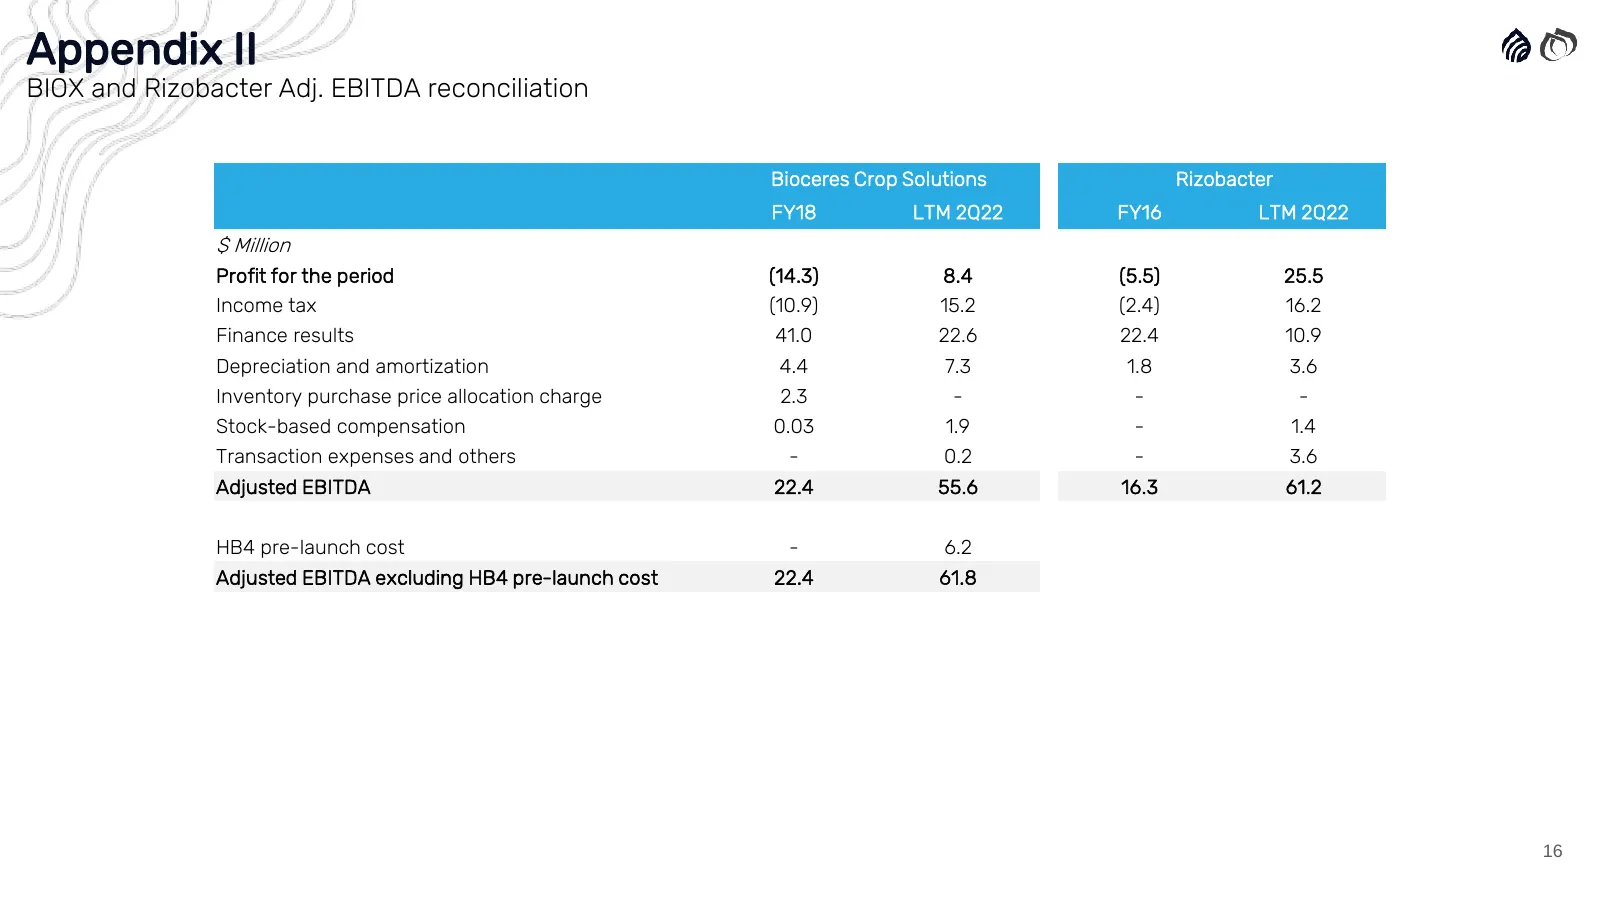
Appendix II BIOX and Rizobacter Adj. EBITDA reconciliation Bioceres Crop Solutions Rizobacter FY18 LTM 2Q22 FY16 LTM 2Q22 $ Million Profit for the period (14.3) 8.4 (5.5) 25.5 Income tax (10.9) 15.2 (2.4) 16.2 Finance results 41.0 22.6 22.4 10.9 Depreciation and amortization 4.4 7.3 1.8 3.6 Inventor
Source: company website
More decks from Bioceres Crop Solutions Corp.
 Q4 2026 Earnings Presentation17 slides · Sep 15, 2026
 Q3 2026 Earnings Presentation16 slides · May 12, 2026
 Q1 2026 Earnings Presentation13 slides · Nov 13, 2025
 Q4 2025 Earnings Presentation16 slides · Sep 9, 2025
 Q3 2025 Earnings Presentation18 slides · May 21, 2025
 Q2 2025 Earnings Presentation20 slides · Feb 12, 2025