Hillenbrand — Investor Day (December 2022)
111 slides from Hillenbrand's investor day presentation, Dec 15, 2022

Slide 1: 2022 Investor Day December 15, 2022
2022 Investor Day December 15, 2022
Slide 2: Disclosure Regarding Forward-Looking Statements
2 2 Disclosure Regarding Forward - Looking Statements Throughout this presentation, we make a number of “forward - looking statements,” including statements regarding the proposed sale of our Batesville business (the “Proposed Transaction”) and the expected timing, costs and benefits thereof, that a

Slide 3: Q&A Reminder
Q&A Reminder 1 " C2] = a) \ | i \ Conference Code \ ae } } \ \ \ ‘a, wr Neu Open browser on Please join at Enter code our smart phone . yon or tablet liveQA.com EZVES Click Join HILLENBRAND
Slide 4: Today's Agenda
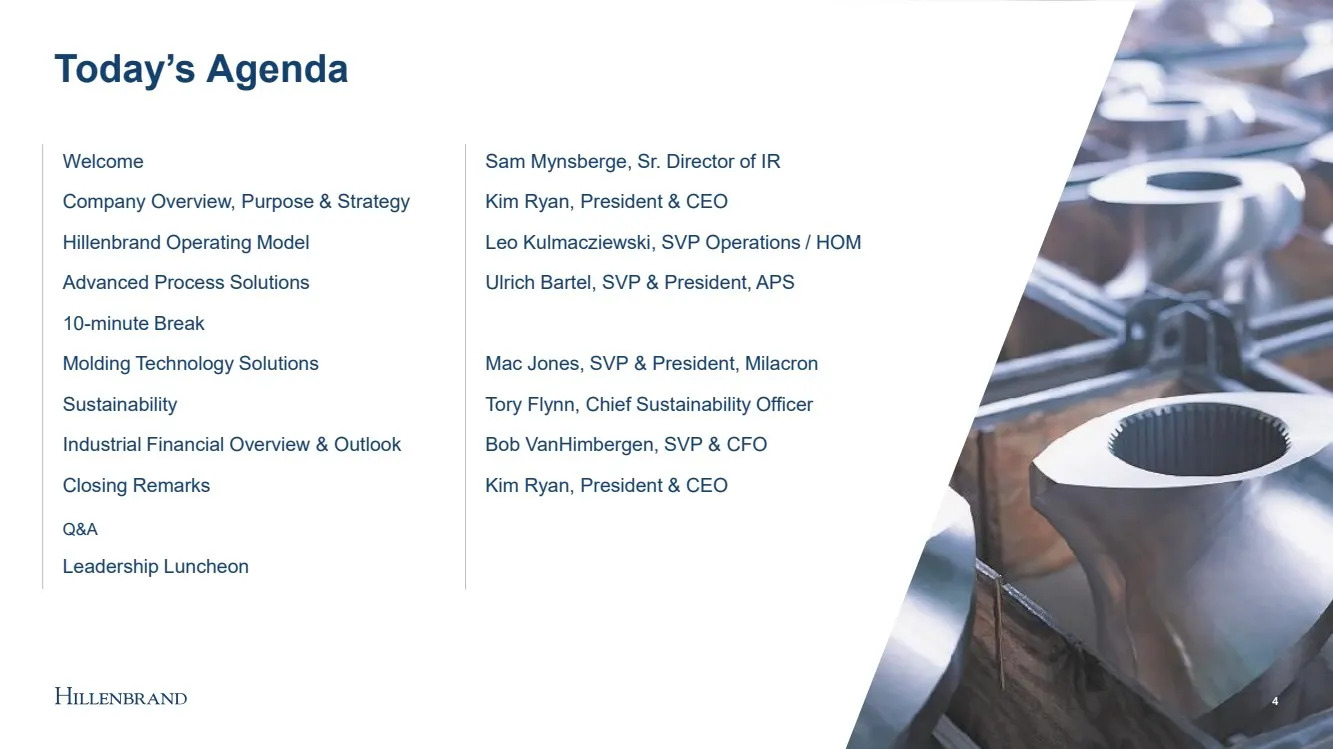
4 4 Today’s Agenda Welcome Sam Mynsberge, Sr. Director of IR Company Overview, Purpose & Strategy Kim Ryan, President & CEO Hillenbrand Operating Model Leo Kulmacziewski , SVP Operations / HOM Advanced Process Solutions Ulrich Bartel, SVP & President, APS 10 - minute Break Molding Technology Solutio

Slide 5: Company Overview, Vision, & Strategy
Company Overview, Vision, & Strategy Kim Ryan – President & Chief Executive Officer 5
Slide 6: Hillenbrand: A Compelling Investment
Hillenbrand: A Compelling Investment 6 6 Transformed into a pure - play global industrial leader in highly - engineered, mission - critical processing solutions serving customers throughout the product lifecycle Embedded purpose throughout our organization to drive our commitment to support a more s
Slide 7: Our Transformation Journey
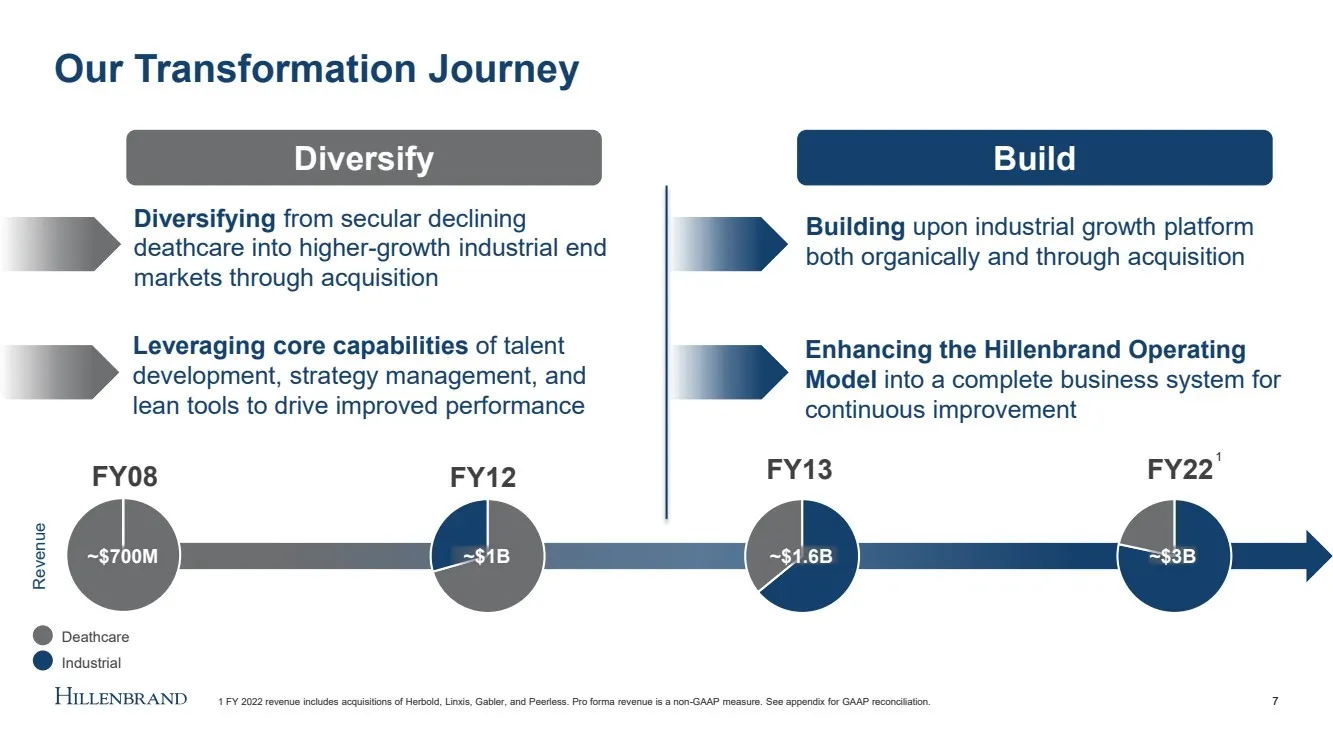
Diversify Our Transformation Journey 7 Deathcare Deathcare Industrial Industrial Deathcare FY08 FY12 FY13 FY22 Industrial Deathcare Diversifying from secular declining deathcare into higher - growth industrial end markets through acquisition Leveraging core capabilities of talent development, strate
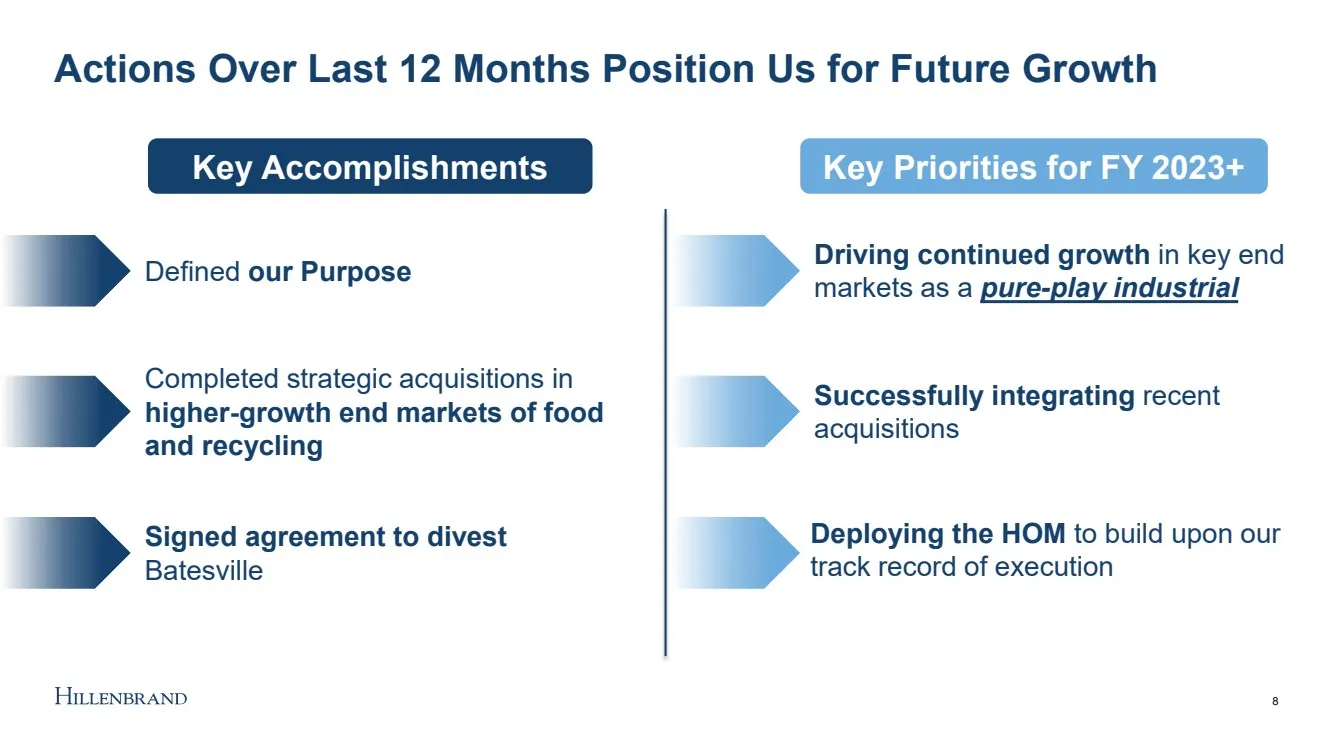
Slide 8: Actions Over Last Months Position Us for Future Growth
Actions Over Last 12 Months Position Us for Future Growth 8 Driving continued growth in key end markets as a pure - play industrial Defined our Purpose Completed strategic acquisitions in higher - growth end markets of food and recycling Signed agreement to divest Batesville Deploying the HOM to bui
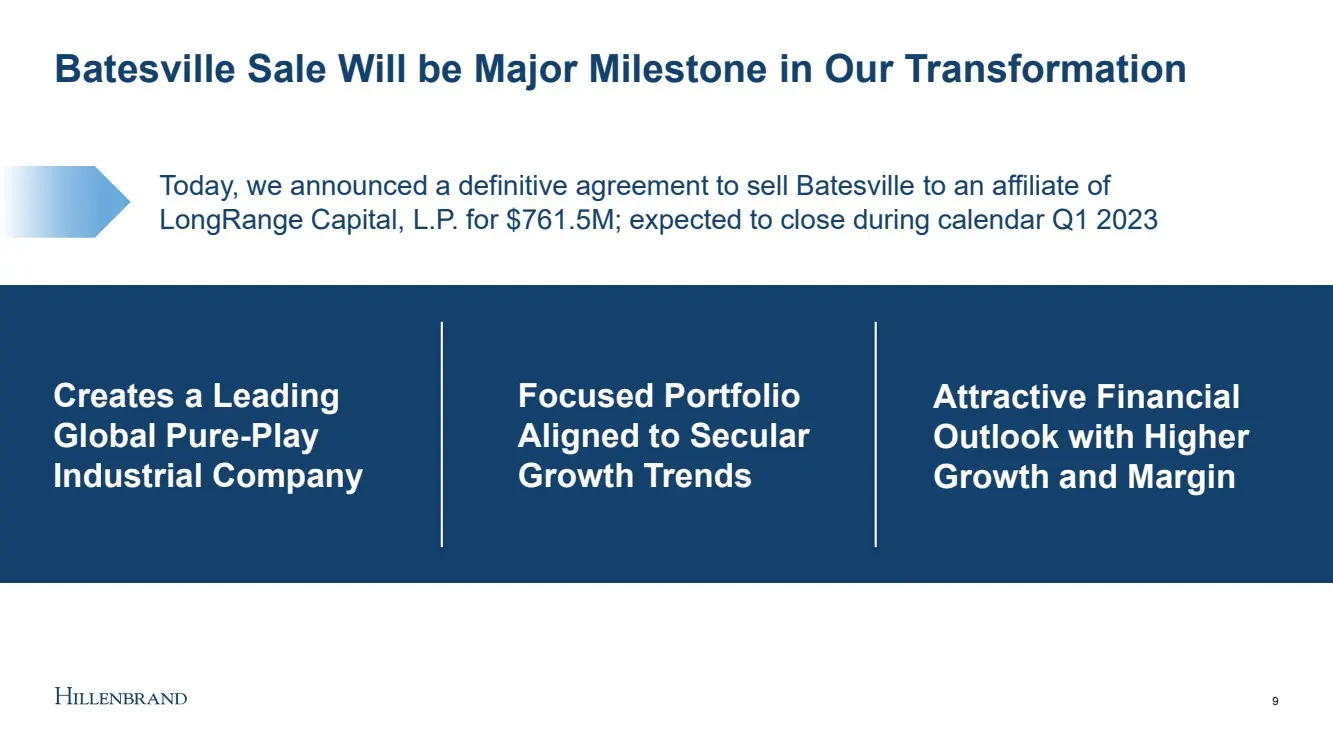
Slide 9: Batesville Sale Will be Major Milestone in Our Transformation
Batesville Sale Will be Major Milestone in Our Transformation 9 Today, we announced a definitive agreement to sell Batesville to an affiliate of LongRange Capital, L.P. for $761.5M ; expected to close during calendar Q1 2023 Creates a Leading Global Pure - Play Industrial Company Focused Portfolio A

Slide 10: Purpose Video Placeholder
10 Purpose Video Placeholder
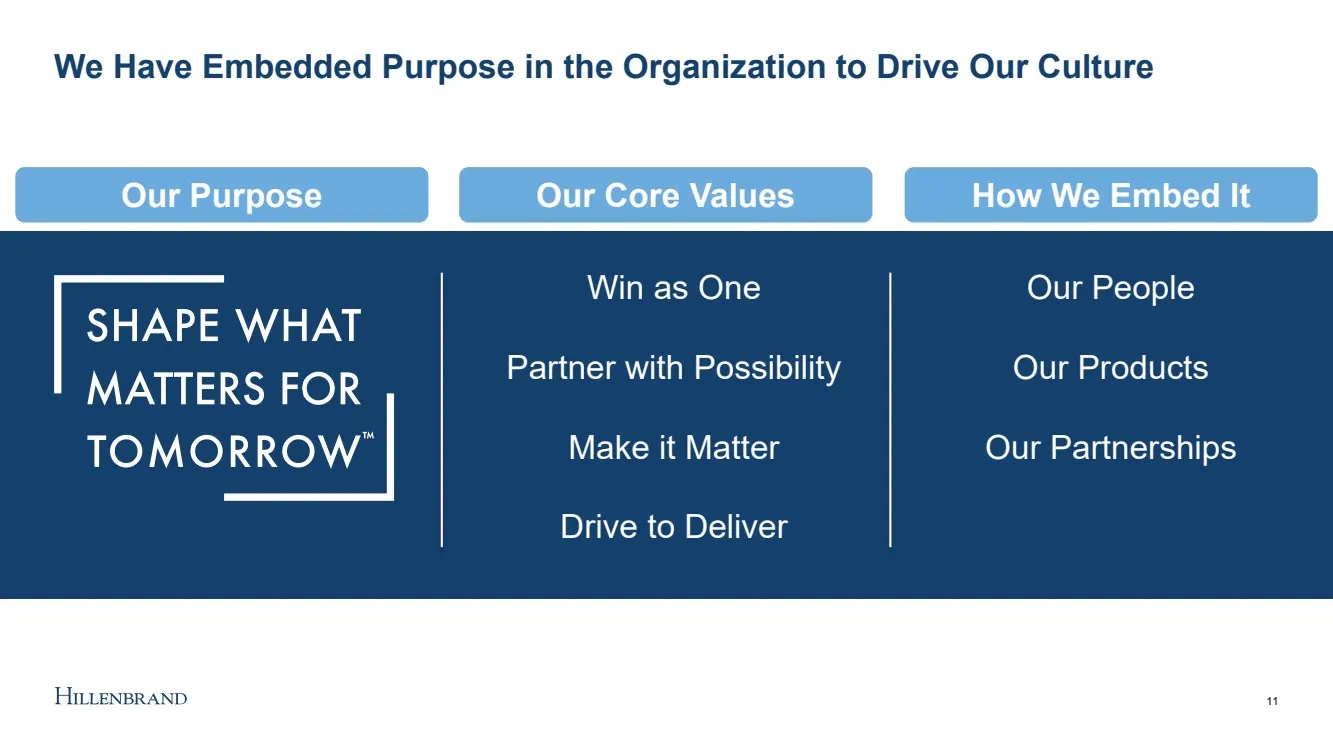
Slide 11: We Have Embedded Purpose in the Organization to Drive Our Culture
We Have Embedded Purpose in the Organization to Drive Our Culture 11 Win as One Partner with Possibility Make it Matter Drive to Deliver Our People Our Products Our Partnerships Our Purpose Our Core Values How We Embed It
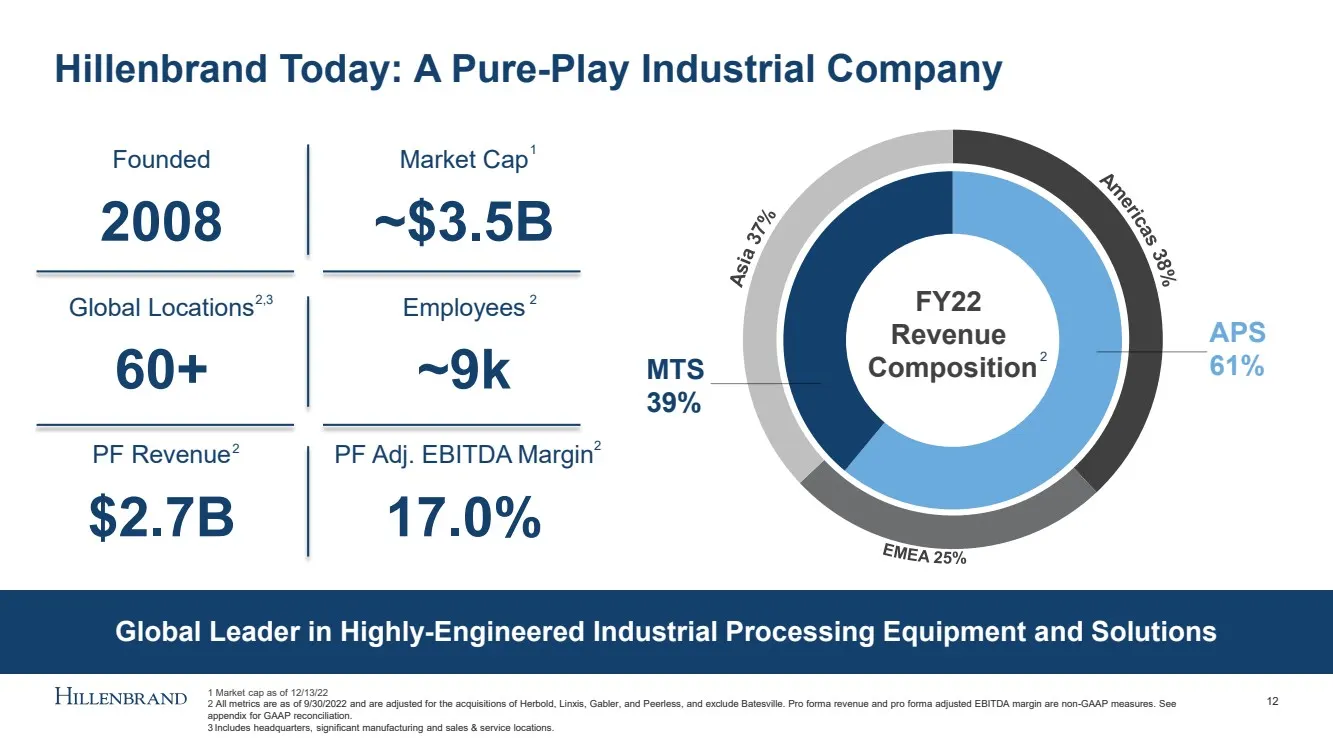
Slide 12: Hillenbrand Today: A Pure-Play Industrial Company
40 % FY22 Revenue Composition Hillenbrand Today: A Pure - Play Industrial Company 12 Founded 2008 Market Cap ~$3.5B Global Locations 60+ Employees ~9k PF Revenue $2.7B PF Adj. EBITDA Margin 17.0% MTS 39% APS 61% Global Leader in Highly - Engineered Industrial Processing Equipment and Solutions 1 Mar
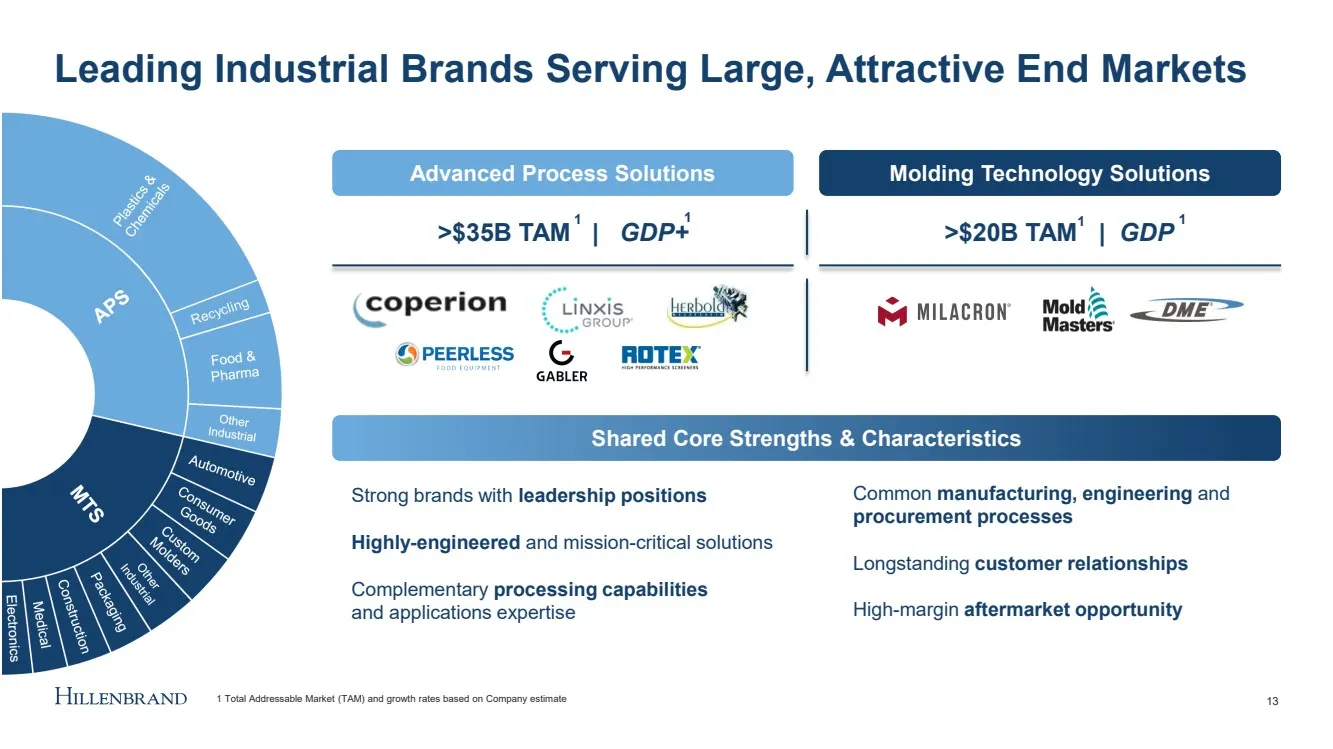
Slide 13: Serving Large, Attractive End Markets
>$35B TAM | GDP+ >$20B TAM | GDP Advanced Process Solutions Leading Industrial Brands Serving Large, Attractive End Markets 13 Molding Technology Solutions Shared Core Strengths & Characteristics 1 Total Addressable Market (TAM) and growth rates based on Company estimate 1 1 Common manufacturing, en
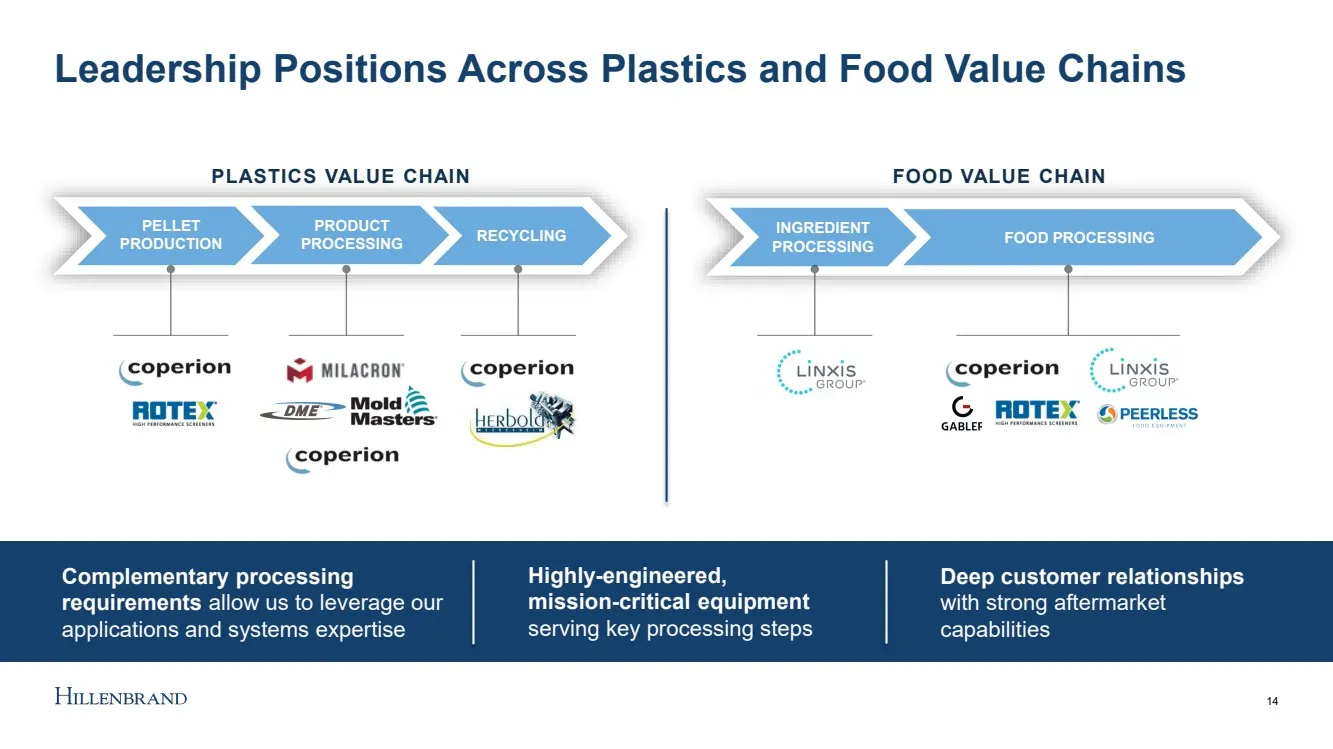
Slide 14: Leadership Positions Across Plastics and Food Value Chains
14 Leadership Positions Across Plastics and Food Value Chains Highly - engineered, mission - critical equipment serving key processing steps Deep customer relationships with strong aftermarket capabilities Complementary processing requirements allow us to leverage our applications and systems expert
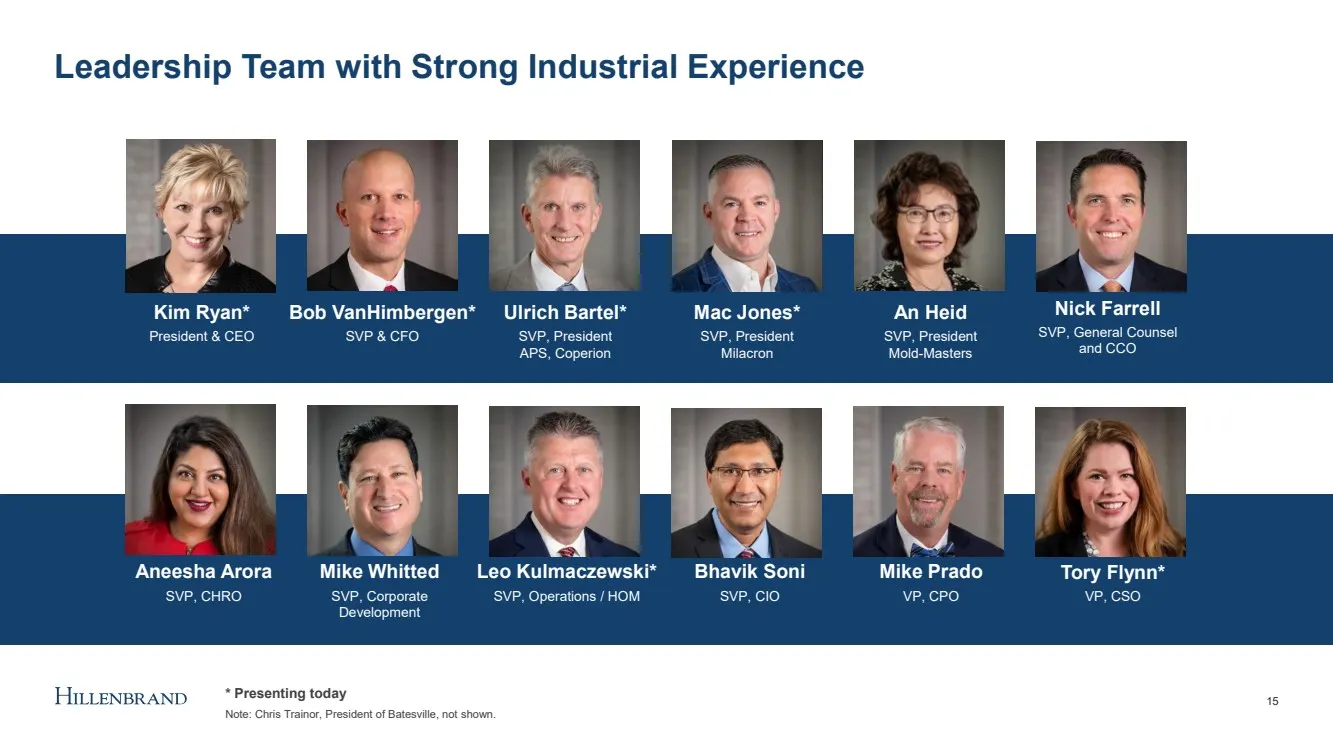
Slide 15: Leadership Team with Strong Industrial Experience
Leadership Team with Strong Industrial Experience 15 Kim Ryan* President & CEO Bob VanHimbergen* SVP & CFO Mike Whitted SVP, Corporate Development Bhavik Soni SVP, CIO Leo Kulmaczewski* SVP, Operations / HOM Ulrich Bartel* SVP, President APS, Coperion Mac Jones* SVP, President Milacron Aneesha Arora
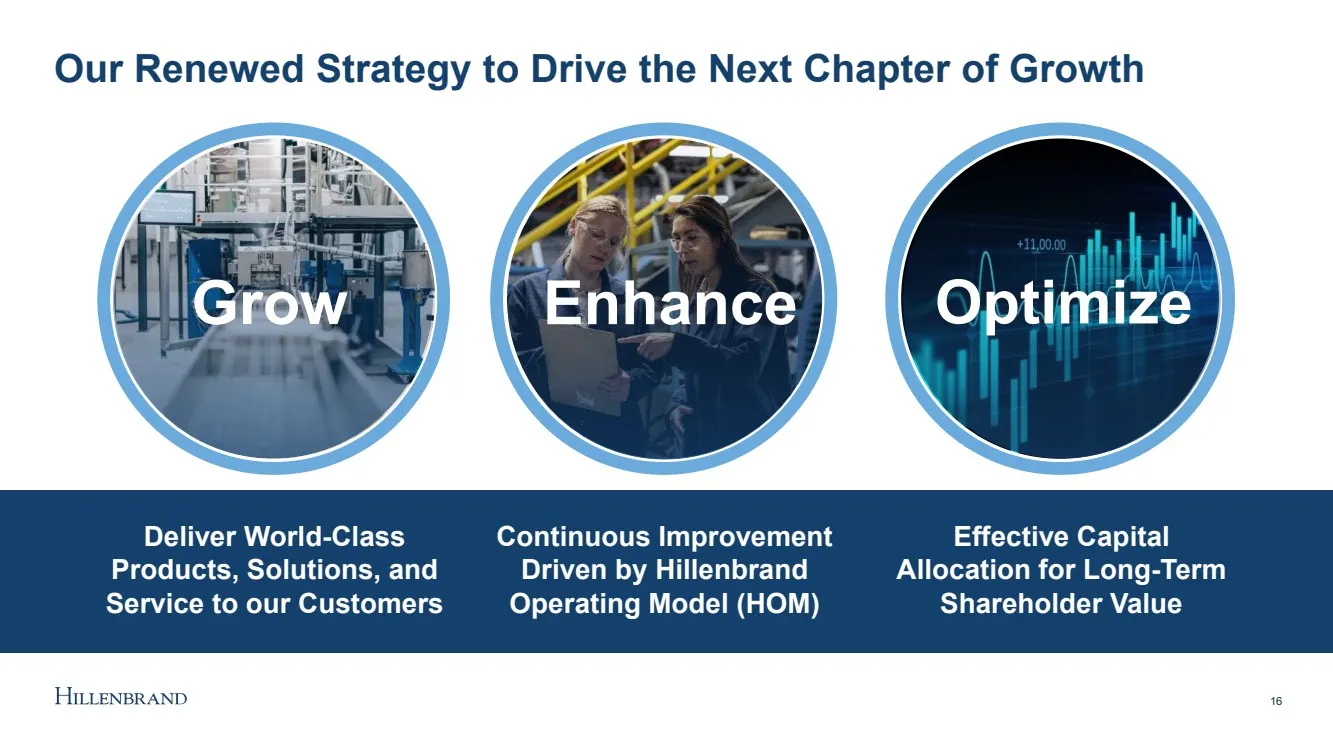
Slide 16: Our Renewed Strategy to Drive the Next Chapter of Growth
Our Renewed Strategy to Drive the Next Chapter of Growth Deliver World - Class Products, Solutions, and Service to our Customers Enhance Optimize Continuous Improvement Driven by Hillenbrand Operating Model (HOM) Effective Capital Allocation for Long - Term Shareholder Value 16 Grow
Slide 17: Our Renewed Strategy to Drive the Next Chapter of Growth
Our Renewed Strategy to Drive the Next Chapter of Growth Deliver World - Class Products, Solutions, and Service to our Customers Enhance Optimize 17 Grow
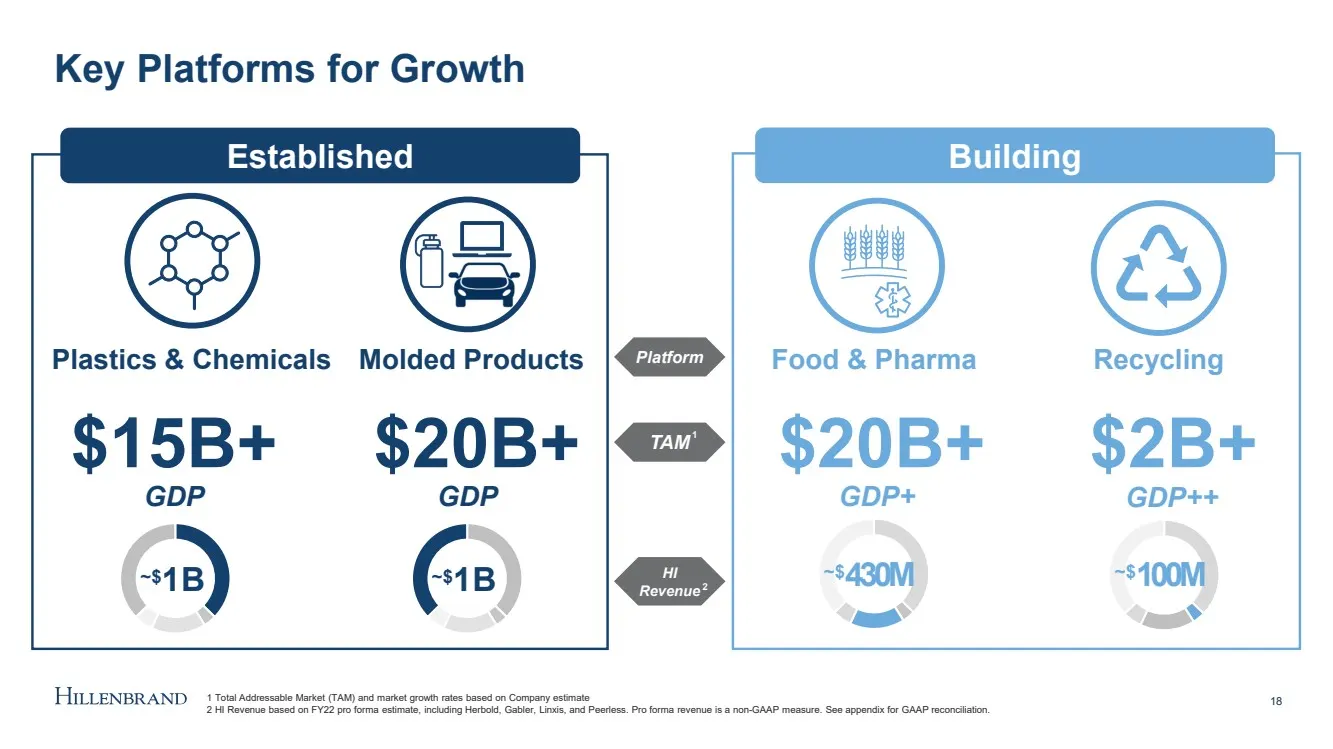
Slide 18: Key Platforms for Growth
Platform TAM HI Revenue Key Platforms for Growth 18 Established Building Food & Pharma Recycling Molded Products Plastics & Chemicals $15B+ $20B+ $20B+ $2B+ GDP GDP GDP+ GDP++ ~$ 1 B ~$ 1 B ~$ 430M ~$ 100M 1 2 1 Total Addressable Market (TAM) and market growth rates based on Company estimate 2 HI Re
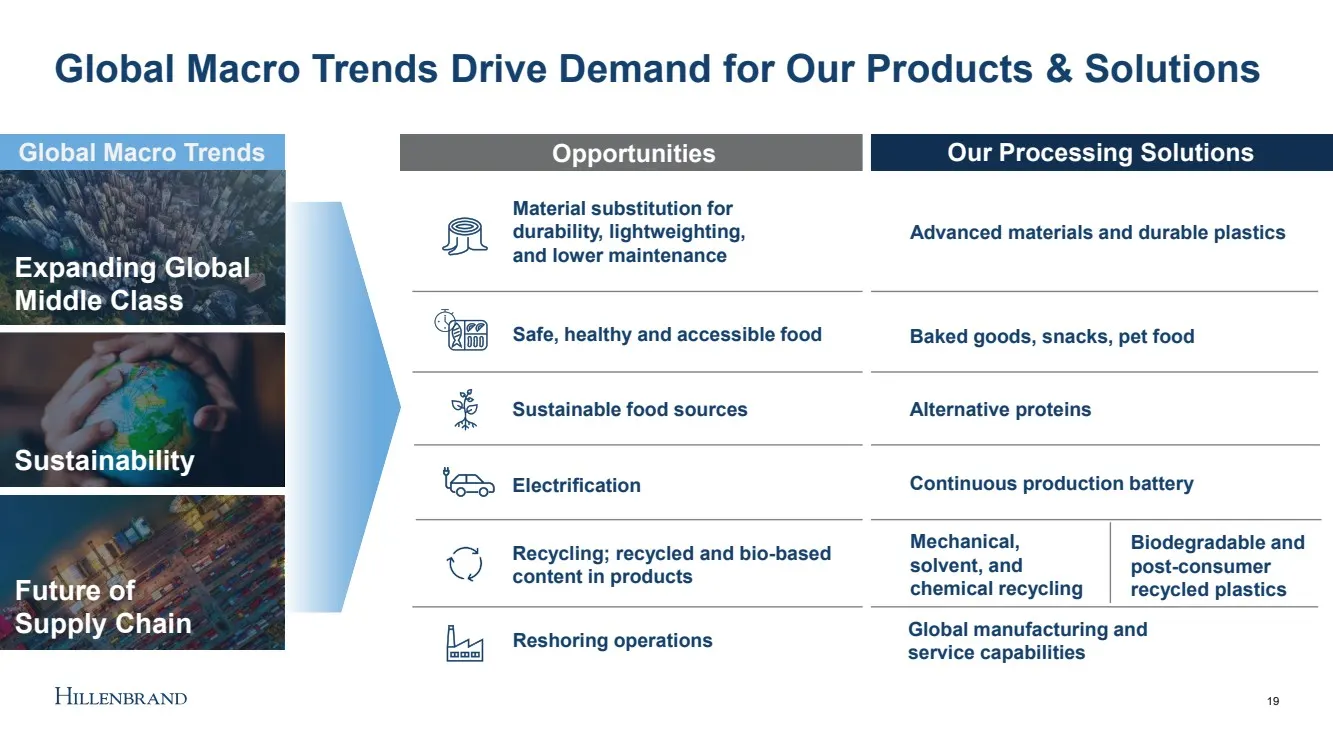
Slide 19: Global Macro Trends Drive Demand for Our Products & Solutions
Global Macro Trends Drive Demand for Our Products & Solutions 19 Global Macro Trends Expanding Global Middle Class 19 Sustainability Future of Supply Chain Advanced materials and durable plastics Material substitution for durability, lightweighting , and lower maintenance Opportunities Our Processin
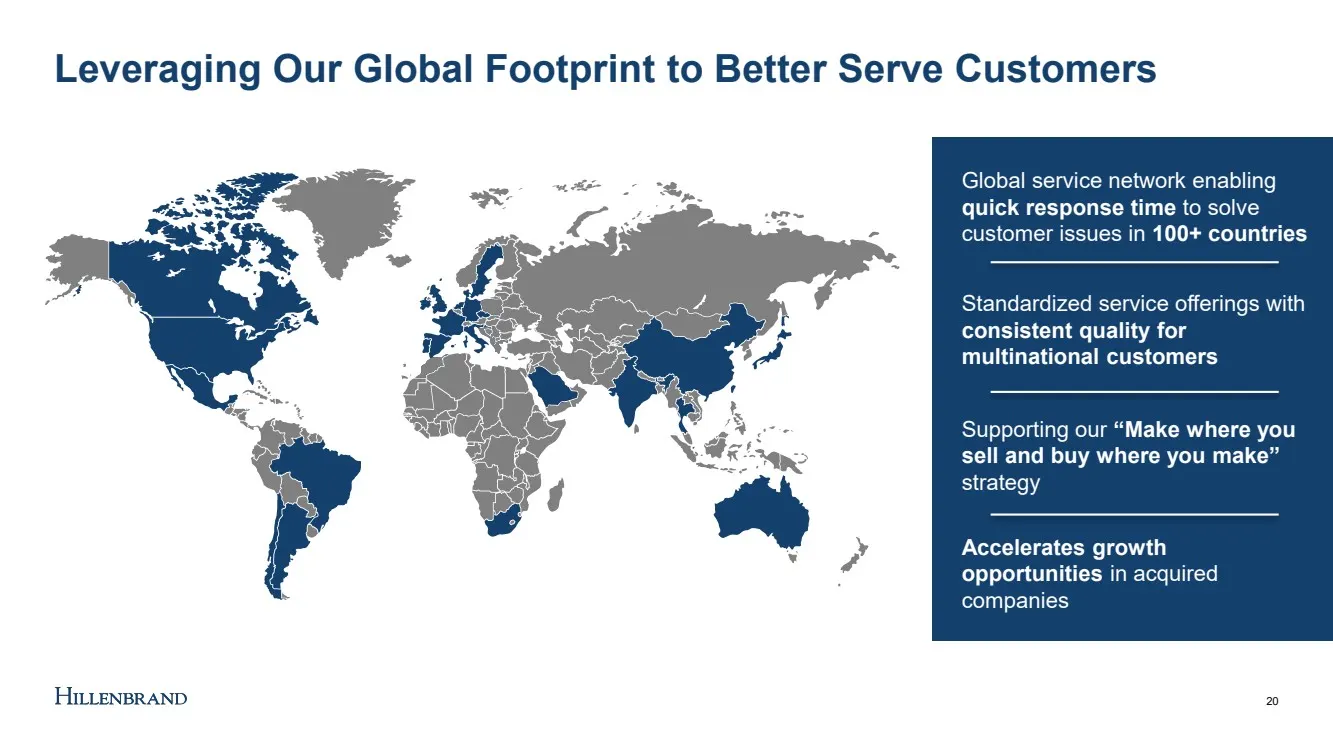
Slide 20: Leveraging Our Global Footprint to Better Serve Customers
Leveraging Our Global Footprint to Better Serve Customers 20 Global service network enabling quick response time to solve customer issues in 100+ countries Standardized service offerings with consistent quality for multinational customers Supporting our “Make where you sell and buy where you make” s
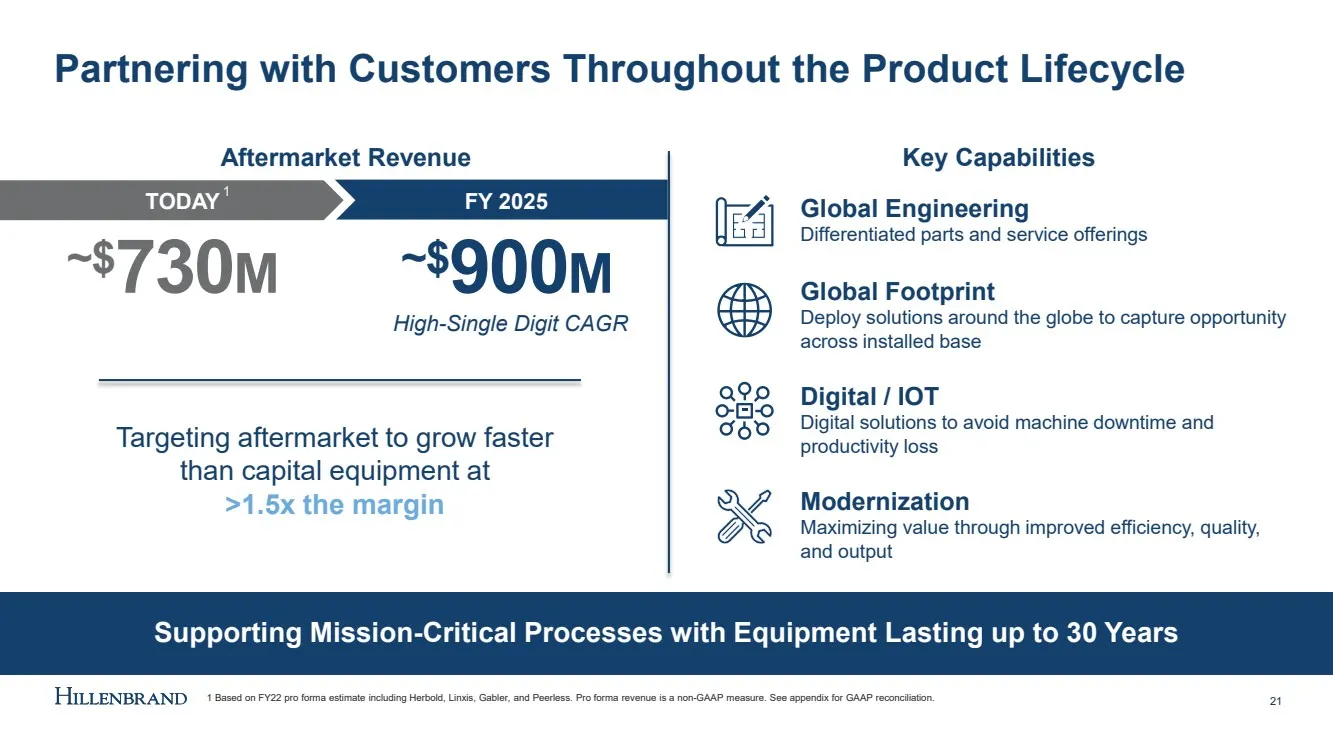
Slide 21: Supporting Mission-Critical Processes with Equipment Lasting up to 30 Years
Supporting Mission - Critical Processes with Equipment Lasting up to 30 Years Partnering with Customers Throughout the Product Lifecycle Key Capabilities Global Engineering Differentiated parts and service offerings Global Footprint Deploy solutions around the globe to capture opportunity across ins
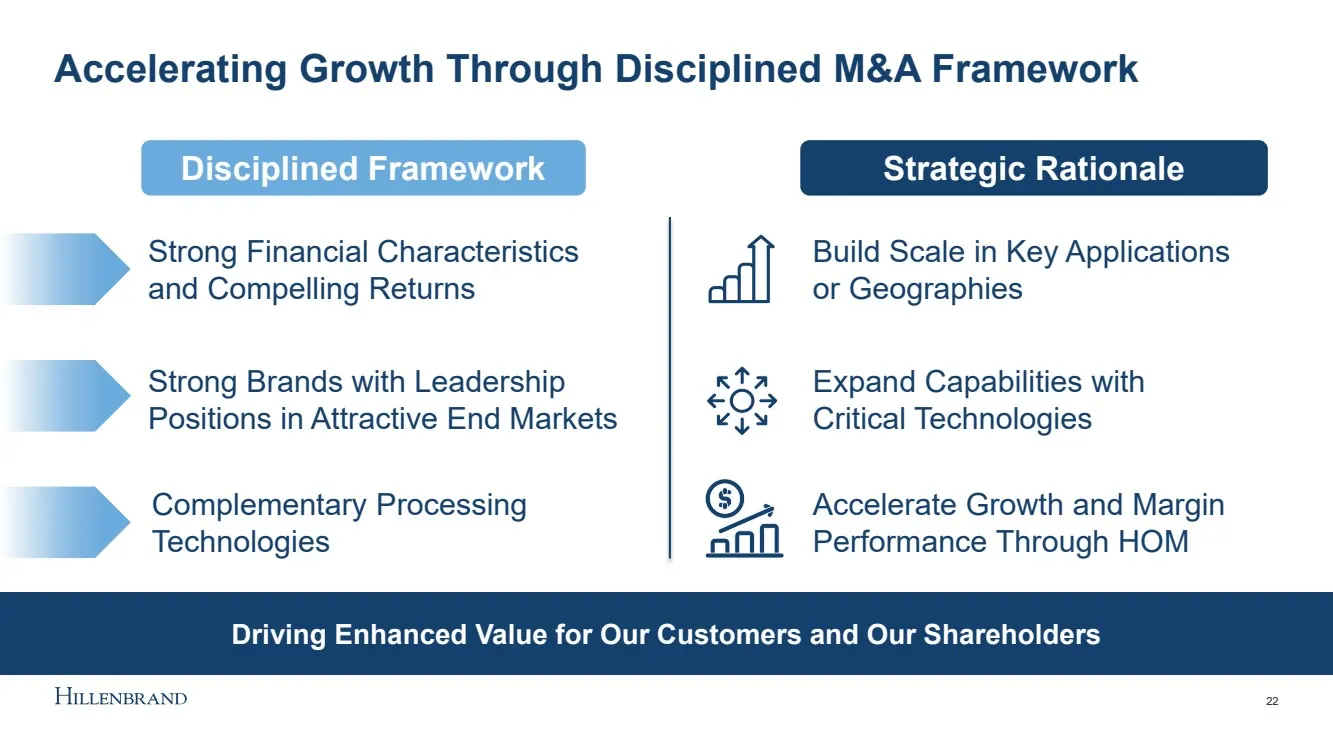
Slide 22: Accelerating Growth Through Disciplined M&A Framework
Accelerating Growth Through Disciplined M&A Framework Strong Financial Characteristics and Compelling Returns Strong Brands with Leadership Positions in Attractive End Markets Complementary Processing Technologies 22 Expand Capabilities with Critical Technologies Accelerate Growth and Margin Perform
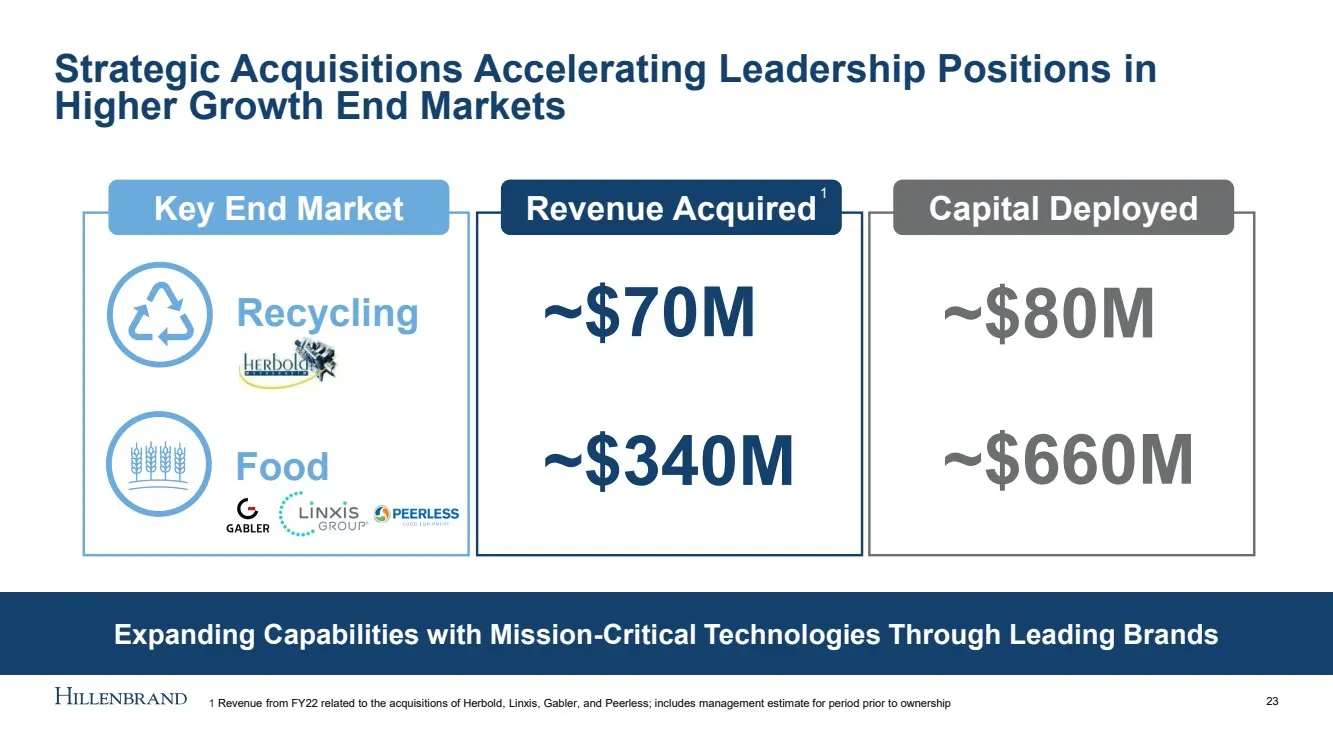
Slide 23: Expanding Capabilities with Mission-Critical Technologies Through Leading Brands
Expanding Capabilities with Mission - Critical Technologies Through Leading Brands Strategic Acquisitions Accelerating Leadership Positions in Higher Growth End Markets 23 Key End Market Revenue Acquired Capital Deployed ~$70M ~$340M ~$660M ~$80M Recycling Food 1 1 Revenue from FY22 related to the a
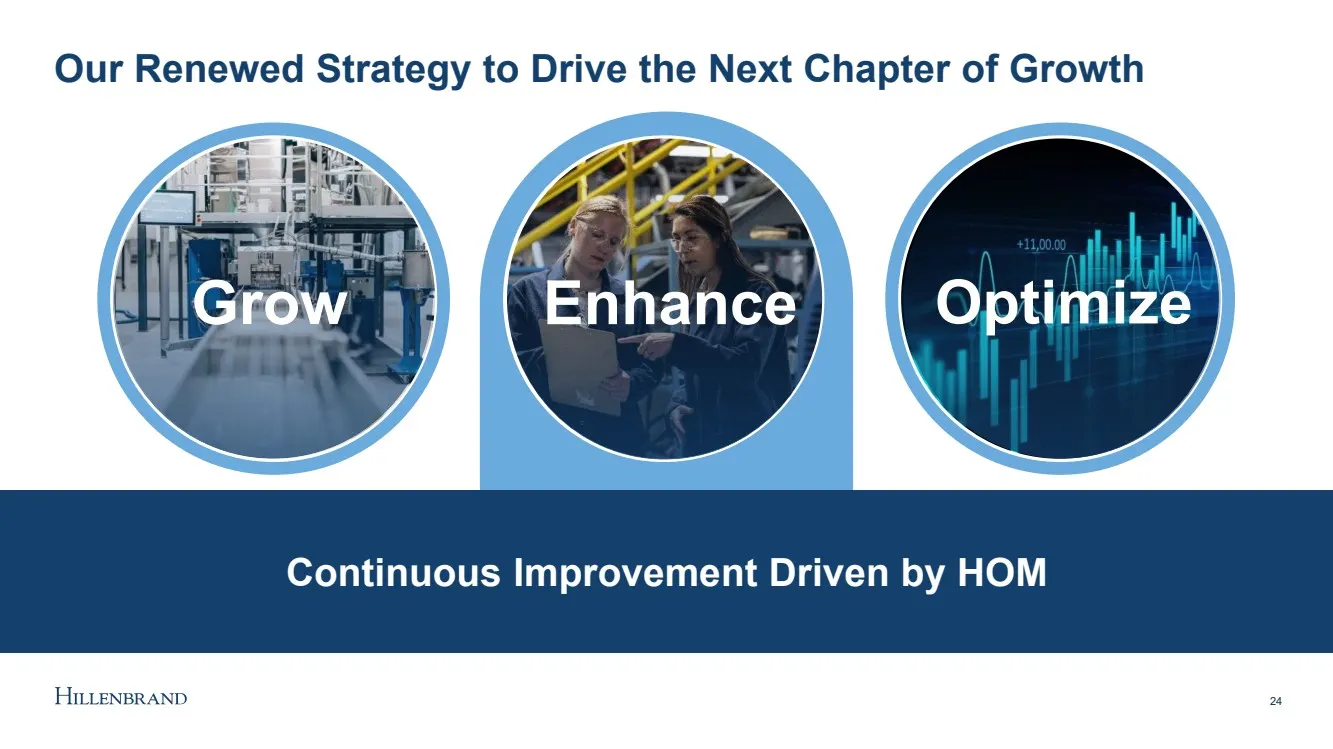
Slide 24: Our Renewed Strategy: Continuous Improvement Driven by HOM
Our Renewed Strategy to Drive the Next Chapter of Growth Continuous Improvement Driven by HOM Enhance Optimize 24 Grow
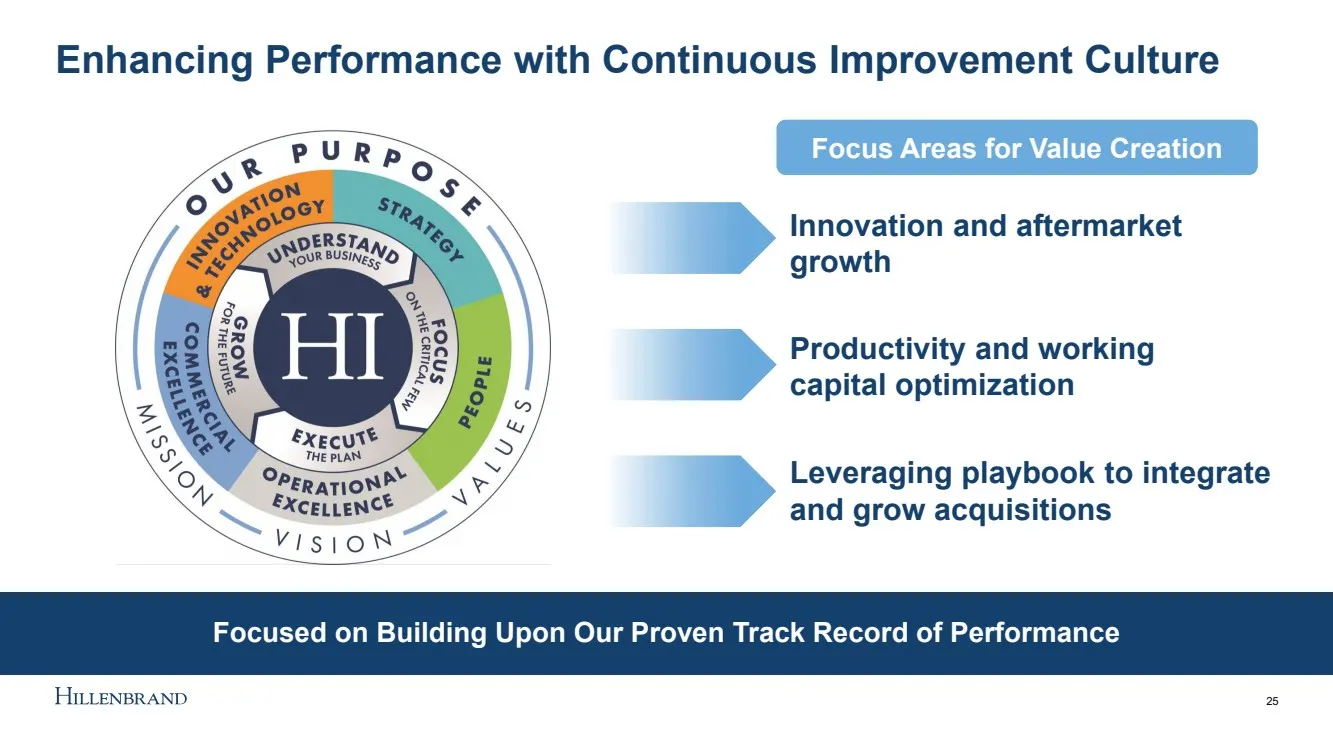
Slide 25: Focused on Building Upon Our Proven Track Record of Performance
Focused on Building Upon Our Proven Track Record of Performance Key Priorities Innovation and aftermarket growth Enhancing Performance with Continuous Improvement Culture 25 Productivity and working capital optimization Leveraging playbook to integrate and grow acquisitions Focus Areas for Value Cre
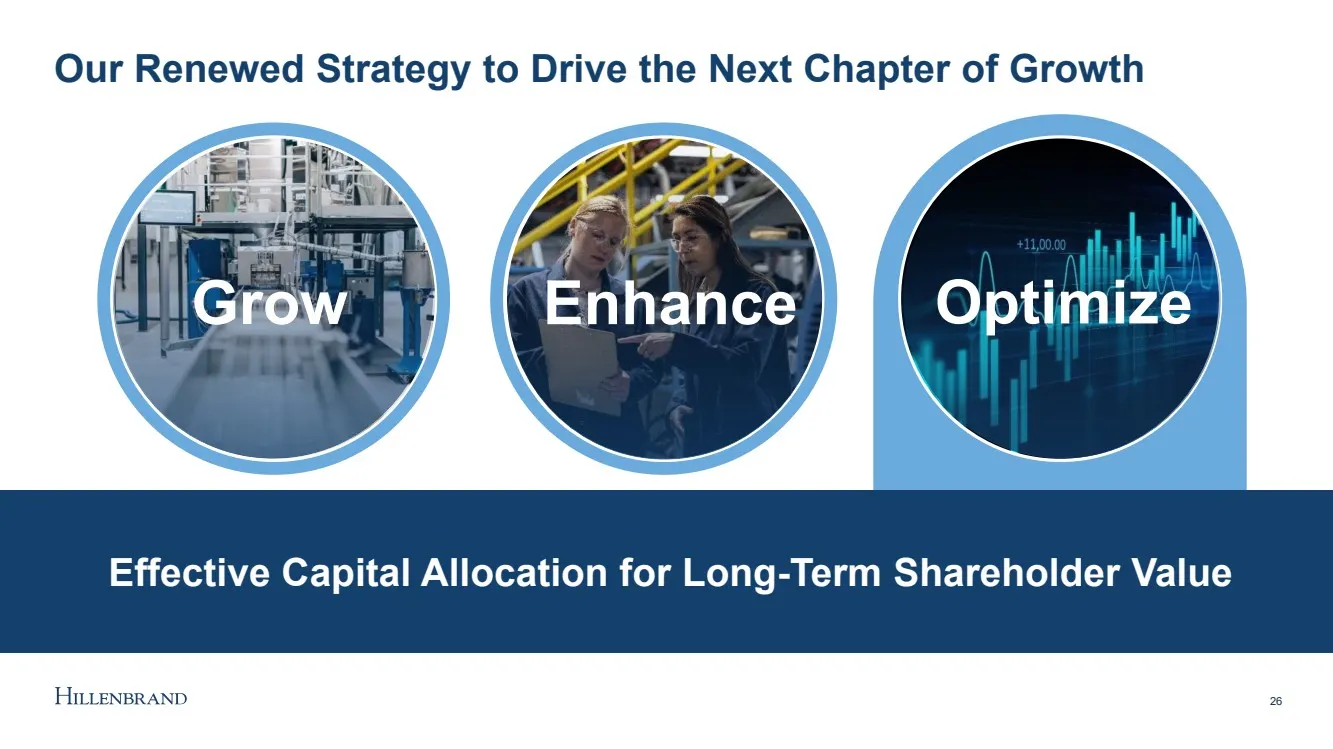
Slide 26: Our Renewed Strategy: Effective Capital Allocation
Our Renewed Strategy to Drive the Next Chapter of Growth Effective Capital Allocation for Long - Term Shareholder Value Enhance Optimize 26 Grow
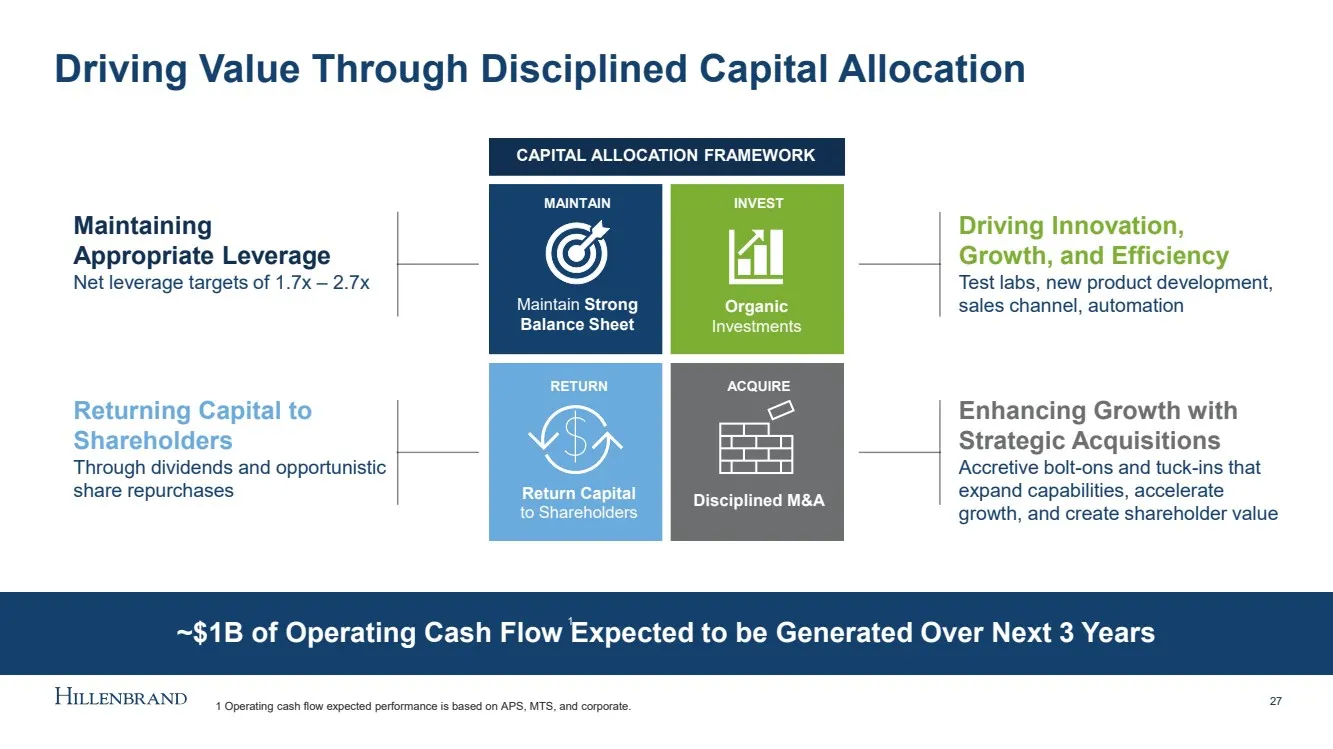
Slide 27: ~$1B of Operating Cash Flow Expected Over Next 3 Years
~$1B of Operating Cash Flow Expected to be Generated Over Next 3 Years Driving Value Through Disciplined Capital Allocation 27 Returning Capital to Shareholders Through dividends and opportunistic share repurchases Enhancing Growth with Strategic Acquisitions Accretive bolt - ons and tuck - ins that
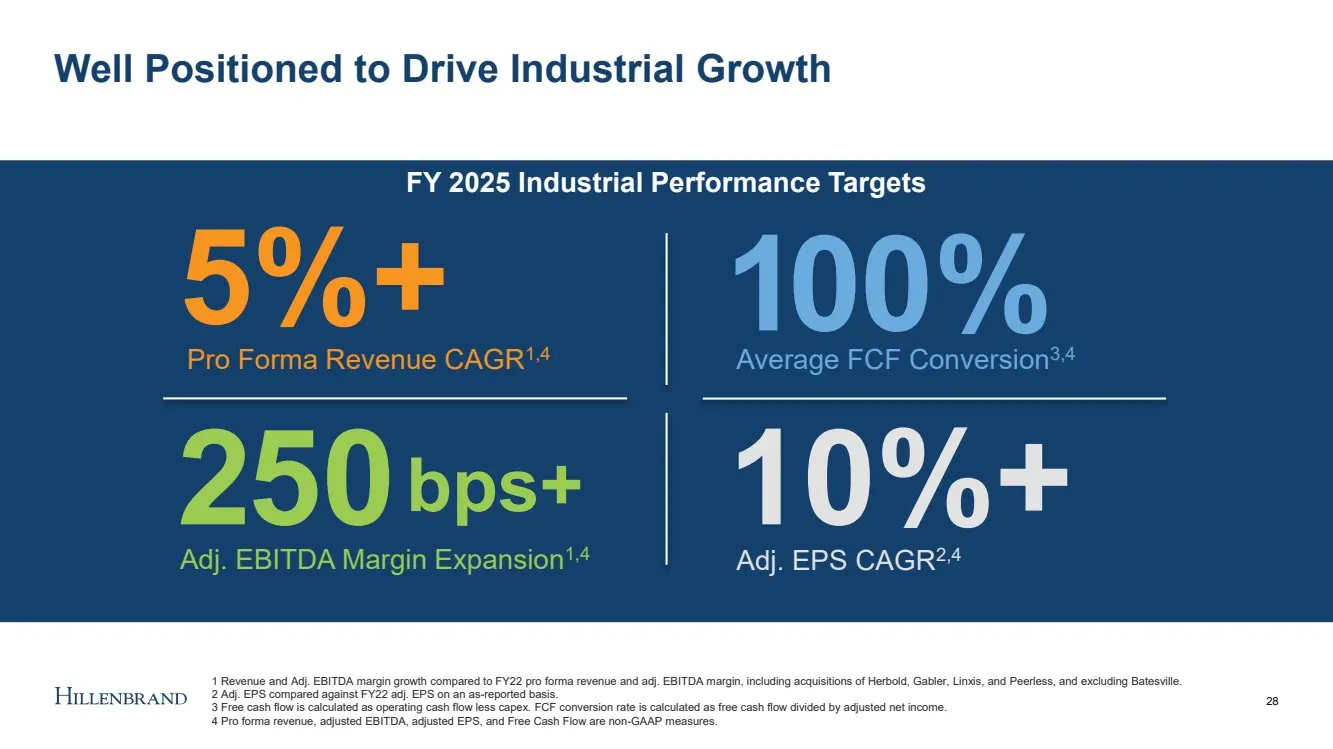
Slide 28: FY 2025 Industrial Performance Targets
FY 2025 Industrial Performance Targets Well Positioned to Drive Industrial Growth 28 5%+ Pro Forma Revenue CAGR 1,4 2 50 Adj. EBITDA Margin Expansion 1,4 bps+ Average FCF Conversion 3,4 1 0 0% 1 Revenue and Adj. EBITDA margin growth compared to FY22 pro forma revenue and adj. EBITDA margin, includin
Slide 29: Key Takeaways
Key Takeaways 29 Pure - play global industrial leader in highly - engineered, mission - critical processing solutions serving customers throughout the product lifecycle Well positioned for long - term growth in attractive end markets aligned with secular macro trends Proven track record of performan

Slide 30: Hillenbrand Operating Model
Hillenbrand Operating Model Leo Kulmaczewski – SVP, Operations & HOM 30
Slide 31: The Hillenbrand Operating Model Overview
The Hillenbrand Operating Model (HOM) is now embedded with our Purpose and has evolved to meet the needs of the future The HOM is a key differentiator in driving our track record of execution by providing a repeatable framework for continuous improvement The HOM enables our integration success and d
Slide 32: The Hillenbrand Operating Model is a Key Differentiator
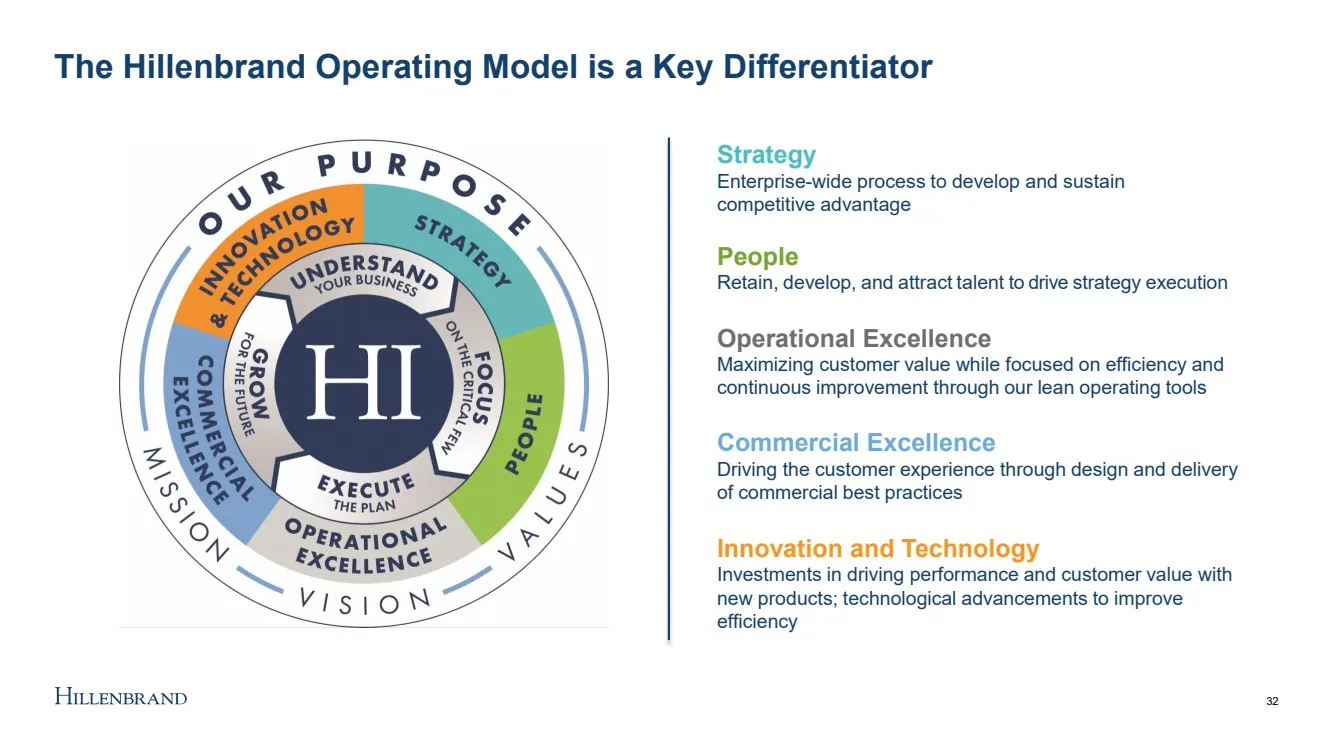
The Hillenbrand Operating Model is a Key Differentiator Strategy Enterprise - wide process to develop and sustain competitive advantage People Retain, develop, and attract talent to drive strategy execution Operational Excellence Maximizing customer value while focused on efficiency and continuous i
Slide 33: Deploying the HOM through a Repeatable Process
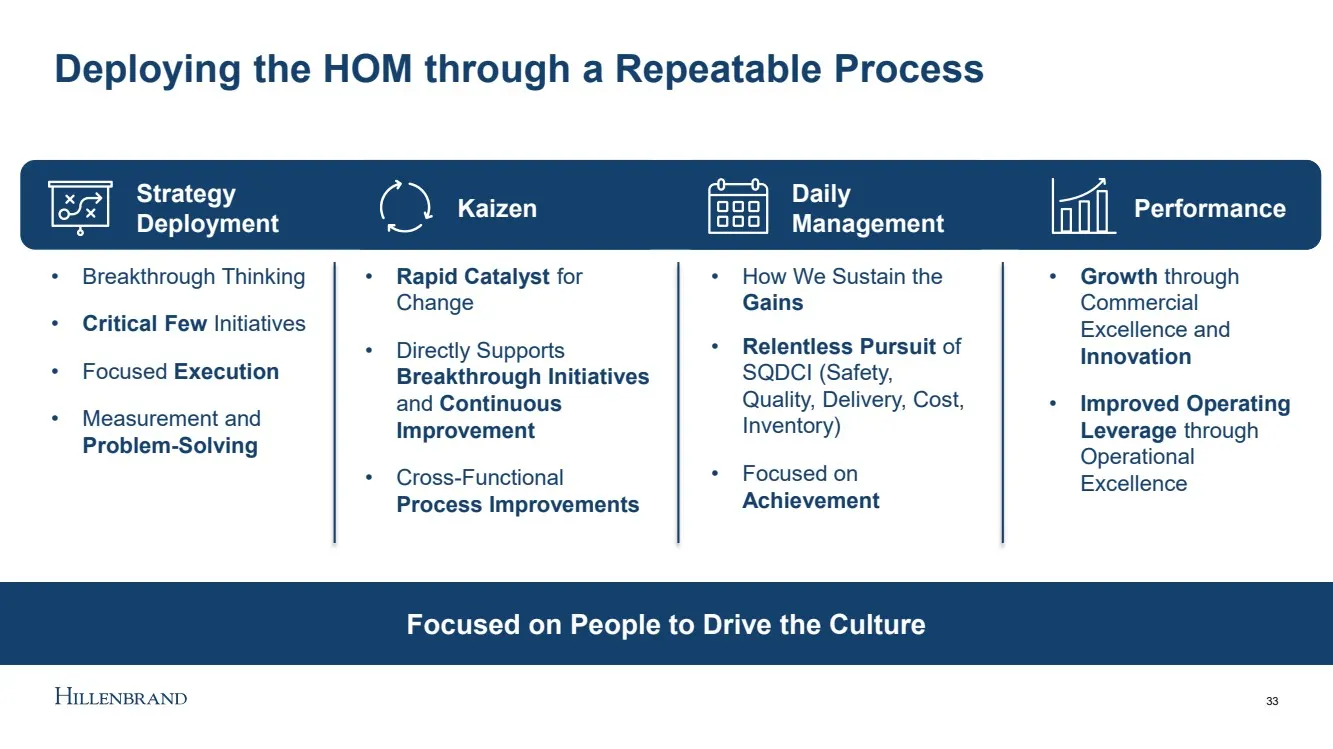
Deploying the HOM through a Repeatable Process 33 Strategy Deployment Kaizen Daily Management Performance • Breakthrough Thinking • Critical Few Initiatives • Focused Execution • Measurement and Problem - Solving • Rapid Catalyst for Change • Directly Supports Breakthrough Initiatives and Continuous
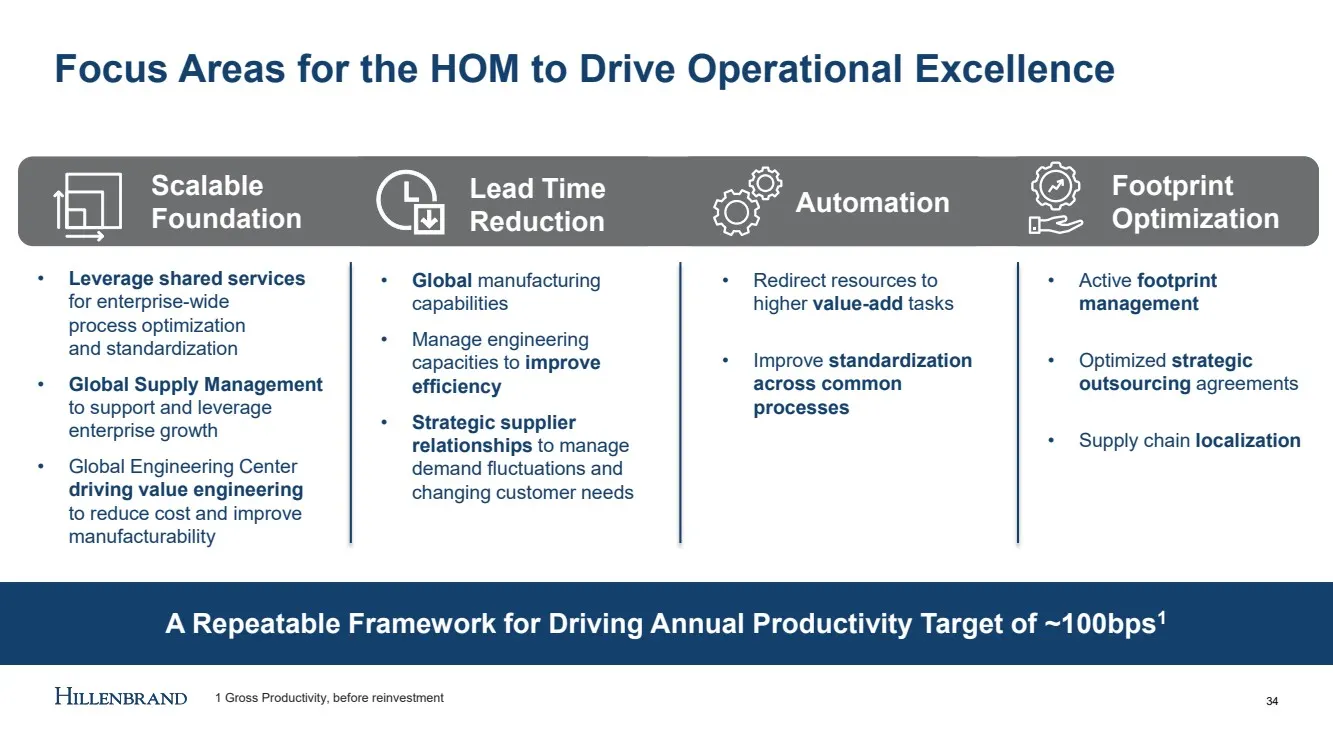
Slide 34: A Repeatable Framework for Driving Annual Productivity
A Repeatable Framework for Driving Annual Productivity Target of ~100bps 1 Focus Areas for the HOM to Drive Operational Excellence 34 • Leverage shared services for enterprise - wide process optimization and standardization • Global Supply Management to support and leverage enterprise growth • Globa
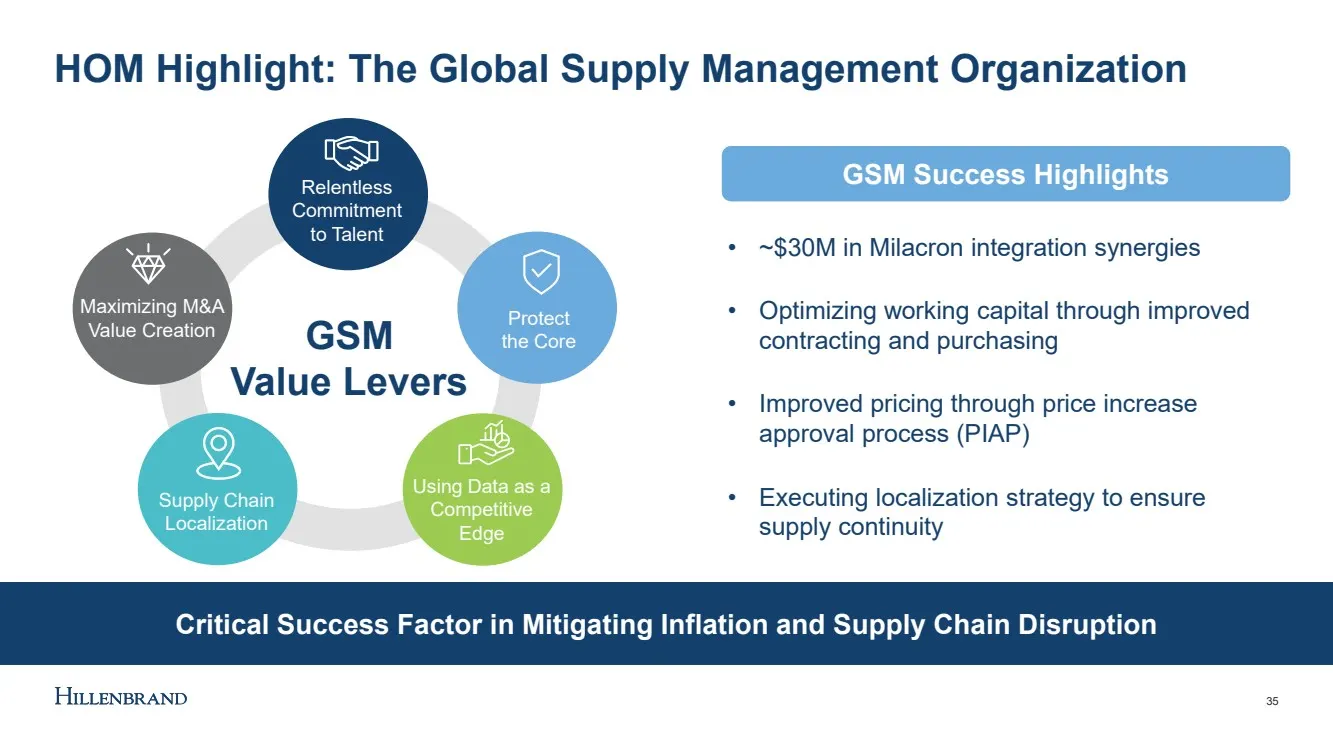
Slide 35: HOM Highlight: The Global Supply Management Organization
Critical Success Factor in Mitigating Inflation and Supply Chain Disruption HOM Highlight: The Global Supply Management Organization 35 • ~$30M in Milacron integration synergies • Optimizing working capital through improved contracting and purchasing • Improved pricing through price increase approva
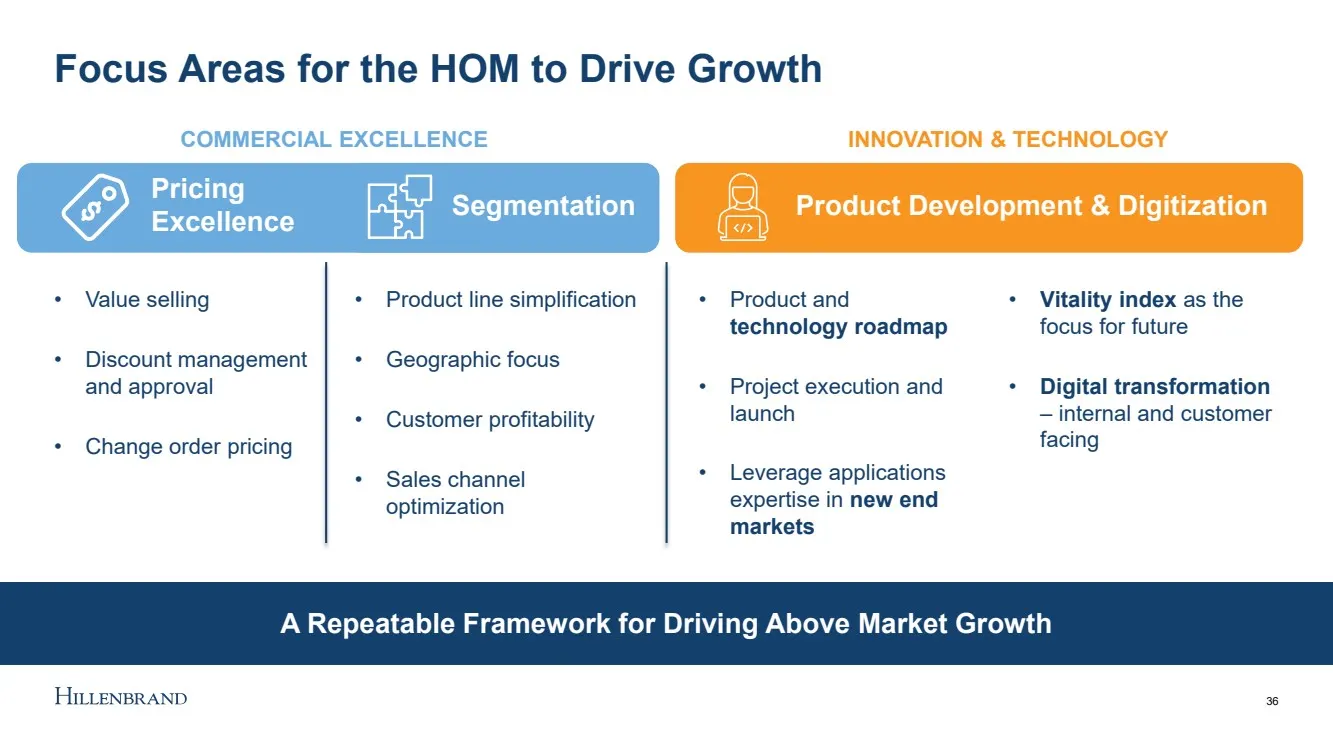
Slide 36: A Repeatable Framework for Driving Above Market Growth
A Repeatable Framework for Driving Above Market Growth Focus Areas for the HOM to Drive Growth 36 • Value selling • Discount management and approval • Change order pricing • Product line simplification • Geographic focus • Customer profitability • Sales channel optimization • Product and technology
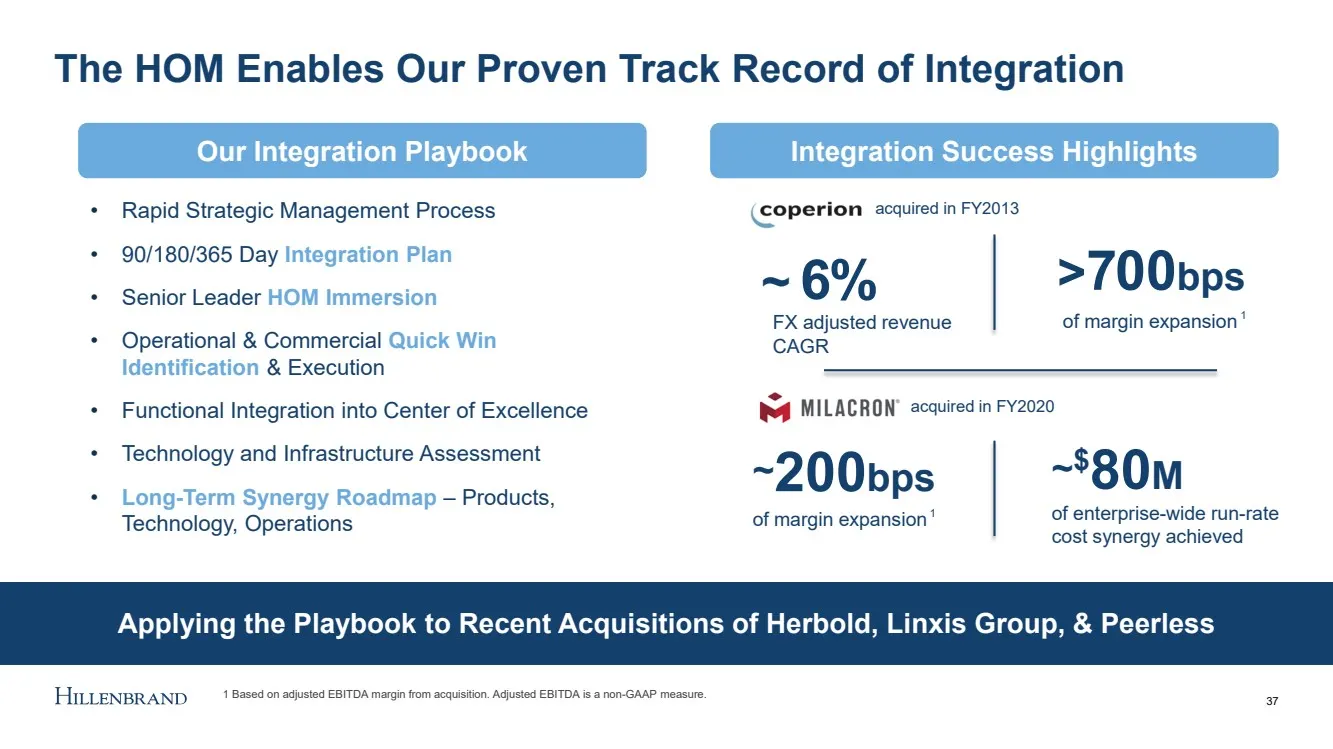
Slide 37: Applying the Playbook to Recent Acquisitions
Applying the Playbook to Recent Acquisitions of Herbold, Linxis Group, & Peerless The HOM Enables Our Proven Track Record of Integration 37 > 7 00 bps of margin expansion ~ $ 80 M of enterprise - wide run - rate cost synergy achieved ~ 200 bps of margin expansion ~ 6 % FX adjusted revenue CAGR • Rap
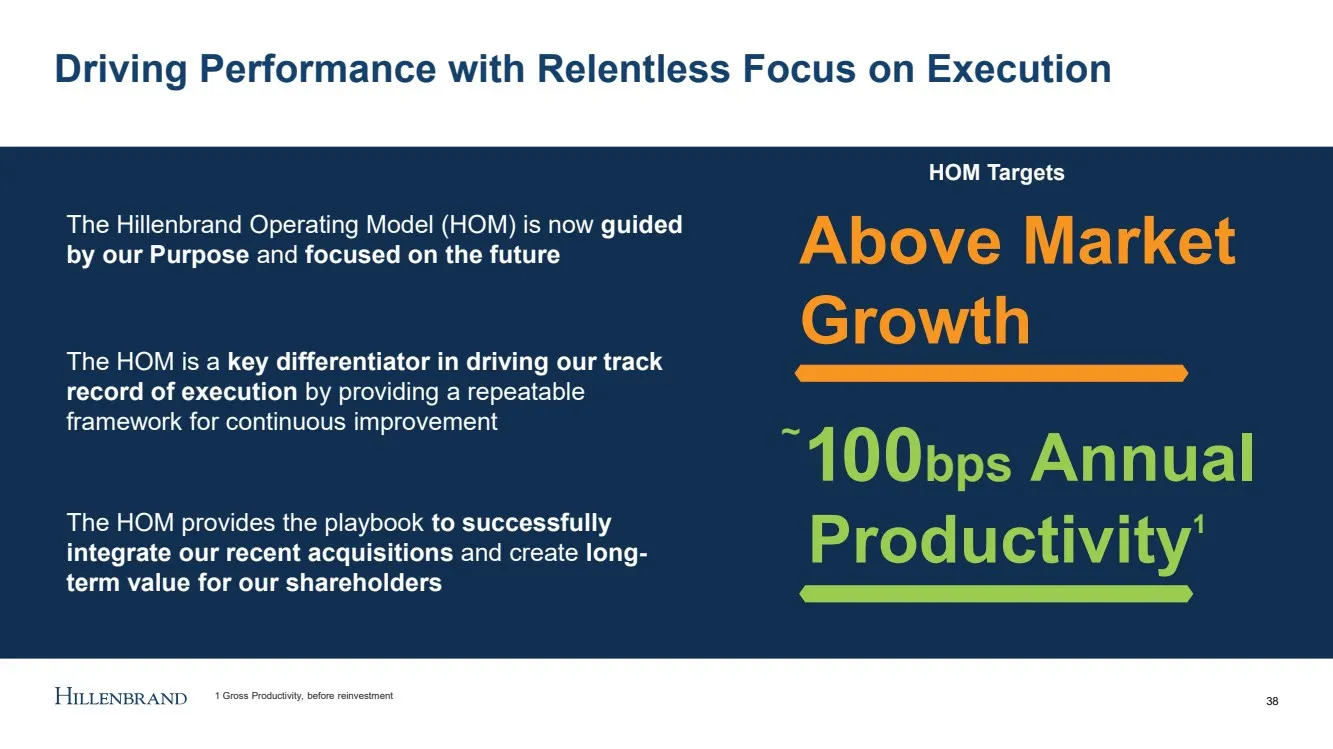
Slide 38: Driving Performance with Relentless Focus on Execution
Driving Performance with Relentless Focus on Execution 38 The Hillenbrand Operating Model (HOM) is now guided by our Purpose and focused on the future The HOM is a key differentiator in driving our track record of execution by providing a repeatable framework for continuous improvement The HOM provi

Slide 39: Advanced Process Solutions (APS)
Advanced Process Solutions (APS) Ulrich Bartel – SVP & President, APS 39
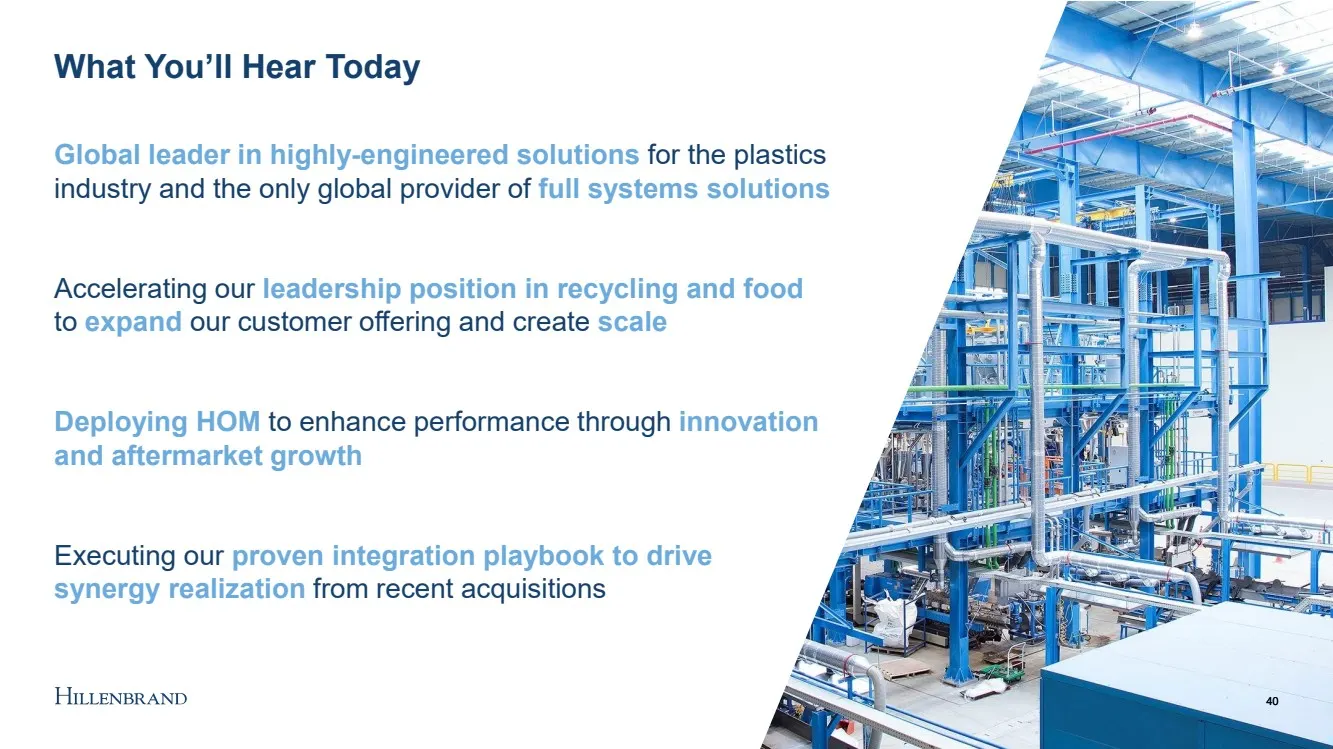
Slide 40: APS: What You'll Hear Today
40 40 Global leader in highly - engineered solutions for the plastics industry and the only global provider of full systems solutions Accelerating our leadership position in recycling and food to expand our customer offering and create scale Deploying HOM to enhance performance through innovation an
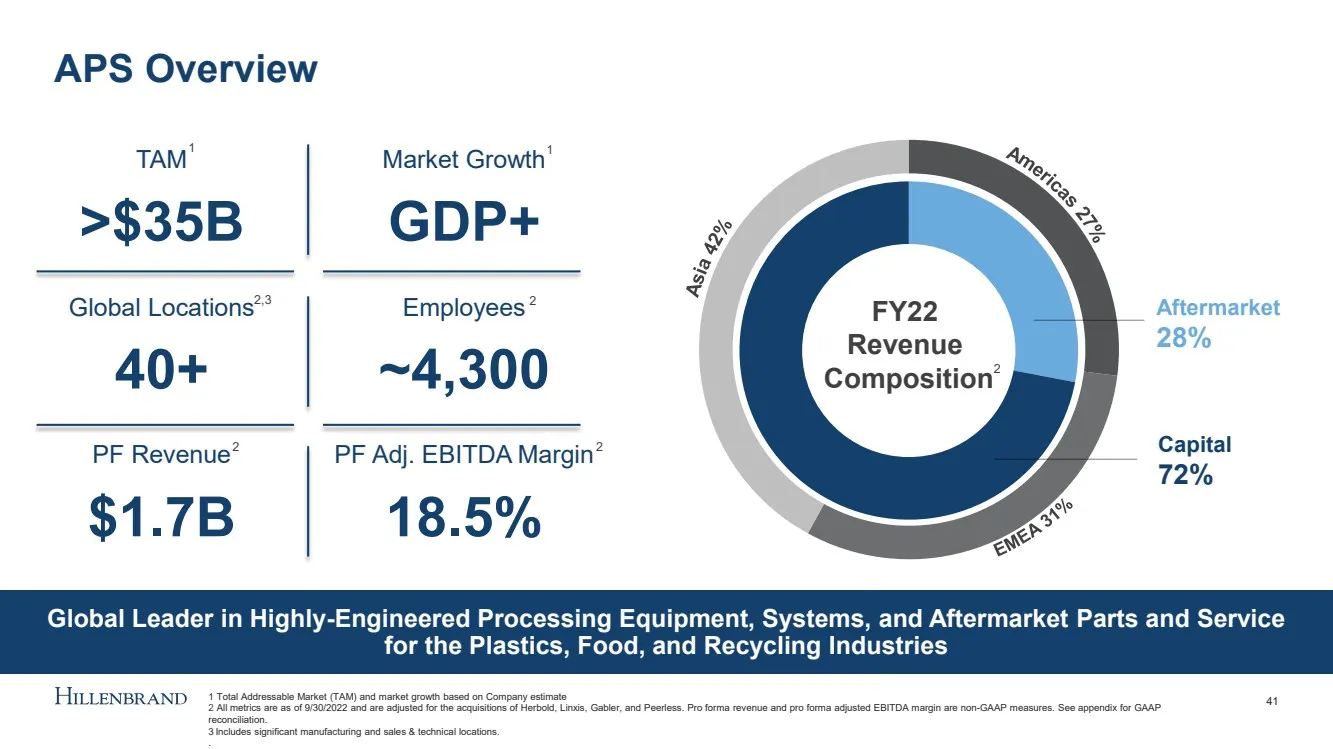
Slide 41: APS Overview
APS Overview 41 TAM >$35B Market Growth GDP+ Global Locations 40+ Employees ~4,300 PF Revenue $1.7B PF Adj. EBITDA Margin 18.5% Global Leader in Highly - Engineered Processing Equipment, Systems, and Aftermarket Parts and Service for the Plastics, Food, and Recycling Industries 40 % FY22 Revenue Com
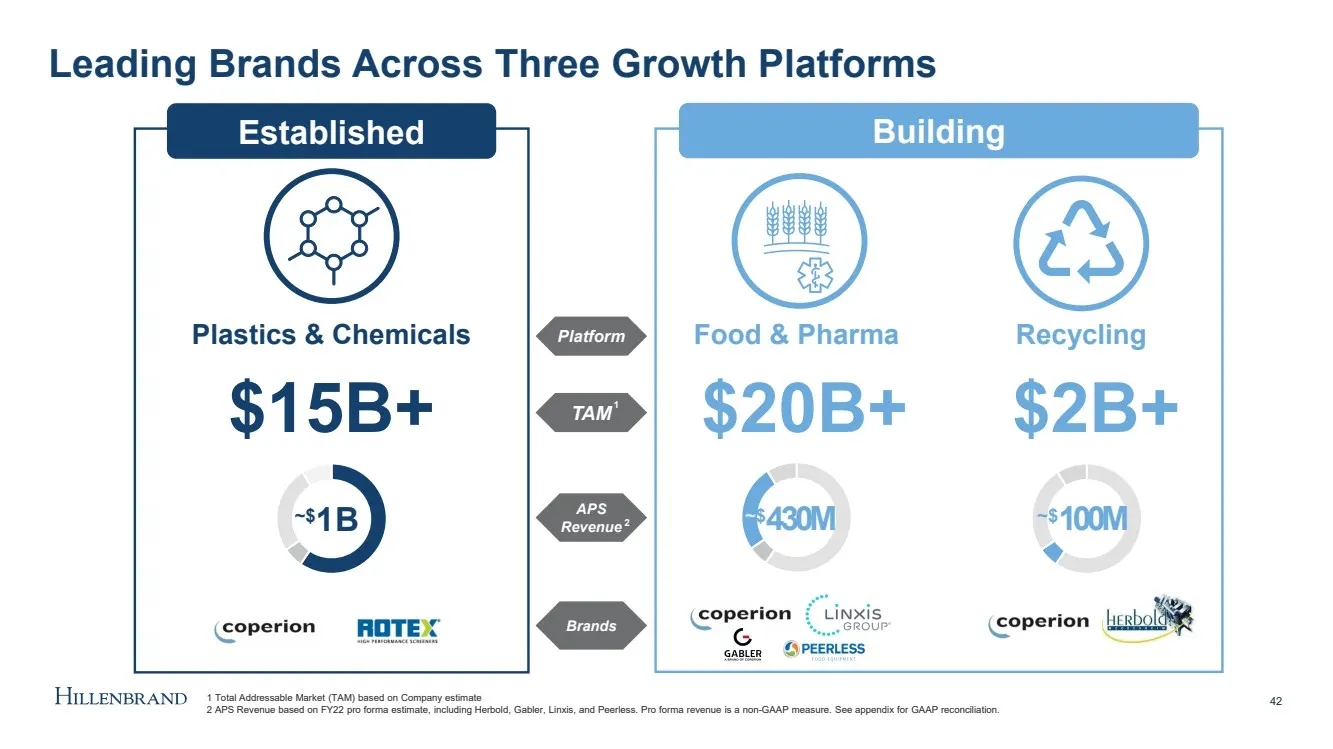
Slide 42: Leading Brands Across Three Growth Platforms
Leading Brands Across Three Growth Platforms 42 Established Building Food & Pharma Recycling Plastics & Chemicals $15B+ $20B+ $2B+ ~$ 1 B ~ $ 430M ~$ 100M Platform TAM APS Revenue 1 2 1 Total Addressable Market (TAM) based on Company estimate 2 APS Revenue based on FY22 pro forma estimate, including
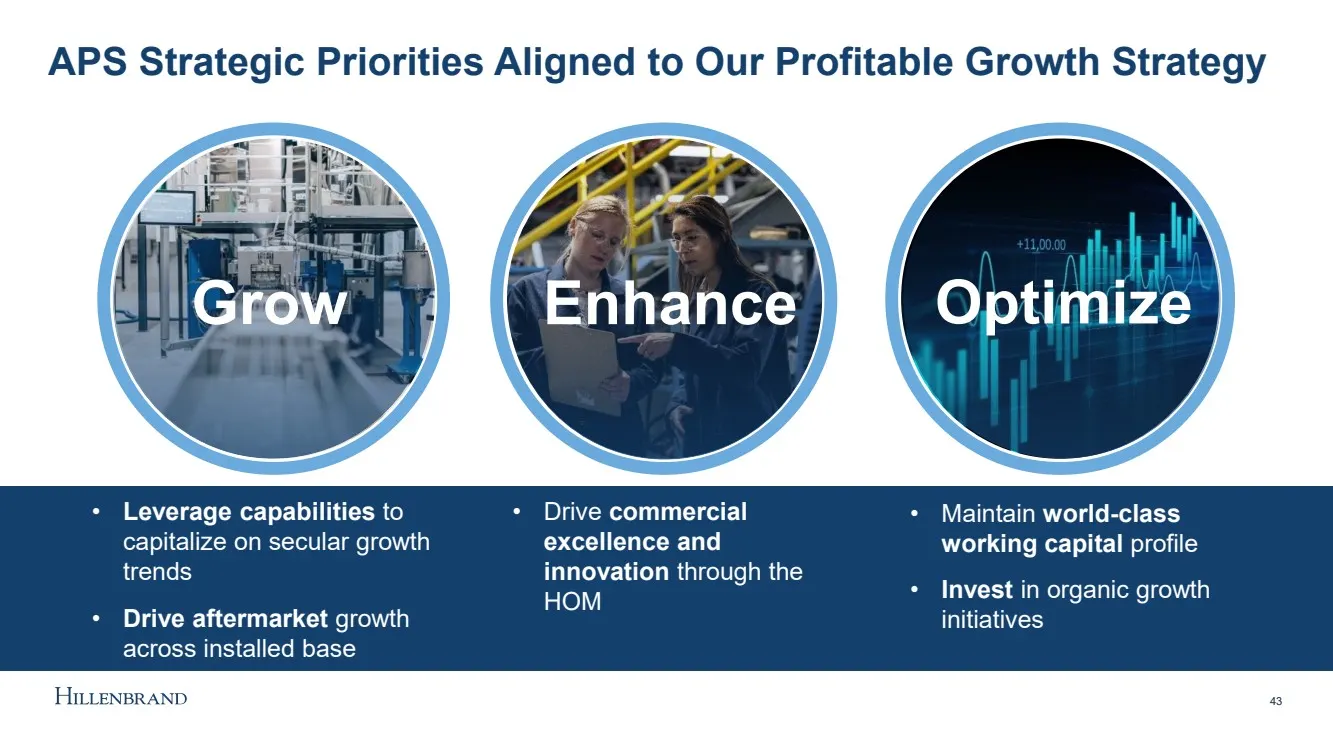
Slide 43: APS Strategic Priorities
APS Strategic Priorities Aligned to Our Profitable Growth Strategy Enhance Optimize 43 Grow • Leverage capabilities to capitalize on secular growth trends • Drive aftermarket growth across installed base • Drive commercial excellence and innovation through the HOM • Maintain world - class working ca
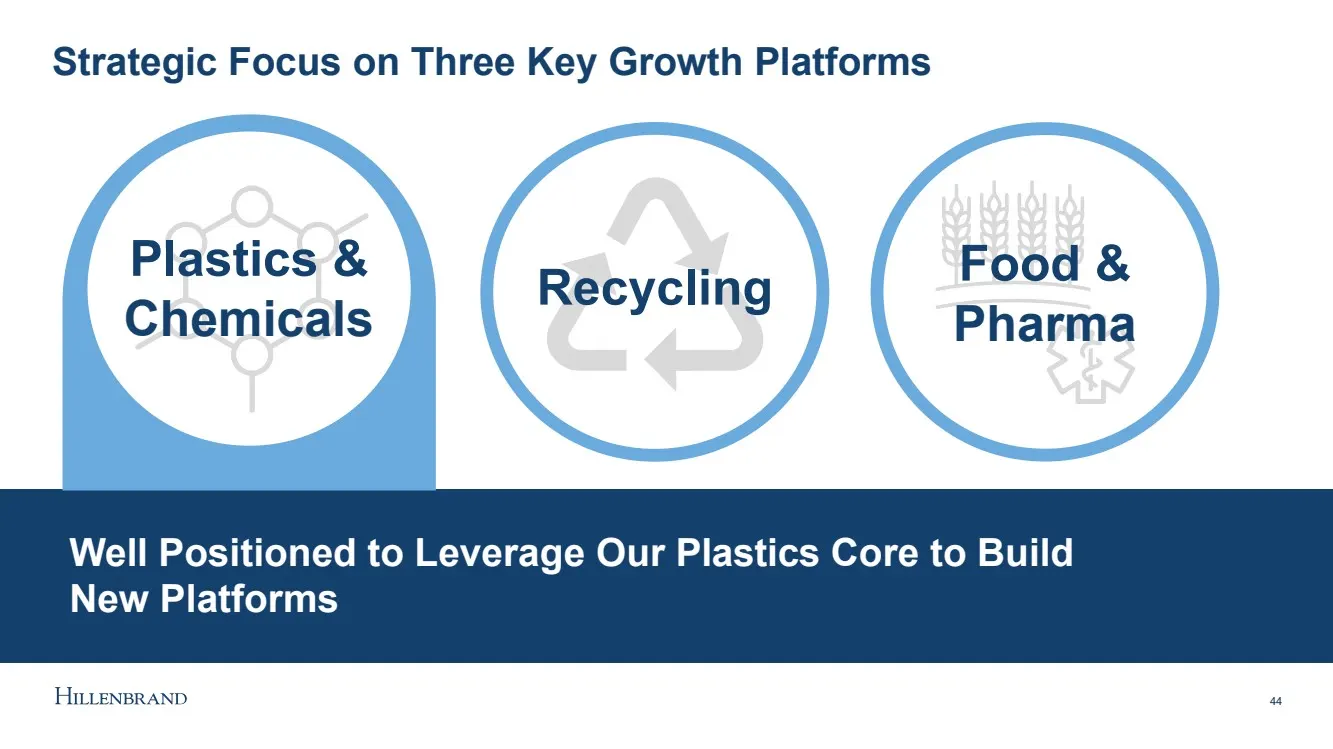
Slide 44: Strategic Focus on Three Key Growth Platforms
Strategic Focus on Three Key Growth Platforms 44 Plastics & Chemicals Well Positioned to Leverage Our Plastics Core to Build New Platforms Recycling Food & Pharma
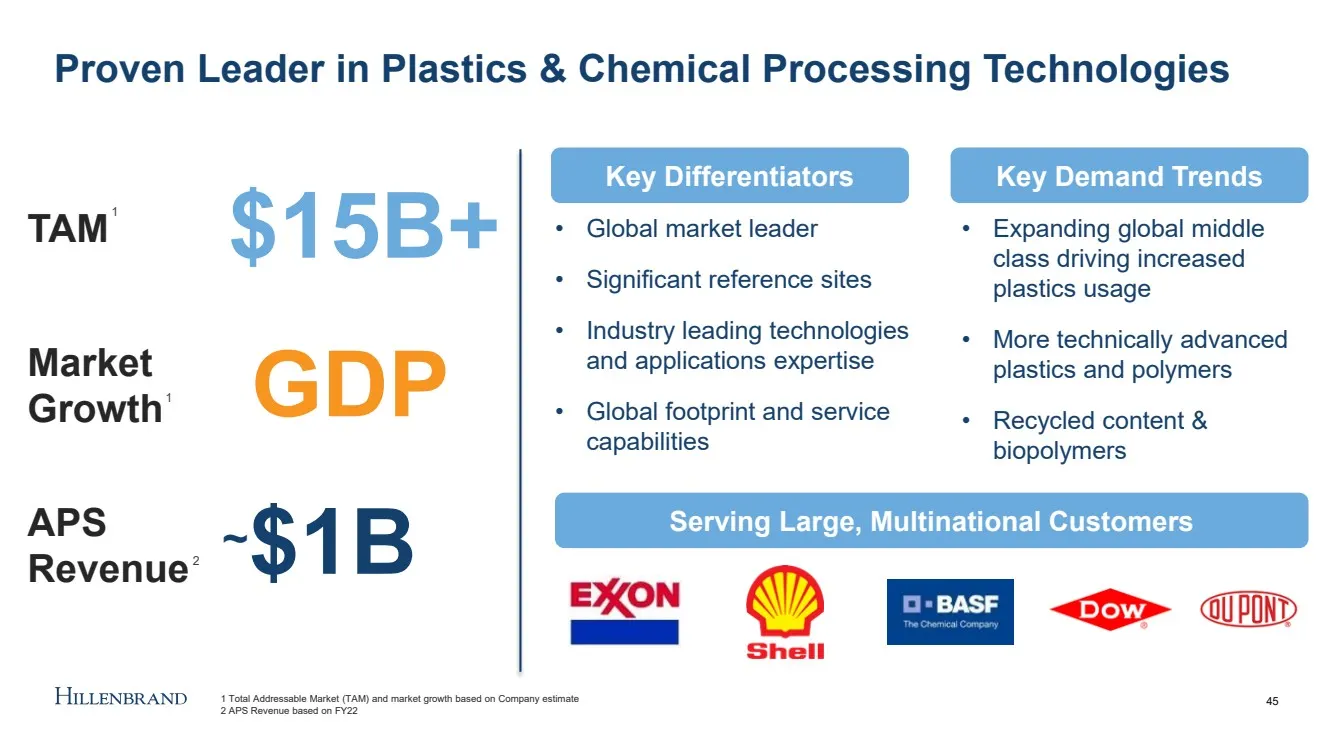
Slide 45: Proven Leader in Plastics & Chemical Processing Technologies
Proven Leader in Plastics & Chemical Processing Technologies 45 • Global market leader • Significant reference sites • Industry leading technologies and applications expertise • Global footprint and service capabilities TAM APS Revenue Market Growth $15B+ GDP ~ $1B • Expanding global middle class dr
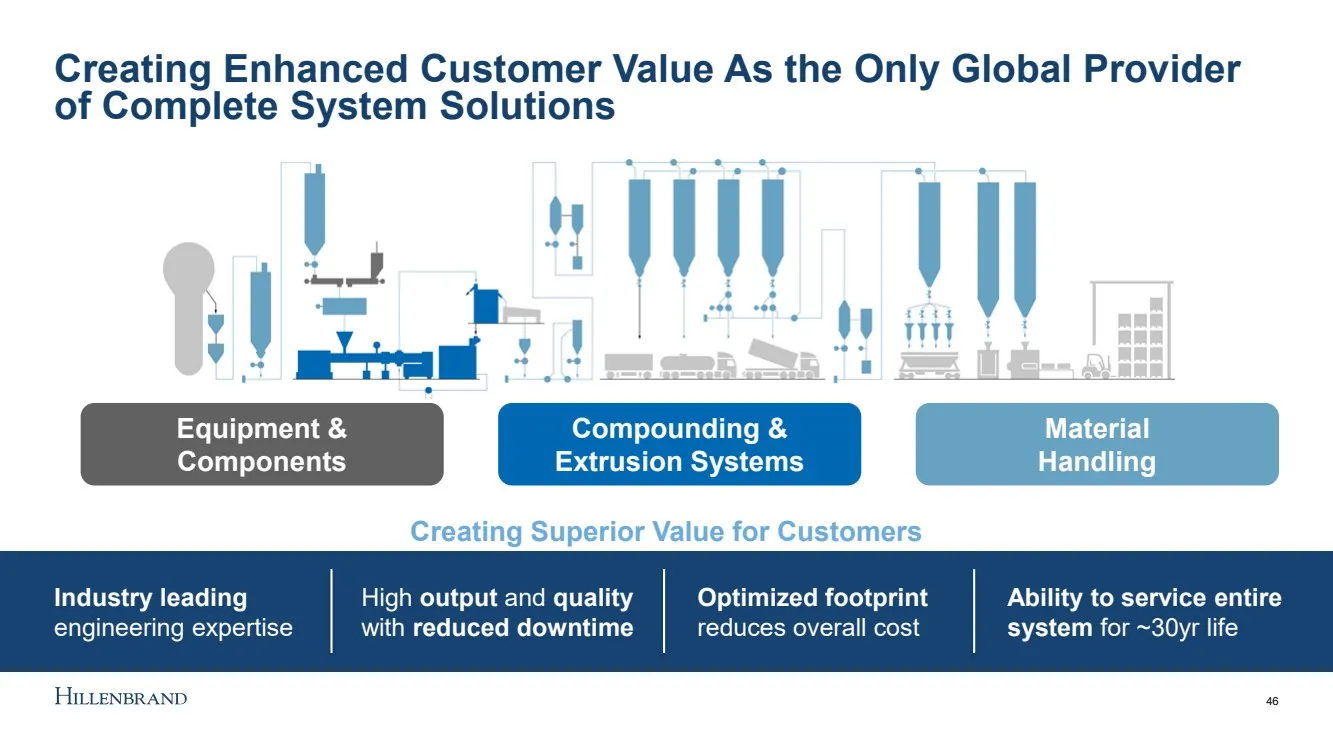
Slide 46: Creating Enhanced Customer Value as Only Global Provider of Complete System Solutions
Creating Enhanced Customer Value As the Only Global Provider of Complete System Solutions Creating Superior Value for Customers Industry leading engineering expertise High output and quality with reduced downtime Optimized footprint reduces overall cost Ability to service entire system for ~30yr lif
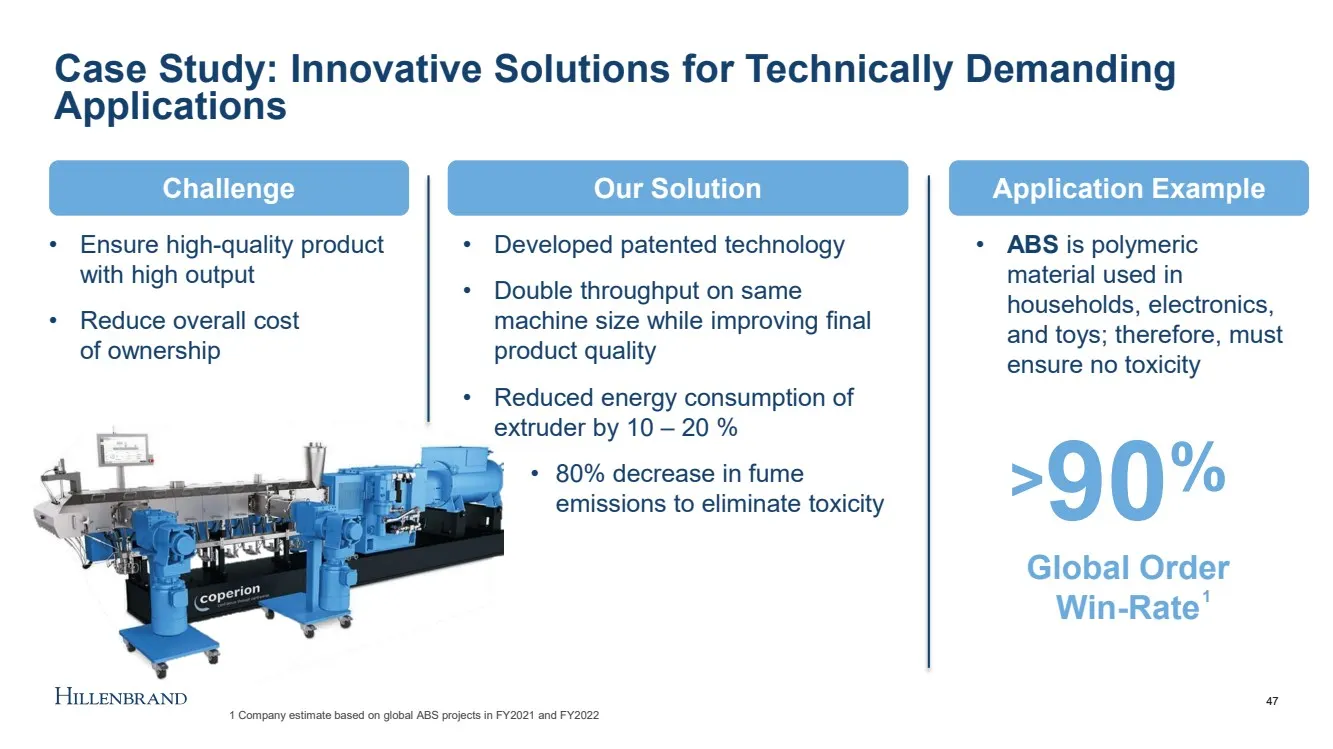
Slide 47: Case Study: Innovative Solutions for Technically Demanding Applications
Case Study: Innovative Solutions for Technically Demanding Applications 47 Global Order Win - Rate • Developed patented technology • Double throughput on same machine size while improving final product quality • Reduced energy consumption of extruder by 10 – 20 % • 80% decrease in fume emissions to
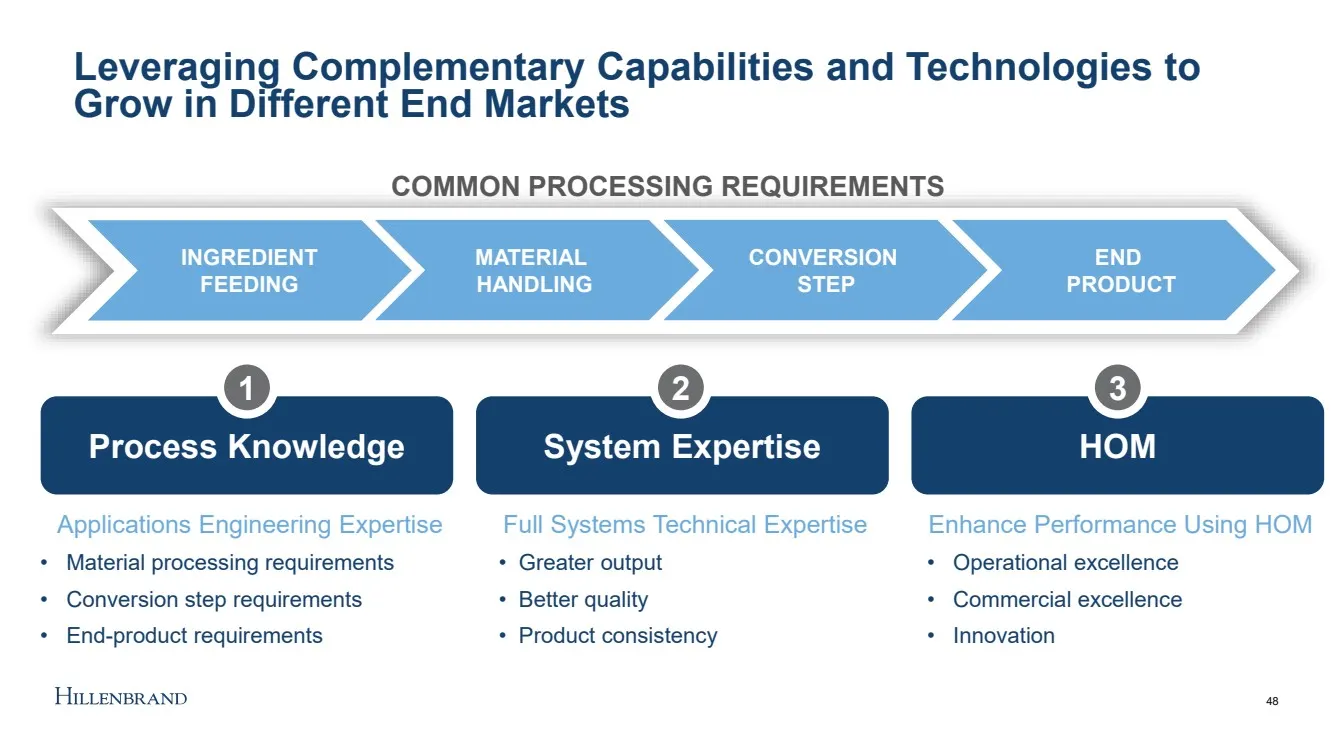
Slide 48: Leveraging Complementary Capabilities and Technologies
48 Leveraging Complementary Capabilities and Technologies to Grow in Different End Markets Applications Engineering Expertise • Material processing requirements • Conversion step requirements • End - product requirements Full Systems Technical Expertise • Greater output • Better quality • Product co
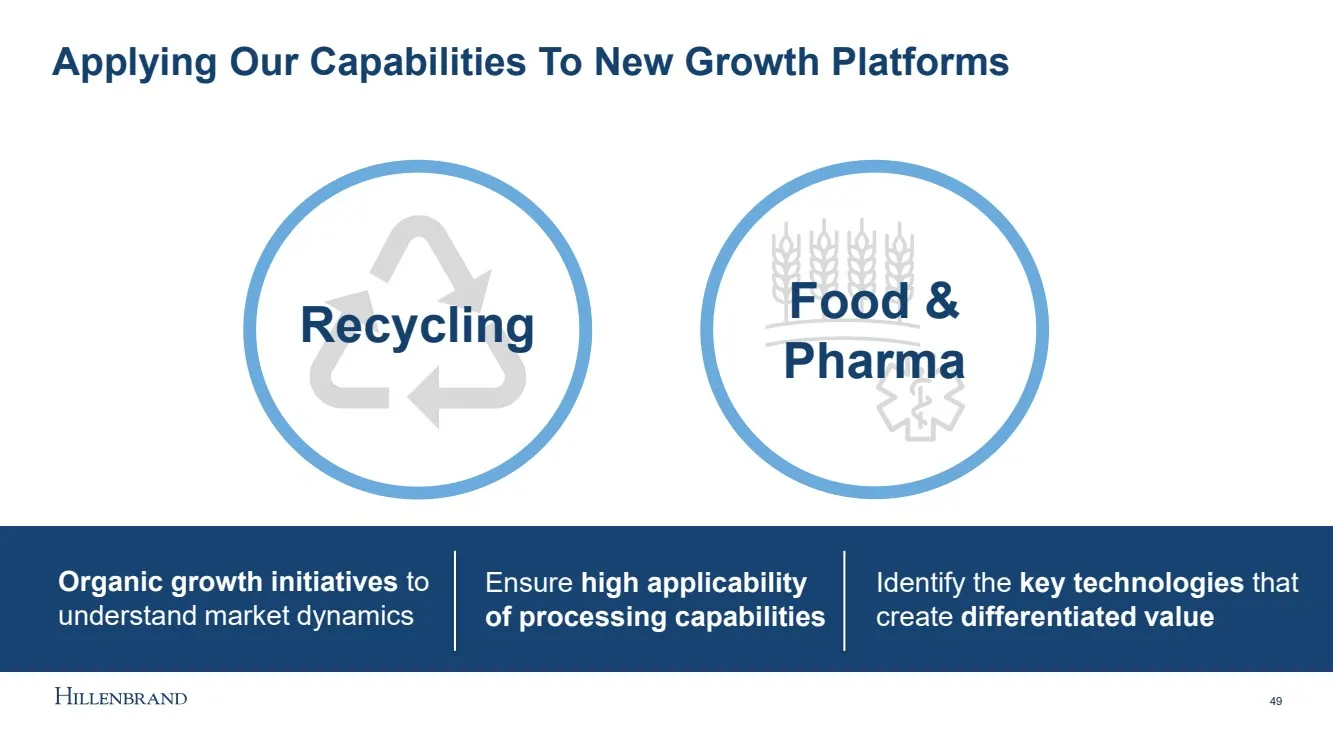
Slide 49: Applying Our Capabilities To New Growth Platforms
Applying Our Capabilities To New Growth Platforms 49 Recycling Food & Pharma Organic growth initiatives to understand market dynamics Ensure high applicability of processing capabilities Identify the key technologies that create differentiated value
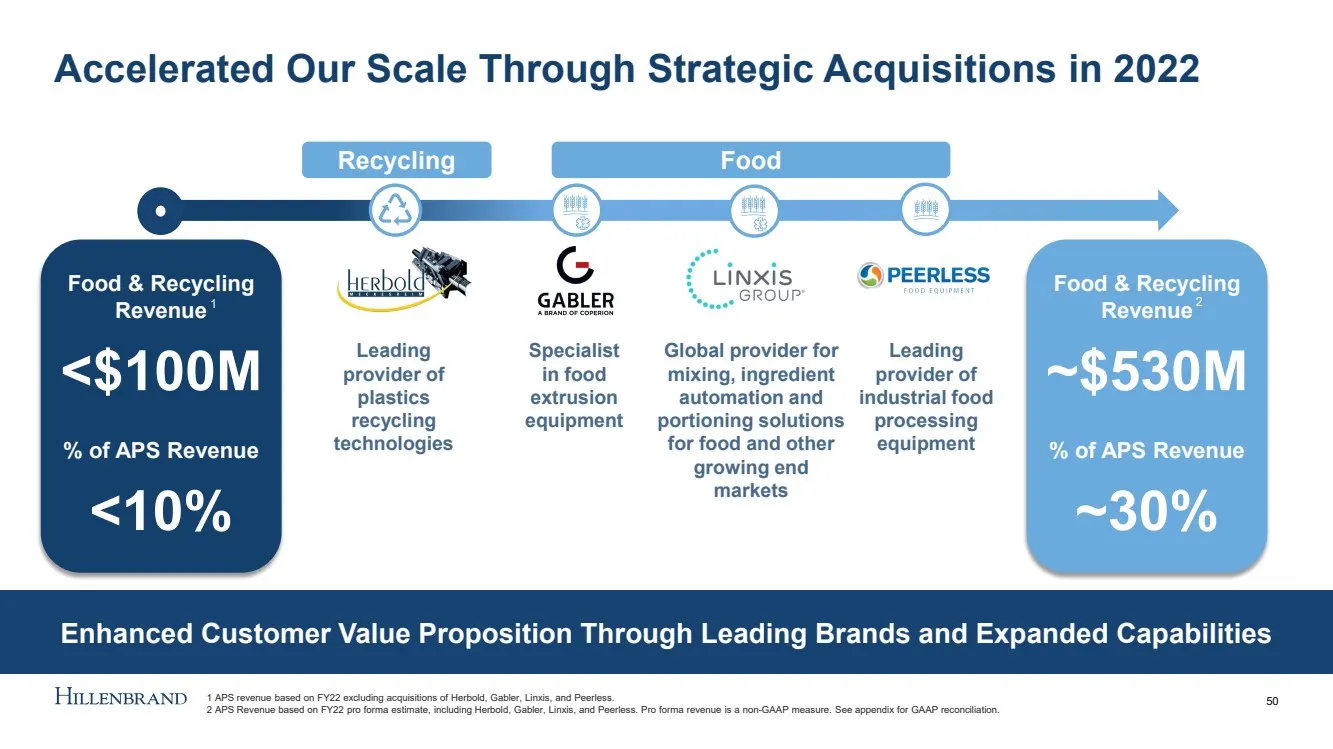
Slide 50: Accelerated Our Scale Through Strategic Acquisitions in 2022
Accelerated Our Scale Through Strategic Acquisitions in 2022 50 Specialist in food extrusion equipment Leading provider of plastics recycling technologies Global provider for mixing, ingredient automation and portioning solutions for food and other growing end markets Leading provider of industrial
Slide 51: Our Three Key Growth Platforms: Recycling
Our Three Key Growth Platforms 51 Plastics & Chemicals Demand for Plastics Circularity Driving Growth in Recycling Recycling Food & Pharma
Slide 52: Well Positioned as a Leader in High-Growth Recycling Market
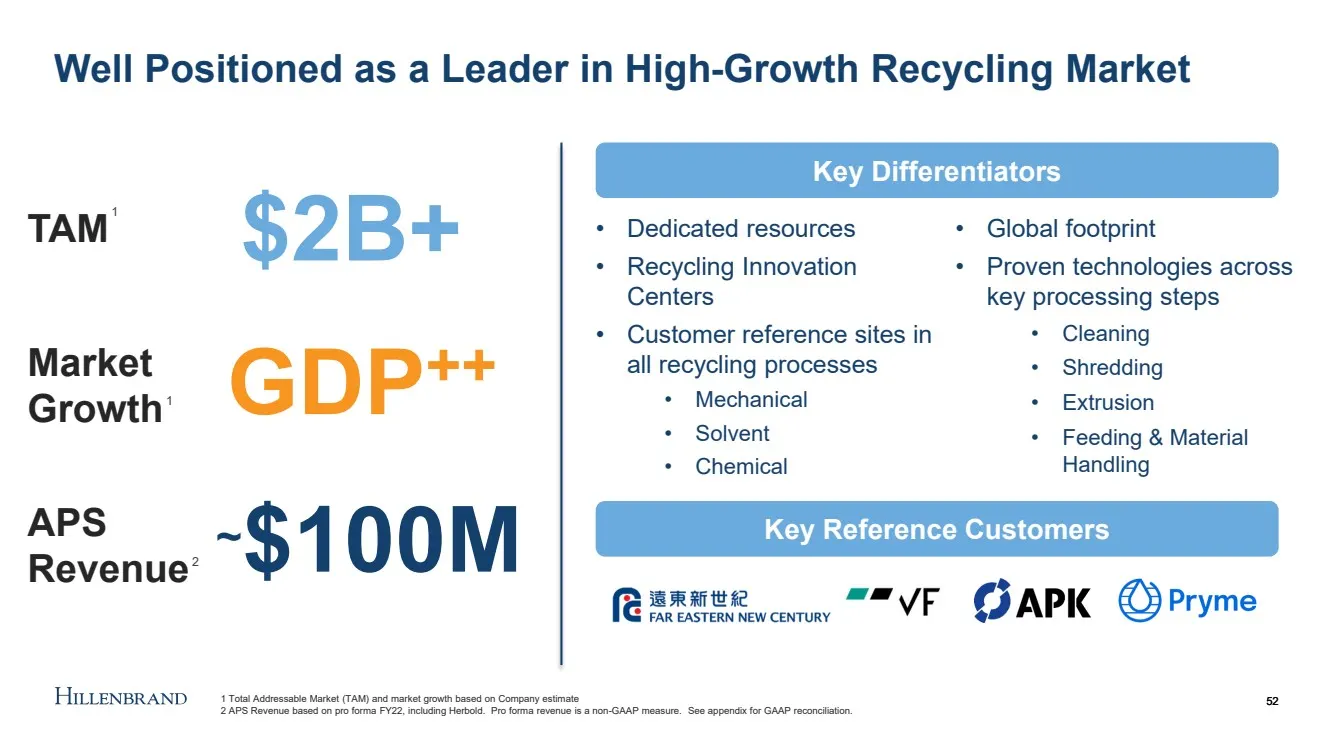
Well Positioned as a Leader in High - Growth Recycling Market 52 • Dedicated resources • Recycling Innovation Centers • Customer reference sites in all recycling processes • Mechanical • Solvent • Chemical • Global footprint • Proven technologies across key processing steps • Cleaning • Shredding •
Slide 53: Setting New Standards for the Recycling Industry
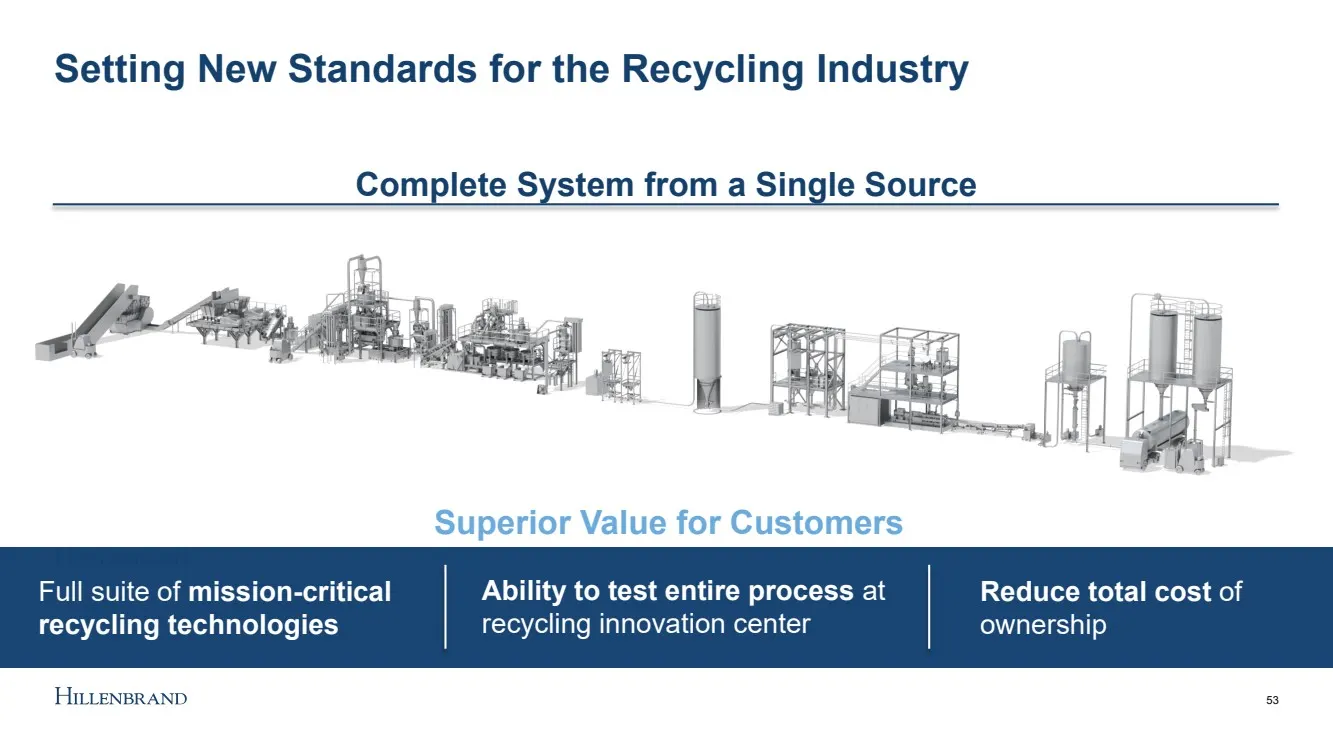
Setting New Standards for the Recycling Industry Superior Value for Customers Full suite of mission - critical recycling technologies Ability to test entire process at recycling innovation center Reduce total cost of ownership Complete System from a Single Source 53
Slide 54: Our Three Key Growth Platforms: Food & Pharma
Our Three Key Growth Platforms 54 Plastics & Chemicals We Have Accelerated Our Leadership Position in the Food Market Recycling Food & Pharma
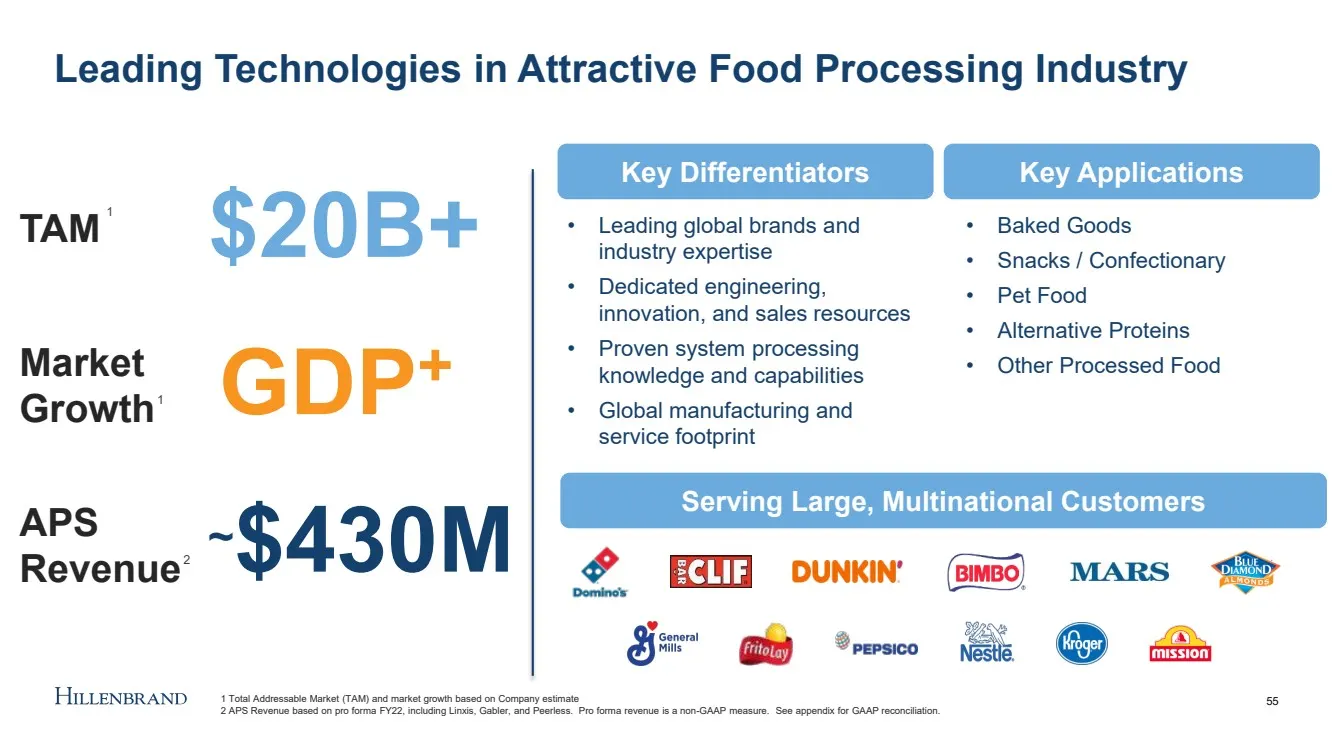
Slide 55: Leading Technologies in Attractive Food Processing Industry
Leading Technologies in Attractive Food Processing Industry 55 • Leading global brands and industry expertise • Dedicated engineering, innovation, and sales resources • Proven system processing knowledge and capabilities • Global manufacturing and service footprint • Baked Goods • Snacks / Confectio
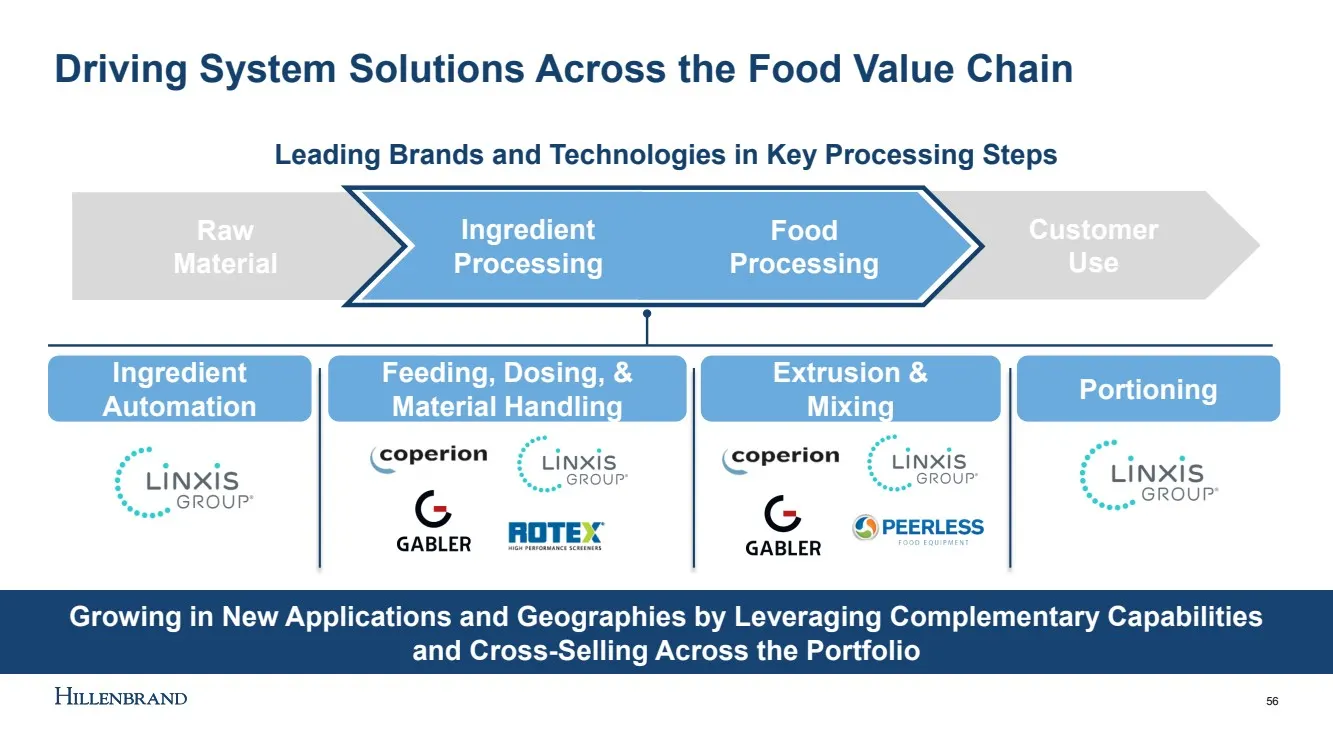
Slide 56: Driving System Solutions Across the Food Value Chain
Driving System Solutions Across the Food Value Chain 56 Portioning Leading Brands and Technologies in Key Processing Steps Growing in New Applications and Geographies by Leveraging Complementary Capabilities and Cross - Selling Across the Portfolio Raw Material Ingredient Processing Food Processing
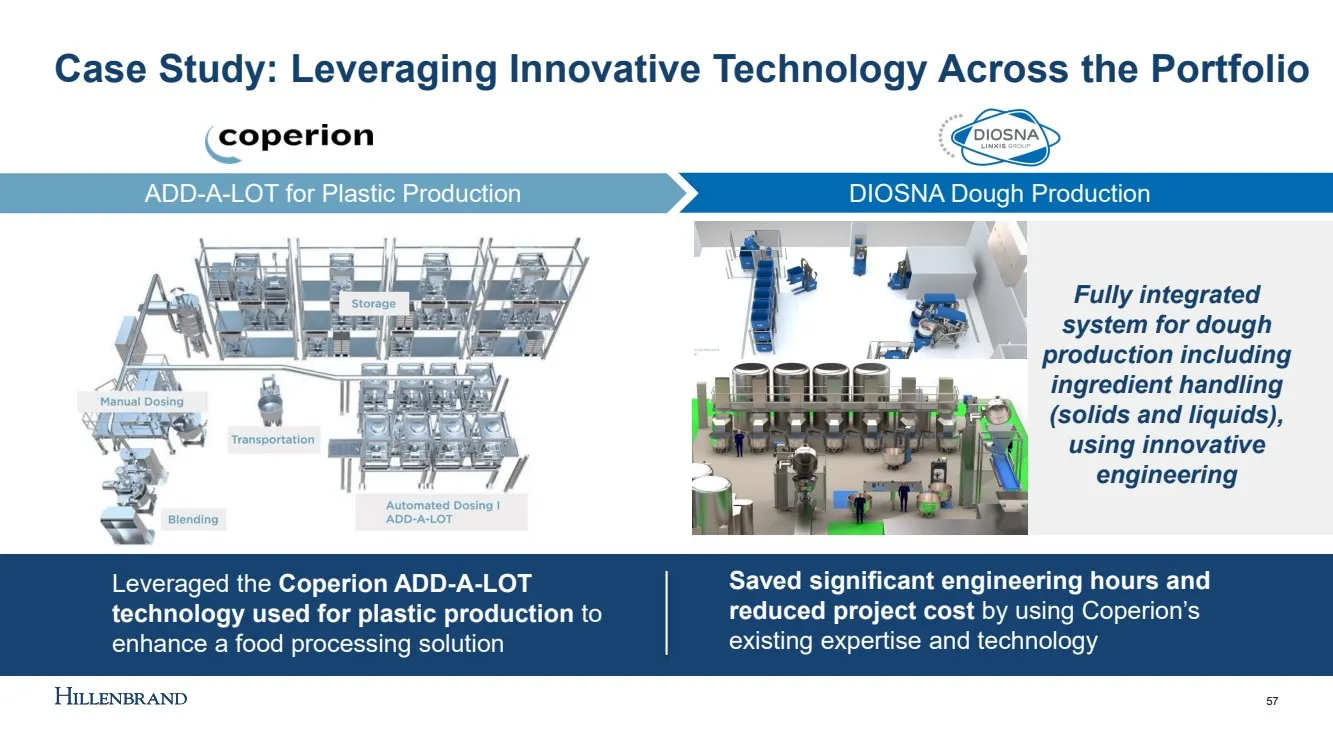
Slide 57: Case Study: Leveraging Innovative Technology Across the Portfolio
Case Study: Leveraging Innovative Technology Across the Portfolio 57 ADD - A - LOT for Plastic Production DIOSNA Dough Production Fully integrated system for dough production including ingredient handling (solids and liquids), using innovative engineering Saved significant engineering hours and redu
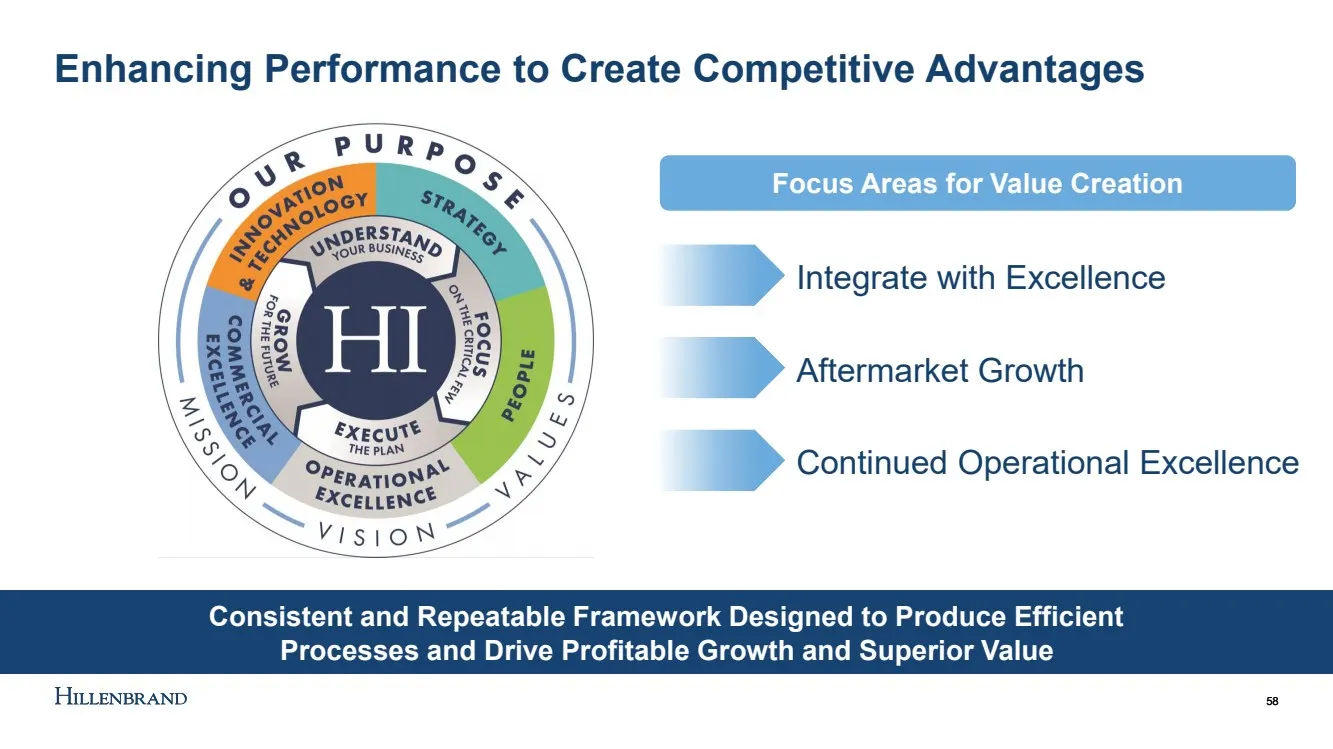
Slide 58: Leveraging Core Tenets to Strengthen Foundation and Accelerate Growth
LEVERAGING CORE TENANTS TO STRENGTHEN FOUNDATION, AND ACCELERATE GROWTH Enhancing Performance to Create Competitive Advantages 58 Consistent and Repeatable Framework Designed to Produce Efficient Processes and Drive Profitable Growth and Superior Value Integrate with Excellence Aftermarket Growth Co
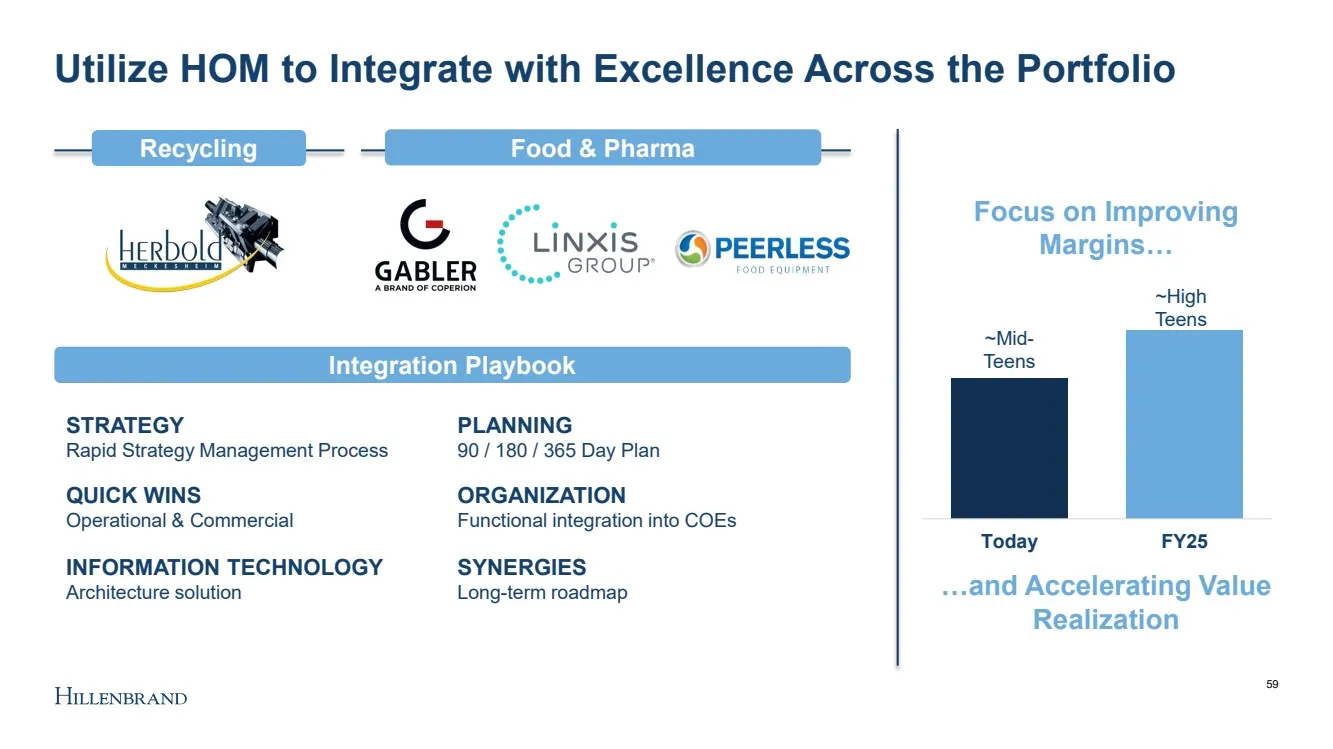
Slide 59: Utilize HOM to Integrate with Excellence Across the Portfolio
Utilize HOM to Integrate with Excellence Across the Portfolio ~Mid - Teens ~High Teens Today FY25 59 FOOD, HEALTH & NUTRITION RECYCLING …and Accelerating Value Realization Focus on Improving Margins… STRATEGY Rapid Strategy Management Process PLANNING 90 / 180 / 365 Day Plan QUICK WINS Operational &
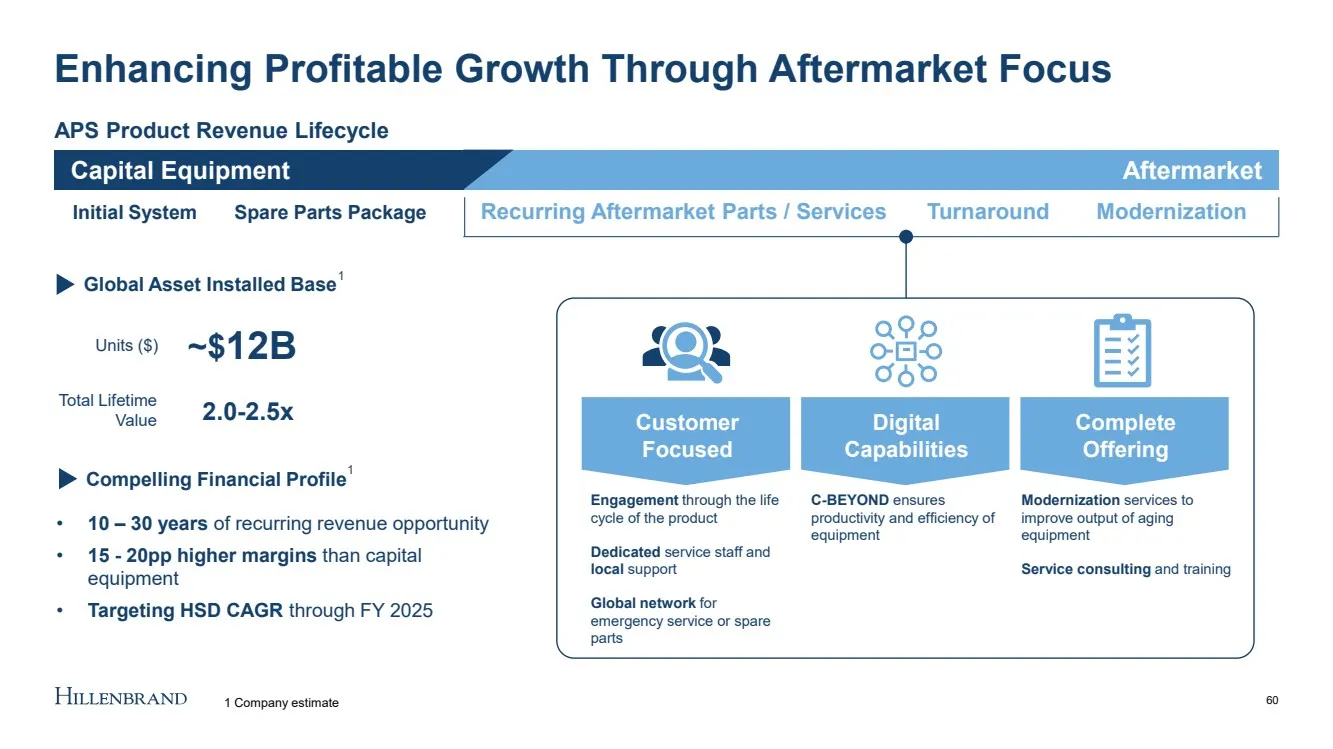
Slide 60: Customer's First Choice for Parts & Service
CUSTOMER’S FIRST CHOICE FOR PARTS & SERVICE AND THE ONE - STOP SHOP ACROSS THE LIFECYCLE APS Product Revenue Lifecycle Capital Equipment Aftermarket • 10 – 30 years of recurring revenue opportunity • 15 - 20pp higher margins than capital equipment • Targeting HSD CAGR through FY 2025 Enhancing Profi
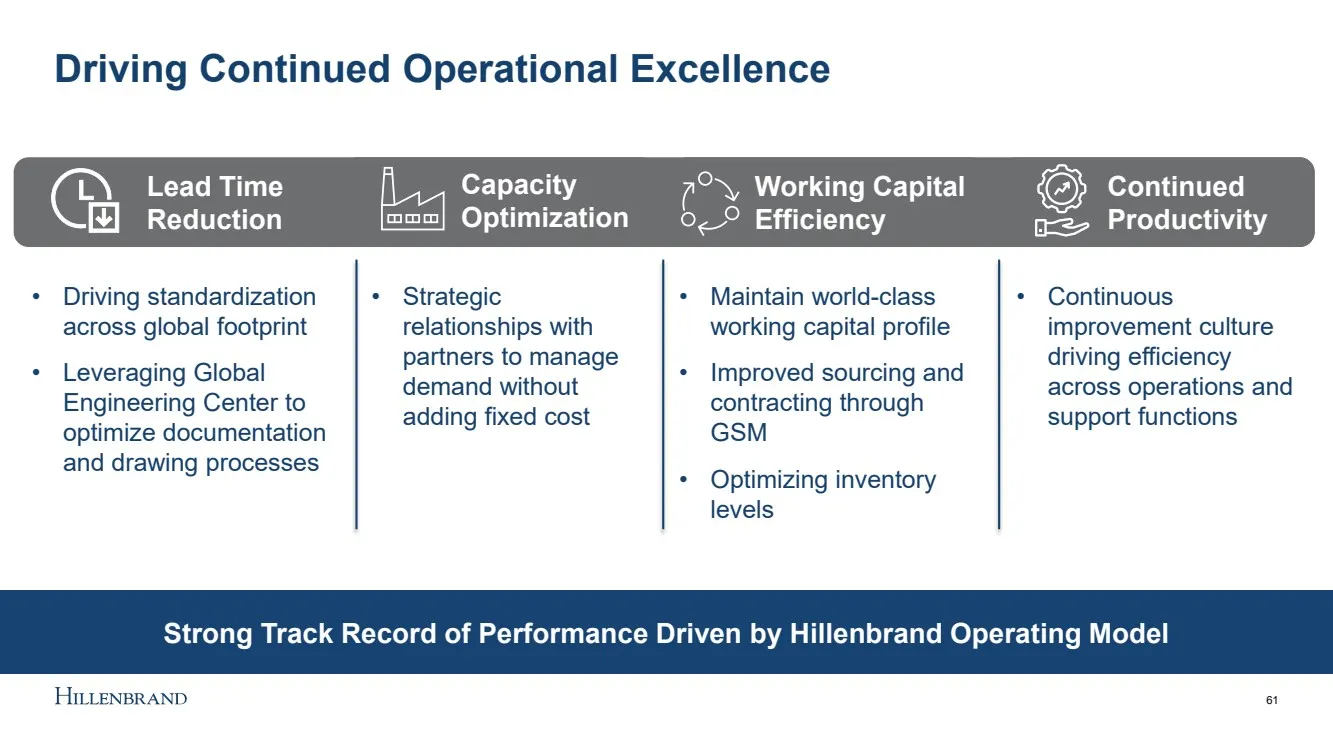
Slide 61: Driving Continued Operational Excellence
Driving Continued Operational Excellence • Driving standardization across global footprint • Leveraging Global Engineering Center to optimize documentation and drawing processes • Strategic relationships with partners to manage demand without adding fixed cost • Continuous improvement culture drivin
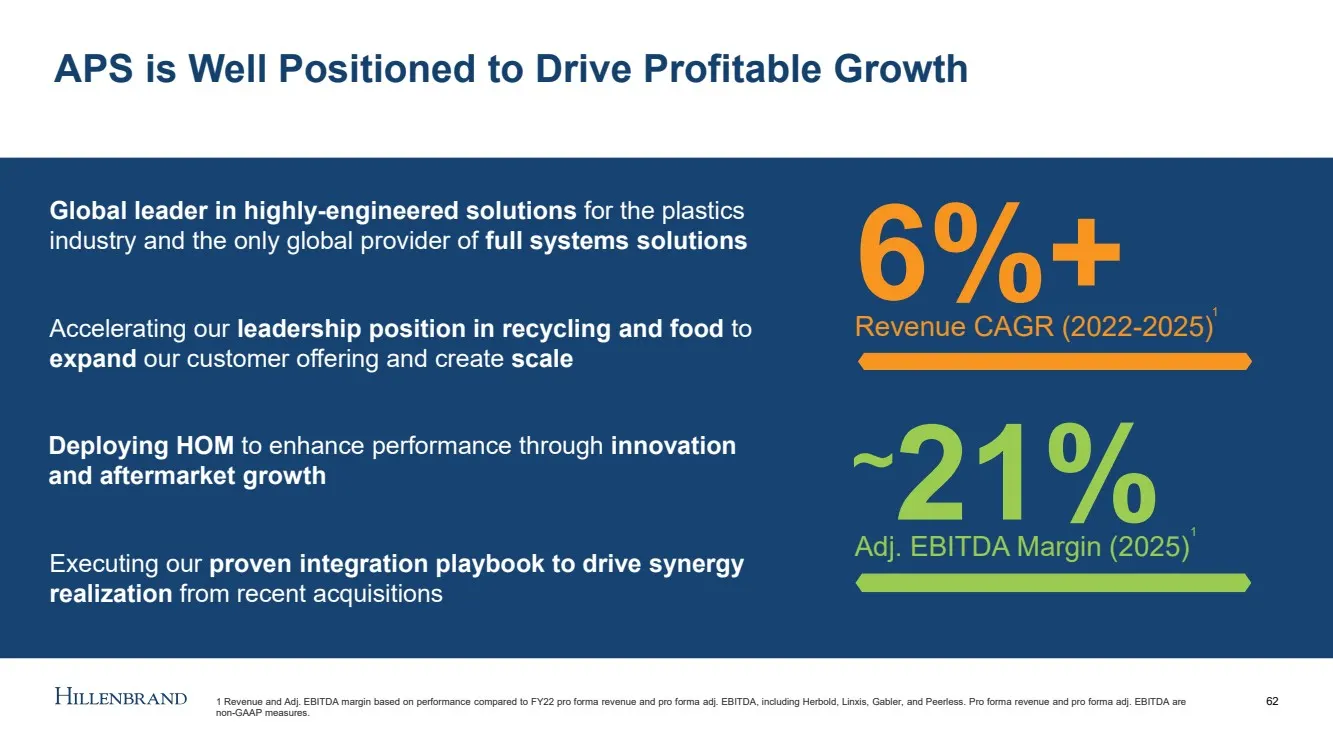
Slide 62: APS is Well Positioned to Drive Profitable Growth
APS is Well Positioned to Drive Profitable Growth 62 6%+ Revenue CAGR (2022 - 2025) ~ 21% Adj. EBITDA Margin (2025) Global leader in highly - engineered solutions for the plastics industry and the only global provider of full systems solutions Accelerating our leadership position in recycling and fo

Slide 63: 10-minute break
10-minute break ILLENBRAND

Slide 64: Molding Technology Solutions (MTS)
Molding Technology Solutions (MTS) Mac Jones – SVP & President, Milacron 64
Slide 65: MTS: What You'll Hear Today
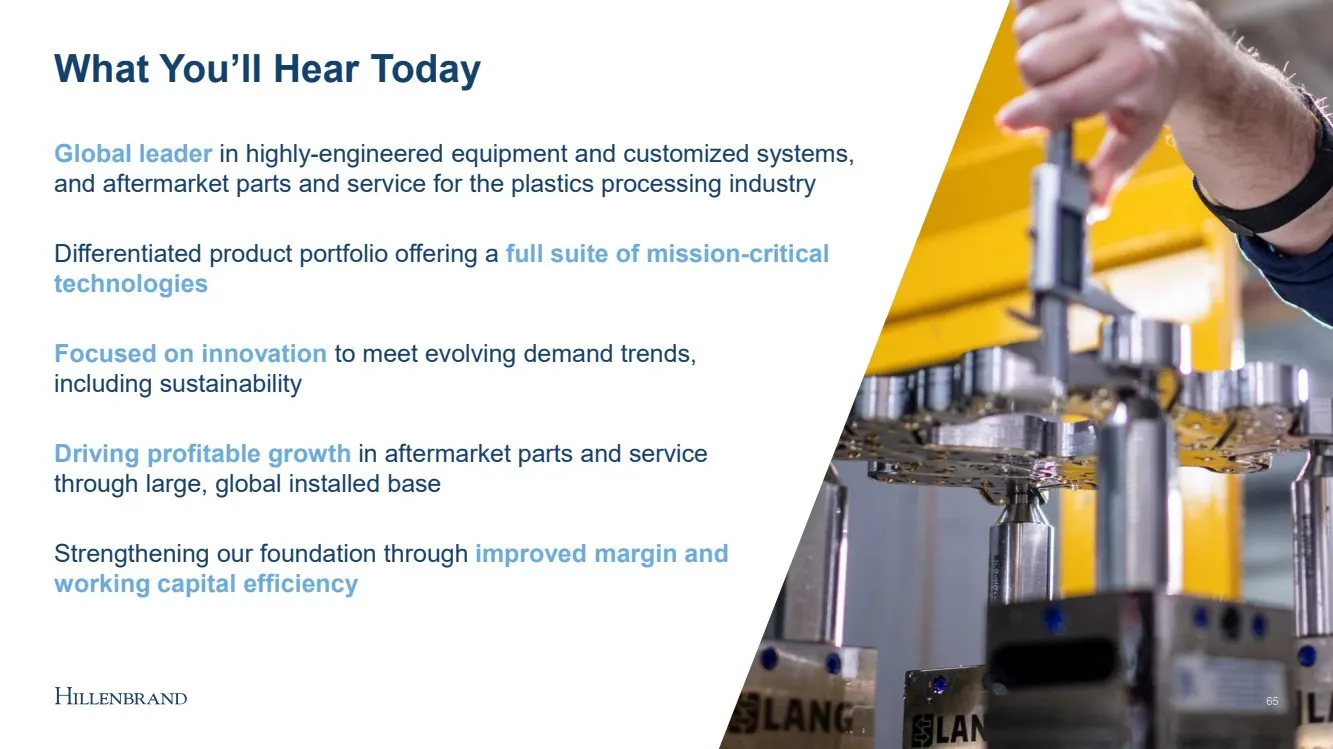
65 65 Global leader in highly - engineered equipment and customized systems, and aftermarket parts and service for the plastics processing industry Differentiated product portfolio offering a full suite of mission - critical technologies Driving profitable growth in aftermarket parts and service thr
Slide 66: MTS Overview
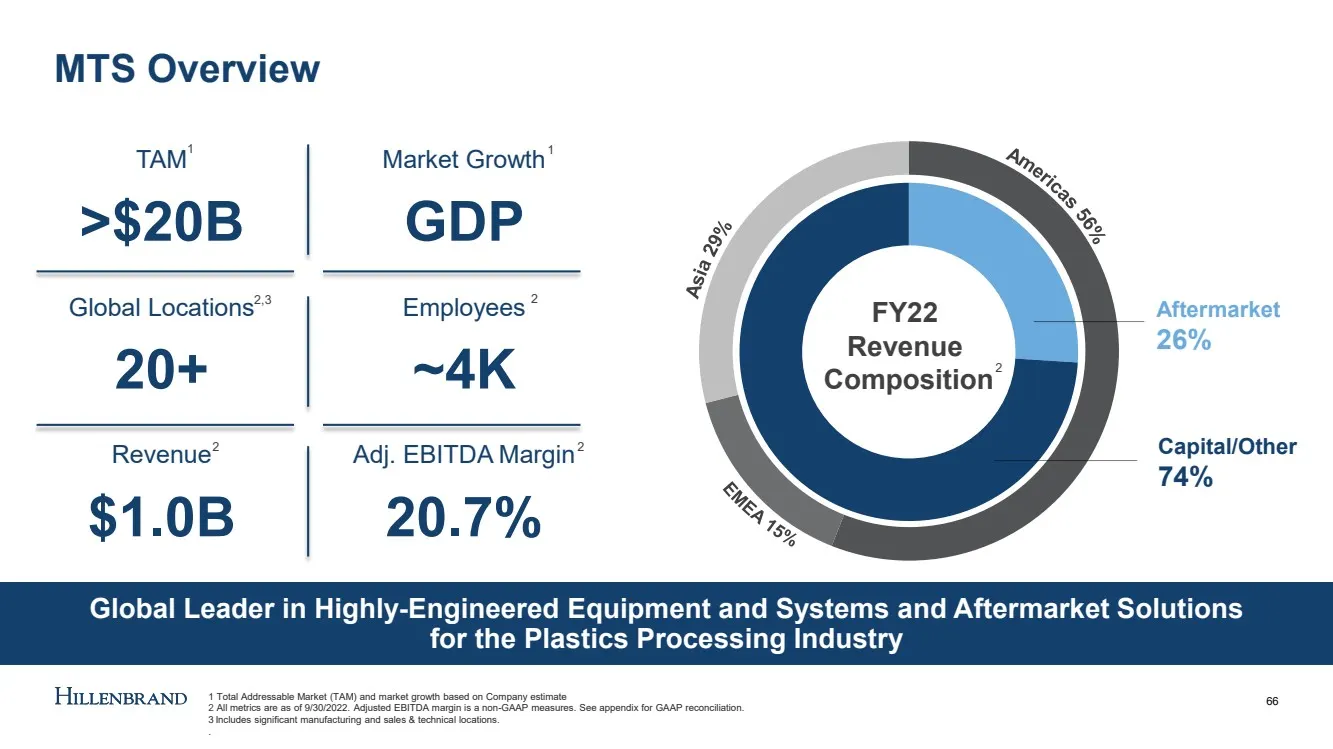
Global Leader in Highly - Engineered Equipment and Systems and Aftermarket Solutions for the Plastics Processing Industry MTS Overview 66 FY22 Revenue Composition Capital/Other 74% Aftermarket 26% TAM >$20B Market Growth GDP Global Locations 20+ Employees ~4K Revenue $1.0B Adj. EBITDA Margin 20.7% 1
Slide 67: Serving Blue-Chip Customers Across Diverse Applications
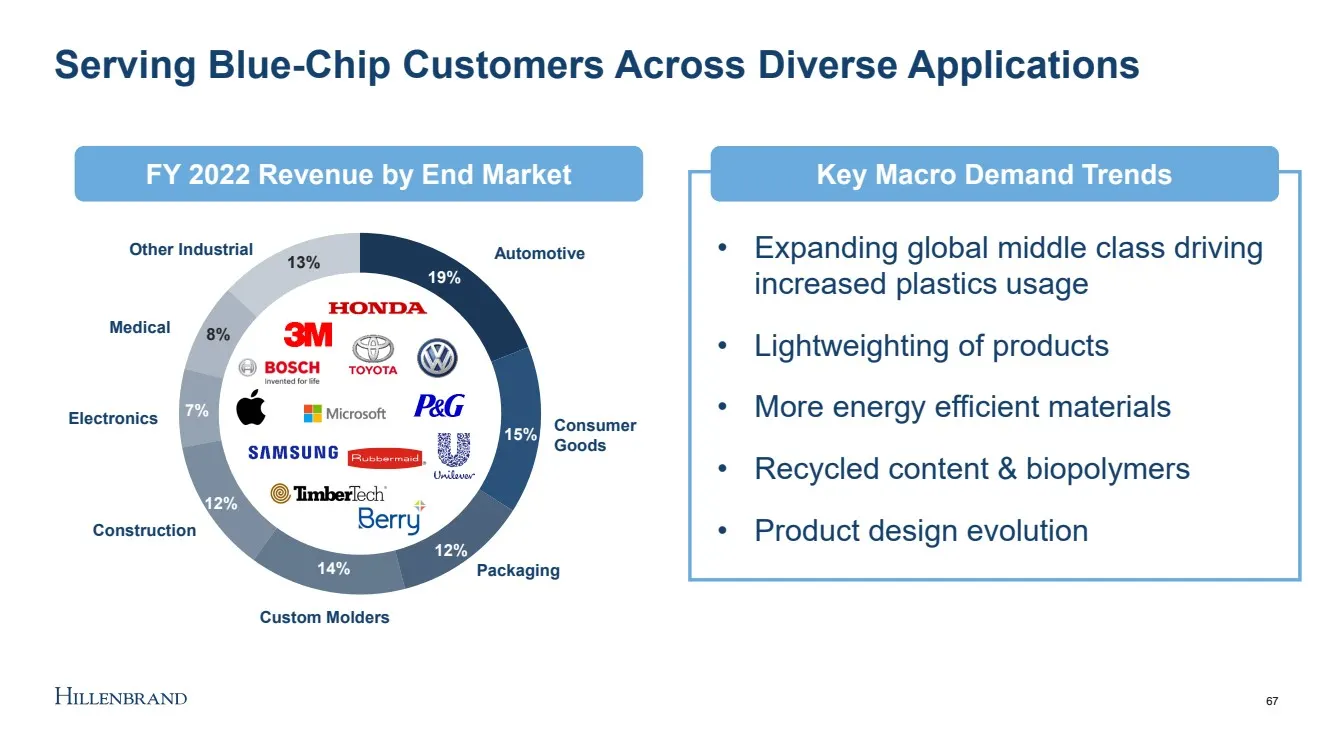
19% 15% 12% 14% 12% 7% 8% 13% Key Priorities • Expanding global middle class driving increased plastics usage • Lightweighting of products • More energy efficient materials • Recycled content & biopolymers • Product design evolution Serving Blue - Chip Customers Across Diverse Applications 67 Constr
Slide 68: Full Suite of Mission-Critical Molding Technologies
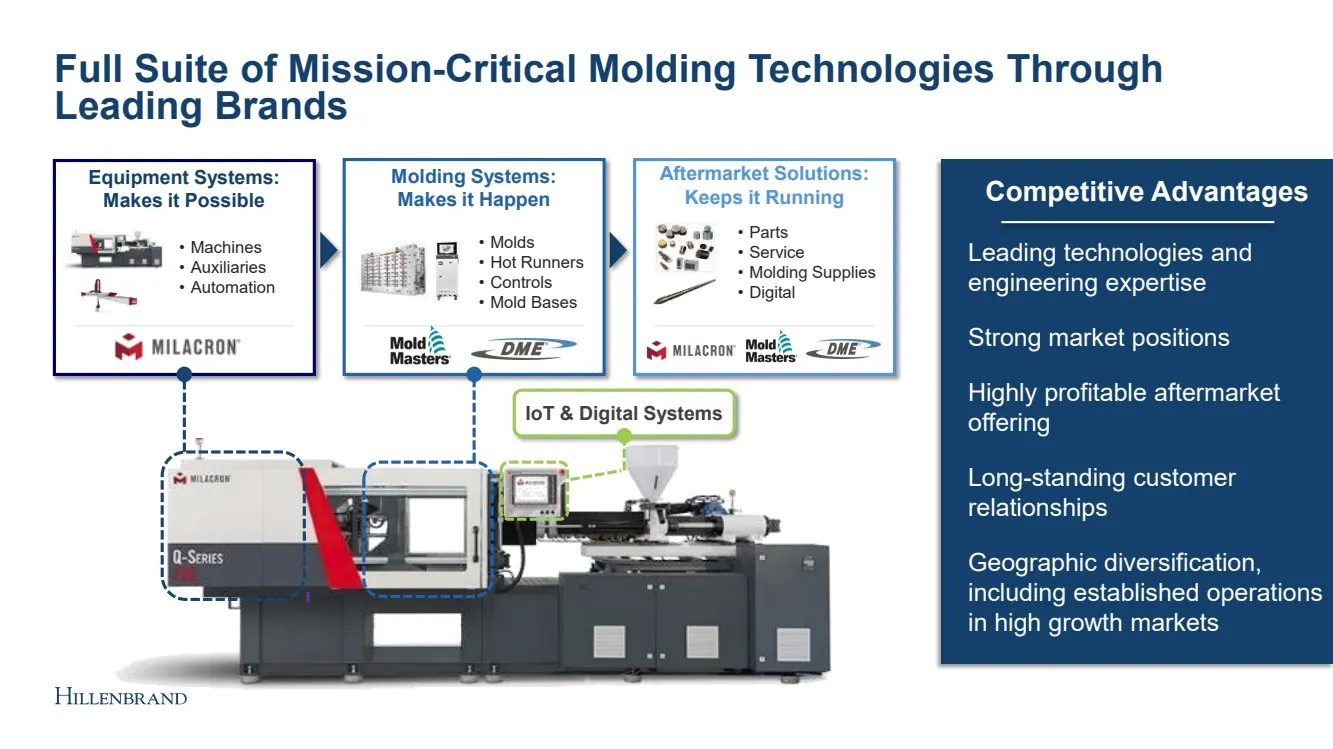
Full Suite of Mission - Critical Molding Technologies Through Leading Brands • Parts • Service • Molding Supplies • Digital Aftermarket Solutions: Keeps it Running Equipment Systems: Makes it Possible • Machines • Auxiliaries • Automation IoT & Digital Systems • Molds • Hot Runners • Controls • Mold
Slide 69: MTS Strategic Priorities
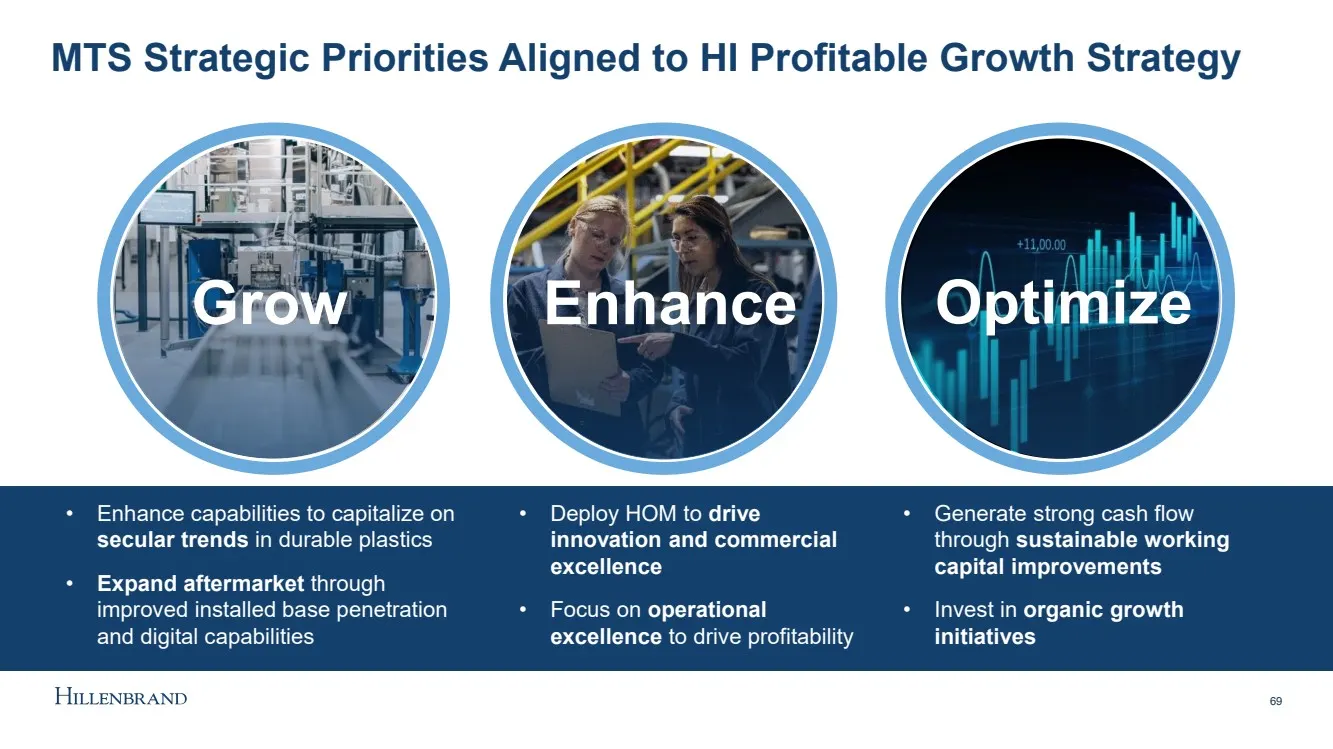
MTS Strategic Priorities Aligned to HI Profitable Growth Strategy Enhance Optimize 69 Grow • Enhance capabilities to capitalize on secular trends in durable plastics • Expand aftermarket through improved installed base penetration and digital capabilities • Deploy HOM to drive innovation and commerc
Slide 70: Strengthening Our Foundation to Deliver Profitable Growth
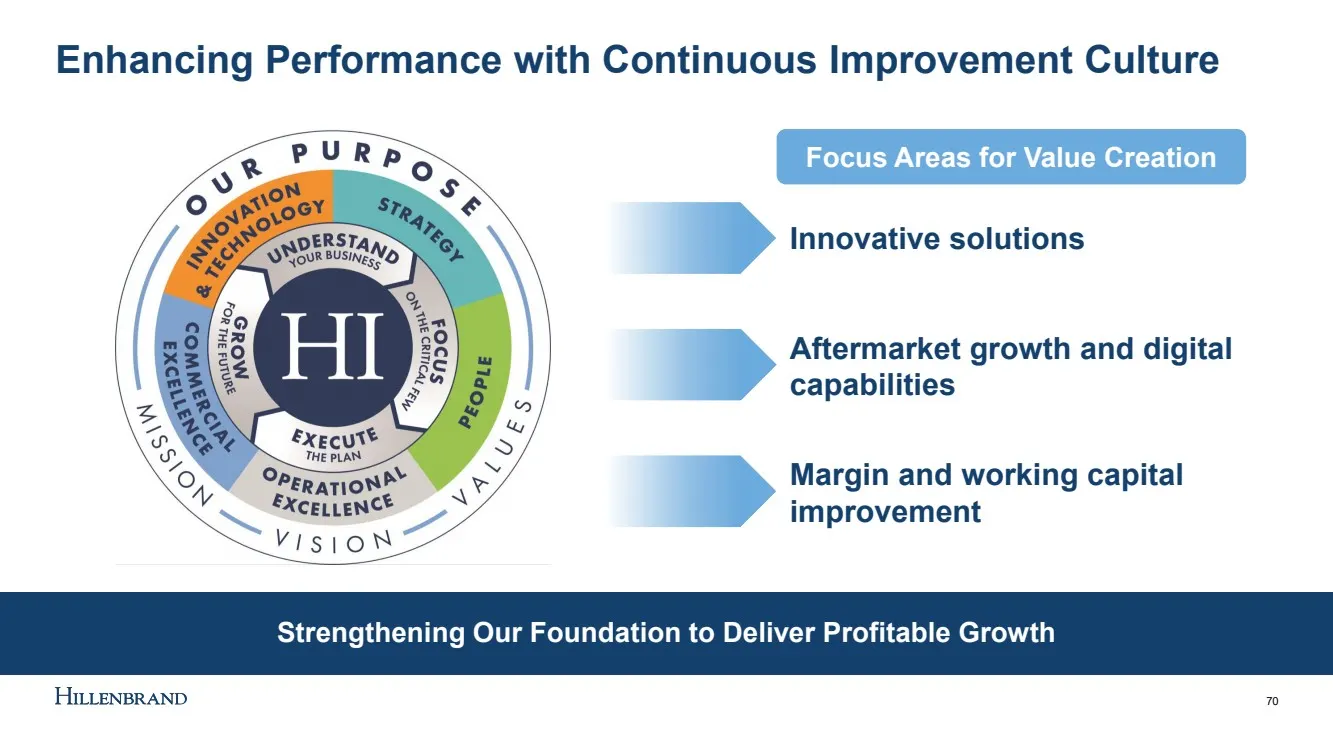
Strengthening Our Foundation to Deliver Profitable Growth Innovative solutions Enhancing Performance with Continuous Improvement Culture 70 Aftermarket growth and digital capabilities Margin and working capital improvement Focus Areas for Value Creation
Slide 71: Partnering with Customers to Shape What Matters for Tomorrow
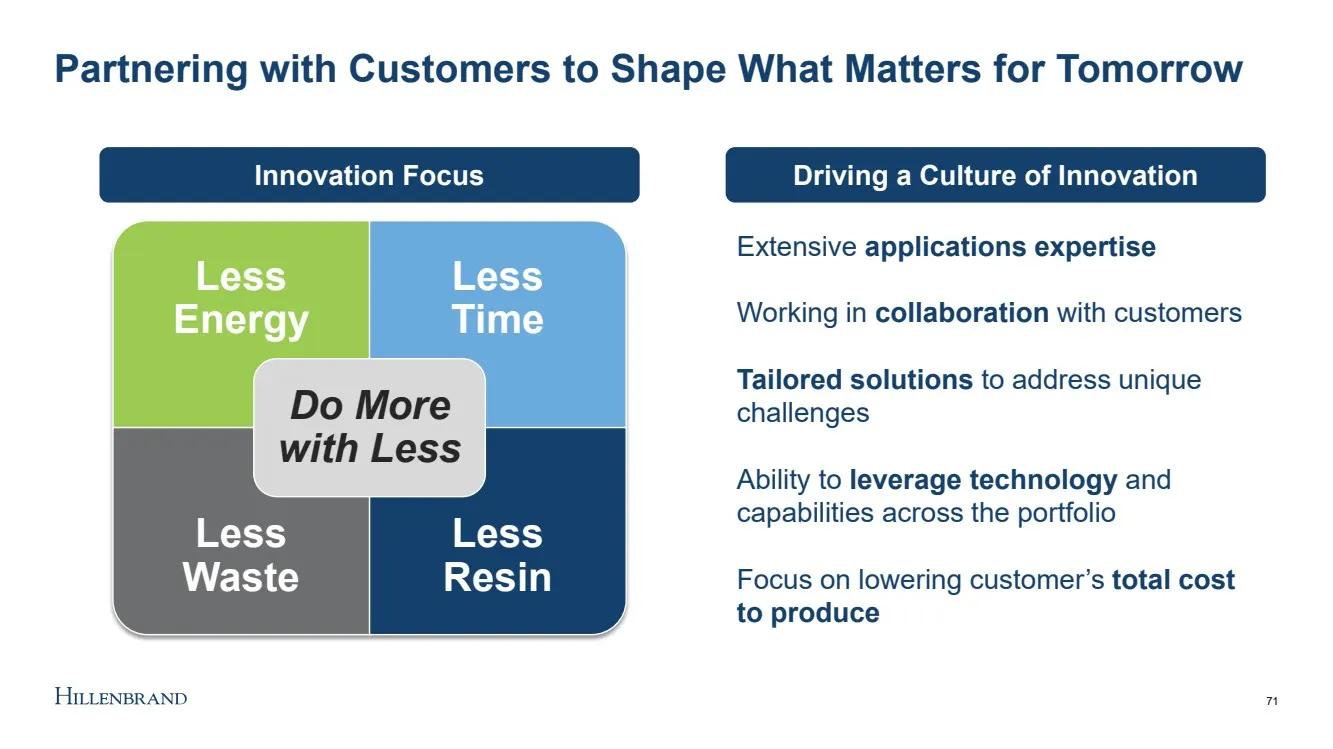
Partnering with Customers to Shape What Matters for Tomorrow 1 71 Extensive applications expertise Working in collaboration with customers Tailored solutions to address unique challenges Ability to leverage technology and capabilities across the portfolio Focus on lowering customer’s total cost to p
Slide 72: Case Study: Customer-Focused Solution for a Sustainable Future
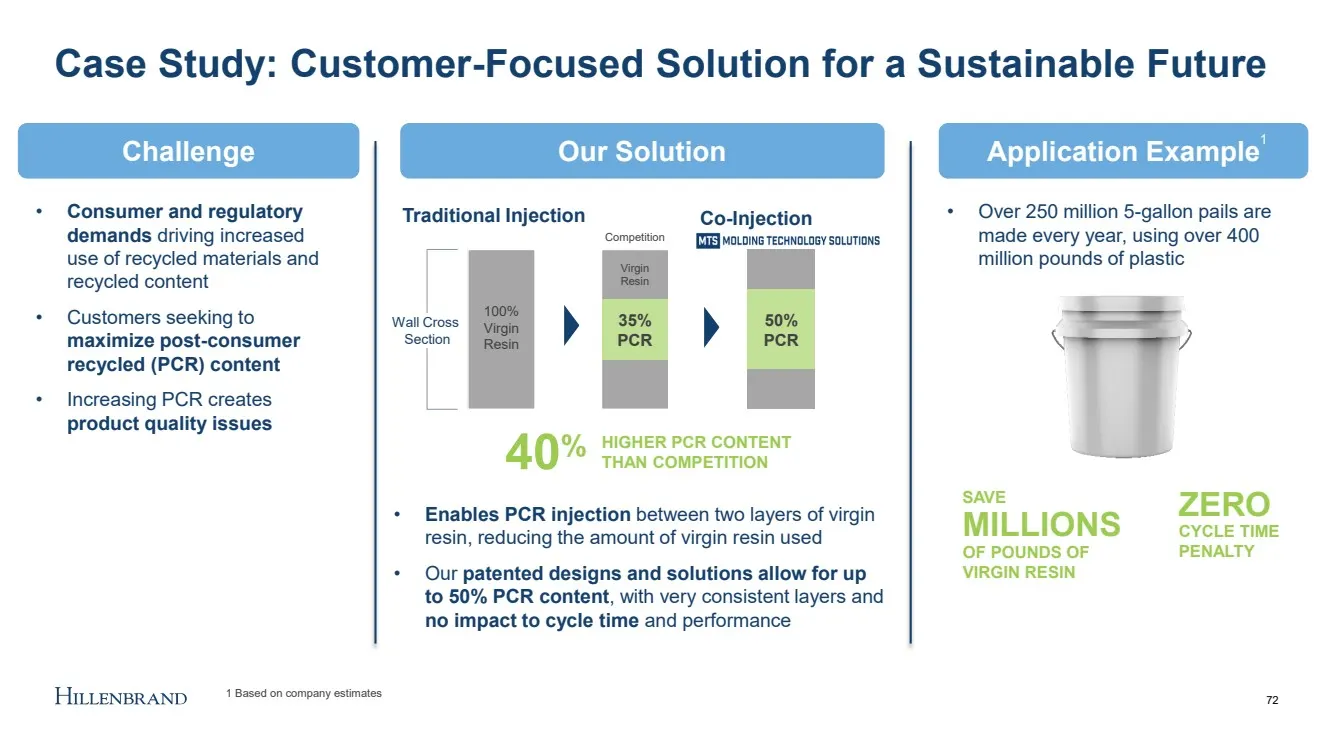
Case Study: Customer - Focused Solution for a Sustainable Future 100% Virgin Resin 50% PCR Traditional Injection Co - Injection 35% PCR Virgin Resin Competition Wall Cross Section • Enables PCR injection between two layers of virgin resin, reducing the amount of virgin resin used • Our patented desi
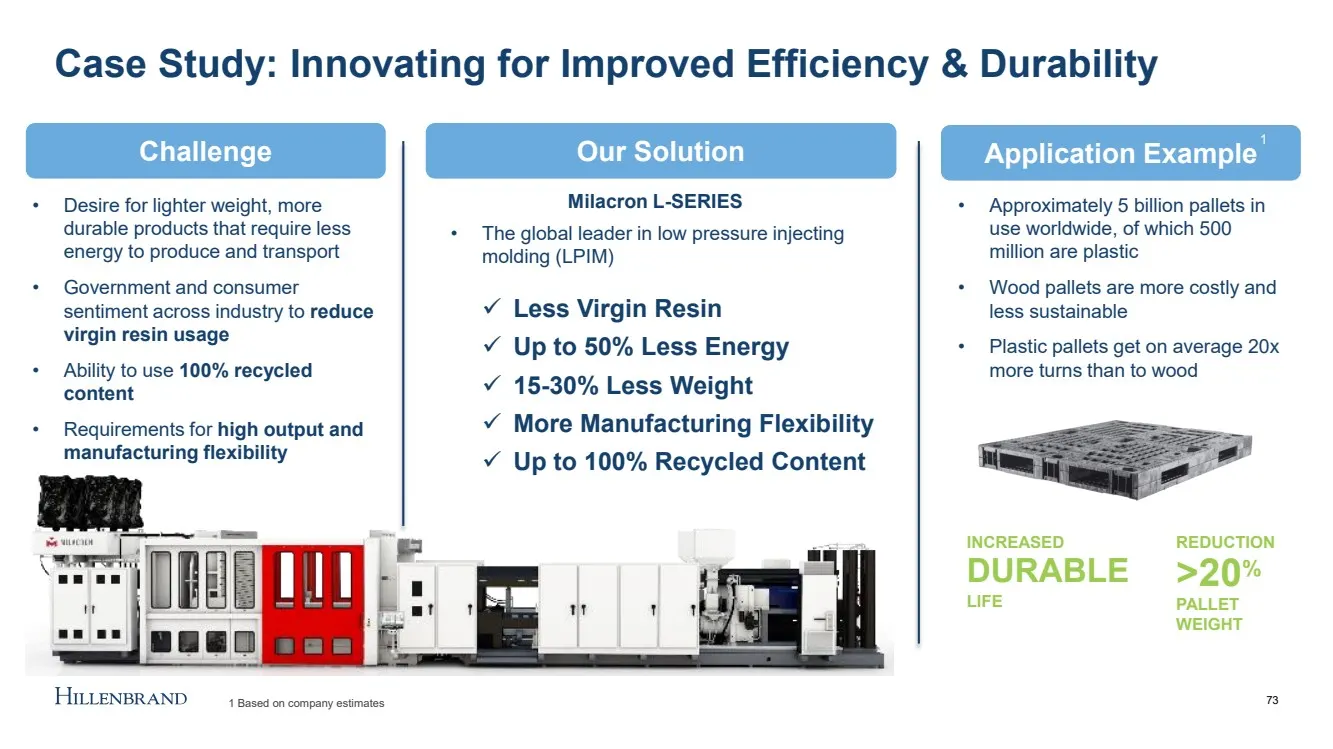
Slide 73: Case Study: Innovating for Improved Efficiency & Durability
Case Study: Innovating for Improved Efficiency & Durability Opportunity Application Example 73 Our Solution Application Example Challenge • Desire for lighter weight, more durable products that require less energy to produce and transport • Government and consumer sentiment across industry to reduce
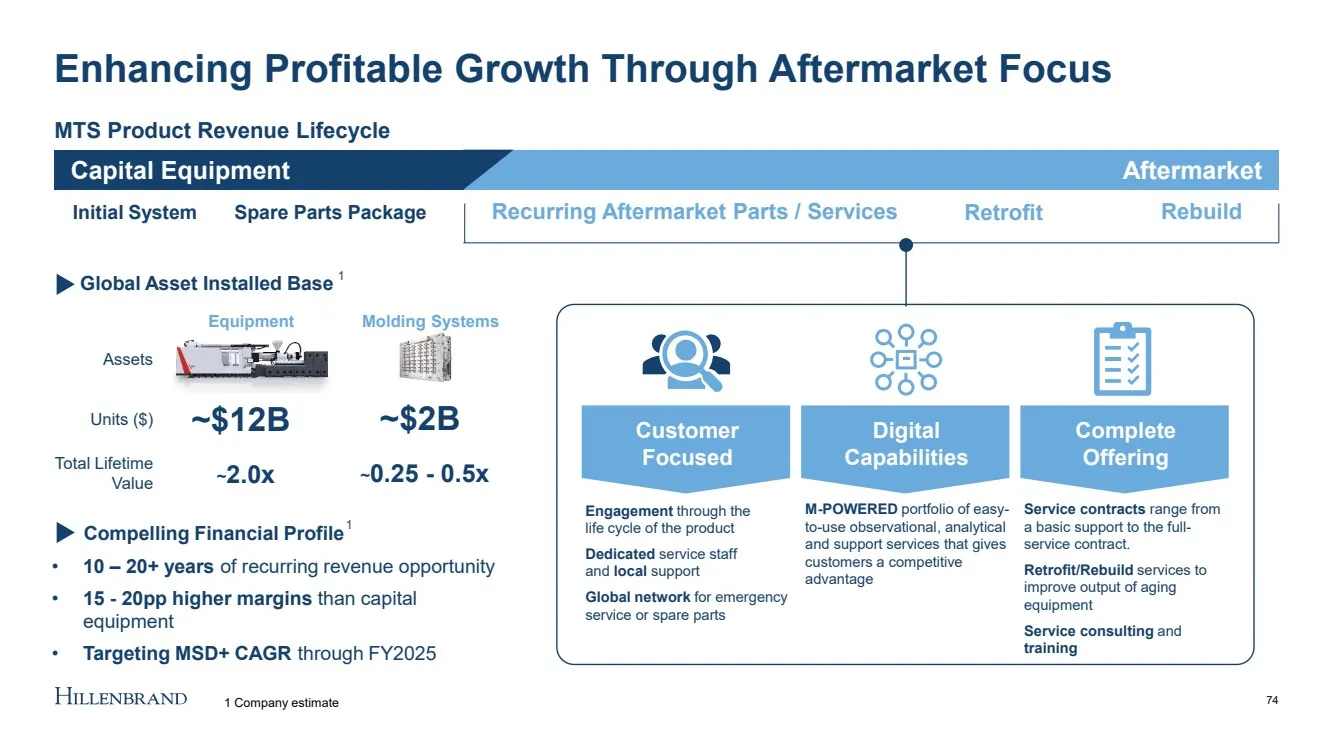
Slide 74: Customer's First Choice for Parts & Service
CUSTOMER’S FIRST CHOICE FOR PARTS & SERVICE AND THE ONE - STOP SHOP ACROSS THE LIFECYCLE MTS Product Revenue Lifecycle Capital Equipment Aftermarket • 10 – 20+ years of recurring revenue opportunity • 15 - 20pp higher margins than capital equipment • Targeting MSD+ CAGR through FY2025 Enhancing Prof
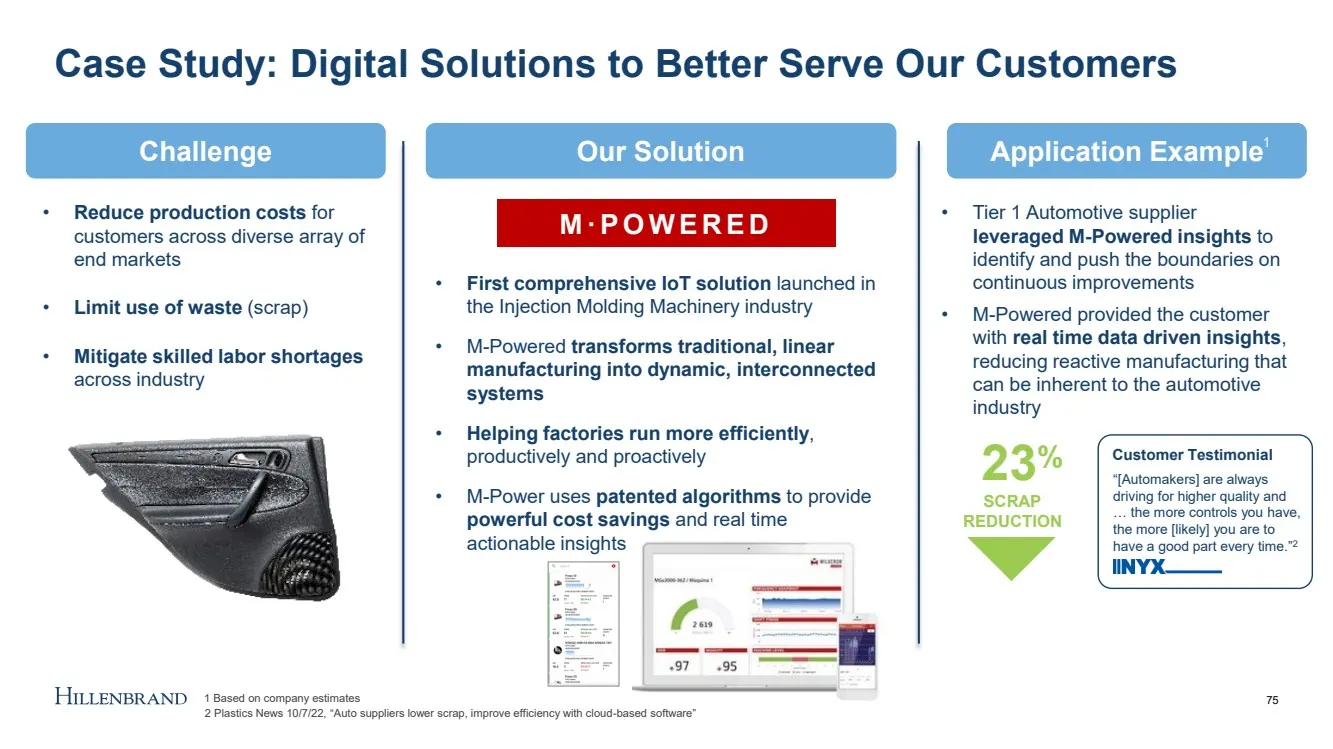
Slide 75: Case Study: Digital Solutions to Better Serve Our Customers
Case Study: Digital Solutions to Better Serve Our Customers Opportunity Application Example 75 Our Solution Application Example Challenge • Reduce production costs for customers across diverse array of end markets • Limit use of waste (scrap) • Mitigate skilled labor shortages across industry • Firs
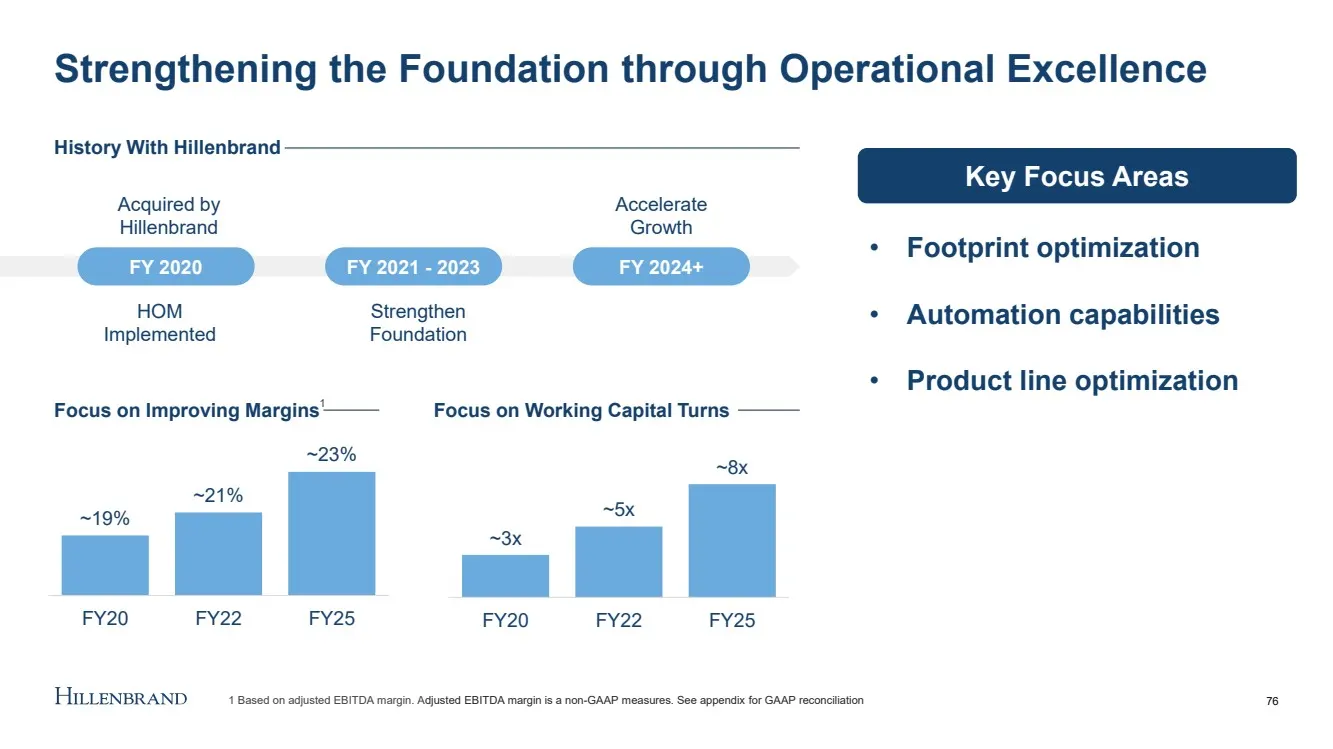
Slide 76: Strengthening the Foundation through Operational Excellence
Strengthening the Foundation through Operational Excellence 76 History With Hillenbrand FY 2020 FY 2021 - 2023 FY 2024+ Acquired by Hillenbrand HOM Implemented Strengthen Foundation Accelerate Growth ~19% ~21% ~23% FY20 FY22 FY25 ~3x ~5x ~8x FY20 FY22 FY25 Focus on Improving Margins Focus on Working
Slide 77: MTS is Well Positioned to Drive Profitable Growth
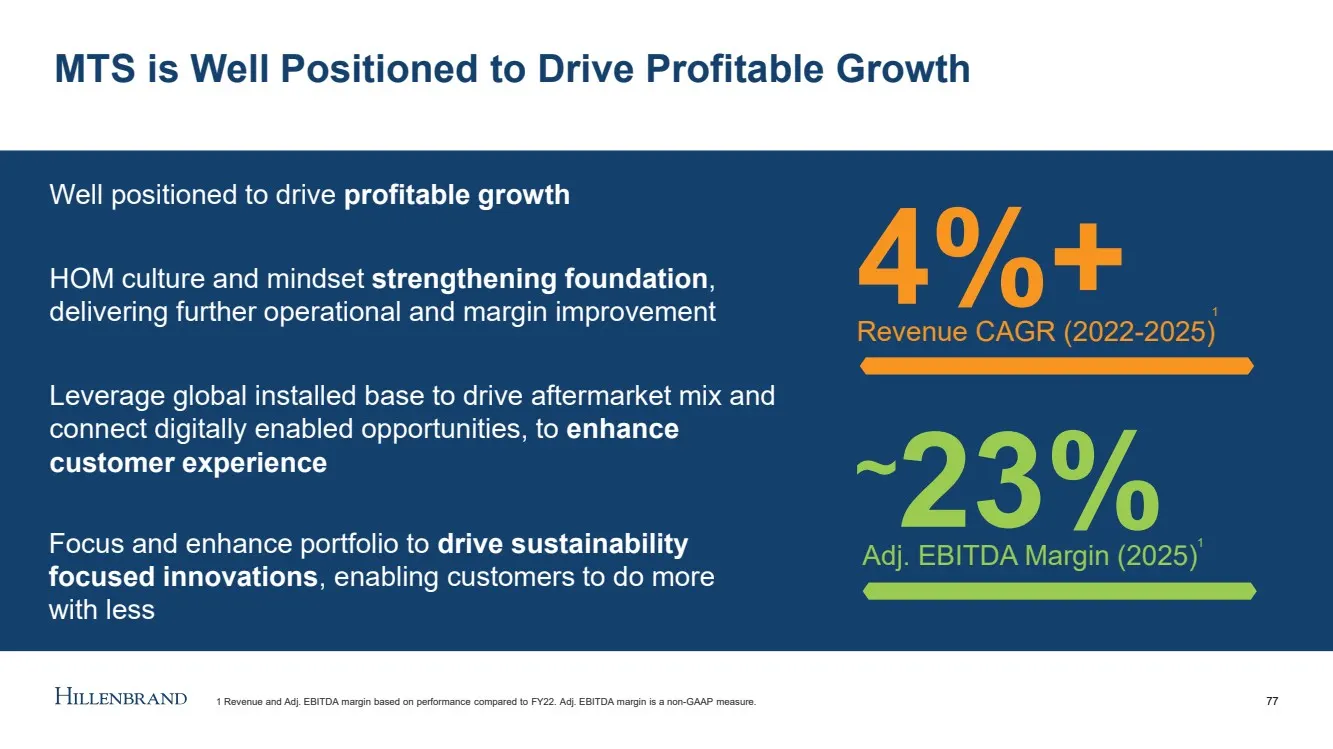
MTS is Well Positioned to Drive Profitable Growth 77 Focus and enhance portfolio to drive sustainability focused innovations , enabling customers to do more with less Well positioned to drive profitable growth HOM culture and mindset strengthening foundation , delivering further operational and marg

Slide 78: Sustainability
Sustainability Tory Flynn – Chief Sustainability Officer 78
Slide 79: Sustainability: What You'll Hear Today
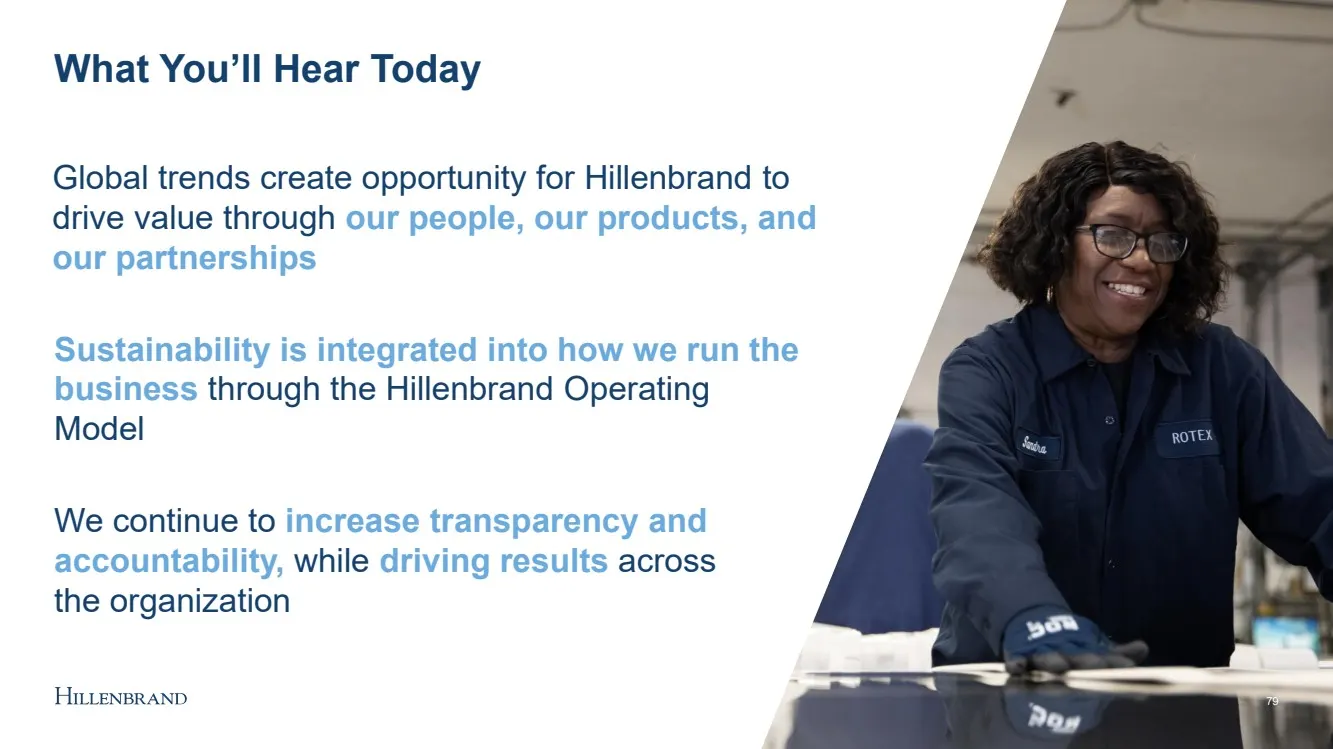
79 What You’ll Hear Today Global trends create opportunity for Hillenbrand to drive value through our people, our products, and our partnerships Sustainability is integrated into how we run the business through the Hillenbrand Operating Model We continue to increase transparency and accountability,
Slide 80: Global Trends Create a Sustainable Opportunity for Hillenbrand
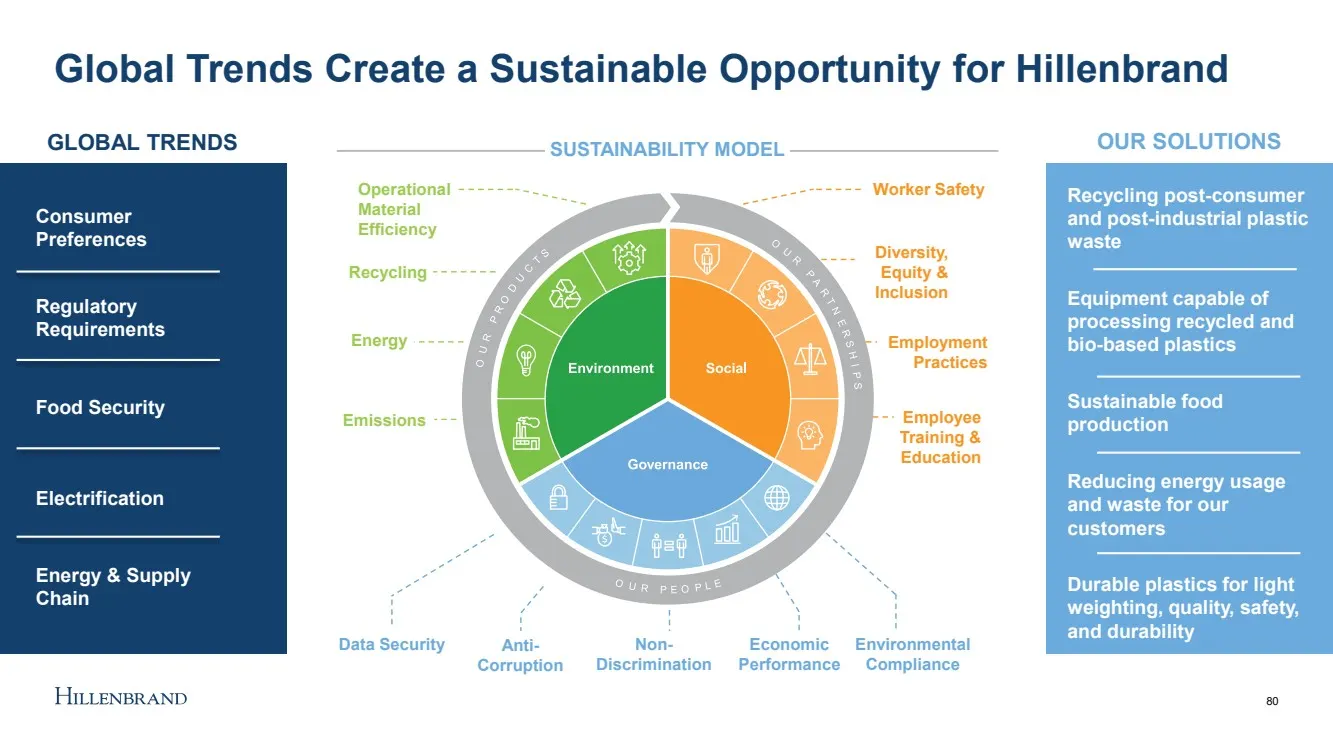
Global Trends Create a Sustainable Opportunity for Hillenbrand 80 Consumer Preferences Data Security Anti - Corruption Non - Discrimination Economic Performance Environmental Compliance Worker Safety Diversity, Equity & Inclusion Employment Practices Employee Training & Education Operational Materia
Slide 81: Sustainability is Embedded in the Hillenbrand Operating Model
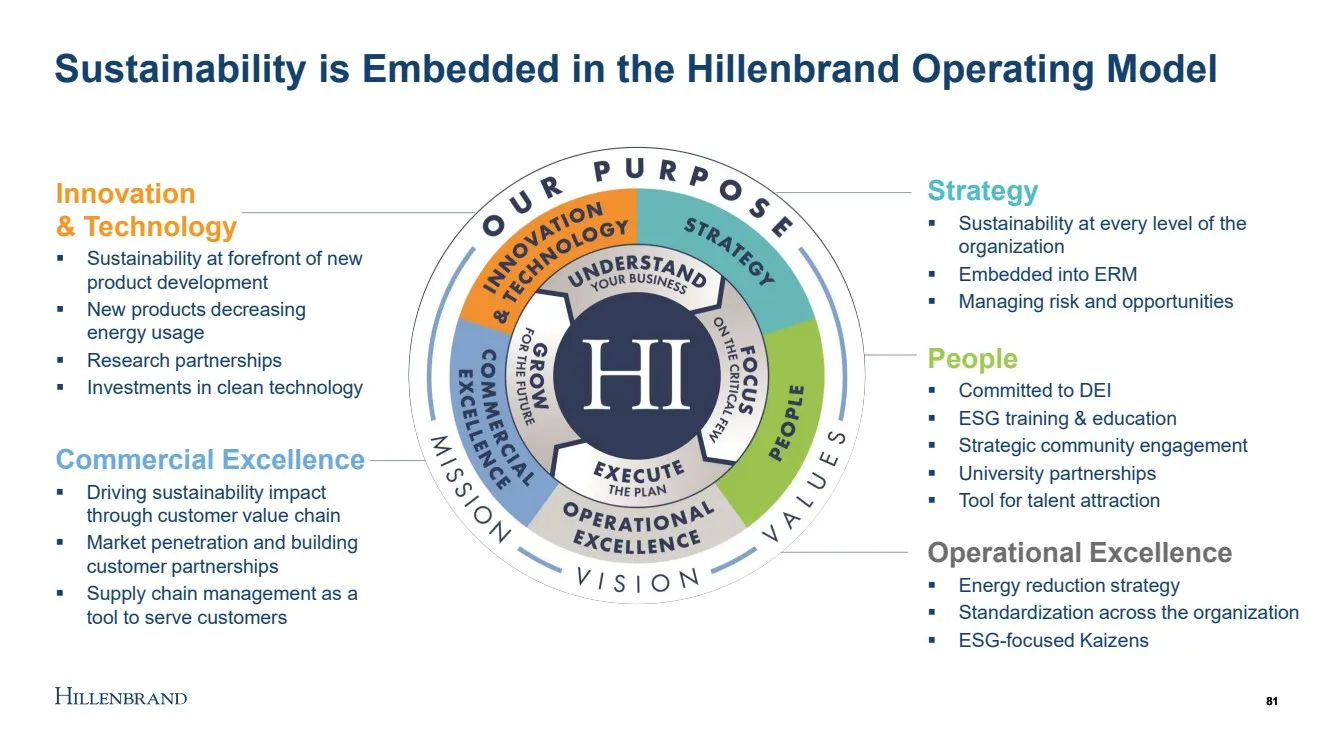
Sustainability is Embedded in the Hillenbrand Operating Model Strategy ▪ Sustainability at every level of the organization ▪ Embedded into ERM ▪ Managing risk and opportunities People ▪ Committed to DEI ▪ ESG training & education ▪ Strategic community engagement ▪ University partnerships ▪ Tool for
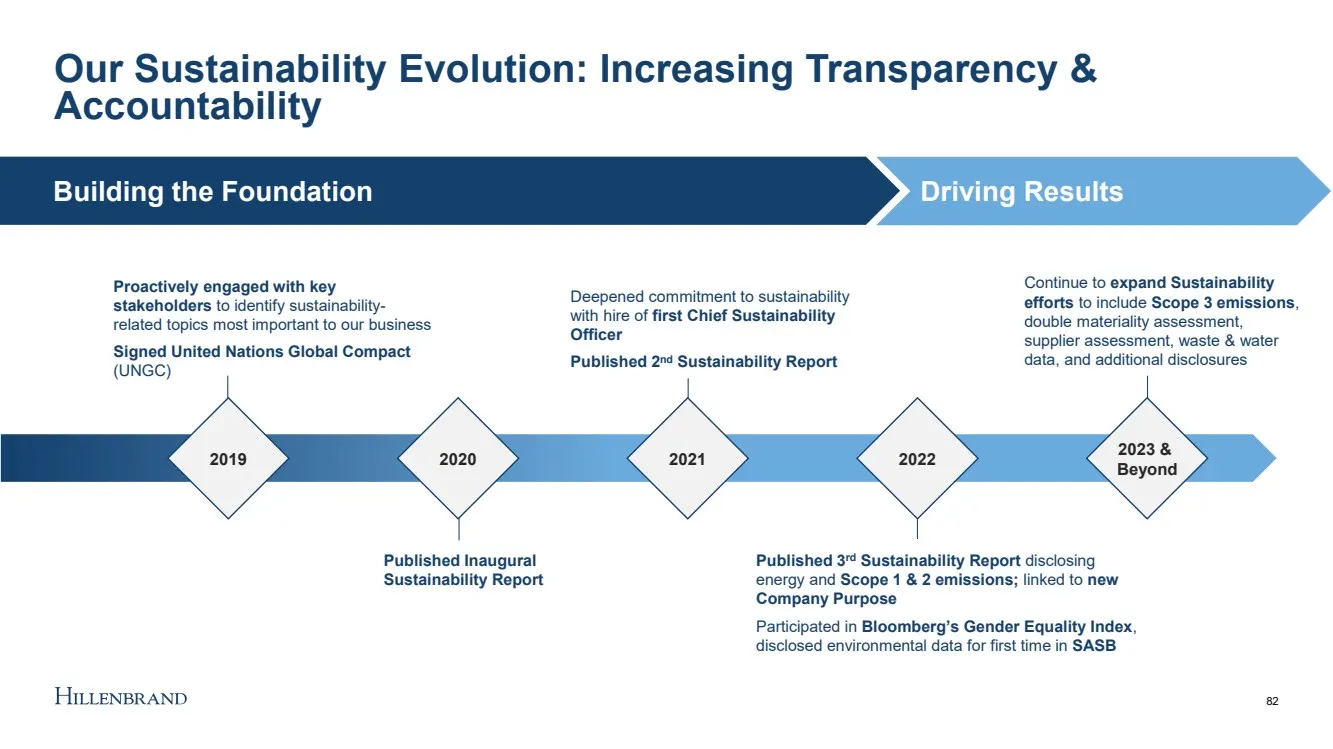
Slide 82: Our Sustainability Evolution
82 Our Sustainability Evolution: Increasing Transparency & Accountability 2019 2020 2021 2022 2023 & Beyond Proactively engaged with key stakeholders to identify sustainability - related topics most important to our business Signed United Nations Global Compact (UNGC) Deepened commitment to sustaina
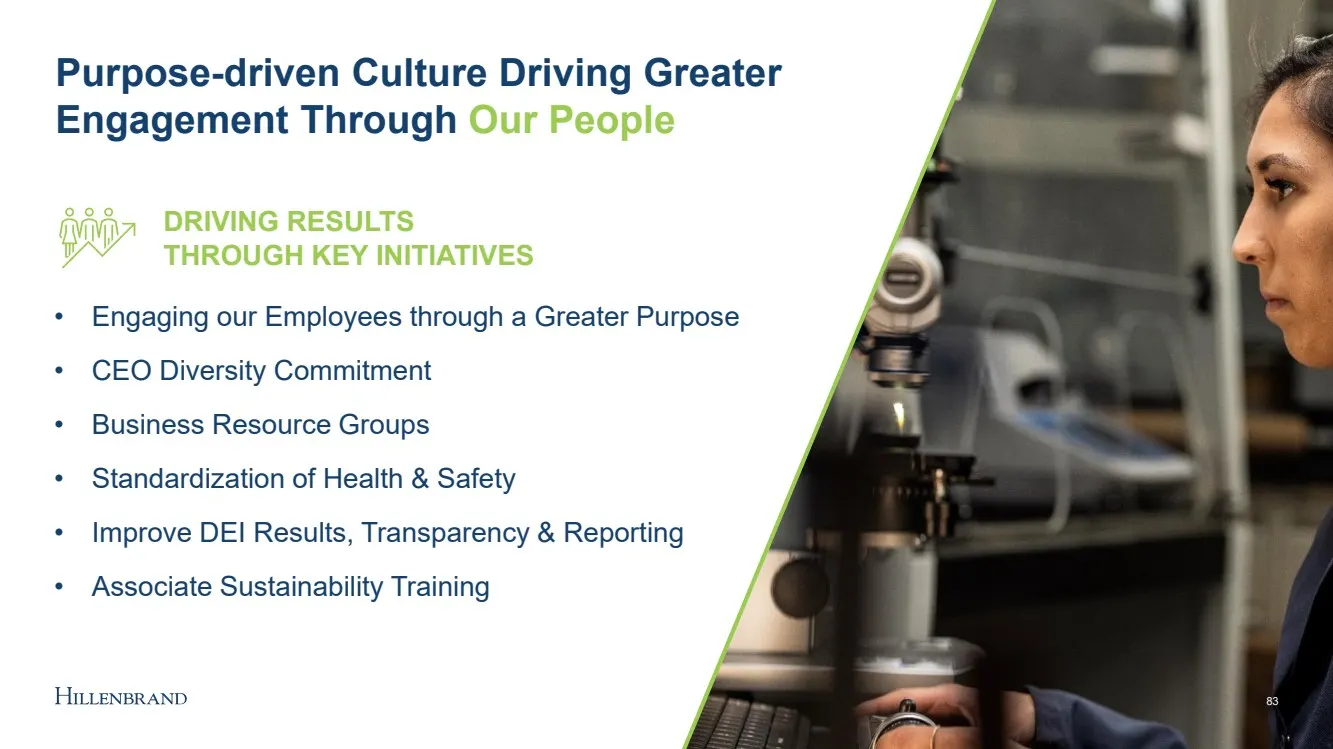
Slide 83: Driving Greater Engagement Through Our People
Purpose - driven Culture Driving Greater Engagement Through Our People 83 DRIVING RESULTS THROUGH KEY INITIATIVES • Engaging our Employees through a Greater Purpose • CEO Diversity Commitment • Business Resource Groups • Standardization of Health & Safety • Improve DEI Results, Transparency & Report
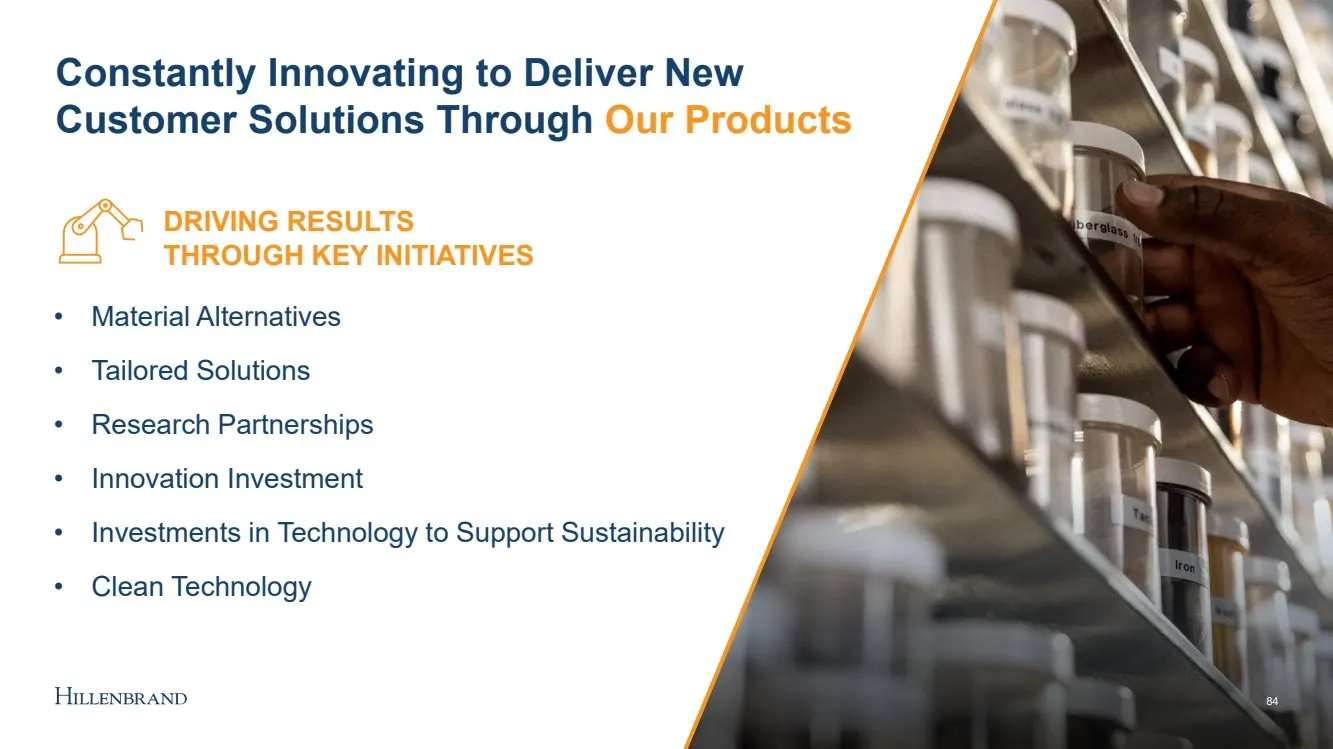
Slide 84: Delivering New Customer Solutions Through Our Products
Constantly Innovating to Deliver New Customer Solutions Through Our Products 84 DRIVING RESULTS THROUGH KEY INITIATIVES • Material Alternatives • Tailored Solutions • Research Partnerships • Innovation Investment • Investments in Technology to Support Sustainability • Clean Technology
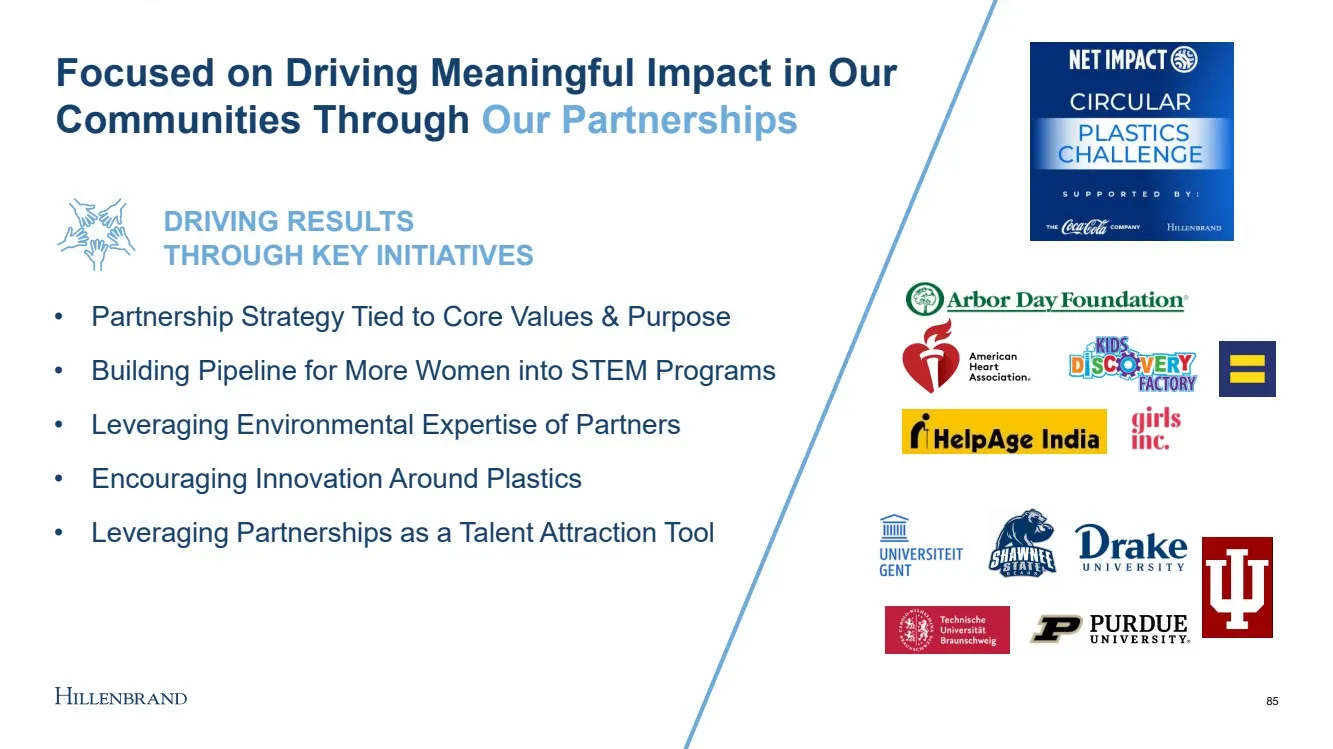
Slide 85: Driving Meaningful Impact Through Our Partnerships
85 Focused on Driving Meaningful Impact in Our Communities Through Our Partnerships DRIVING RESULTS THROUGH KEY INITIATIVES • Partnership Strategy Tied to Core Values & Purpose • Building Pipeline for More Women into STEM Programs • Leveraging Environmental Expertise of Partners • Encouraging Innova
Slide 86: Our Continued Journey & Commitment
Our Continued Journey & Commitment 86 Be accountable to Science - Based Targets by setting decarbonization goals and understanding our Scope 3 emissions Increase transparency around sustainability performance through additional disclosures and alignment with the Task Force on Climate - Related Discl
Slide 87: Key Takeaways
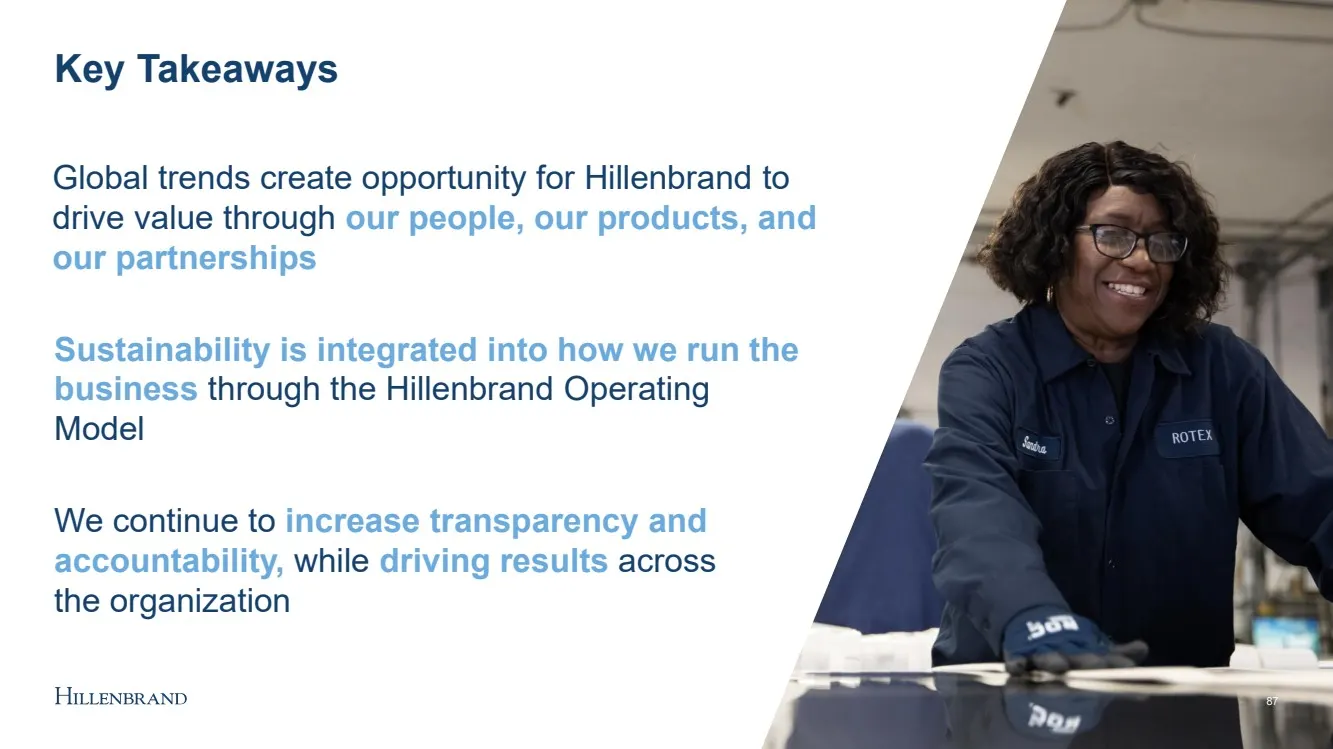
87 Key Takeaways Global trends create opportunity for Hillenbrand to drive value through our people, our products, and our partnerships Sustainability is integrated into how we run the business through the Hillenbrand Operating Model We continue to increase transparency and accountability, while dri

Slide 88: Financial Overview & Outlook
Financial Overview & Outlook Bob VanHimbergen – SVP & Chief Financial Officer 88
Slide 89: Financial Overview: What You'll Hear Today
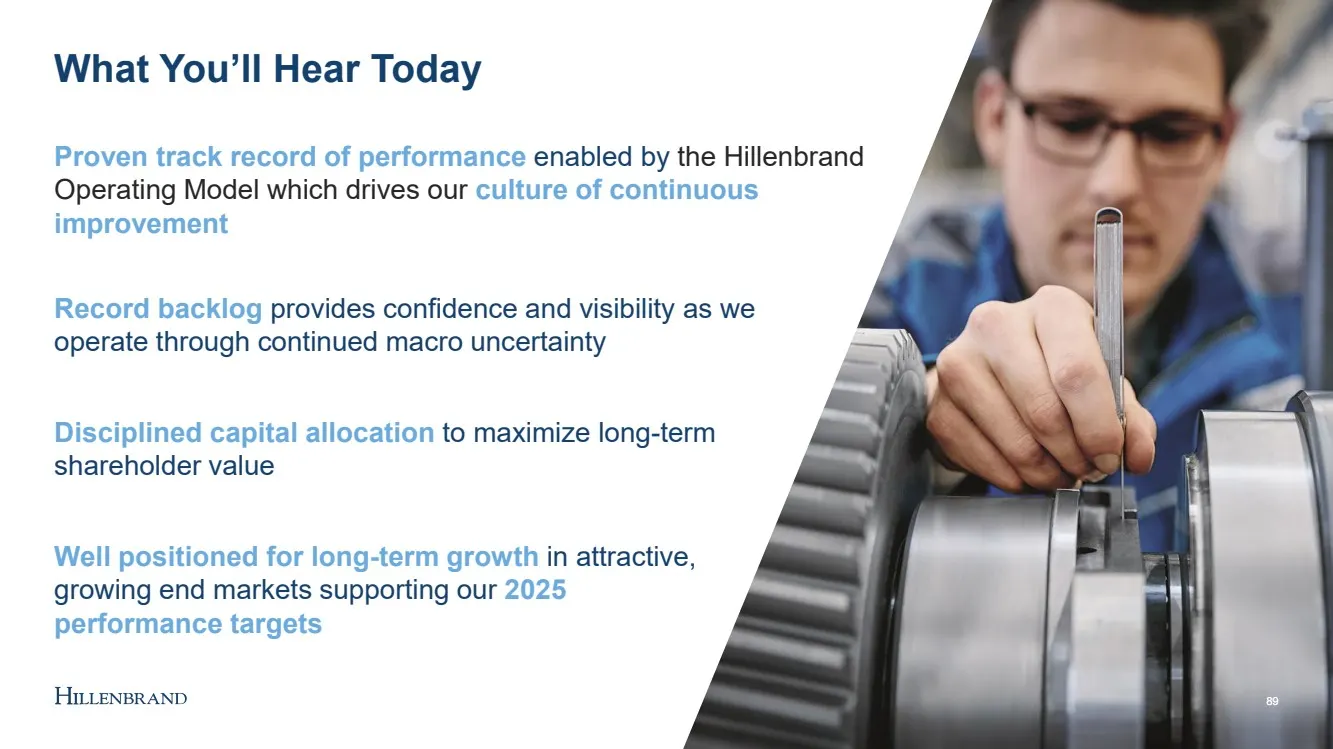
89 89 Proven track record of performance enabled by the Hillenbrand Operating Model which drives our culture of continuous improvement Well positioned for long - term growth in attractive, growing end markets supporting our 2025 performance targets Disciplined capital allocation to maximize long - t
Slide 90: Building Significant Scale and Driving Enhanced Performance through the HOM
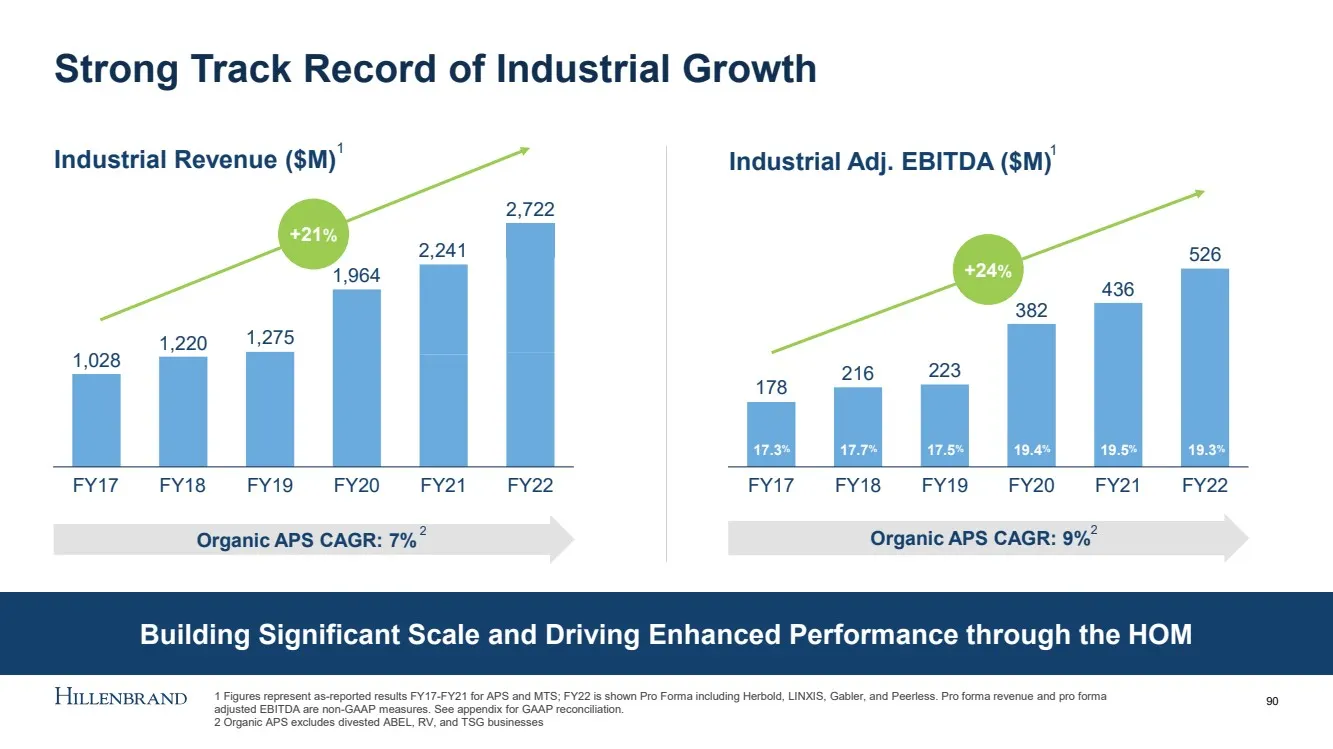
Building Significant Scale and Driving Enhanced Performance through the HOM Strong Track Record of Industrial Growth 90 Industrial Revenue ($M) Industrial Adj. EBITDA ($M) 1,028 1,220 1,275 FY17 2,241 1,964 FY20 FY21 FY22 2,722 FY18 FY19 +21 % Organic APS CAGR: 7% 178 216 223 382 436 526 FY17 FY18 F
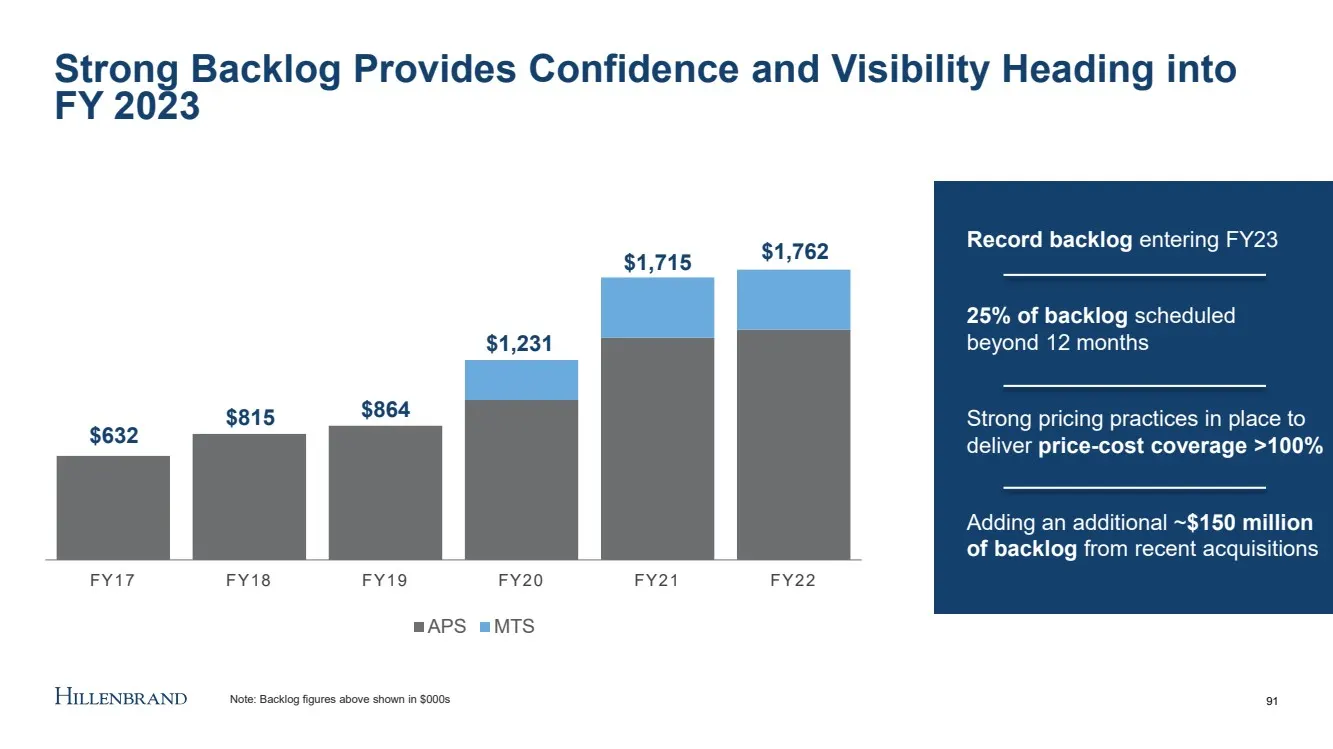
Slide 91: Strong Backlog Provides Confidence and Visibility Heading into FY 2023
FY17 FY18 FY19 FY20 FY21 FY22 APS MTS $632 $815 $864 $1,231 $1,715 $1,762 Strong Backlog Provides Confidence and Visibility Heading into FY 2023 91 Record backlog entering FY23 25% of backlog scheduled beyond 12 months Strong pricing practices in place to deliver price - cost coverage >100% Adding a
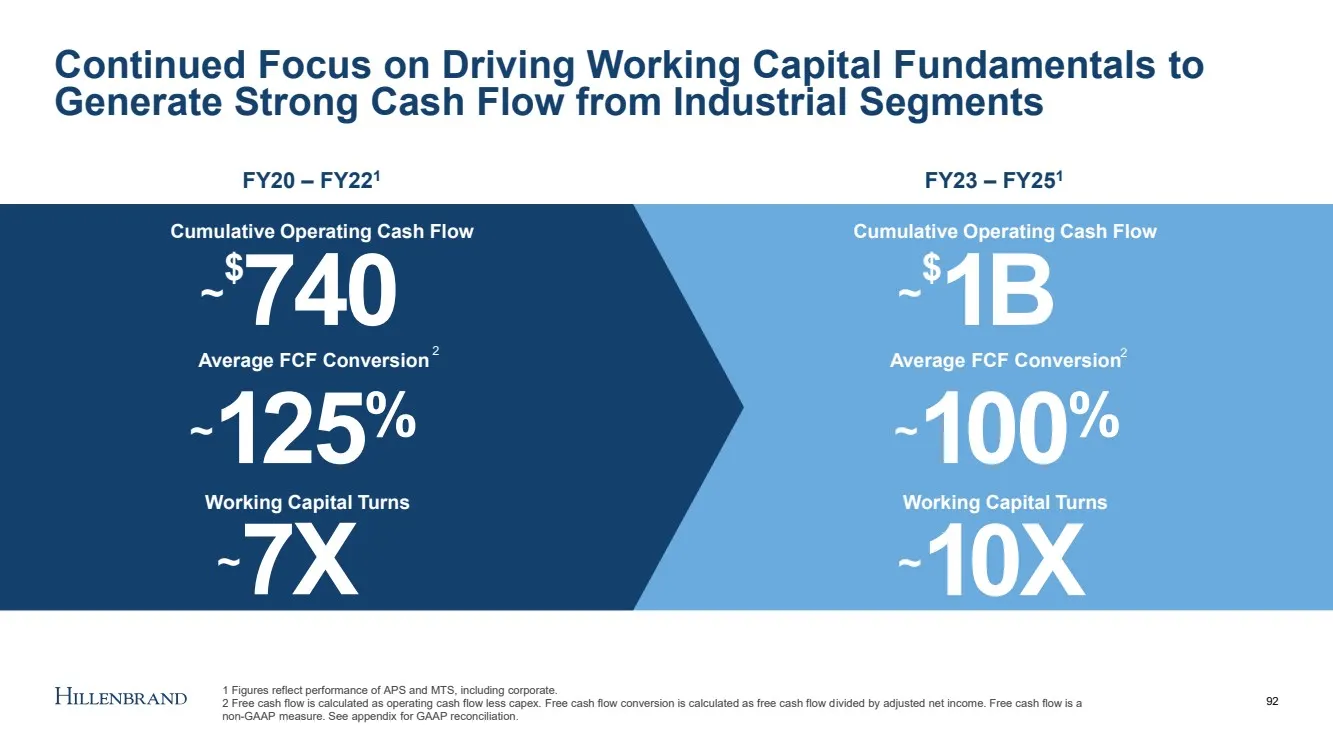
Slide 92: Driving Working Capital Fundamentals to Generate Strong Cash Flow
Continued Focus on Driving Working Capital Fundamentals to Generate Strong Cash Flow from Industrial Segments 92 FY20 – FY22 1 FY23 – FY25 1 ~ $ 740 ~ 1 25 % ~ 7X Cumulative Operating Cash Flow Average FCF Conversion Working Capital Turns ~ $ 1 B ~ 1 00 % ~ 1 0X Cumulative Operating Cash Flow Averag
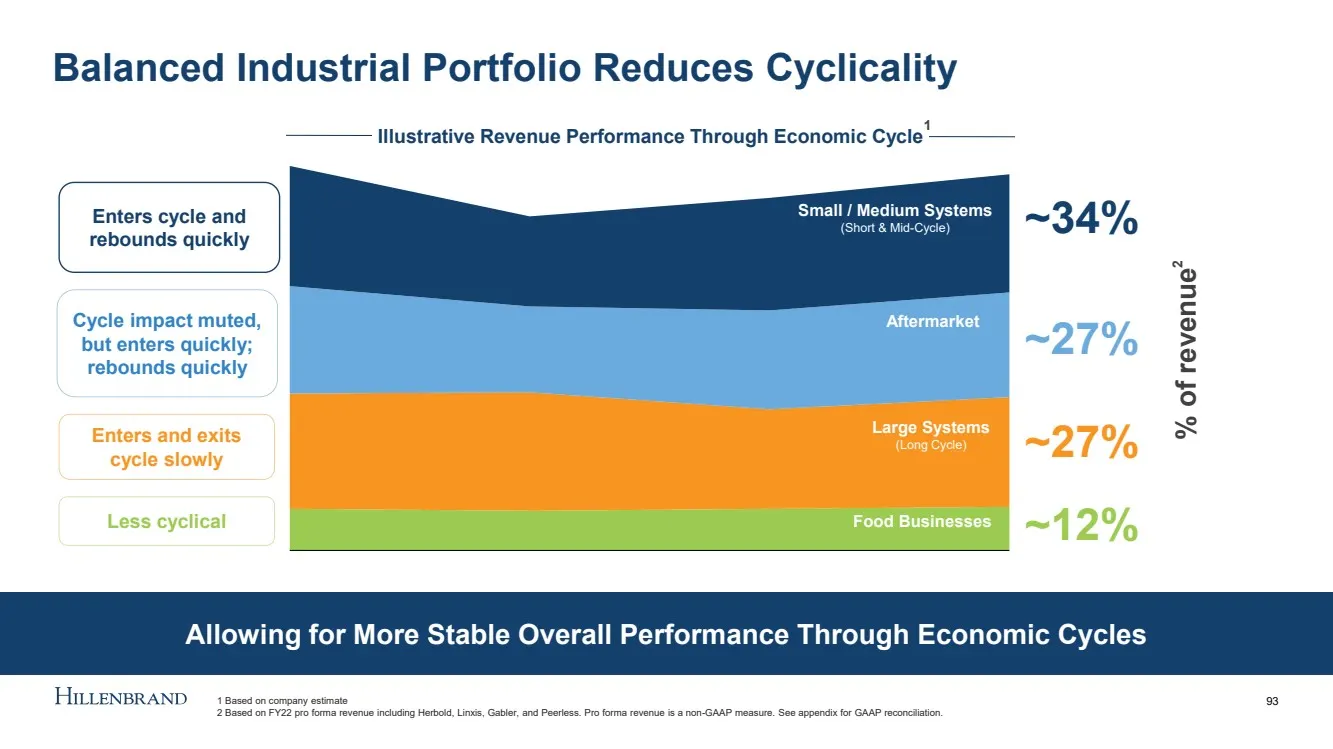
Slide 93: Balanced Industrial Portfolio Reduces Cyclicality
Allowing for More Stable Overall Performance Through Economic Cycles Balanced Industrial Portfolio Reduces Cyclicality 93 Enters cycle and rebounds quickly Cycle impact muted, but enters quickly; rebounds quickly Enters and exits cycle slowly Less cyclical (Short & Mid - Cycle) (Long - Cycle) Food B
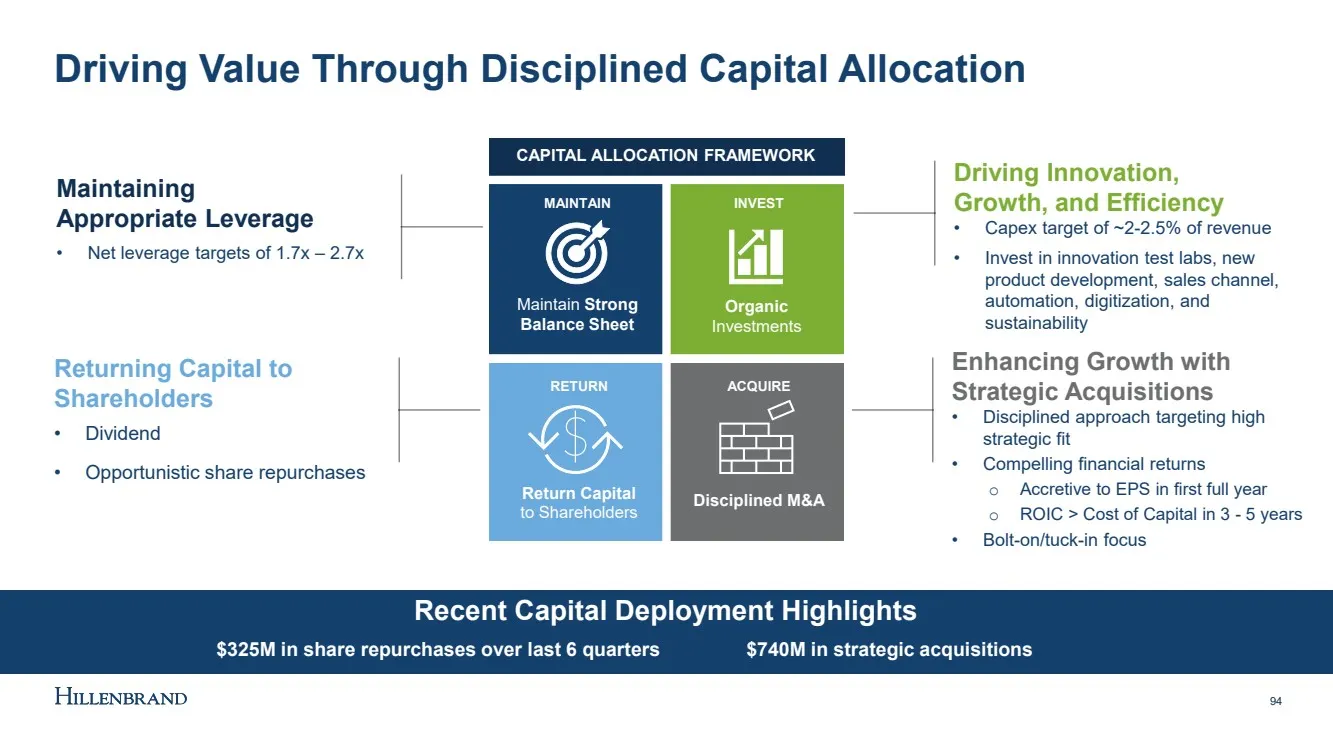
Slide 94: Driving Value Through Disciplined Capital Allocation
Driving Value Through Disciplined Capital Allocation 94 Returning Capital to Shareholders • Dividend • Opportunistic share repurchases Enhancing Growth with Strategic Acquisitions • Disciplined approach targeting high strategic fit • Compelling financial returns o Accretive to EPS in first full year
Slide 95: Committed to Maintaining Appropriate Leverage
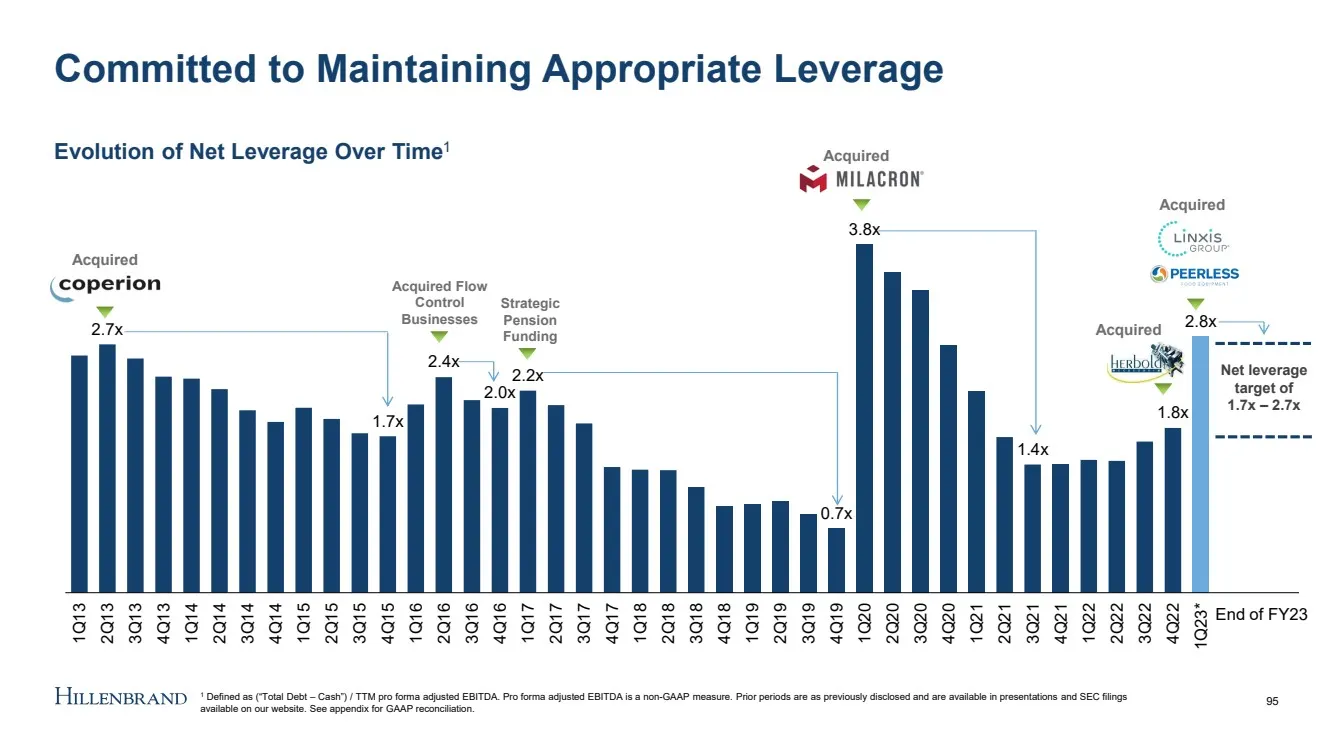
Committed to Maintaining Appropriate Leverage 2.7x 1.7x 2.4x 2.0x 2.2x 0.7x 3.8x 1.4x 1.8x 2.8x 1Q13 2Q13 3Q13 4Q13 1Q14 2Q14 3Q14 4Q14 1Q15 2Q15 3Q15 4Q15 1Q16 2Q16 3Q16 4Q16 1Q17 2Q17 3Q17 4Q17 1Q18 2Q18 3Q18 4Q18 1Q19 2Q19 3Q19 4Q19 1Q20 2Q20 3Q20 4Q20 1Q21 2Q21 3Q21 4Q21 1Q22 2Q22 3Q22 4Q22 1Q23
Slide 96: Batesville Transaction Summary
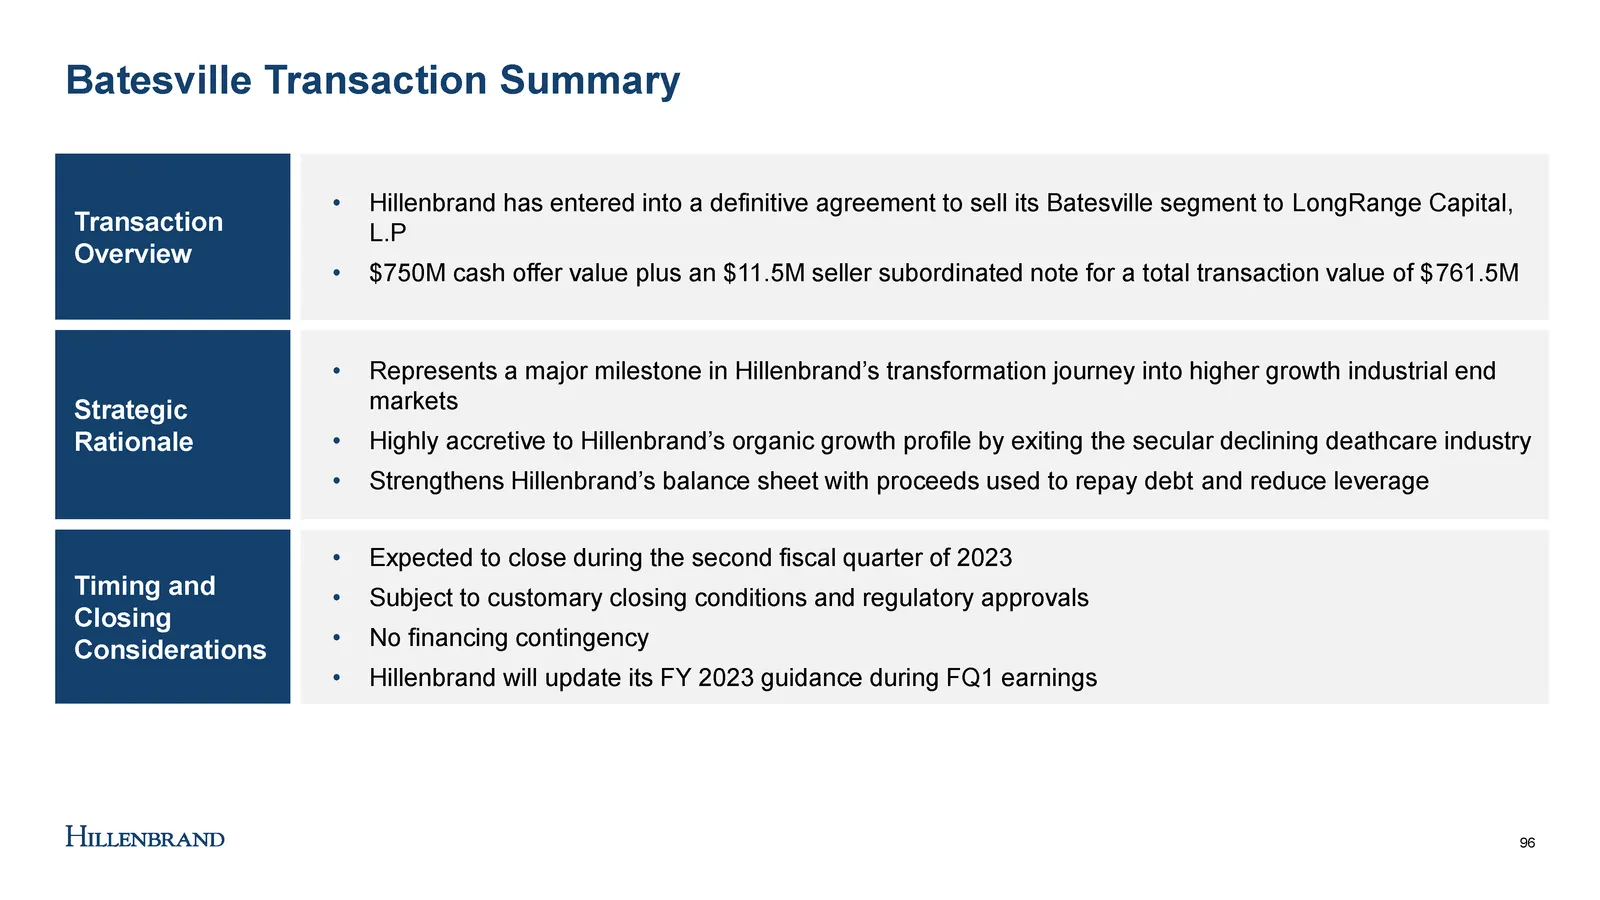
Batesville Transaction Summary 96 1 Defined as (“Total Debt – Cash”) / TTM pro forma adjusted EBITDA. Transaction Overview • Hillenbrand has entered into a definitive agreement to sell its Batesville segment to LongRange Capital, L.P • $750M cash offer value plus an $11.5M seller subordinated note f
Slide 97: FY 2025 Industrial Performance Targets
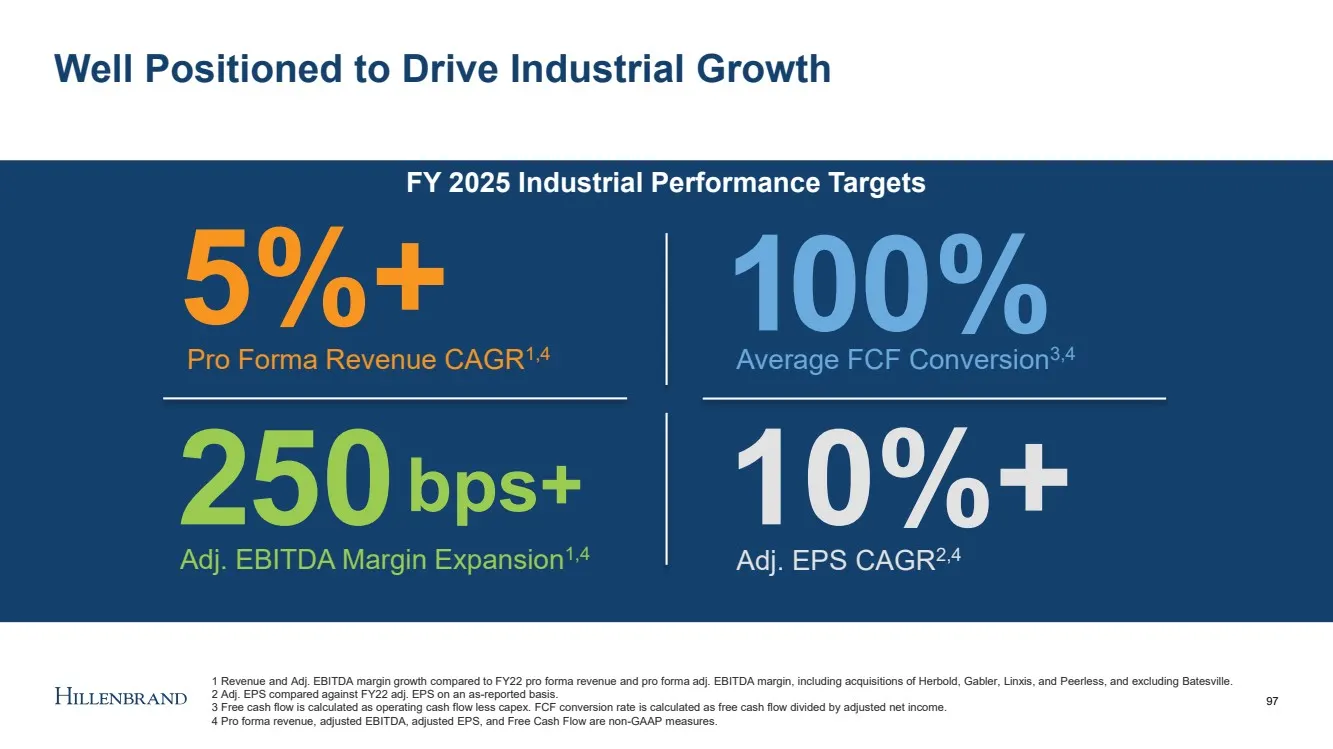
FY 2025 Industrial Performance Targets Well Positioned to Drive Industrial Growth 97 5%+ Pro Forma Revenue CAGR 1,4 2 50 Adj. EBITDA Margin Expansion 1,4 bps+ Average FCF Conversion 3,4 1 0 0% 1 Revenue and Adj. EBITDA margin growth compared to FY22 pro forma revenue and pro forma adj. EBITDA margin
Slide 98: Key Takeaways
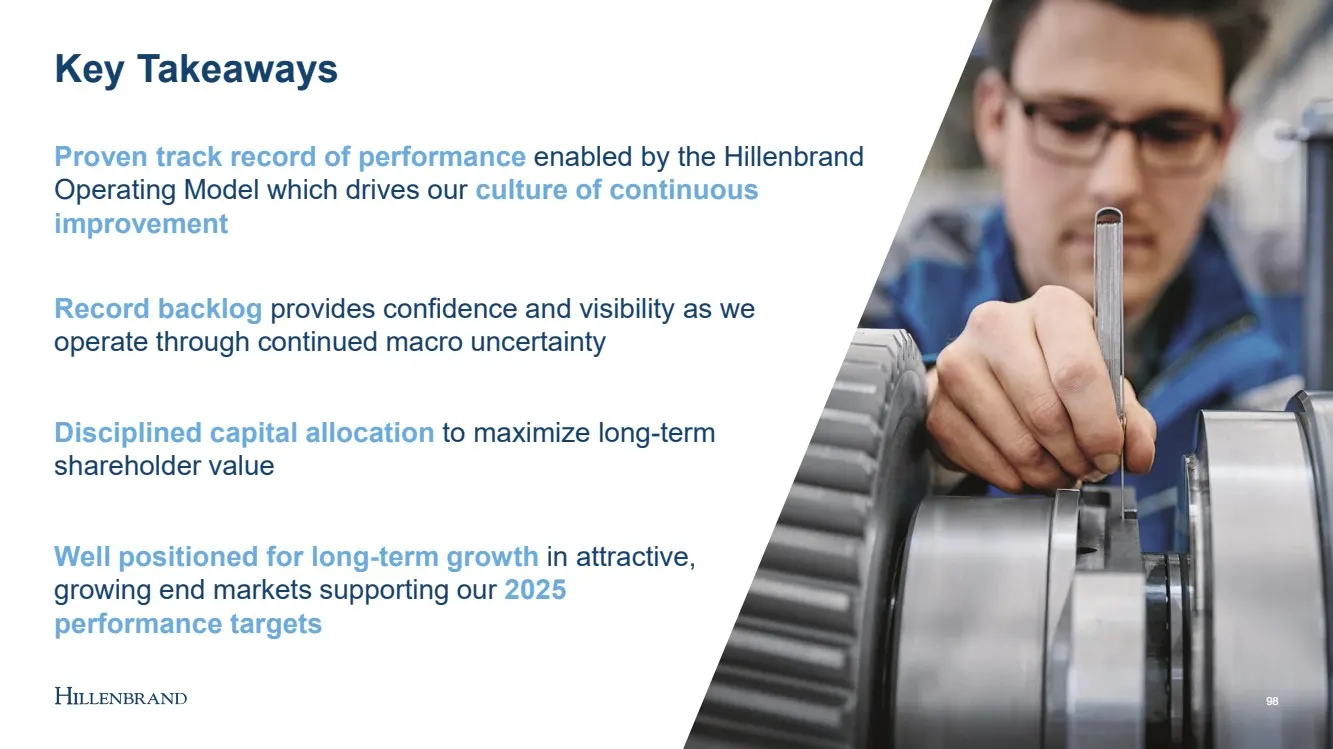
98 98 Proven track record of performance enabled by the Hillenbrand Operating Model which drives our culture of continuous improvement Well positioned for long - term growth in attractive, growing end markets supporting our 2025 performance targets Disciplined capital allocation to maximize long - t

Slide 99: Closing Remarks
Closing Remarks Kim Ryan – President & Chief Executive Officer 99
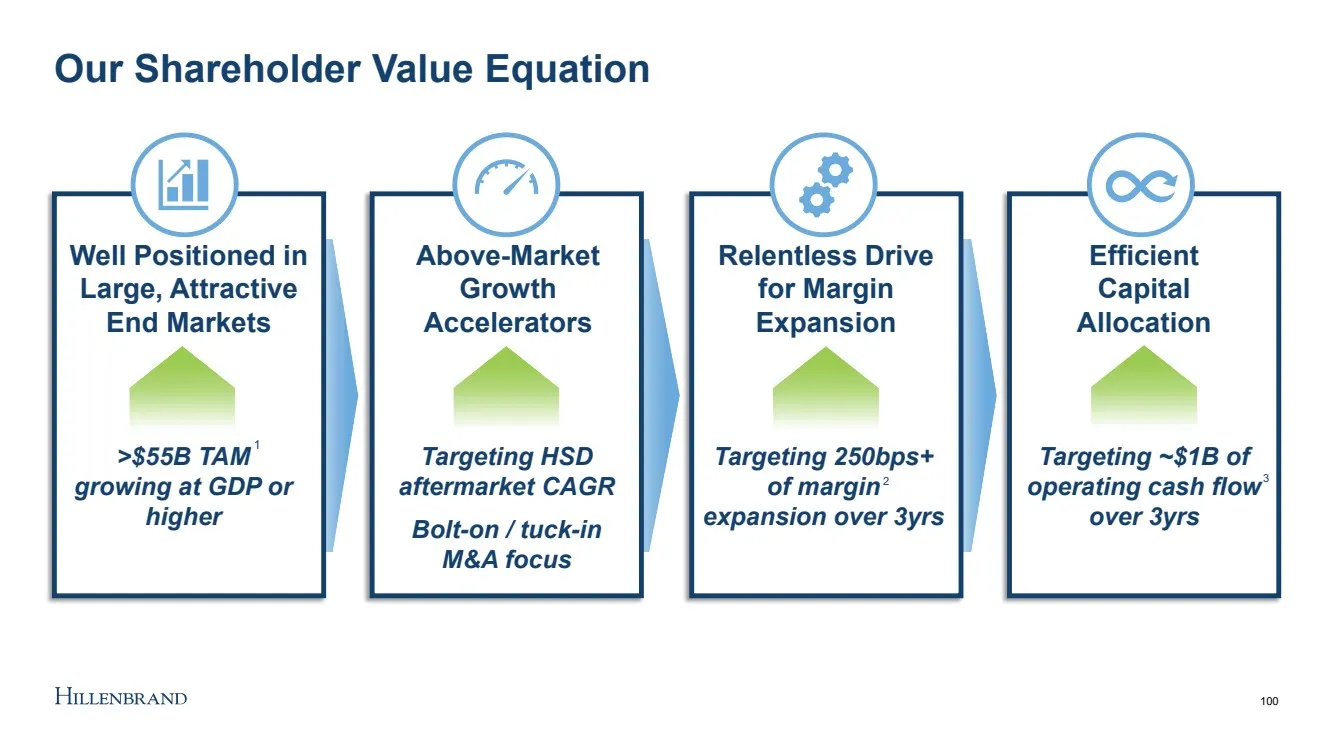
Slide 100: Our Shareholder Value Equation
Our Shareholder Value Equation 100 Well Positioned in Large, Attractive End Markets >$55B TAM growing at GDP or higher Above - Market Growth Accelerators Targeting HSD aftermarket CAGR Bolt - on / tuck - in M&A focus Relentless Drive for Margin Expansion Targeting 250bps+ of margin expansion over 3y
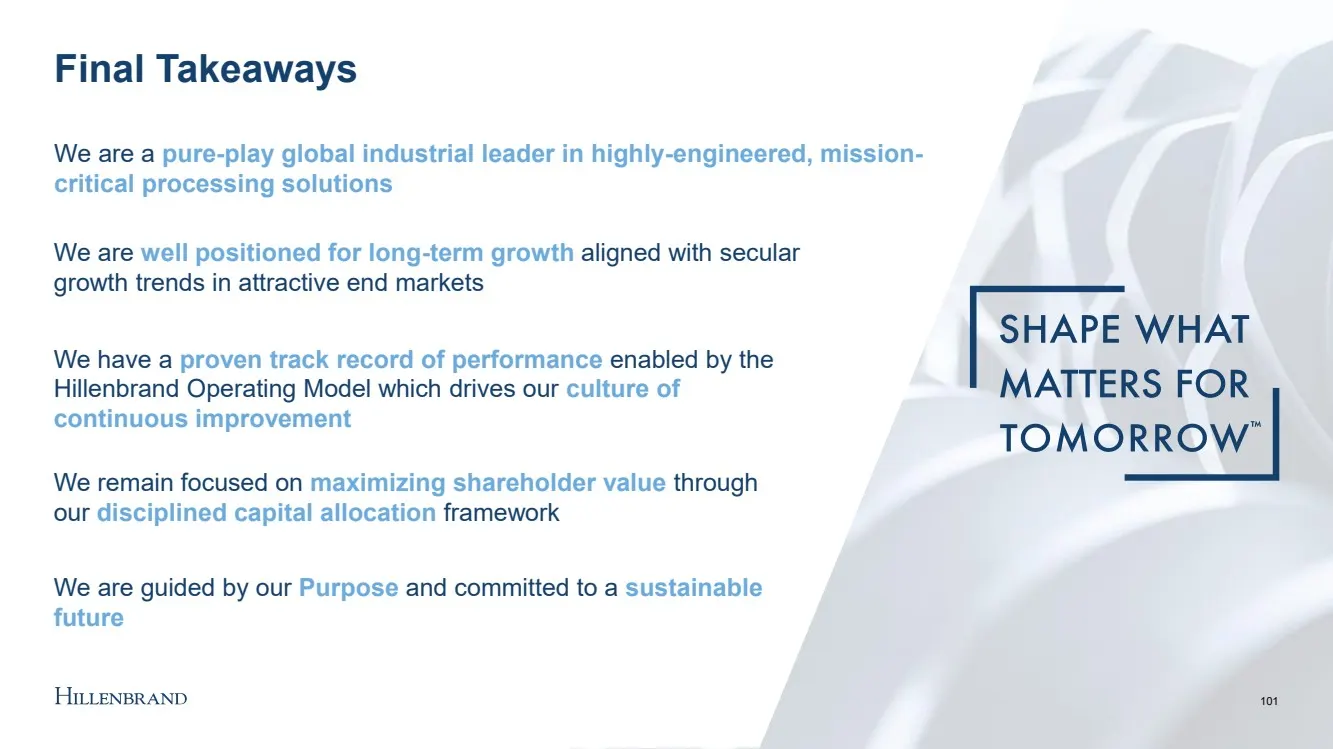
Slide 101: Final Takeaways
We are a pure - play global industrial leader in highly - engineered, mission - critical processing solutions We are well positioned for long - term growth aligned with secular growth trends in attractive end markets We have a proven track record of performance enabled by the Hillenbrand Operating M

Slide 102: 10-minute break
10-minute break ILLENBRAND

Slide 103: Q&A
Q&A All Presenters HILLENBRAND 103
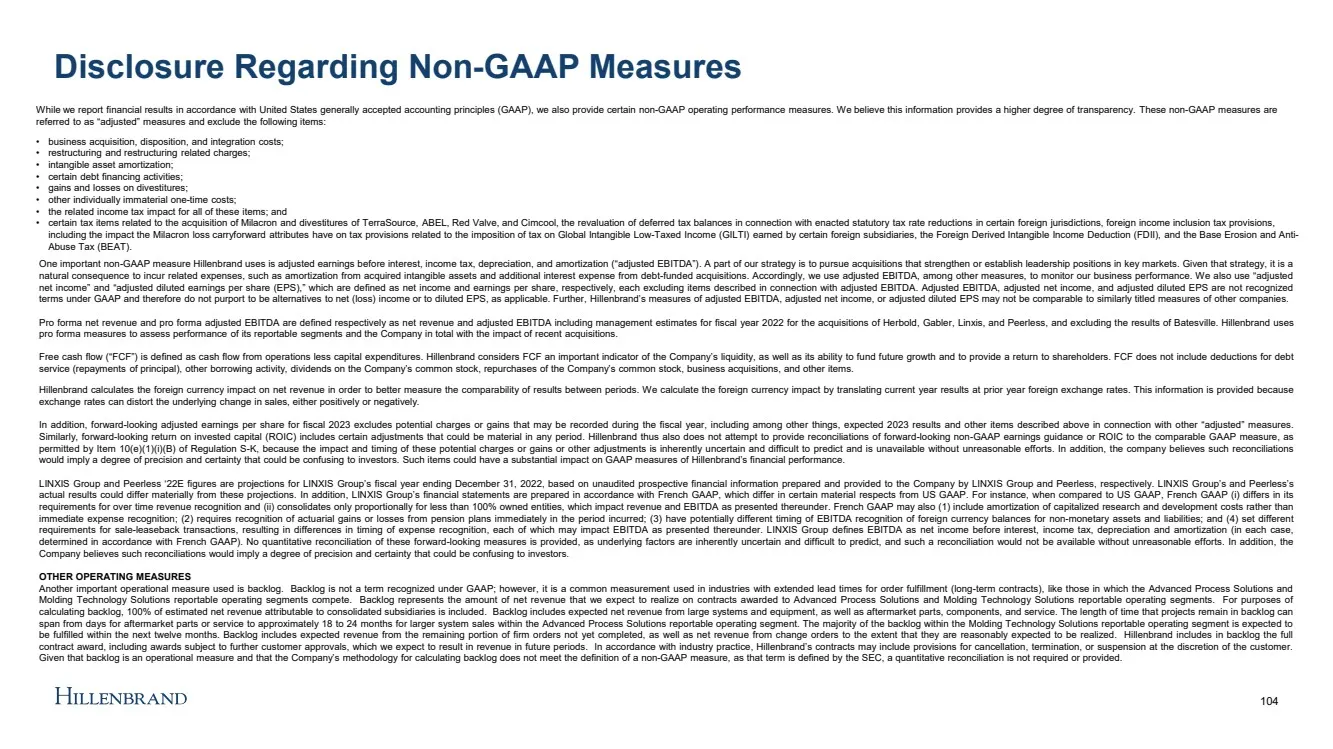
Slide 104: Disclosure Regarding Non-GAAP Measures
Disclosure Regarding Non - GAAP Measures 104 While we report financial results in accordance with United States generally accepted accounting principles (GAAP), we also p rov ide certain non - GAAP operating performance measures. We believe this information provides a higher degree of transparency.
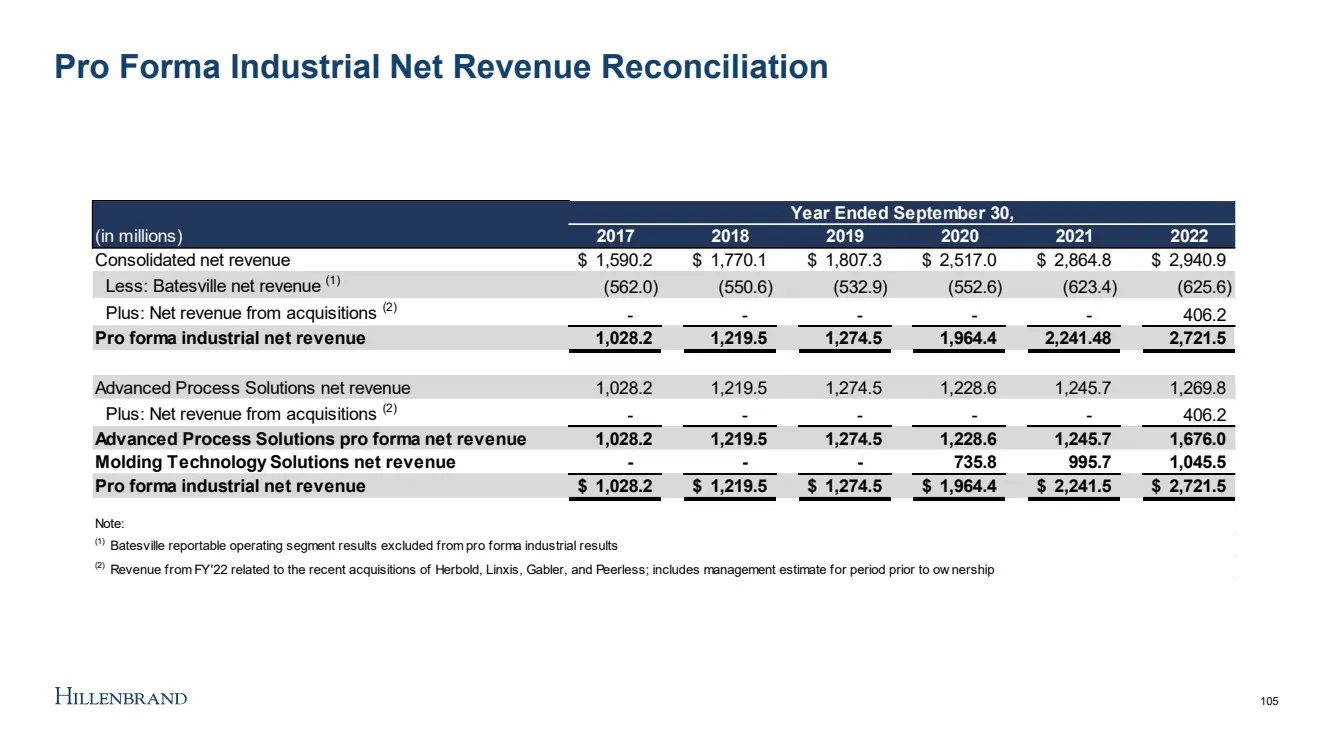
Slide 105: Pro Forma Industrial Net Revenue Reconciliation
Pro Forma Industrial Net Revenue Reconciliation (in millions) 2017 2018 2019 2020 2021 2022 Consolidated net revenue 1,590.2 $ 1,770.1 $ 1,807.3 $ 2,517.0 $ 2,864.8 $ 2,940.9 $ Less: Batesville net revenue (1) (562.0) (550.6) (532.9) (552.6) (623.4) (625.6) Plus: Net revenue from acquisitions (2) -
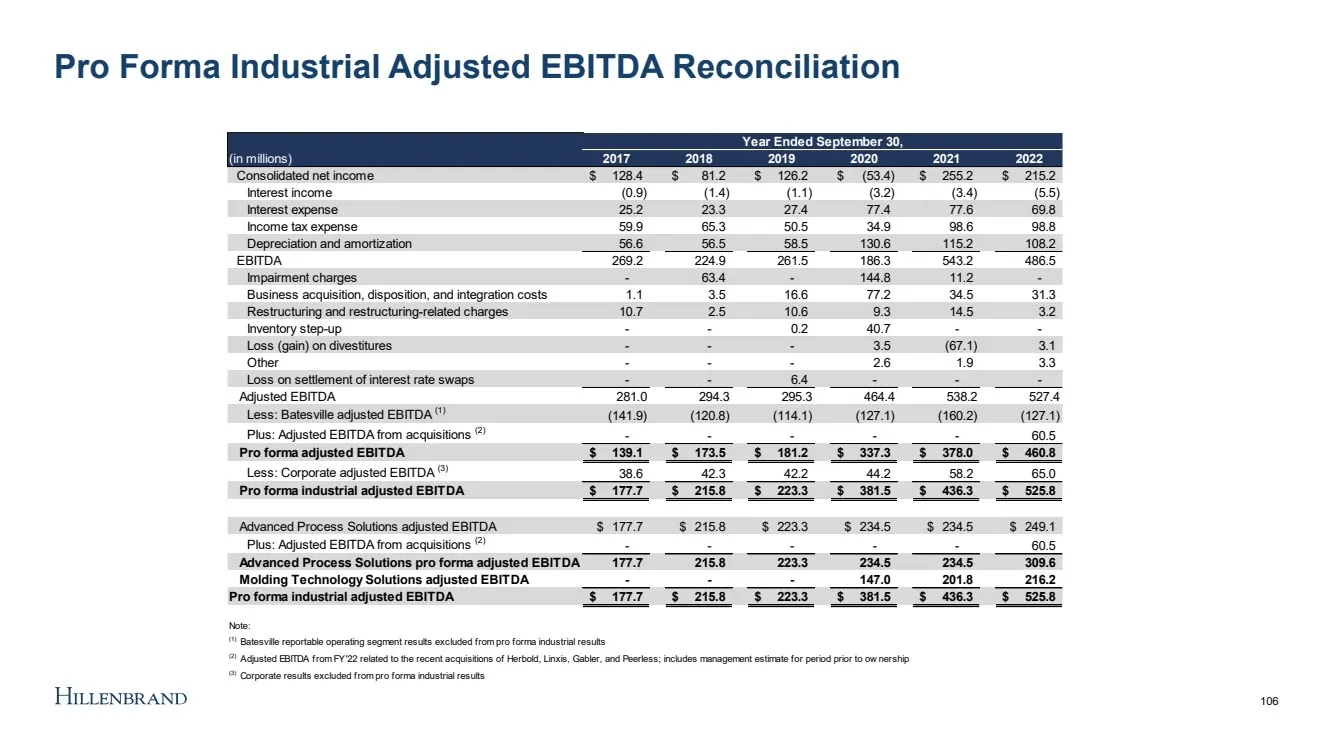
Slide 106: Pro Forma Industrial Adjusted EBITDA Reconciliation
Pro Forma Industrial Adjusted EBITDA Reconciliation (in millions) 2017 2018 2019 2020 2021 2022 Consolidated net income 128.4 $ 81.2 $ 126.2 $ (53.4) $ 255.2 $ 215.2 $ Interest income (0.9) (1.4) (1.1) (3.2) (3.4) (5.5) Interest expense 25.2 23.3 27.4 77.4 77.6 69.8 Income tax expense 59.9 65.3 50.5
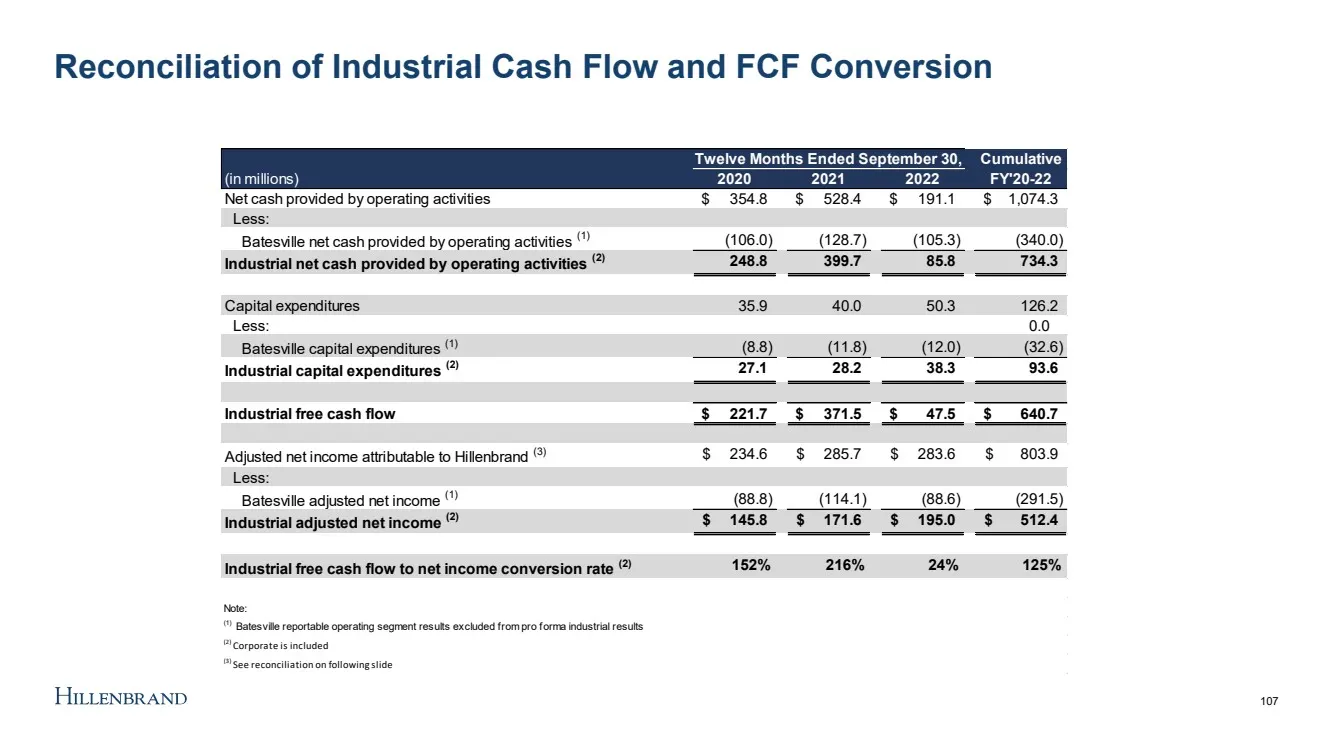
Slide 107: Reconciliation of Industrial Cash Flow and FCF Conversion
Reconciliation of Industrial Cash Flow and FCF Conversion Cumulative (in millions) 2020 2021 2022 FY'20-22 Net cash provided by operating activities 354.8 $ 528.4 $ 191.1 $ 1,074.3 $ Less: Batesville net cash provided by operating activities (1) (106.0) (128.7) (105.3) (340.0) Industrial net cash pr
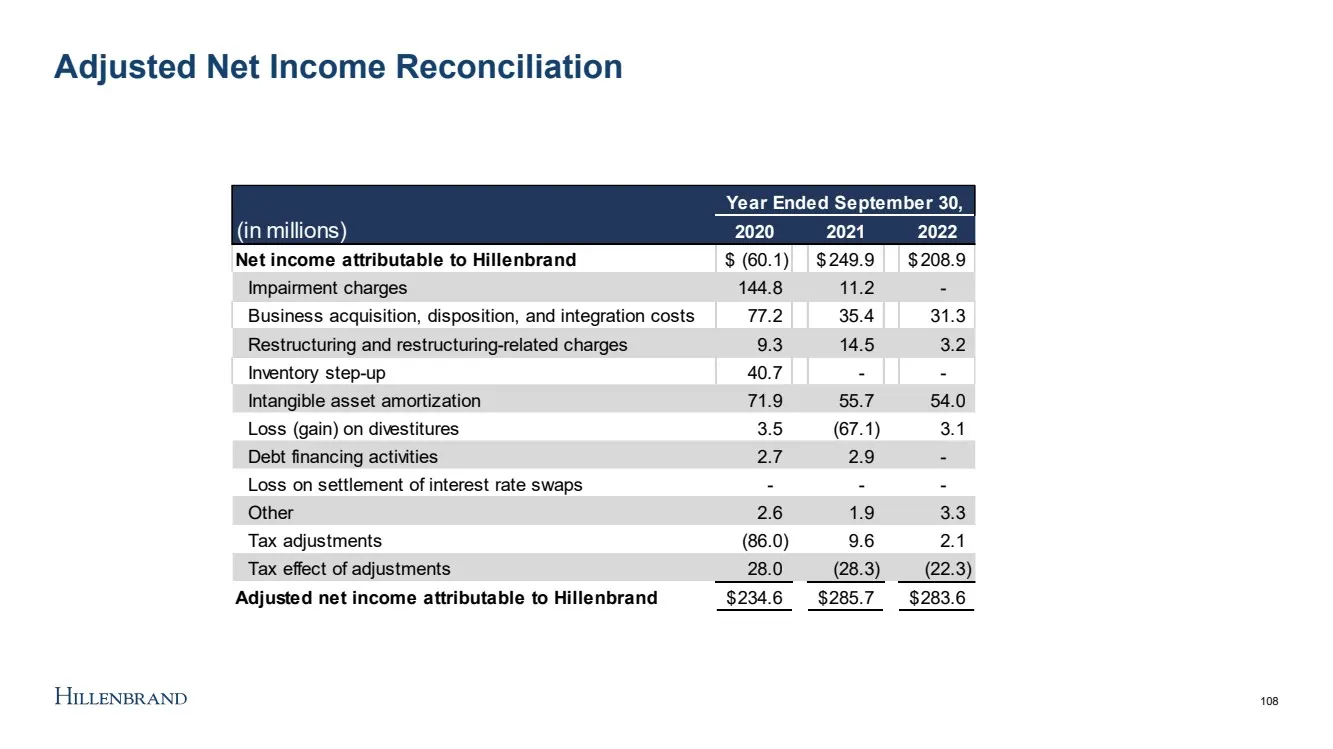
Slide 108: Adjusted Net Income Reconciliation
Adjusted Net Income Reconciliation (in millions) 2020 2021 2022 Net income attributable to Hillenbrand (60.1) $ 249.9 $ 208.9 $ Impairment charges 144.8 11.2 - Business acquisition, disposition, and integration costs 77.2 35.4 31.3 Restructuring and restructuring-related charges 9.3 14.5 3.2 Invento
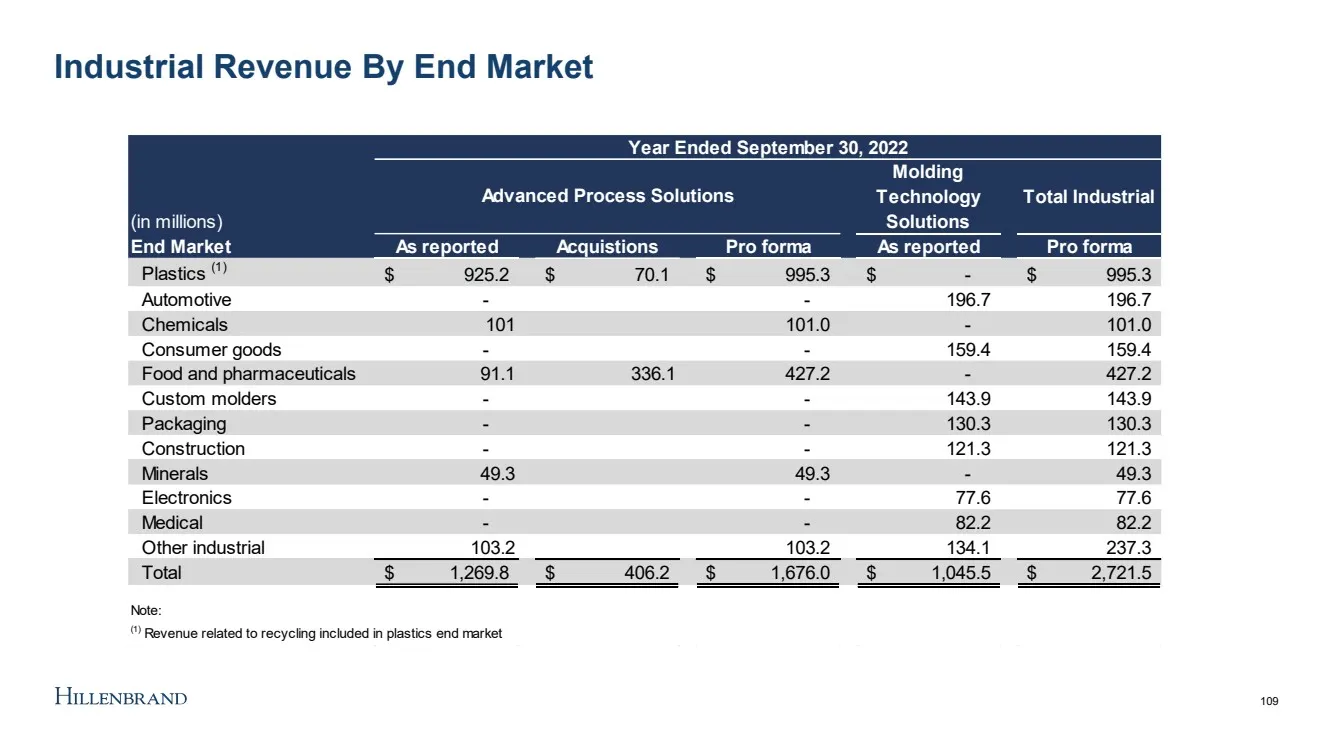
Slide 109: Industrial Revenue By End Market
Industrial Revenue By End Market (in millions) Molding Technology Solutions Total Industrial End Market As reported Acquistions Pro forma As reported Pro forma Plastics (1) 925.2 $ 70.1 $ 995.3 $ - $ 995.3 $ Automotive - - 196.7 196.7 Chemicals 101 101.0 - 101.0 Consumer goods - - 159.4 159.4 Food a
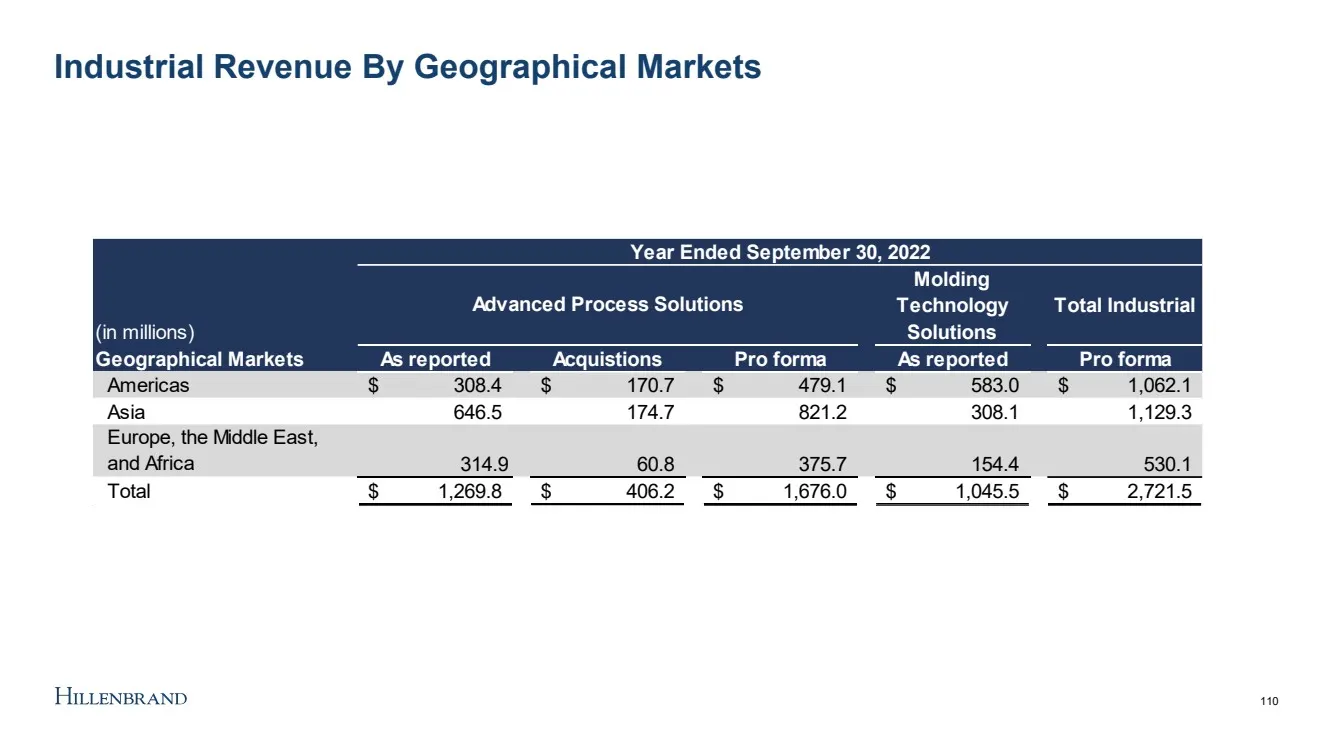
Slide 110: Industrial Revenue By Geographical Markets
Industrial Revenue By Geographical Markets (in millions) Molding Technology Solutions Total Industrial Geographical Markets As reported Acquistions Pro forma As reported Pro forma Americas 308.4 $ 170.7 $ 479.1 $ 583.0 $ 1,062.1 $ Asia 646.5 174.7 821.2 308.1 1,129.3 Europe, the Middle East, and Afr
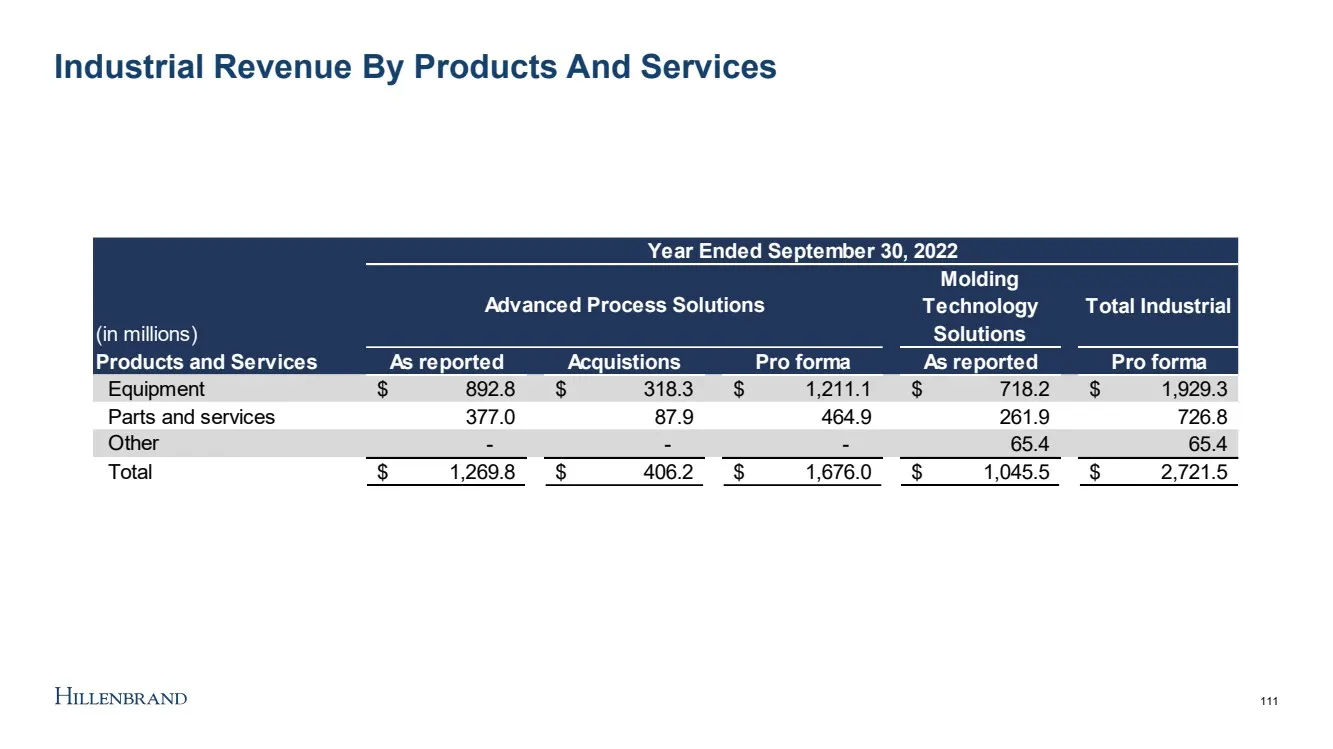
Slide 111: Industrial Revenue By Products And Services
Industrial Revenue By Products And Services (in millions) Molding Technology Solutions Total Industrial Products and Services As reported Acquistions Pro forma As reported Pro forma Equipment 892.8 $ 318.3 $ 1,211.1 $ 718.2 $ 1,929.3 $ Parts and services 377.0 87.9 464.9 261.9 726.8 Other - - - 65.4
Source: SEC EDGAR · 8-K filed Dec 15, 2022
More decks from Hillenbrand Inc
 Q3 2025 Earnings Presentation25 slides · Aug 12, 2025
 Q2 2025 Earnings Presentation22 slides · Apr 30, 2025
 Q1 2025 Earnings Presentation20 slides · Feb 6, 2025
 Q4 2024 Earnings Presentation19 slides · Nov 14, 2024
 Q3 2024 Earnings Presentation20 slides · Aug 8, 2024
 Q2 2024 Earnings Presentation21 slides · May 1, 2024