Sembcorp Industries Ltd. · SGX:U96
Sembcorp Industries — H1 2016 Earnings Presentation
21 slides from Sembcorp Industries's earnings presentation, Aug 2, 2016
Slide 1: 1H2016 Results Announcement
1H2016 Results Announcement August 2, 2016 © Sembcorp Industries 2016 Scope of Presentation • CEO’s Report • Financial Review • Group Outlook © Sembcorp Industries 2016 2
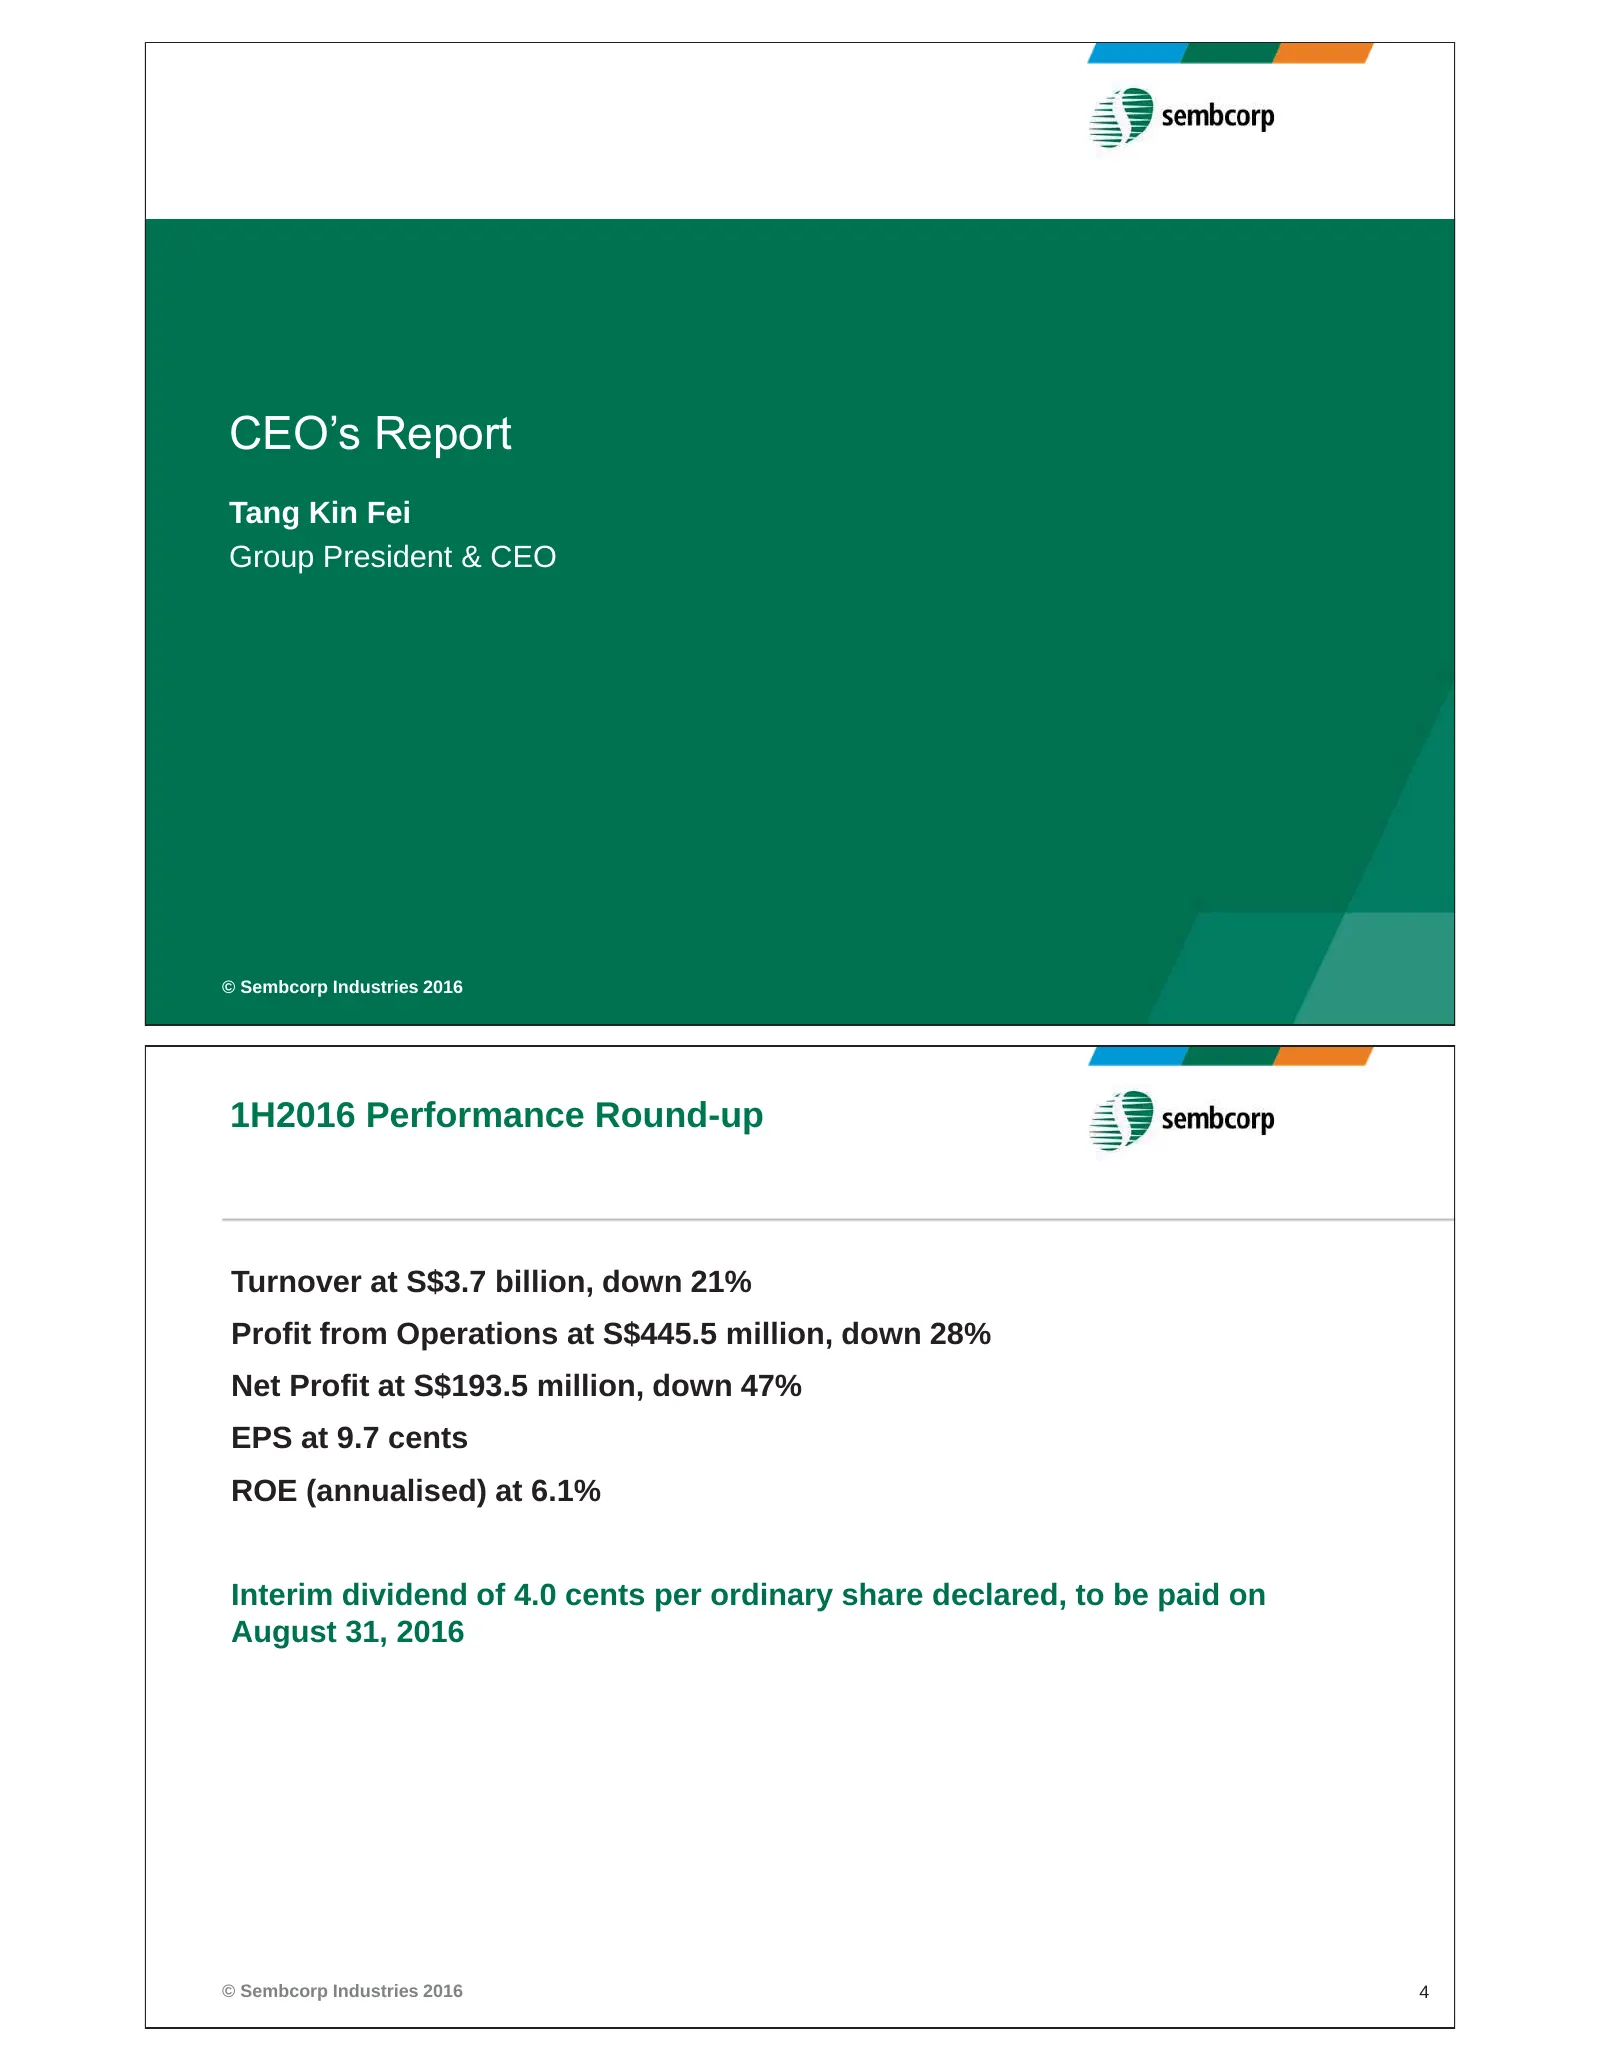
Slide 2: 1H2016 Performance Round-up
CEO’s Report Tang Kin Fei Group President & CEO © Sembcorp Industries 2016 1H2016 Performance Round-up Turnover at S$3.7 billion, down 21% Profit from Operations at S$445.5 million, down 28% Net Profit at S$193.5 million, down 47% EPS at 9.7 cents ROE (annualised) at 6.1% Interim dividend of 4.0 cen
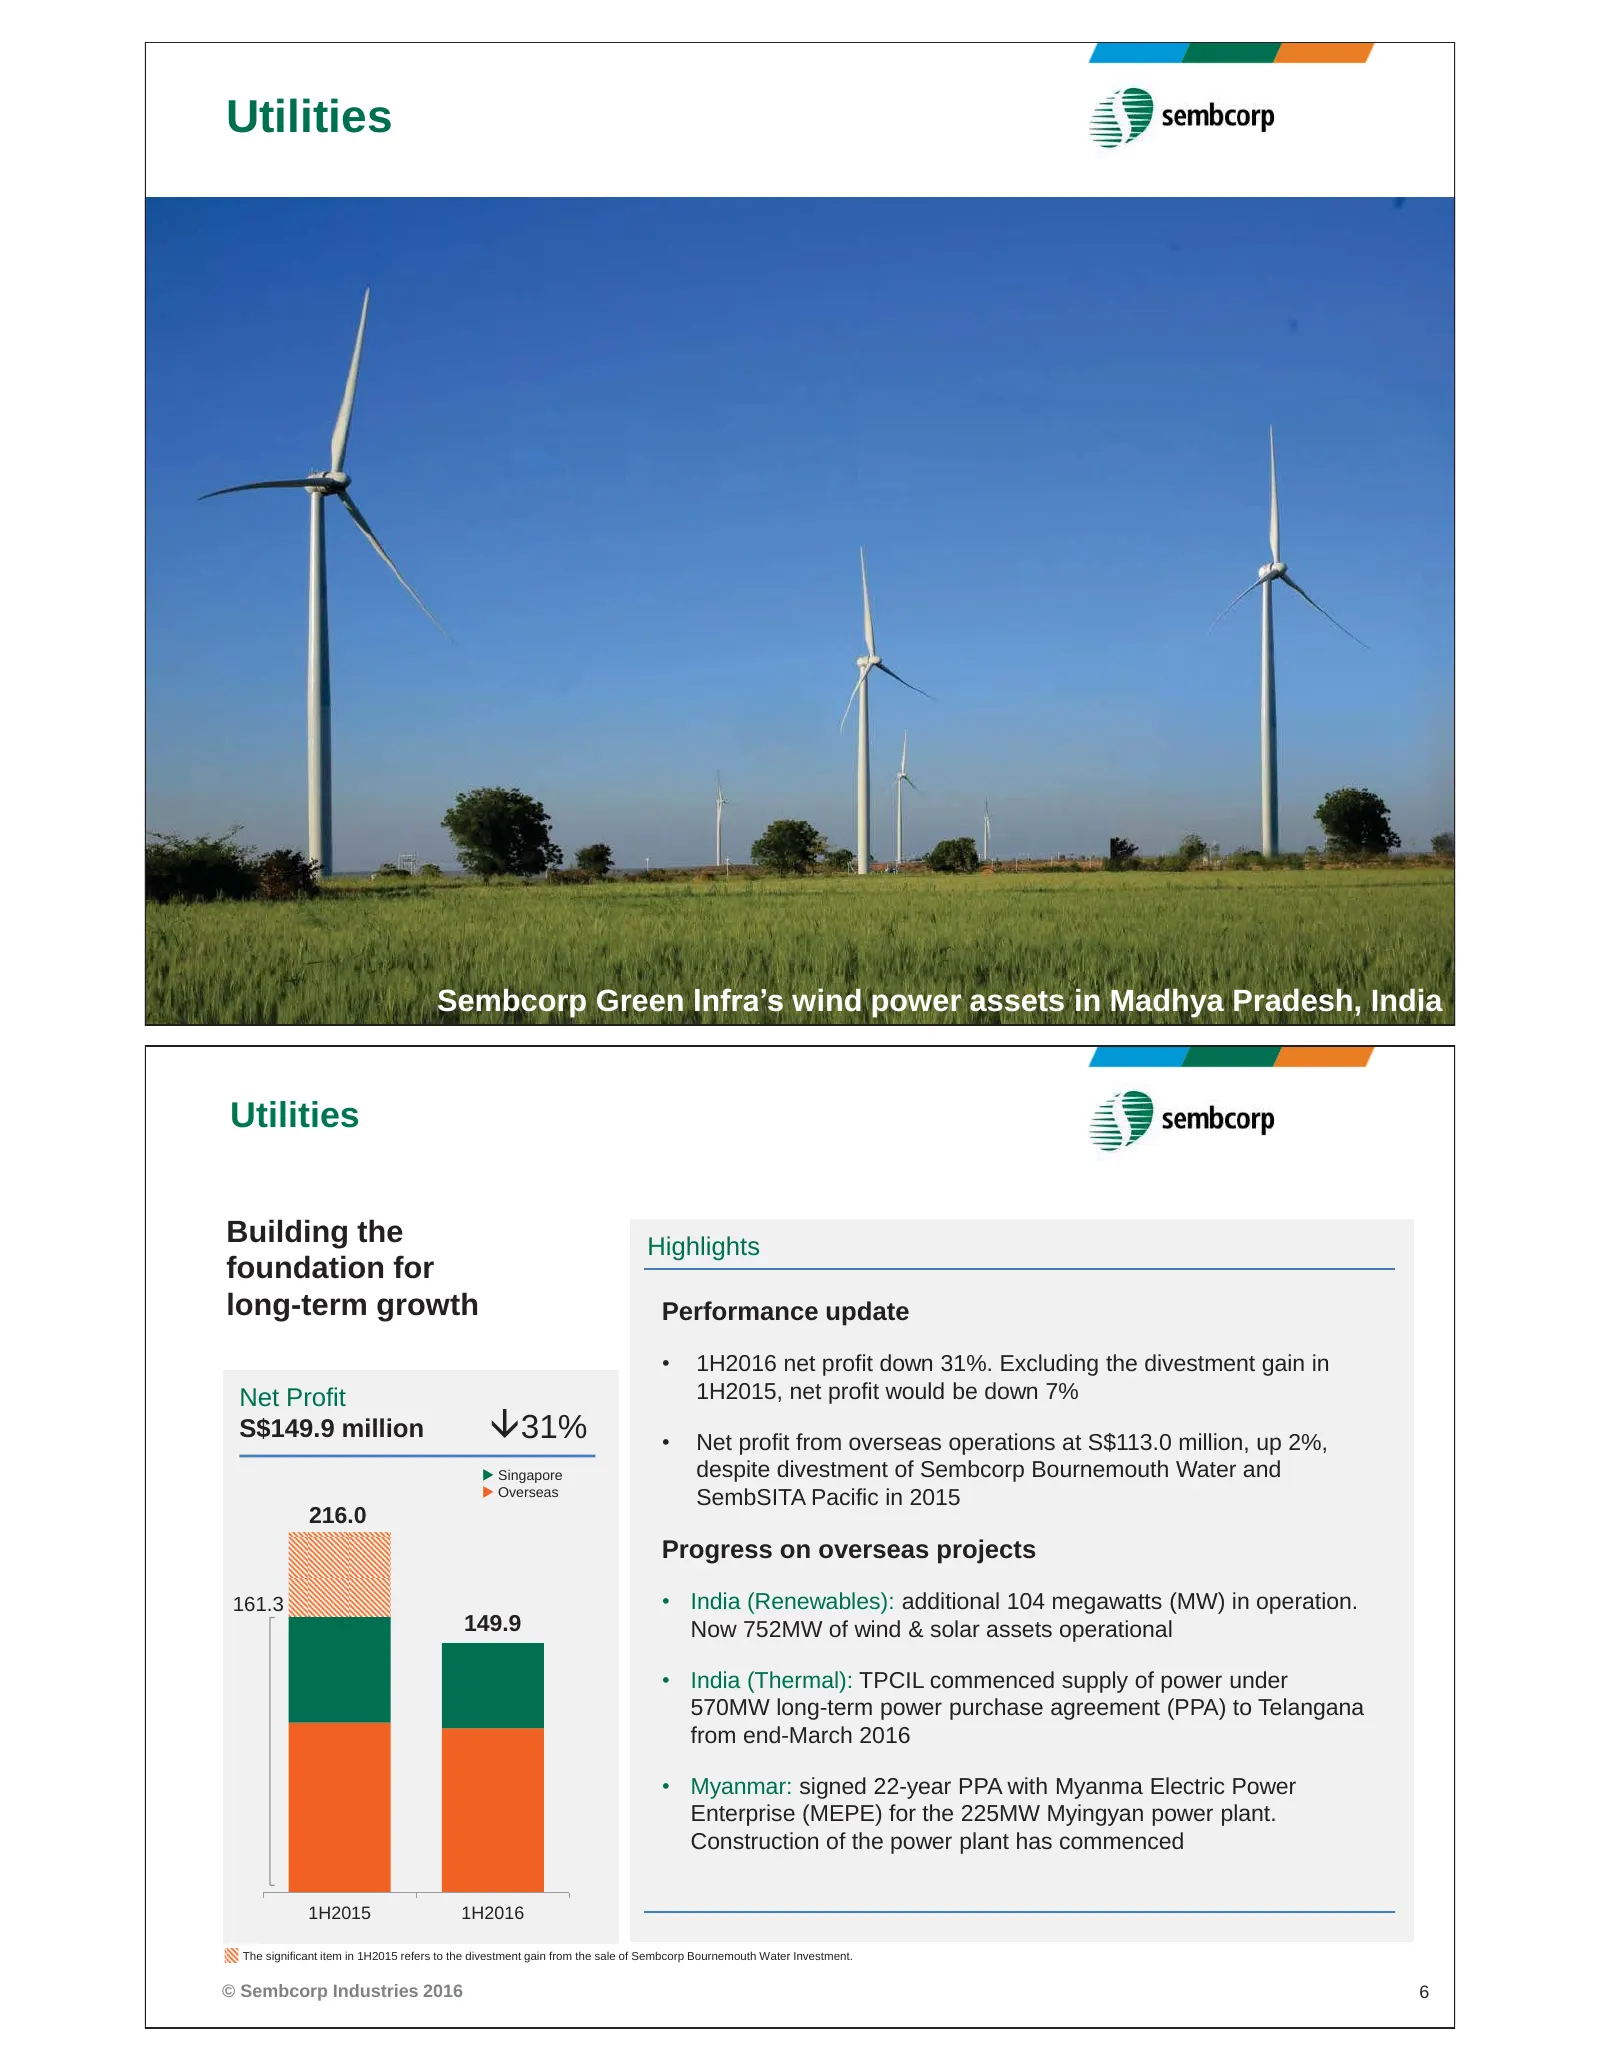
Slide 3: Utilities
Utilities © Sembcorp Industries 2016 5 Sembcorp Green Infra’s wind power assets in Madhya Pradesh, India Utilities Building the Highlights foundation for long-term growth Performance update • 1H2016 net profit down 31%. Excluding the divestment gain in Net Profit 1H2015, net profit would be down 7%
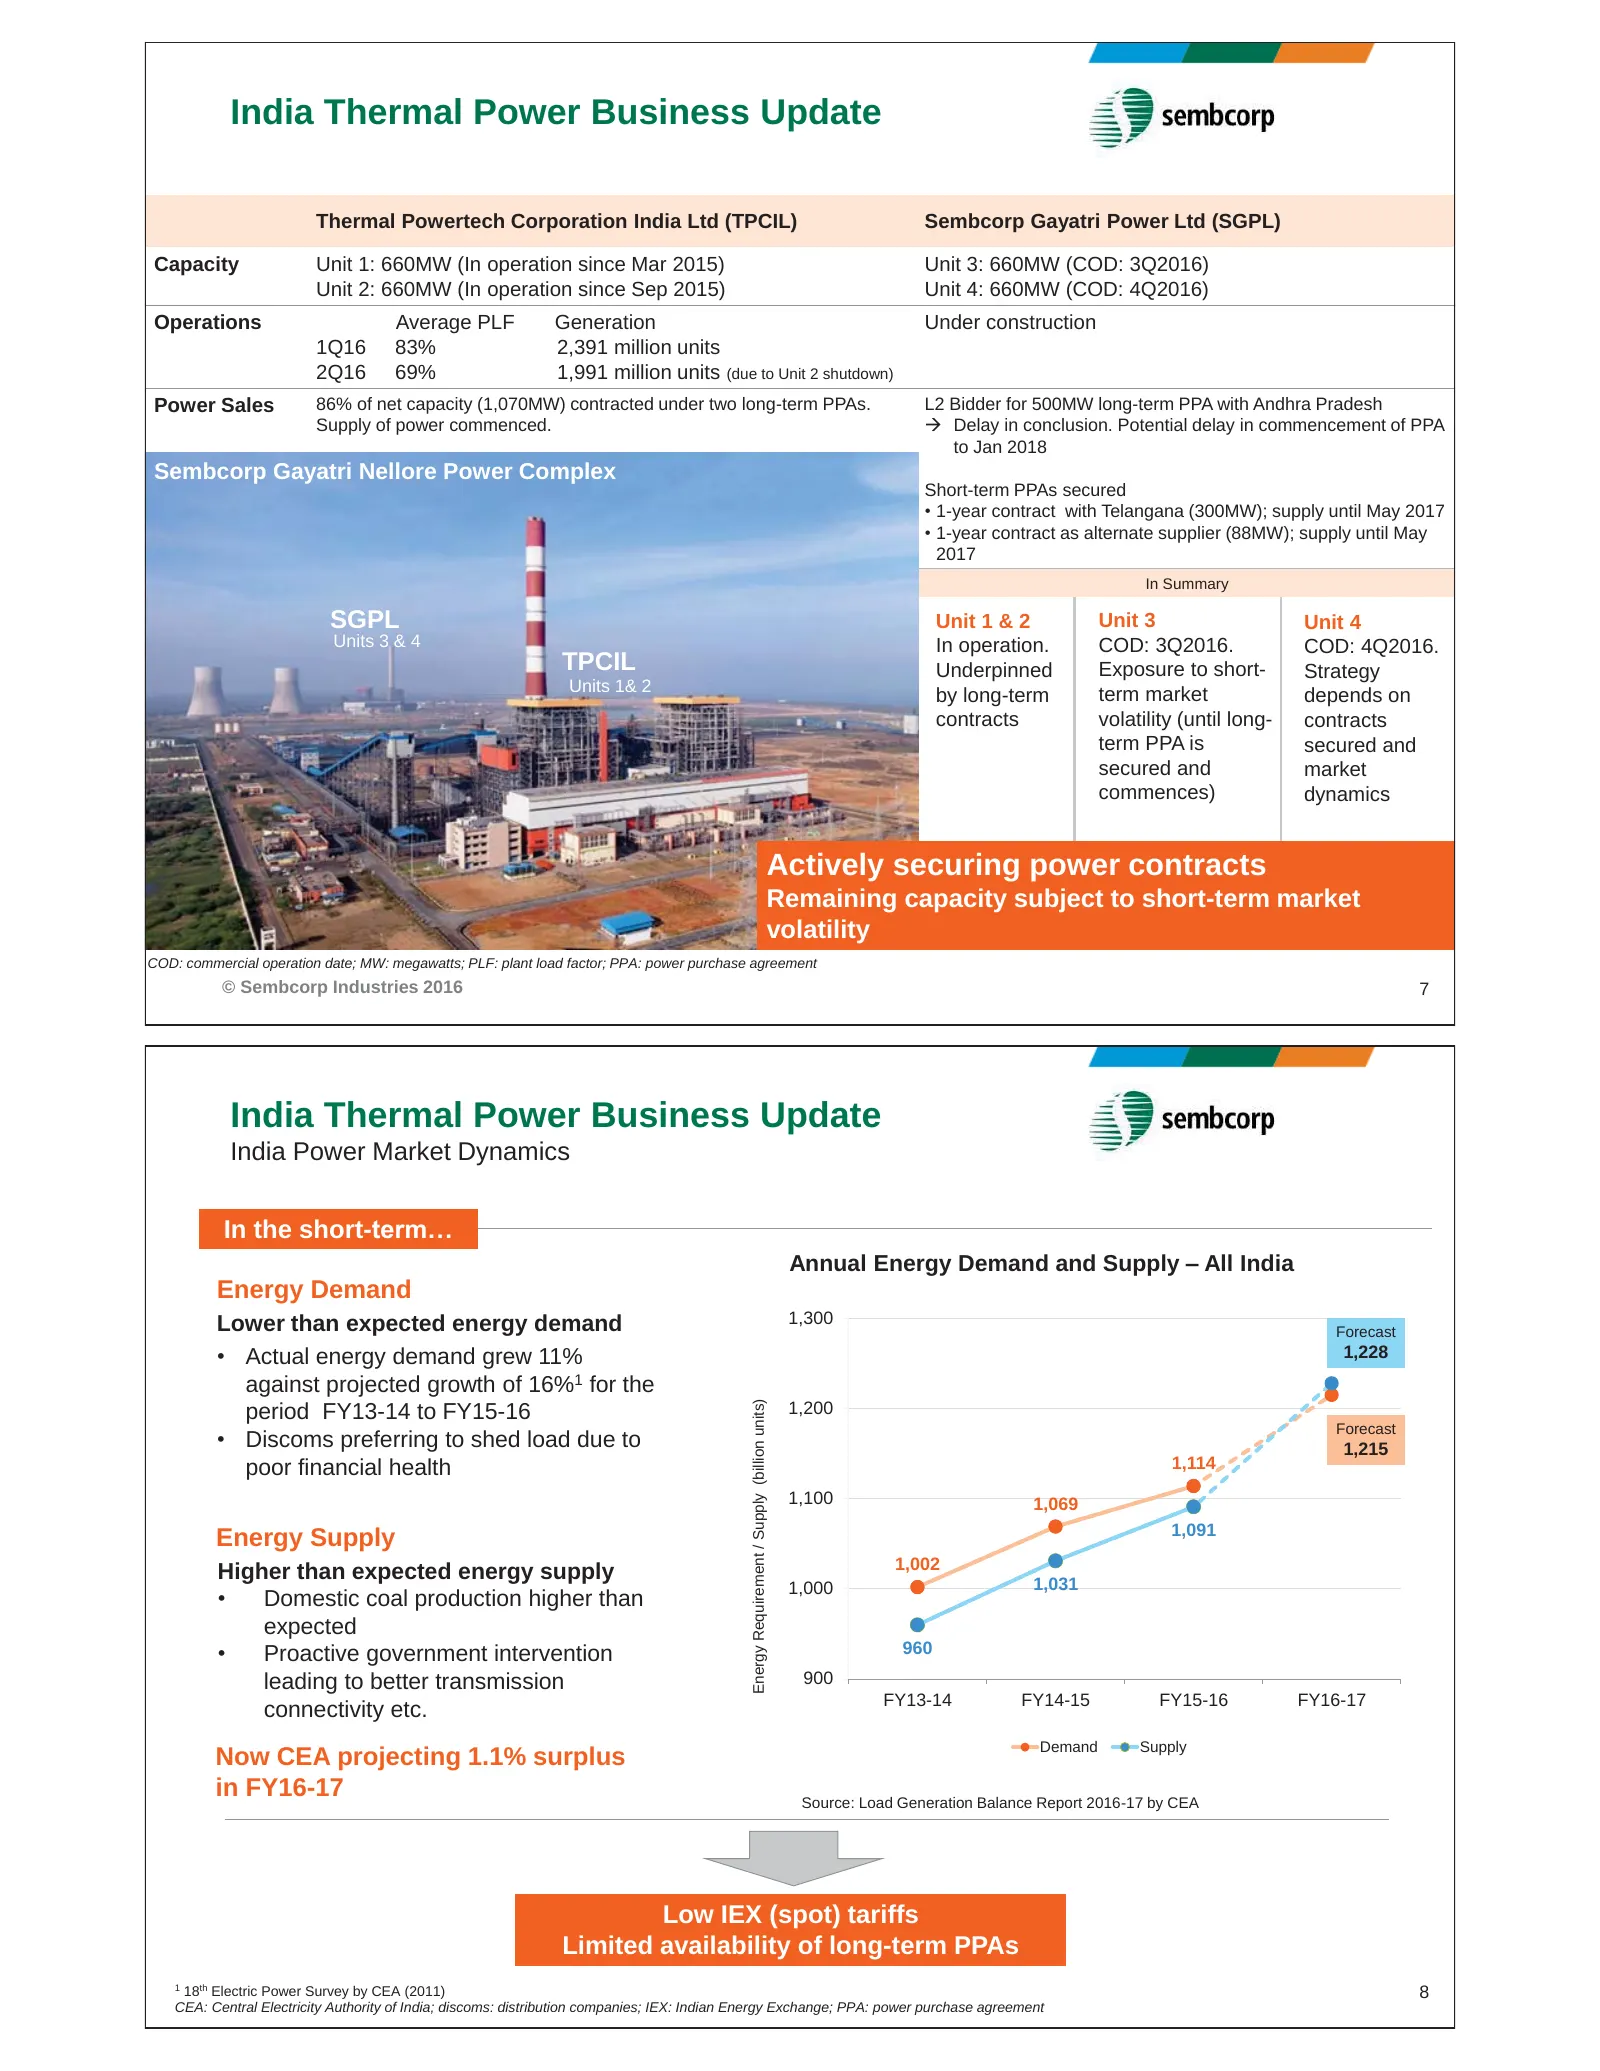
Slide 4: India Thermal Power Business Update
India Thermal Power Business Update Thermal Powertech Corporation India Ltd (TPCIL) Sembcorp Gayatri Power Ltd (SGPL) Capacity Unit 1: 660MW (In operation since Mar 2015) Unit 3: 660MW (COD: 3Q2016) Unit 2: 660MW (In operation since Sep 2015) Unit 4: 660MW (COD: 4Q2016) Operations Average PLF Genera
Slide 5: India Power Market Dynamics
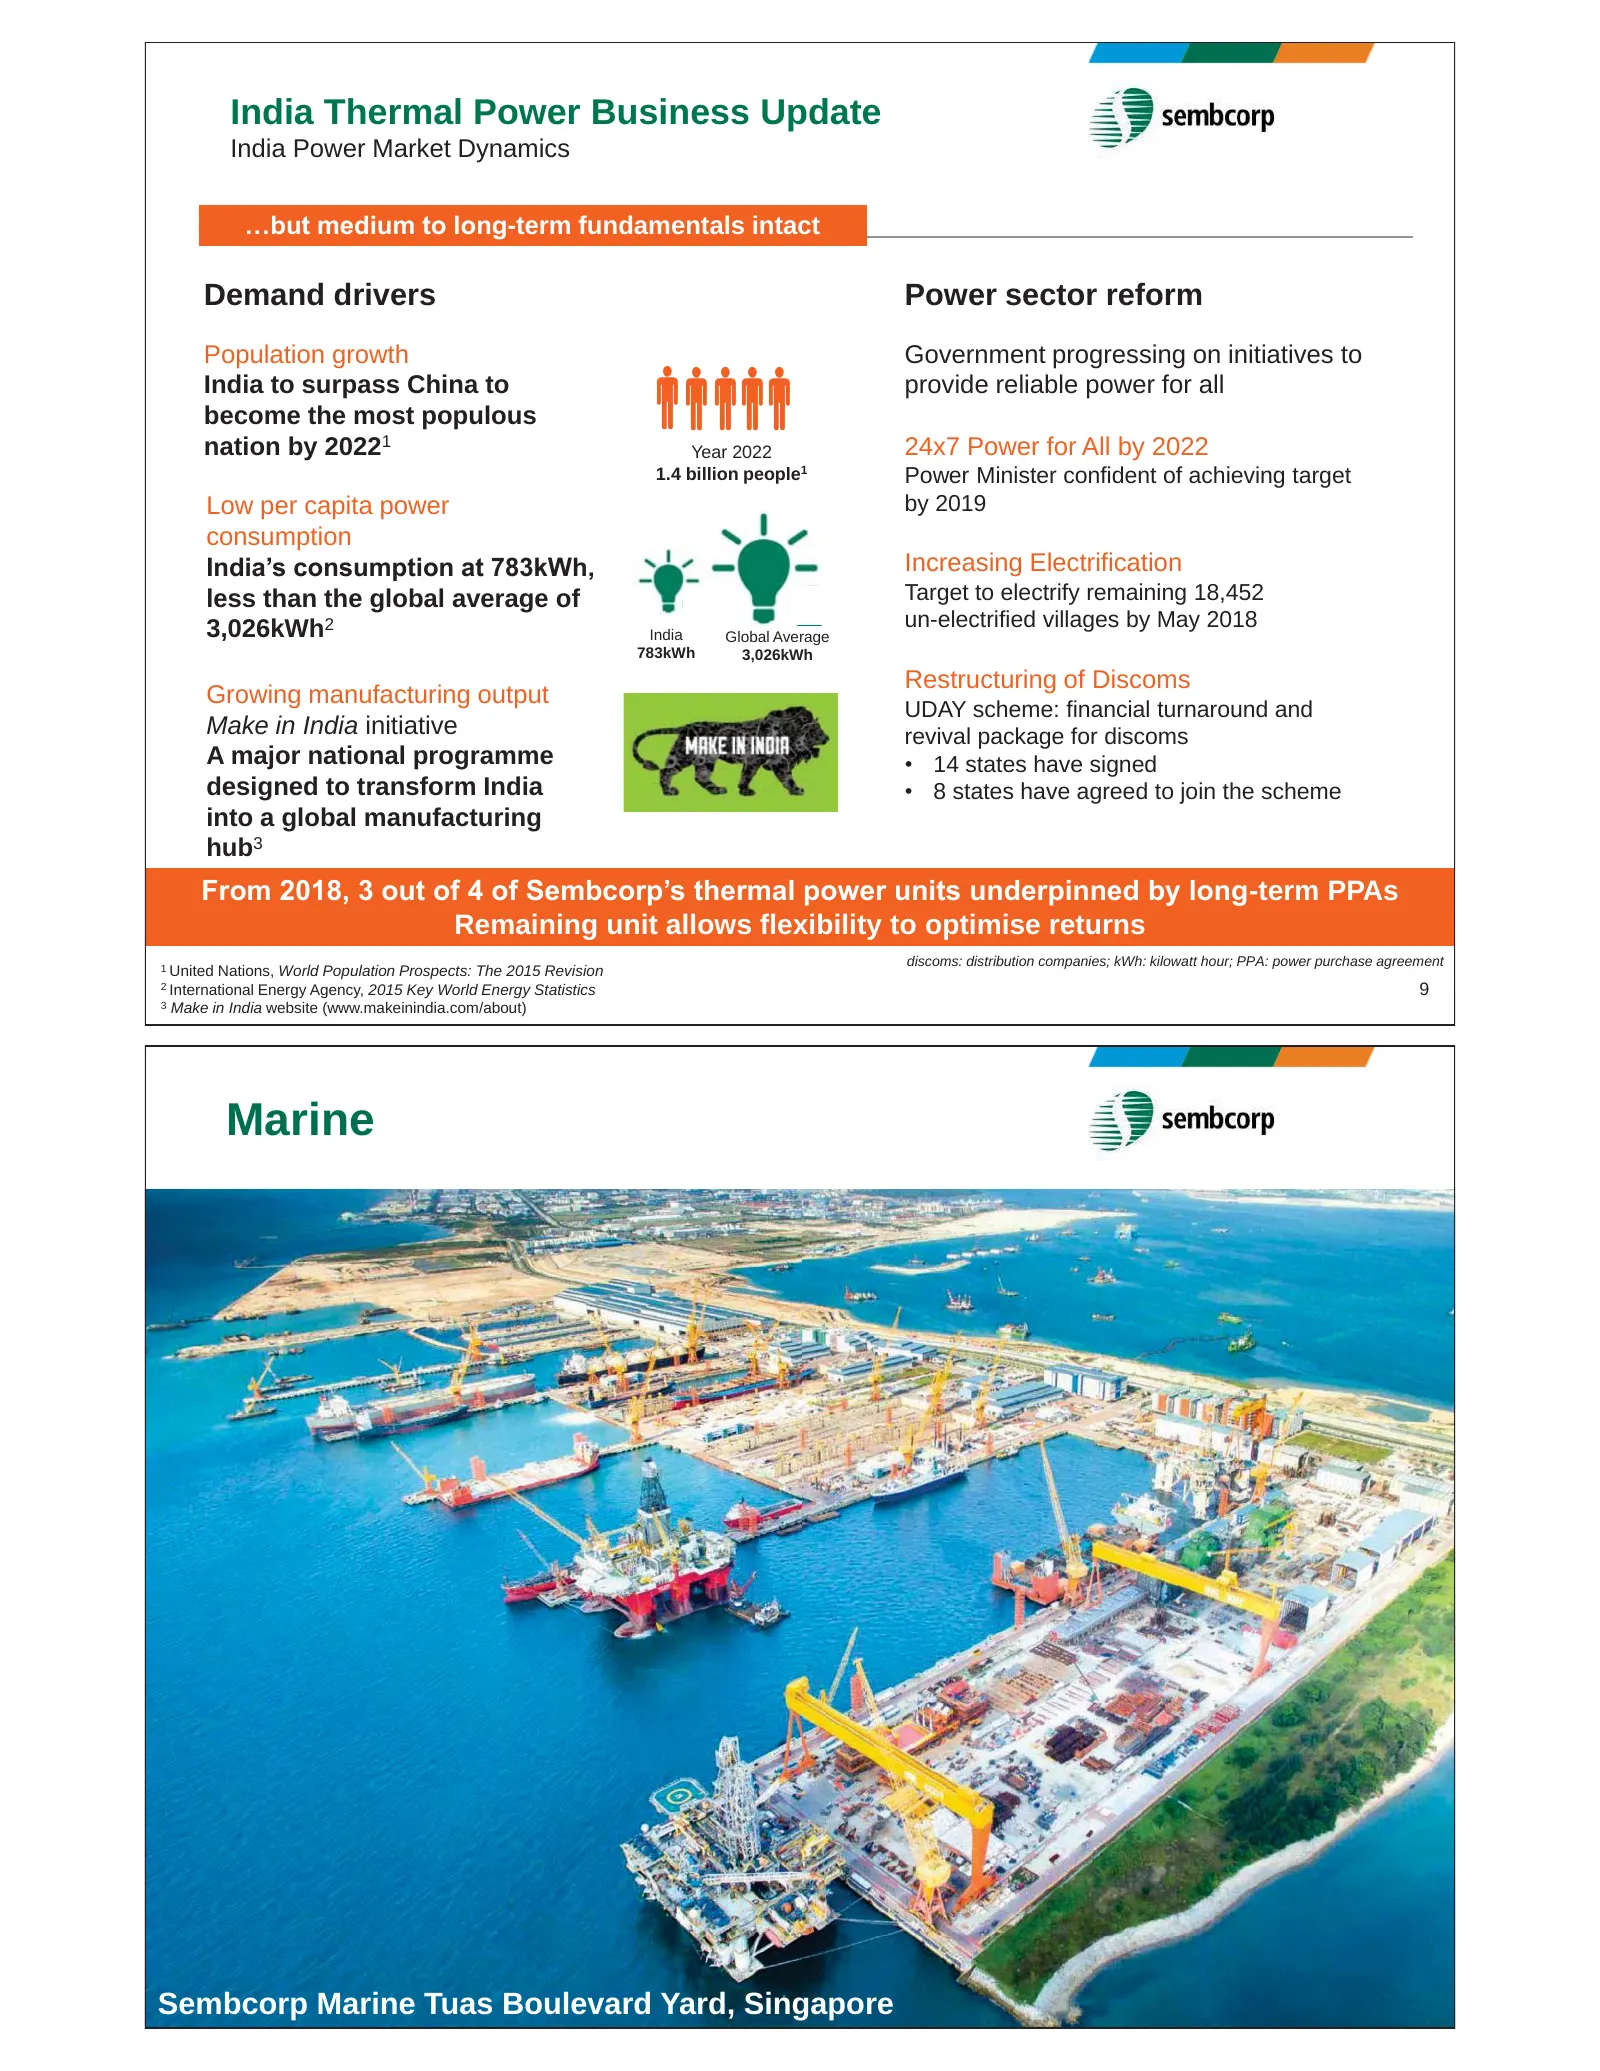
India Thermal Power Business Update India Power Market Dynamics …but medium to long-term fundamentals intact Demand drivers Power sector reform Population growth Government progressing on initiatives to India to surpass China to become the most populous nation by 20221 b bbb b Year 2022 provide reli
Slide 6: Marine
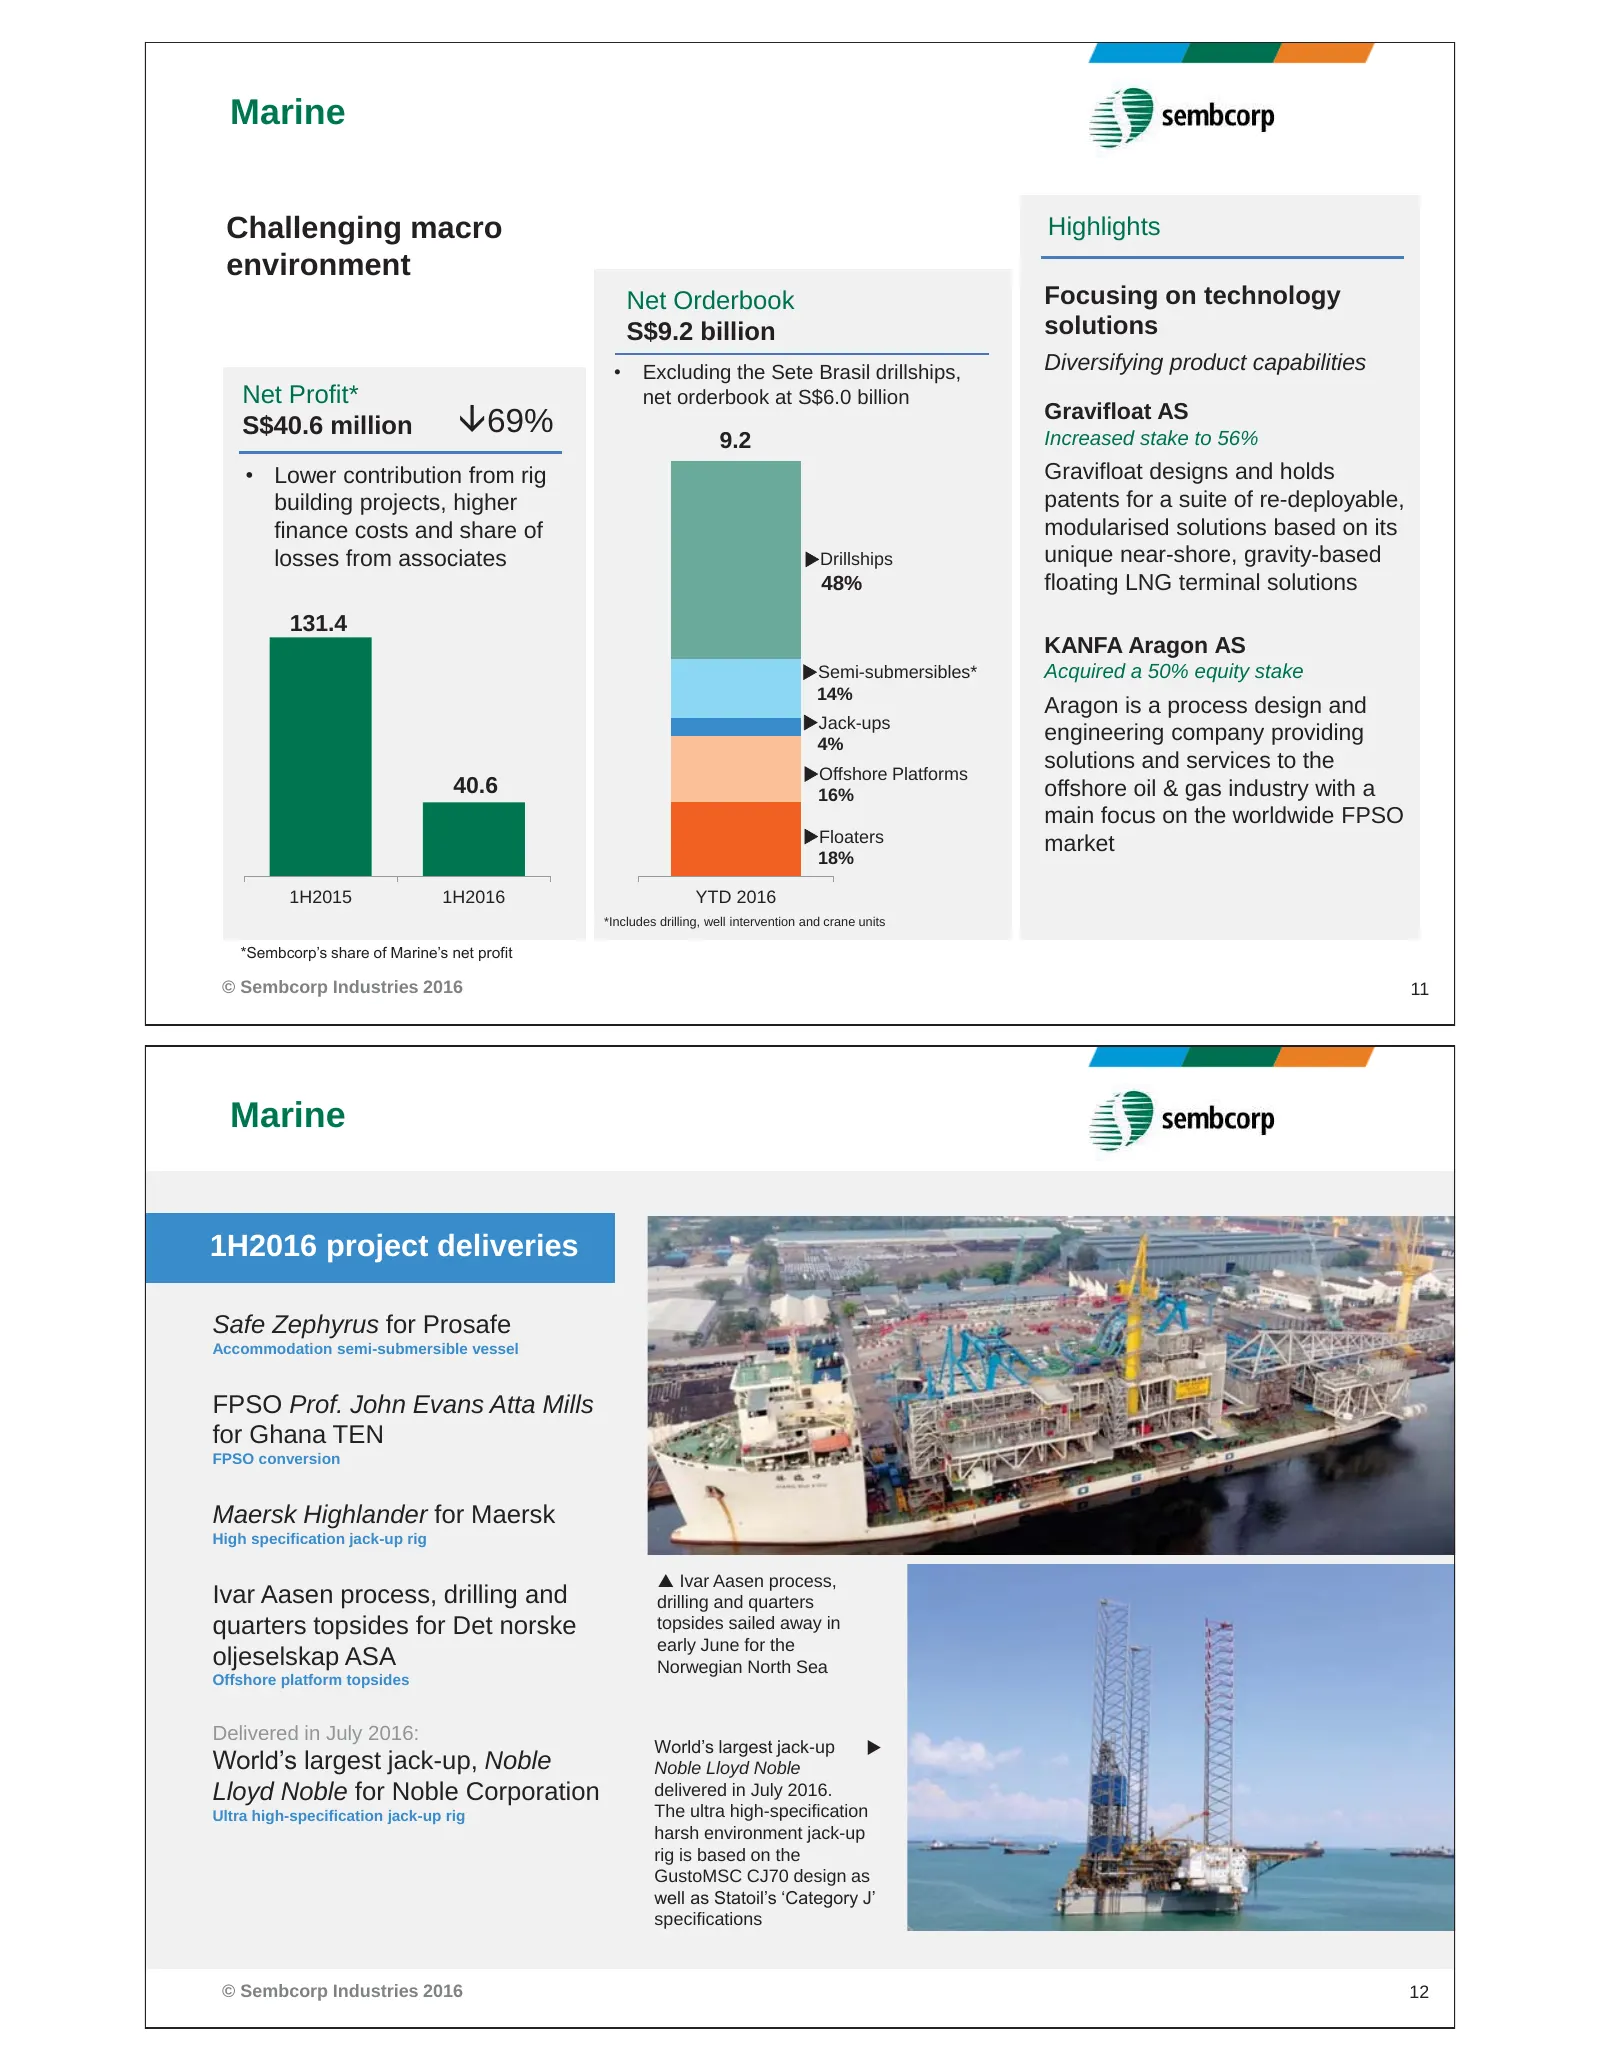
Marine Challenging macro Highlights environment Net Orderbook Focusing on technology S$9.2 billion solutions • Excluding the Sete Brasil drillships, Diversifying product capabilities Net Profit* net orderbook at S$6.0 billion S$40.6 million È69% 9.2 Gravifloat AS Increased stake to 56% • Lower contr
Slide 7: Urban Development
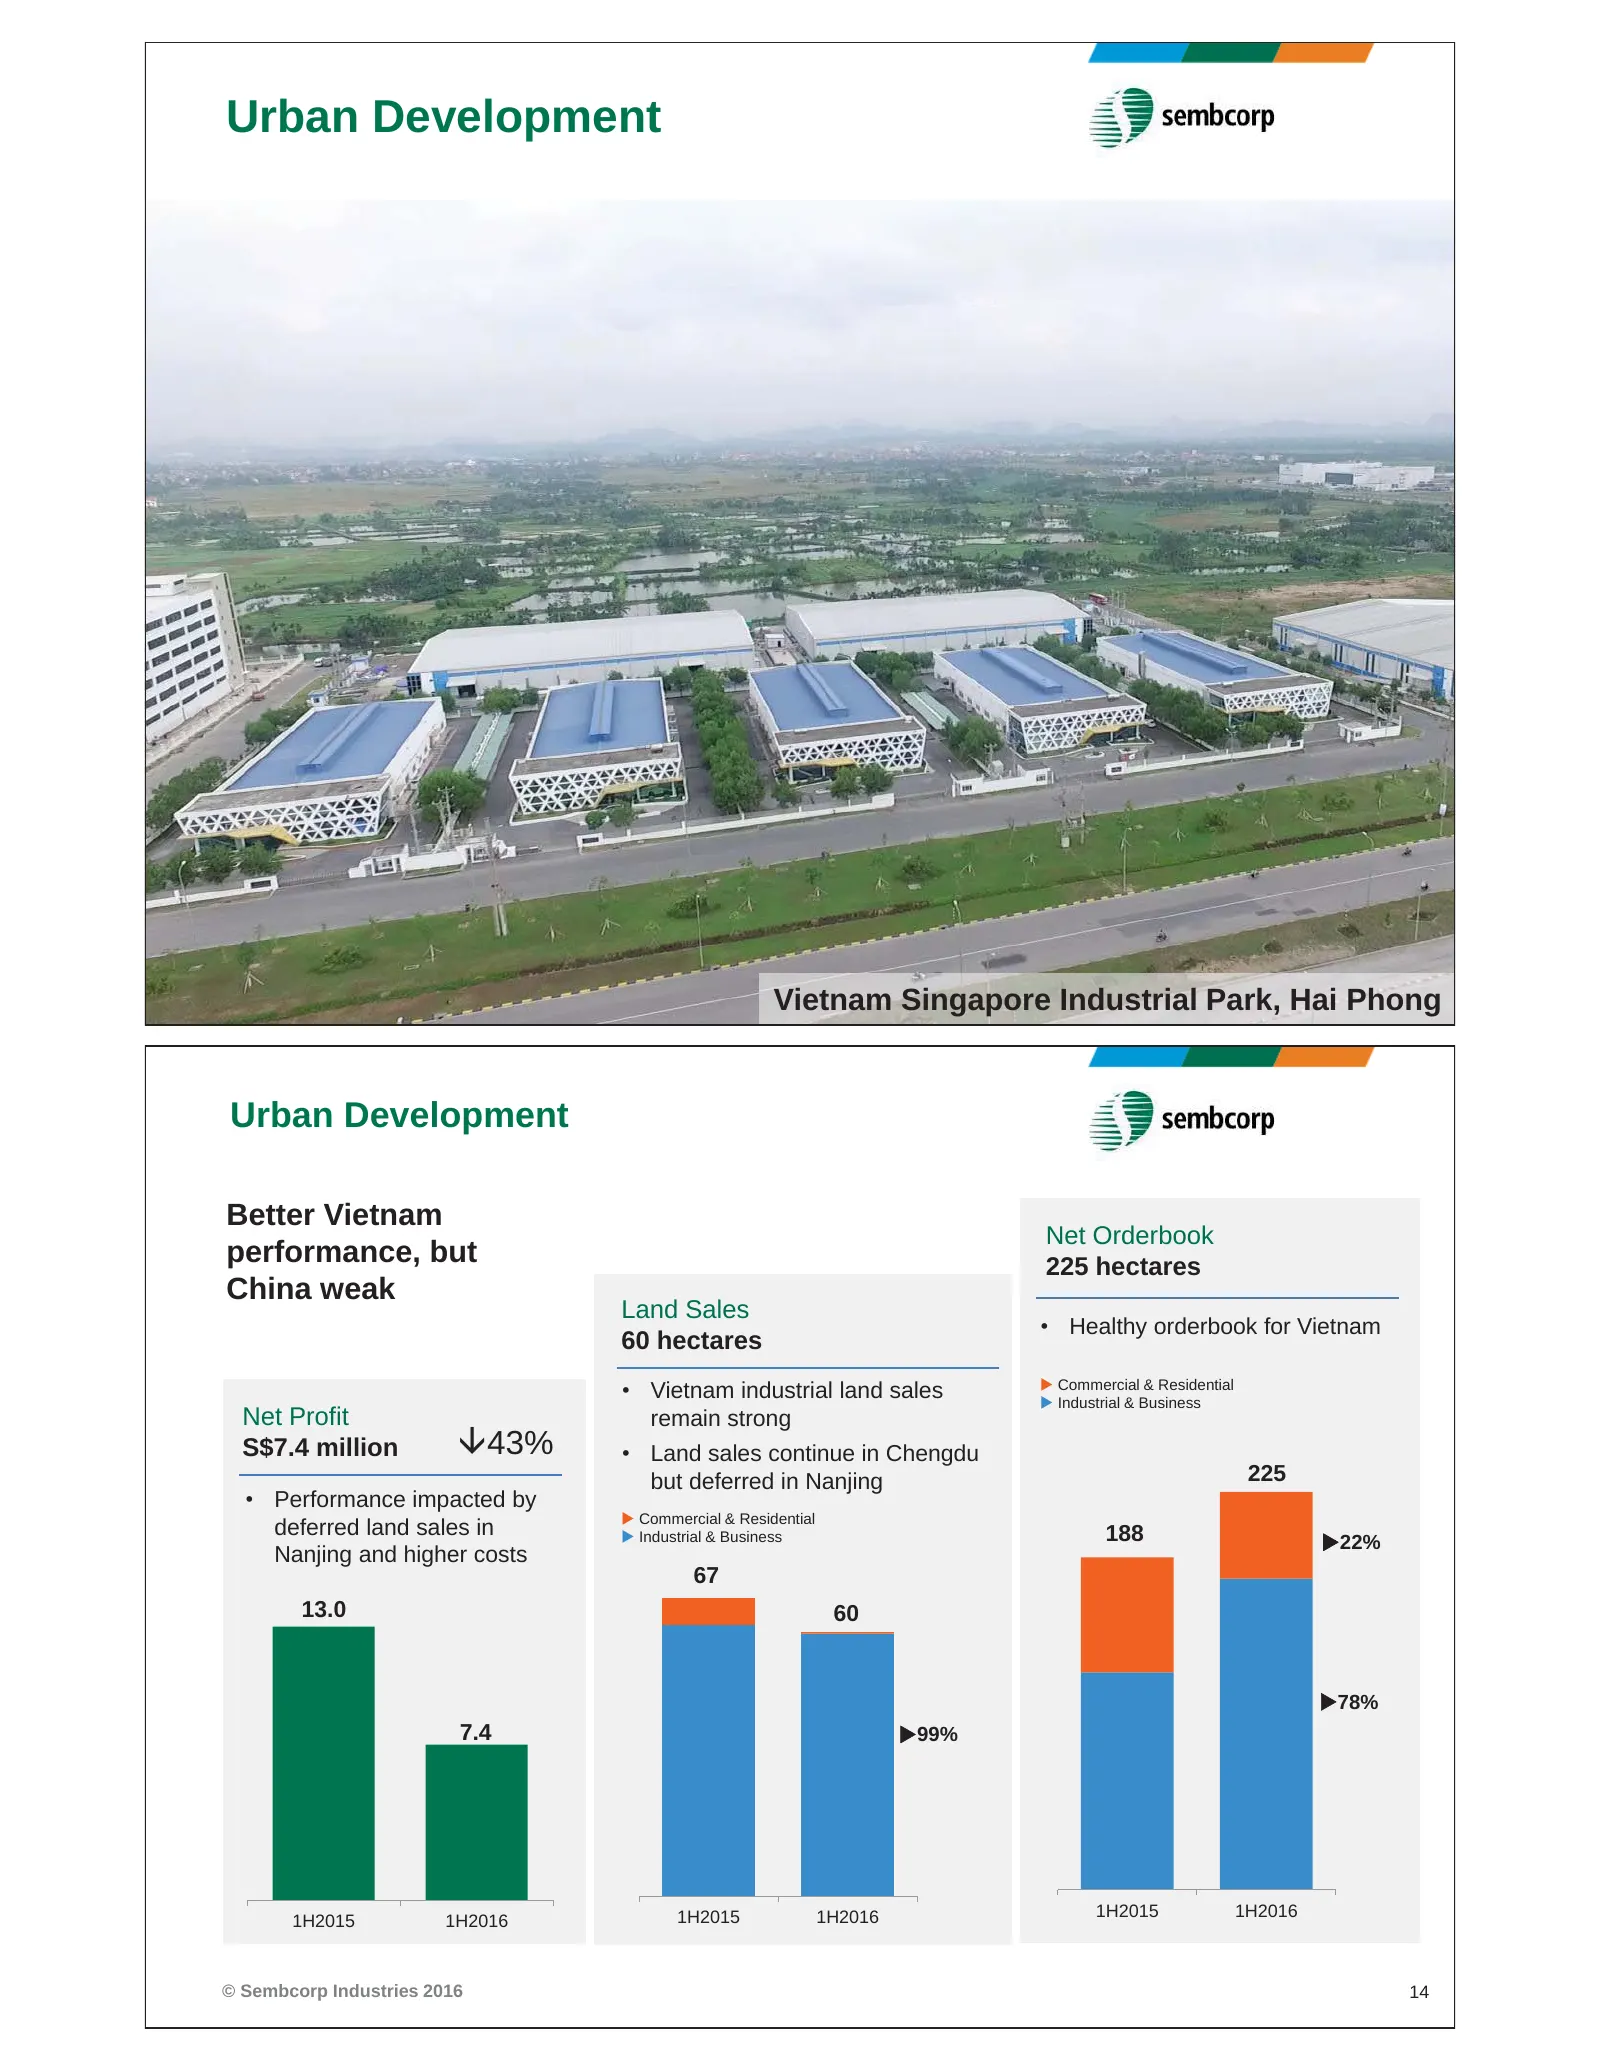
Urban Development © Sembcorp Industries 2016 13 VSIP Hai Phong Integrated Vietnam Singapore Township & Industrial Industrial Park, Park, Hai Vietnam Phong Urban Development Better Vietnam Net Orderbook performance, but 225 hectares China weak Land Sales • Healthy orderbook for Vietnam 60 hectares X
Slide 8: Financial Review
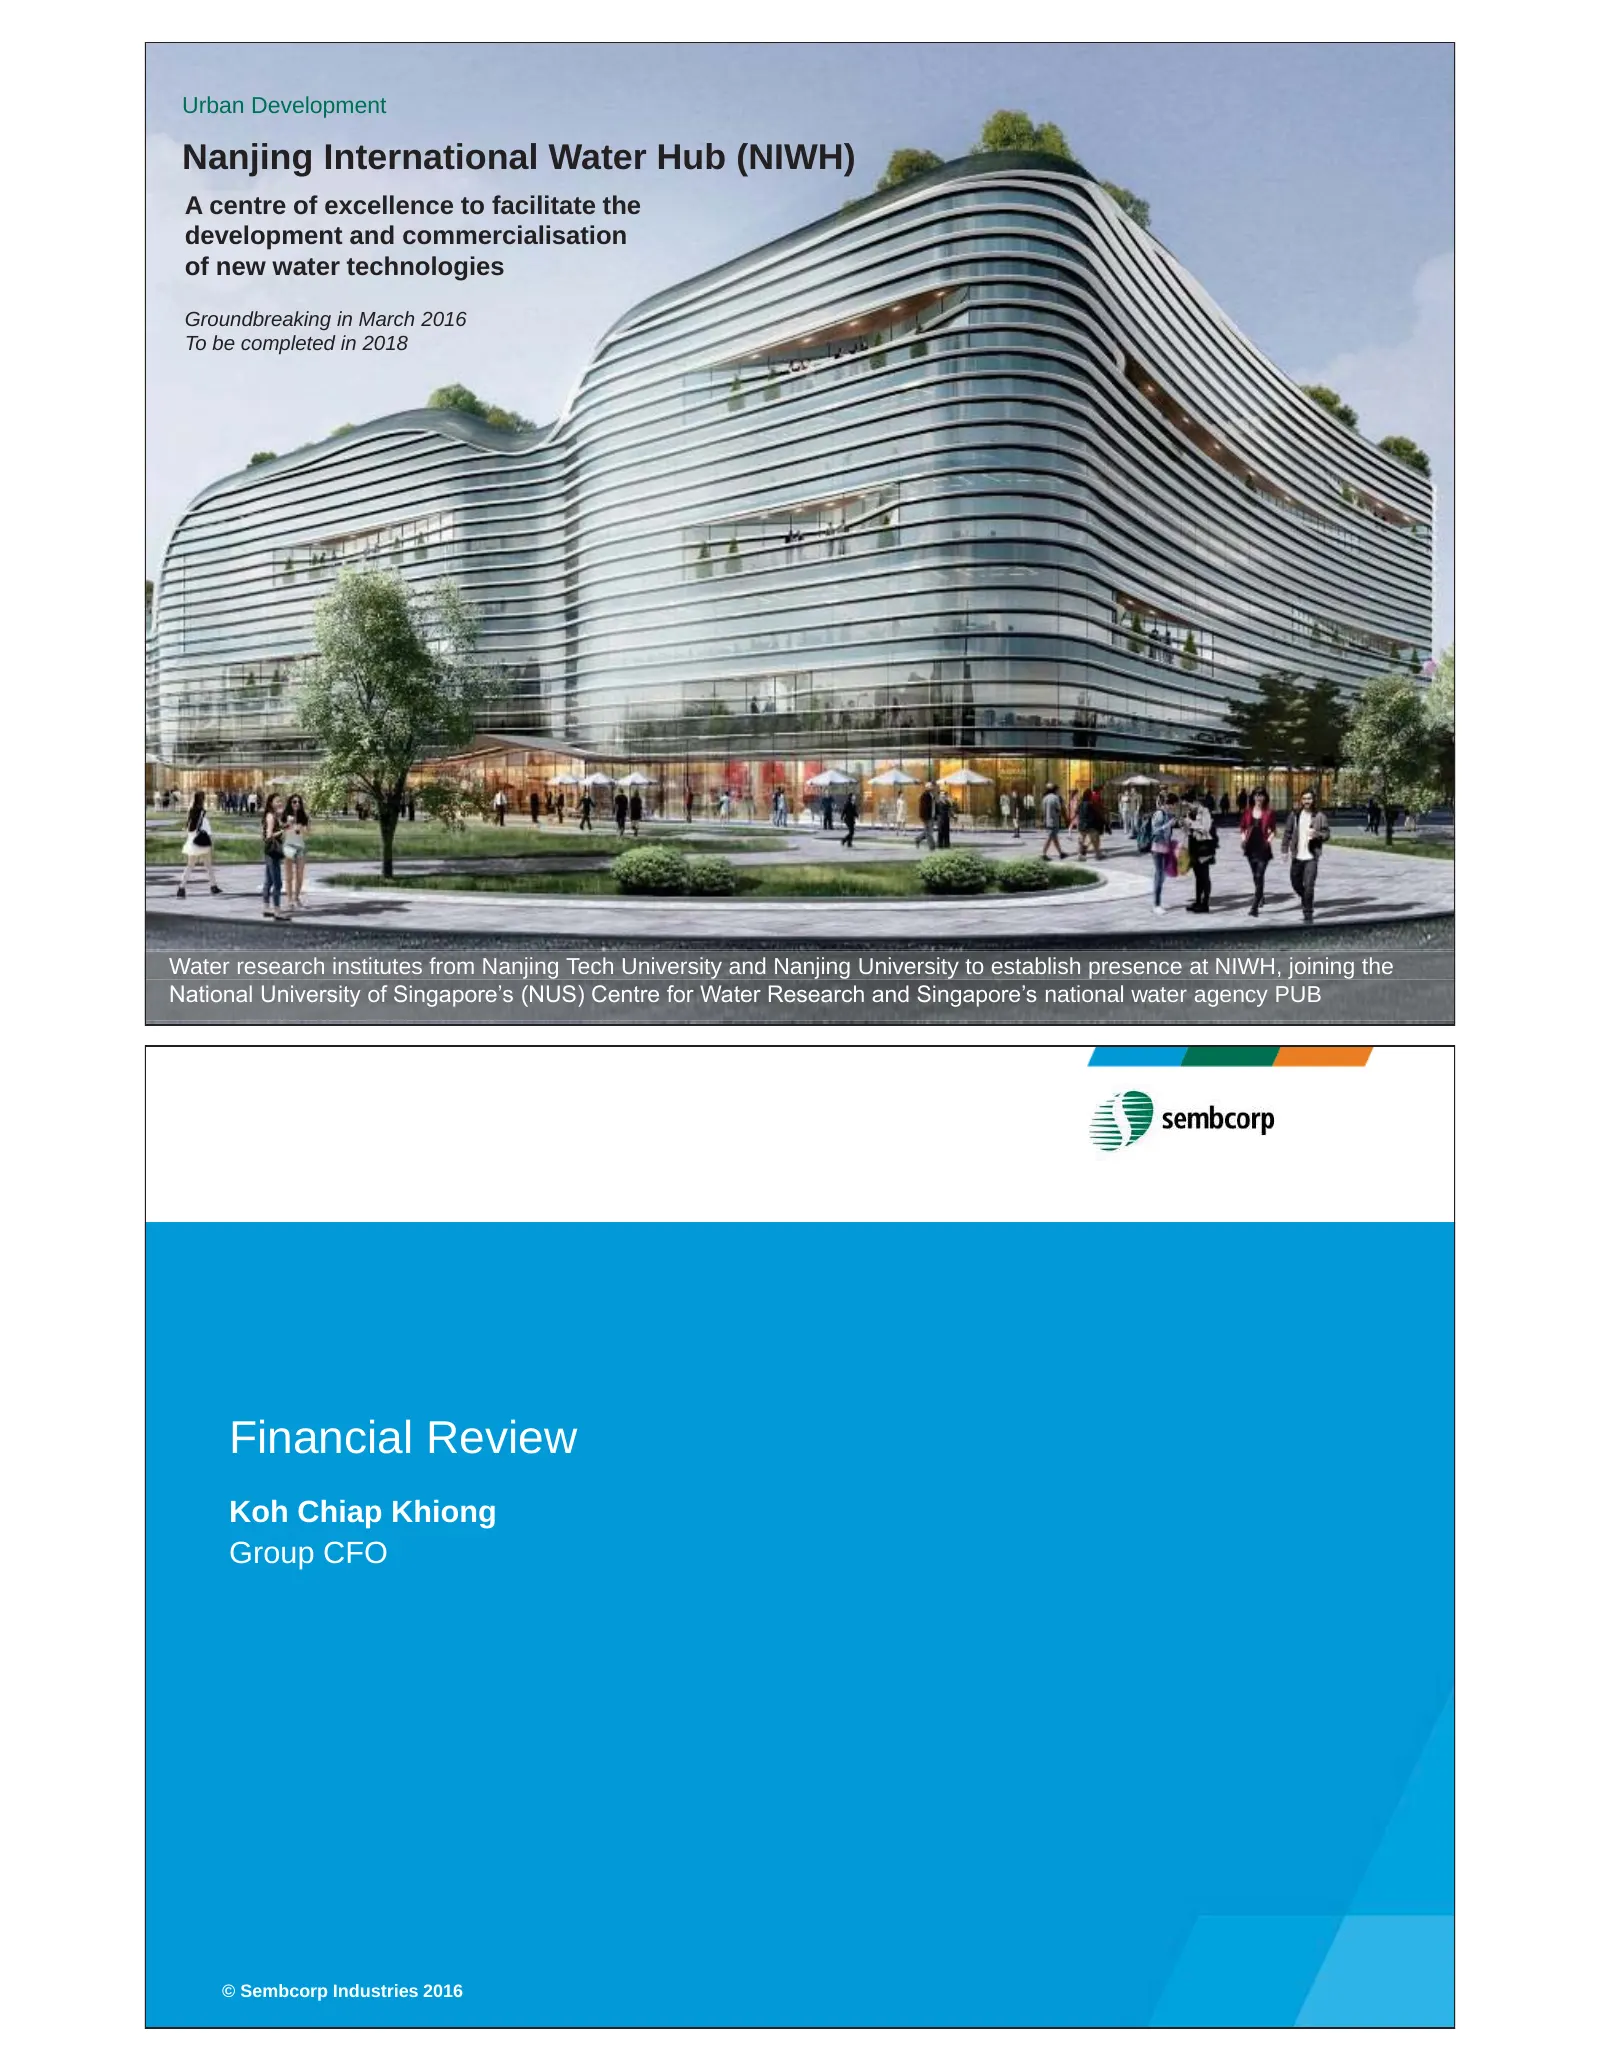
Urban Development Nanjing International Water Hub (NIWH) A centre of excellence to facilitate the development and commercialisation of new water technologies Groundbreaking in March 2016 To be completed in 2018 Water research institutes from Nanjing Tech University and Nanjing University to establis
Slide 9: Group Profit & Loss
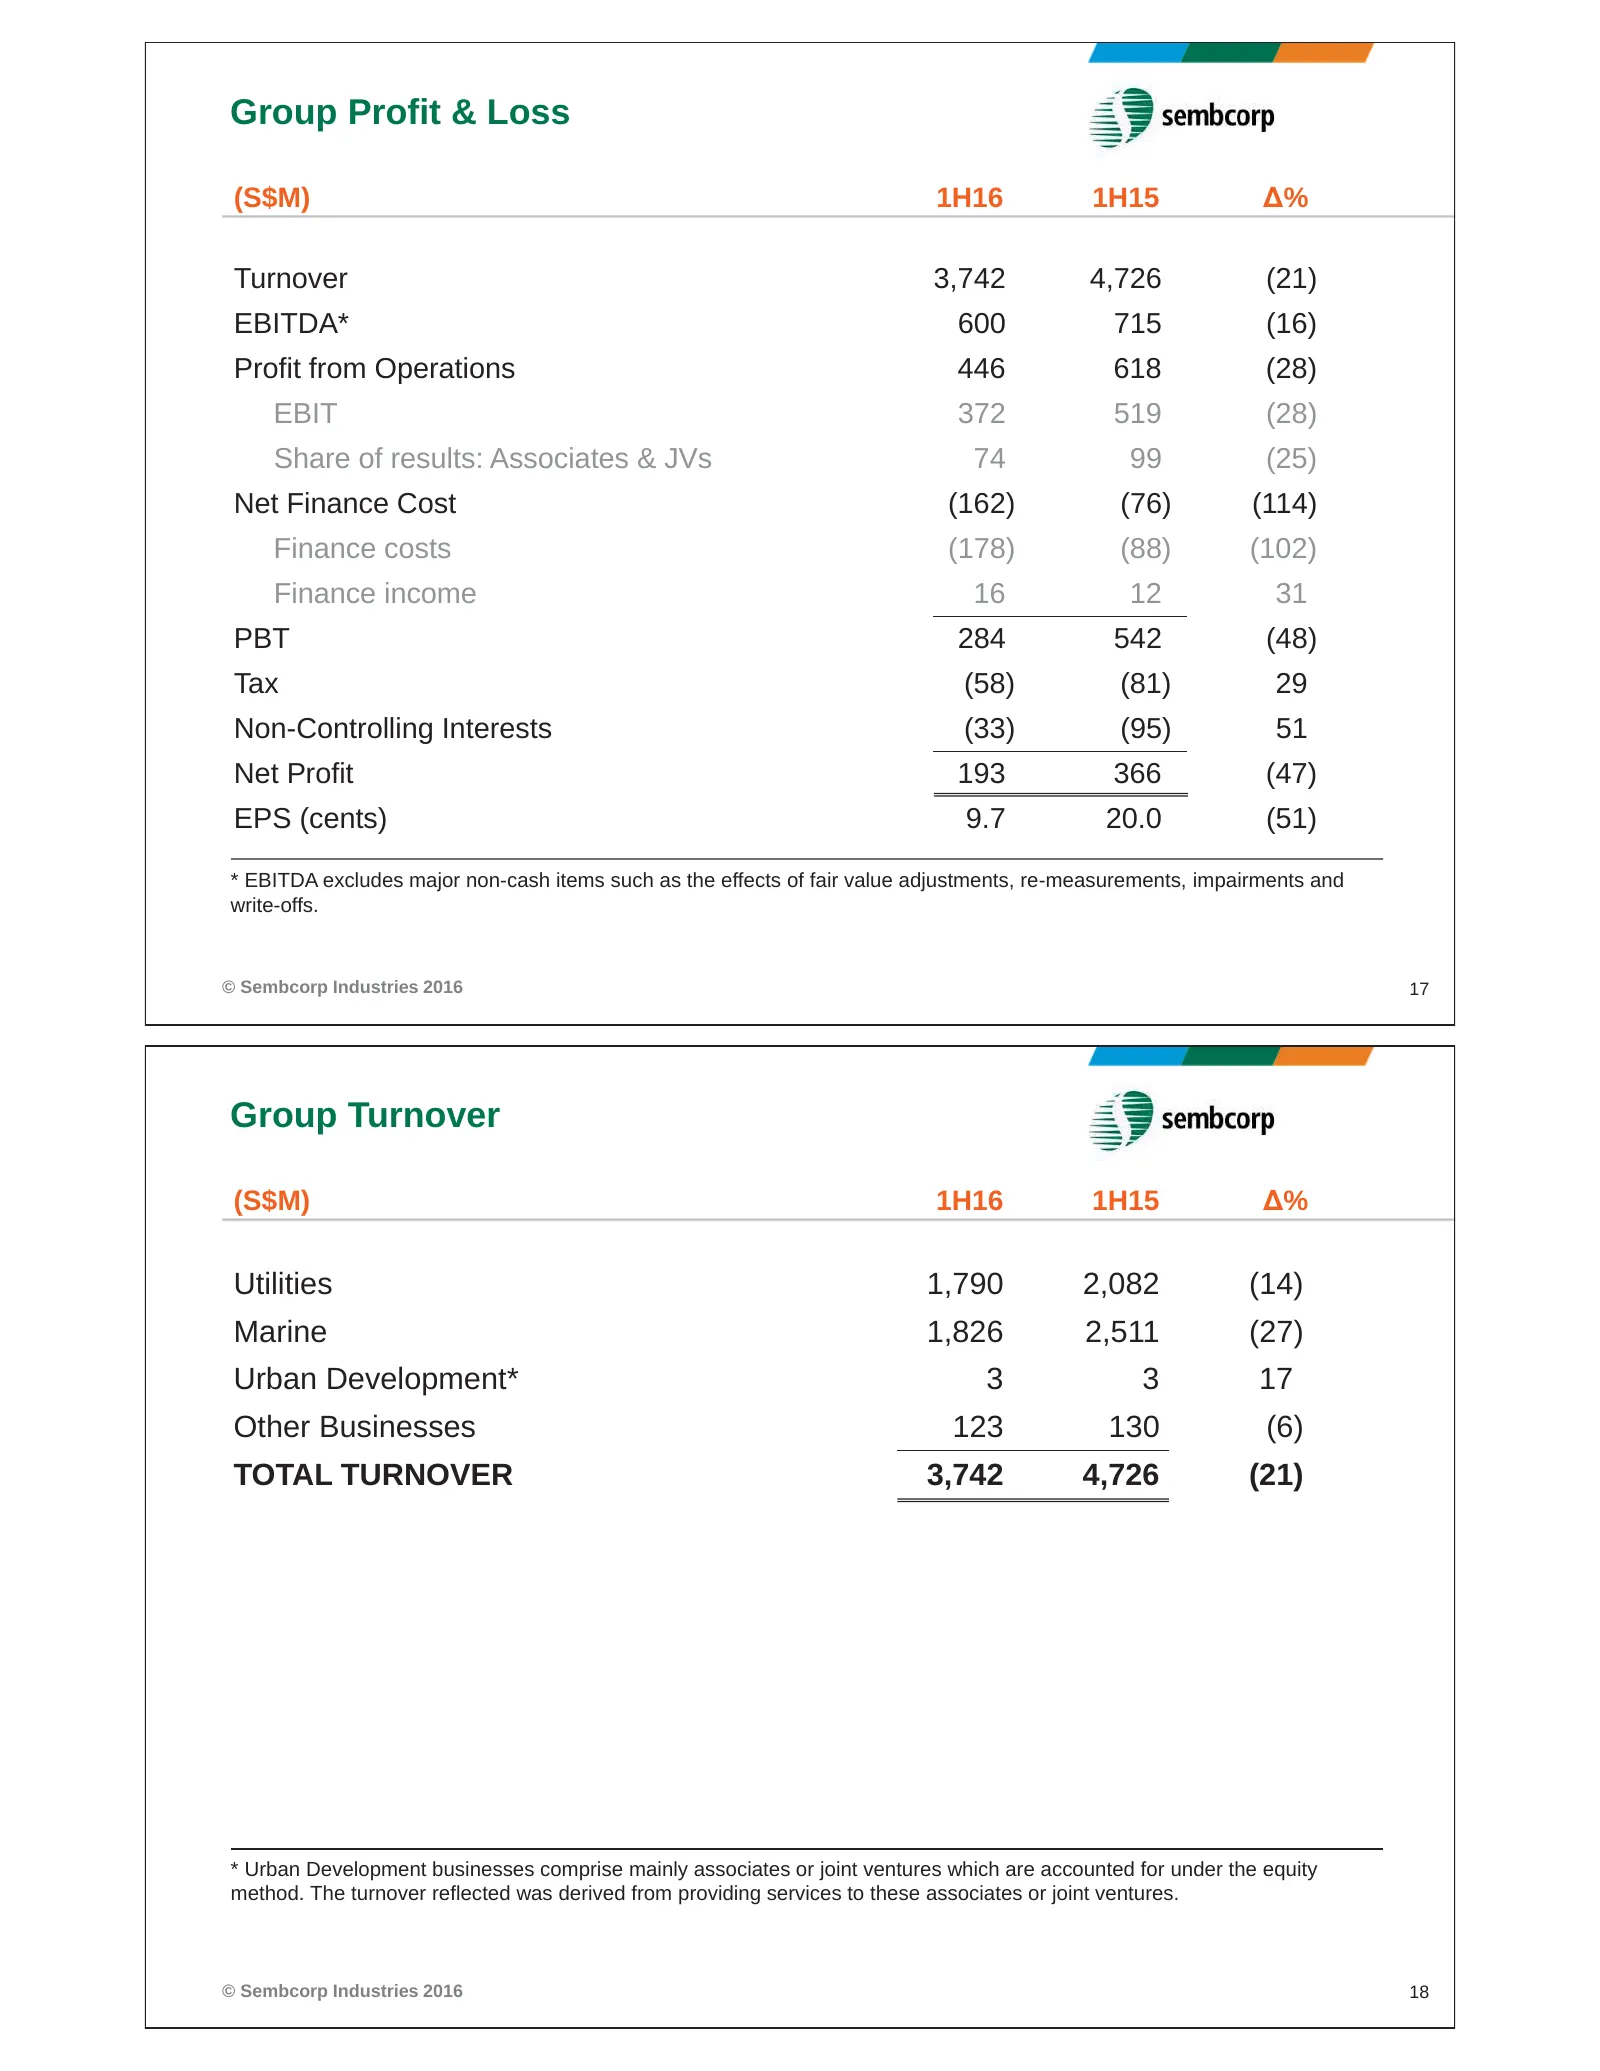
Group Profit & Loss (S$M) 1H16 1H15 Δ% Turnover 3,742 4,726 (21) EBITDA* 600 715 (16) Profit from Operations 446 618 (28) EBIT 372 519 (28) Share of results: Associates & JVs 74 99 (25) Net Finance Cost (162) (76) (114) Finance costs (178) (88) (102) Finance income 16 12 31 PBT 284 542 (48) Tax (58)
Slide 10: Group Profit from Operations and Net Profit
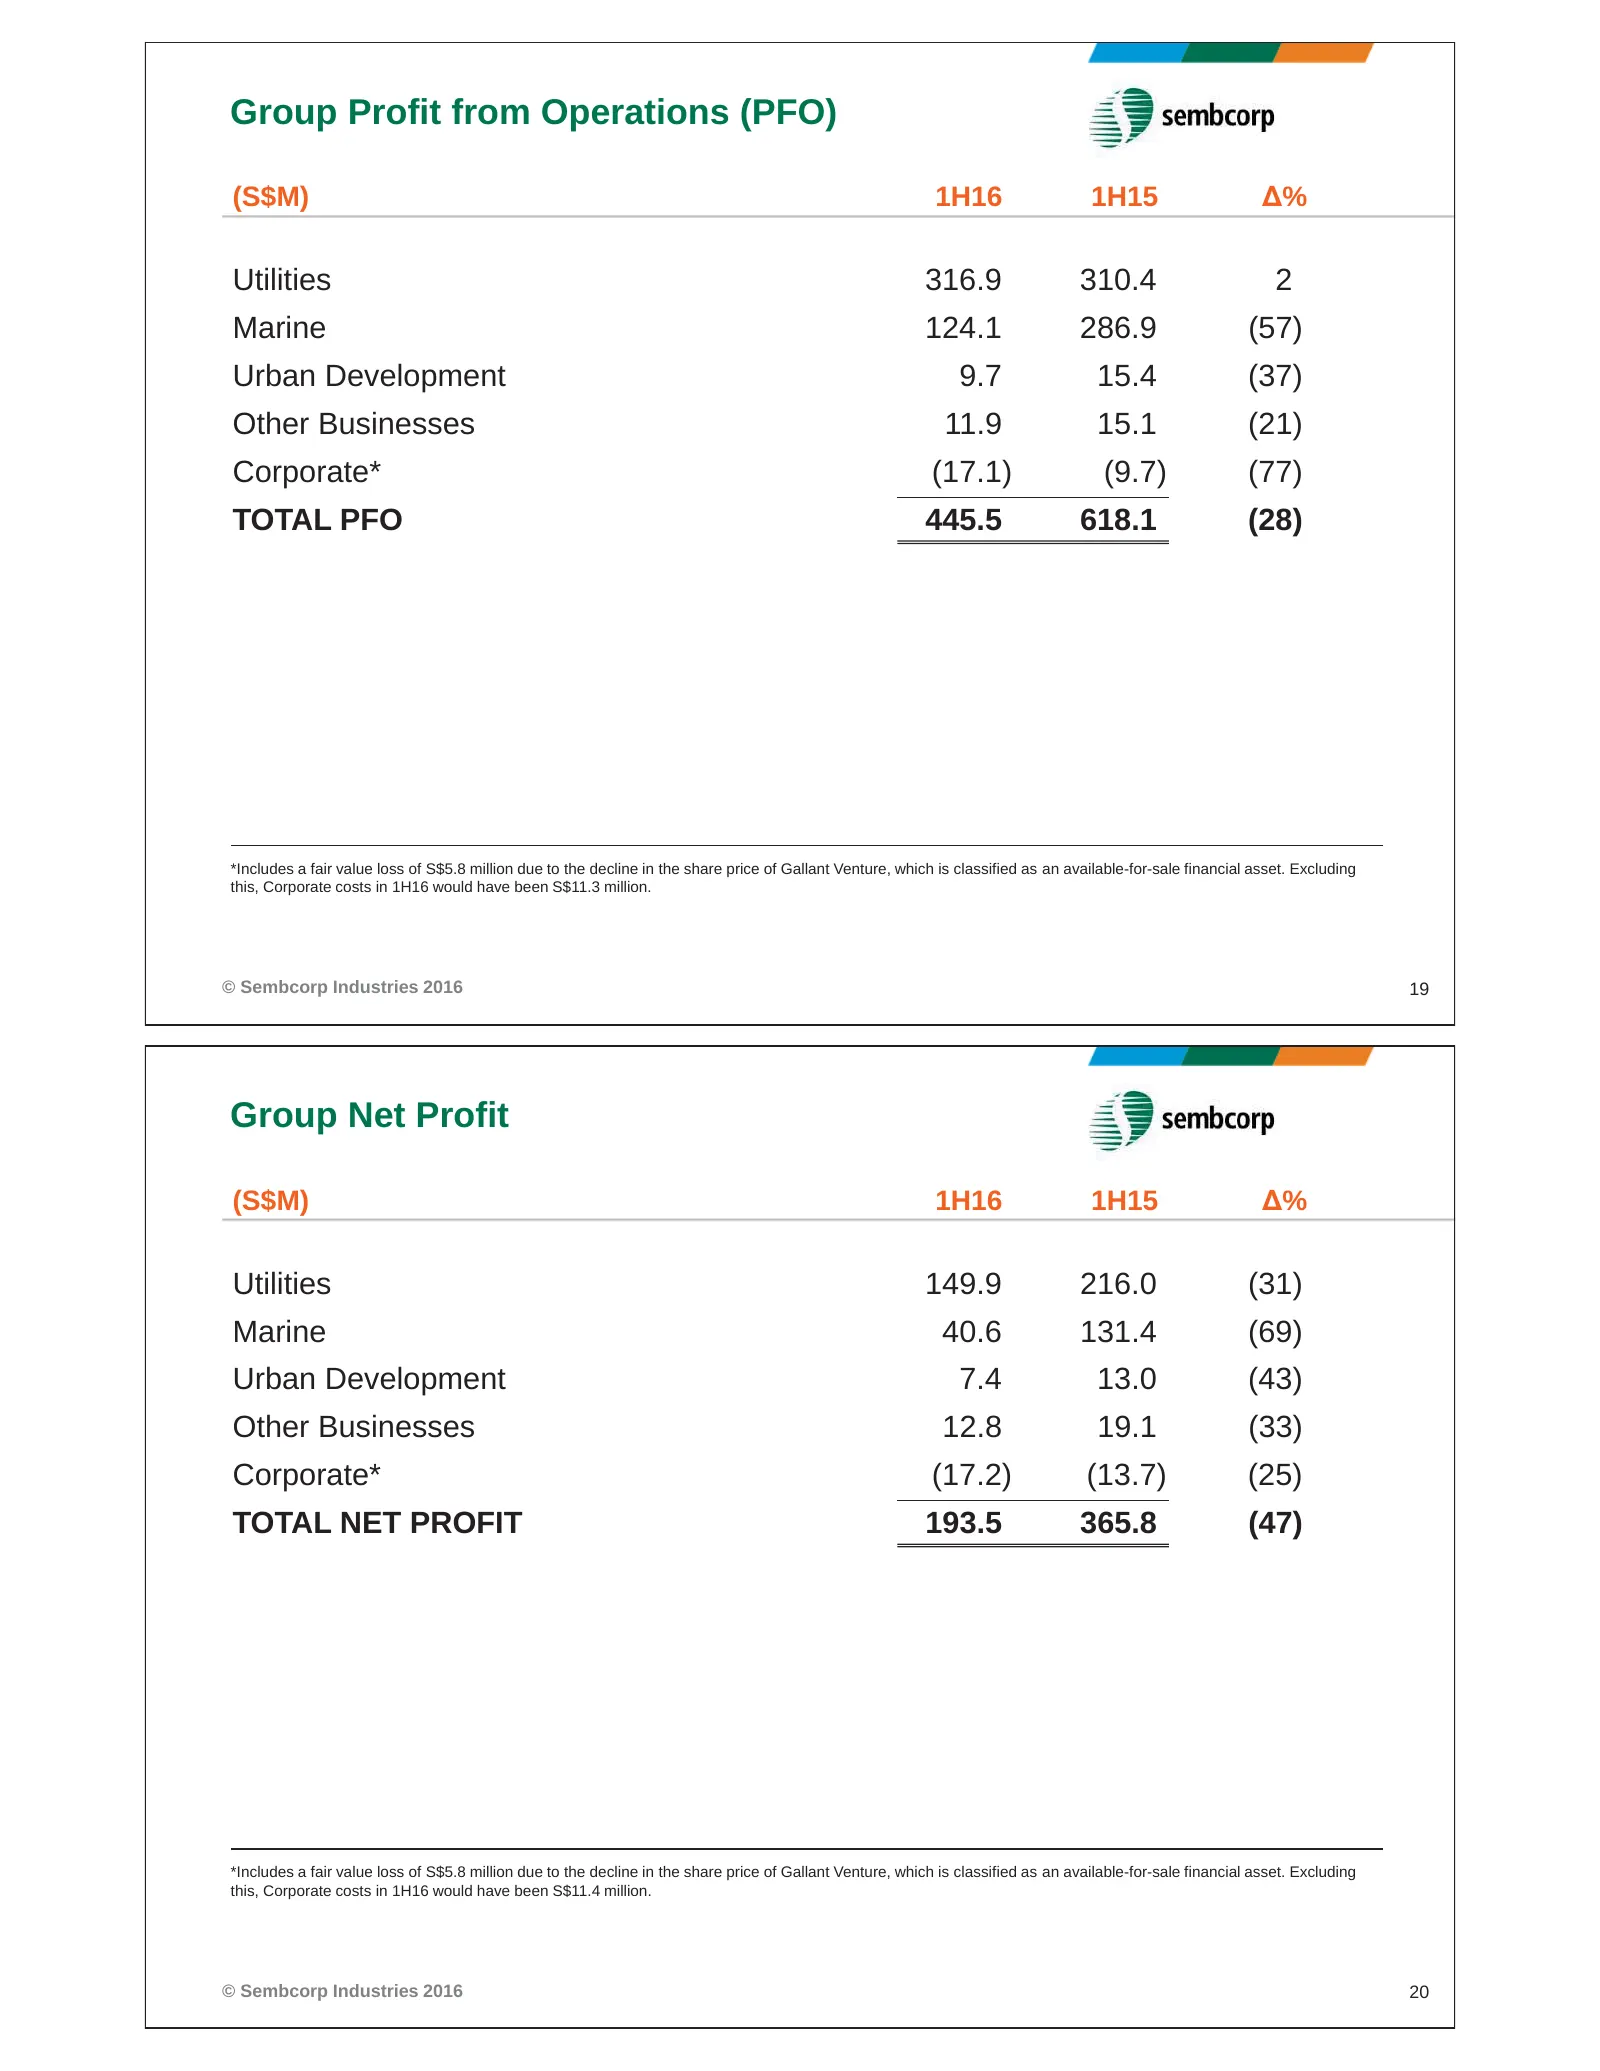
Group Profit from Operations (PFO) (S$M) 1H16 1H15 Δ% Utilities 316.9 310.4 2 Marine 124.1 286.9 (57) Urban Development 9.7 15.4 (37) Other Businesses 11.9 15.1 (21) Corporate* (17.1) (9.7) (77) TOTAL PFO 445.5 618.1 (28) *Includes a fair value loss of S$5.8 million due to the decline in the share p
Slide 11: Utilities Net Profit
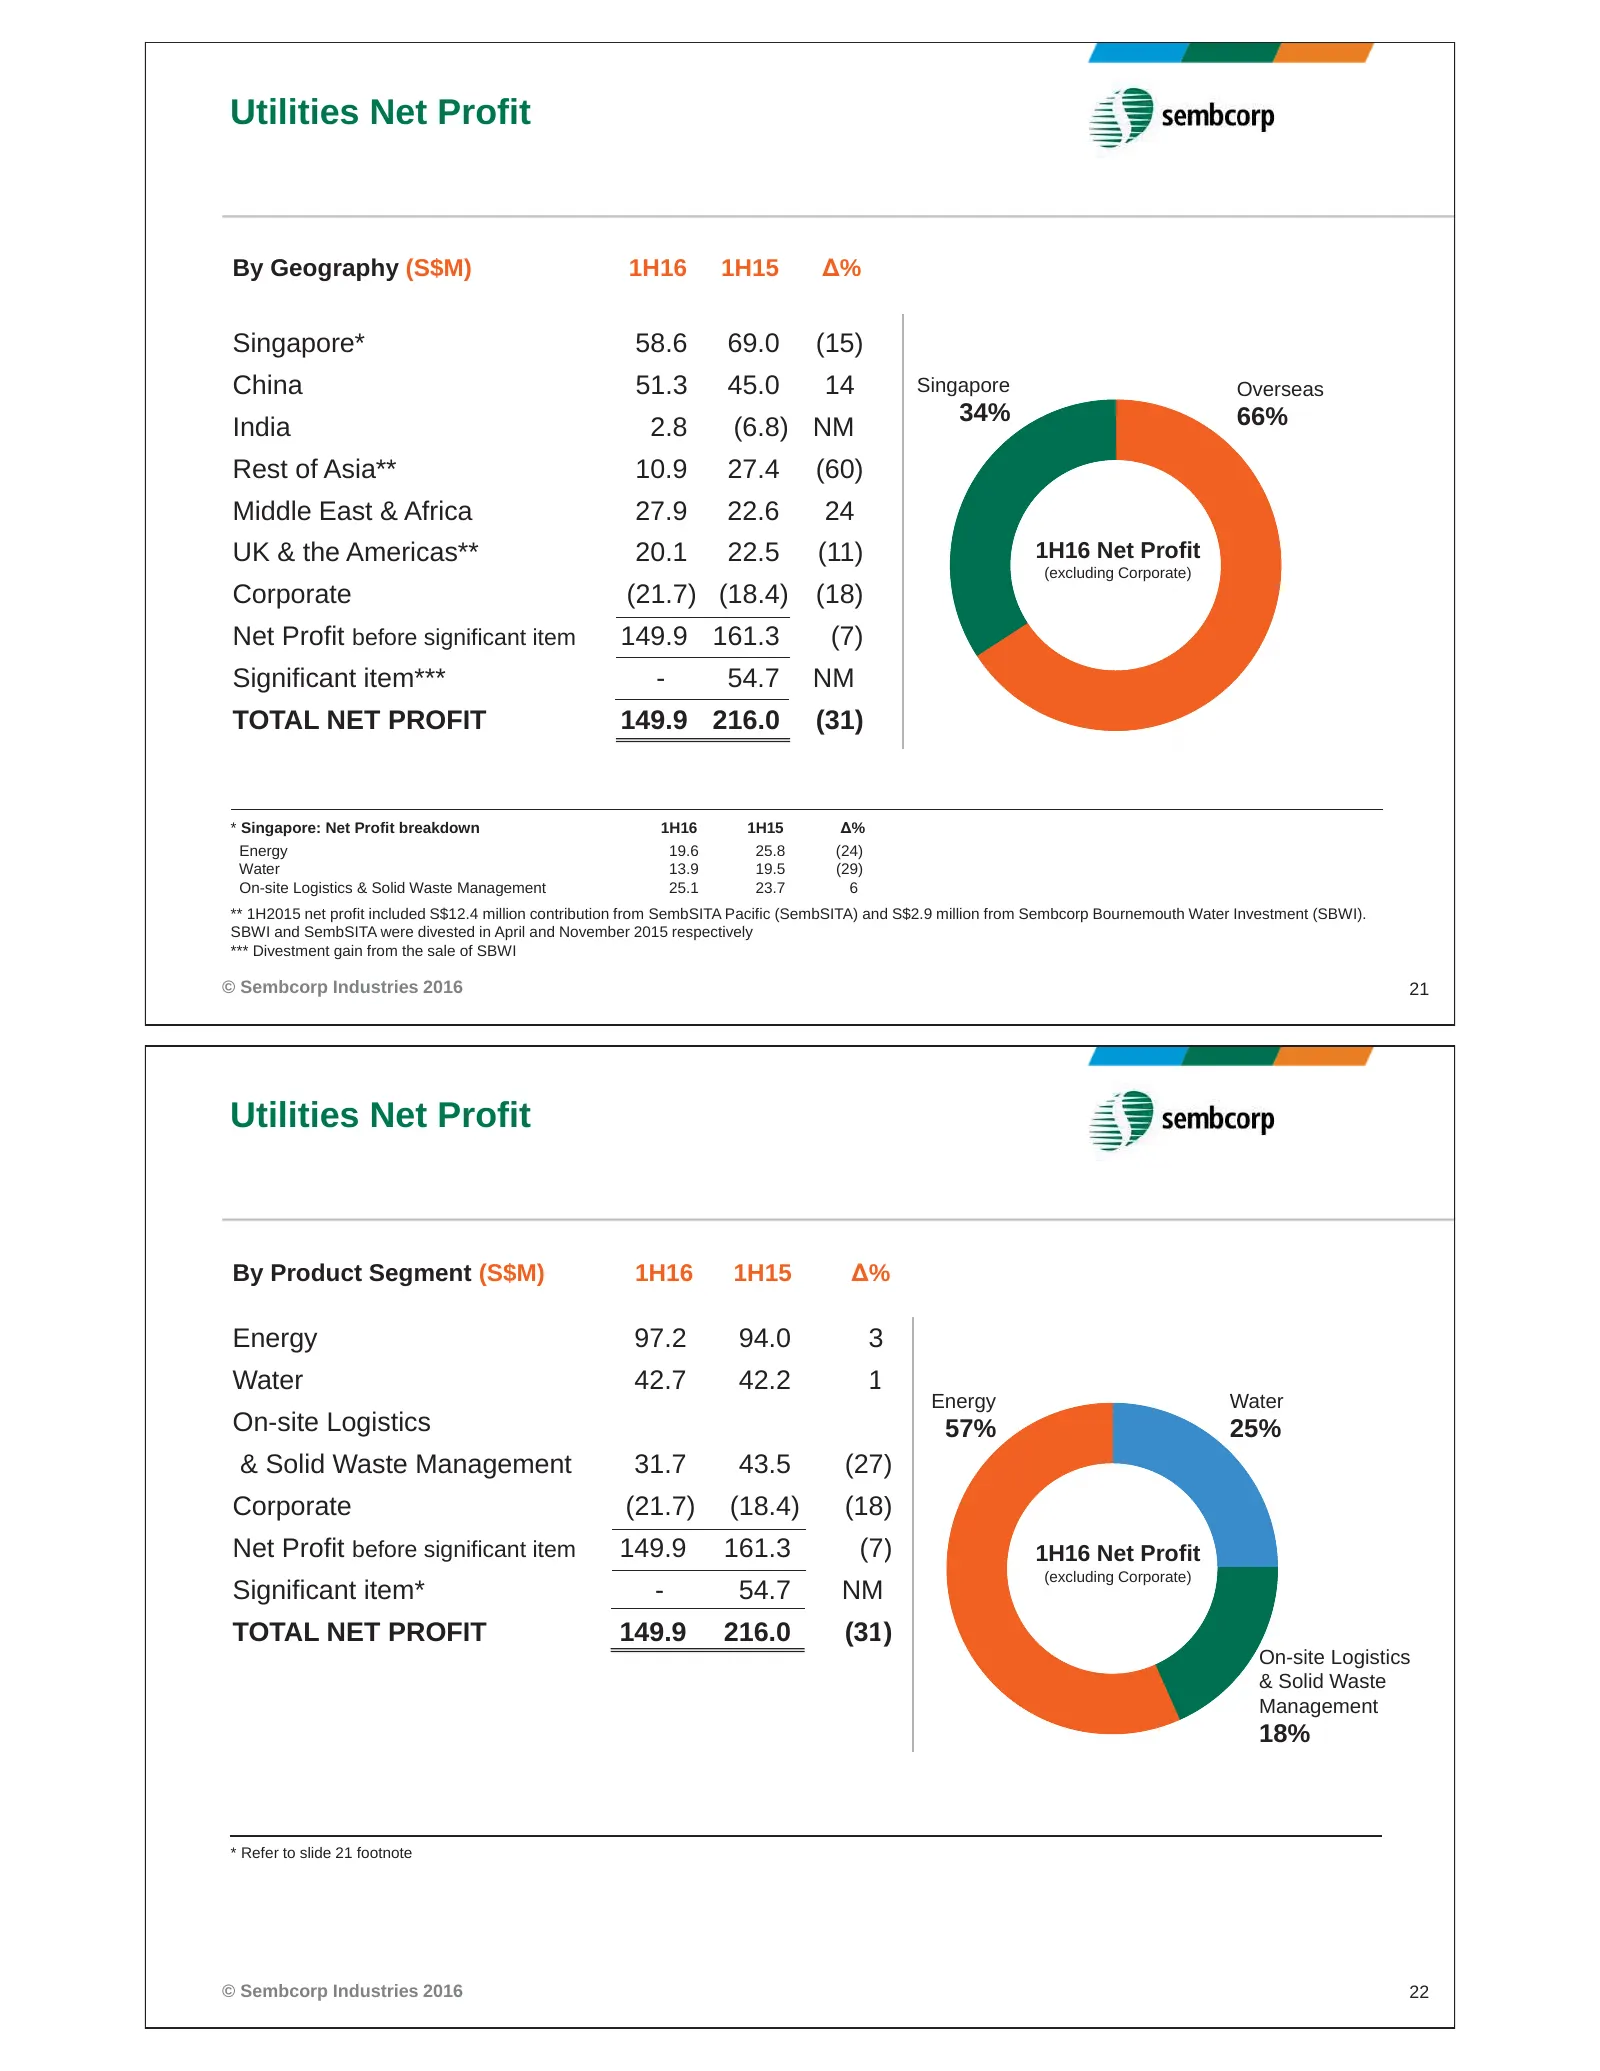
Utilities Net Profit By Geography (S$M) 1H16 1H15 Δ% Singapore* 58.6 69.0 (15) China 51.3 45.0 14 Singapore Overseas 34% 66% India 2.8 (6.8) NM Rest of Asia** 10.9 27.4 (60) Middle East & Africa 27.9 22.6 24 UK & the Americas** 20.1 22.5 (11) 1H16 Net Profit (excluding Corporate) Corporate (21.7) (1
Slide 12: Group Capex, Equity Investment and Free Cash Flow
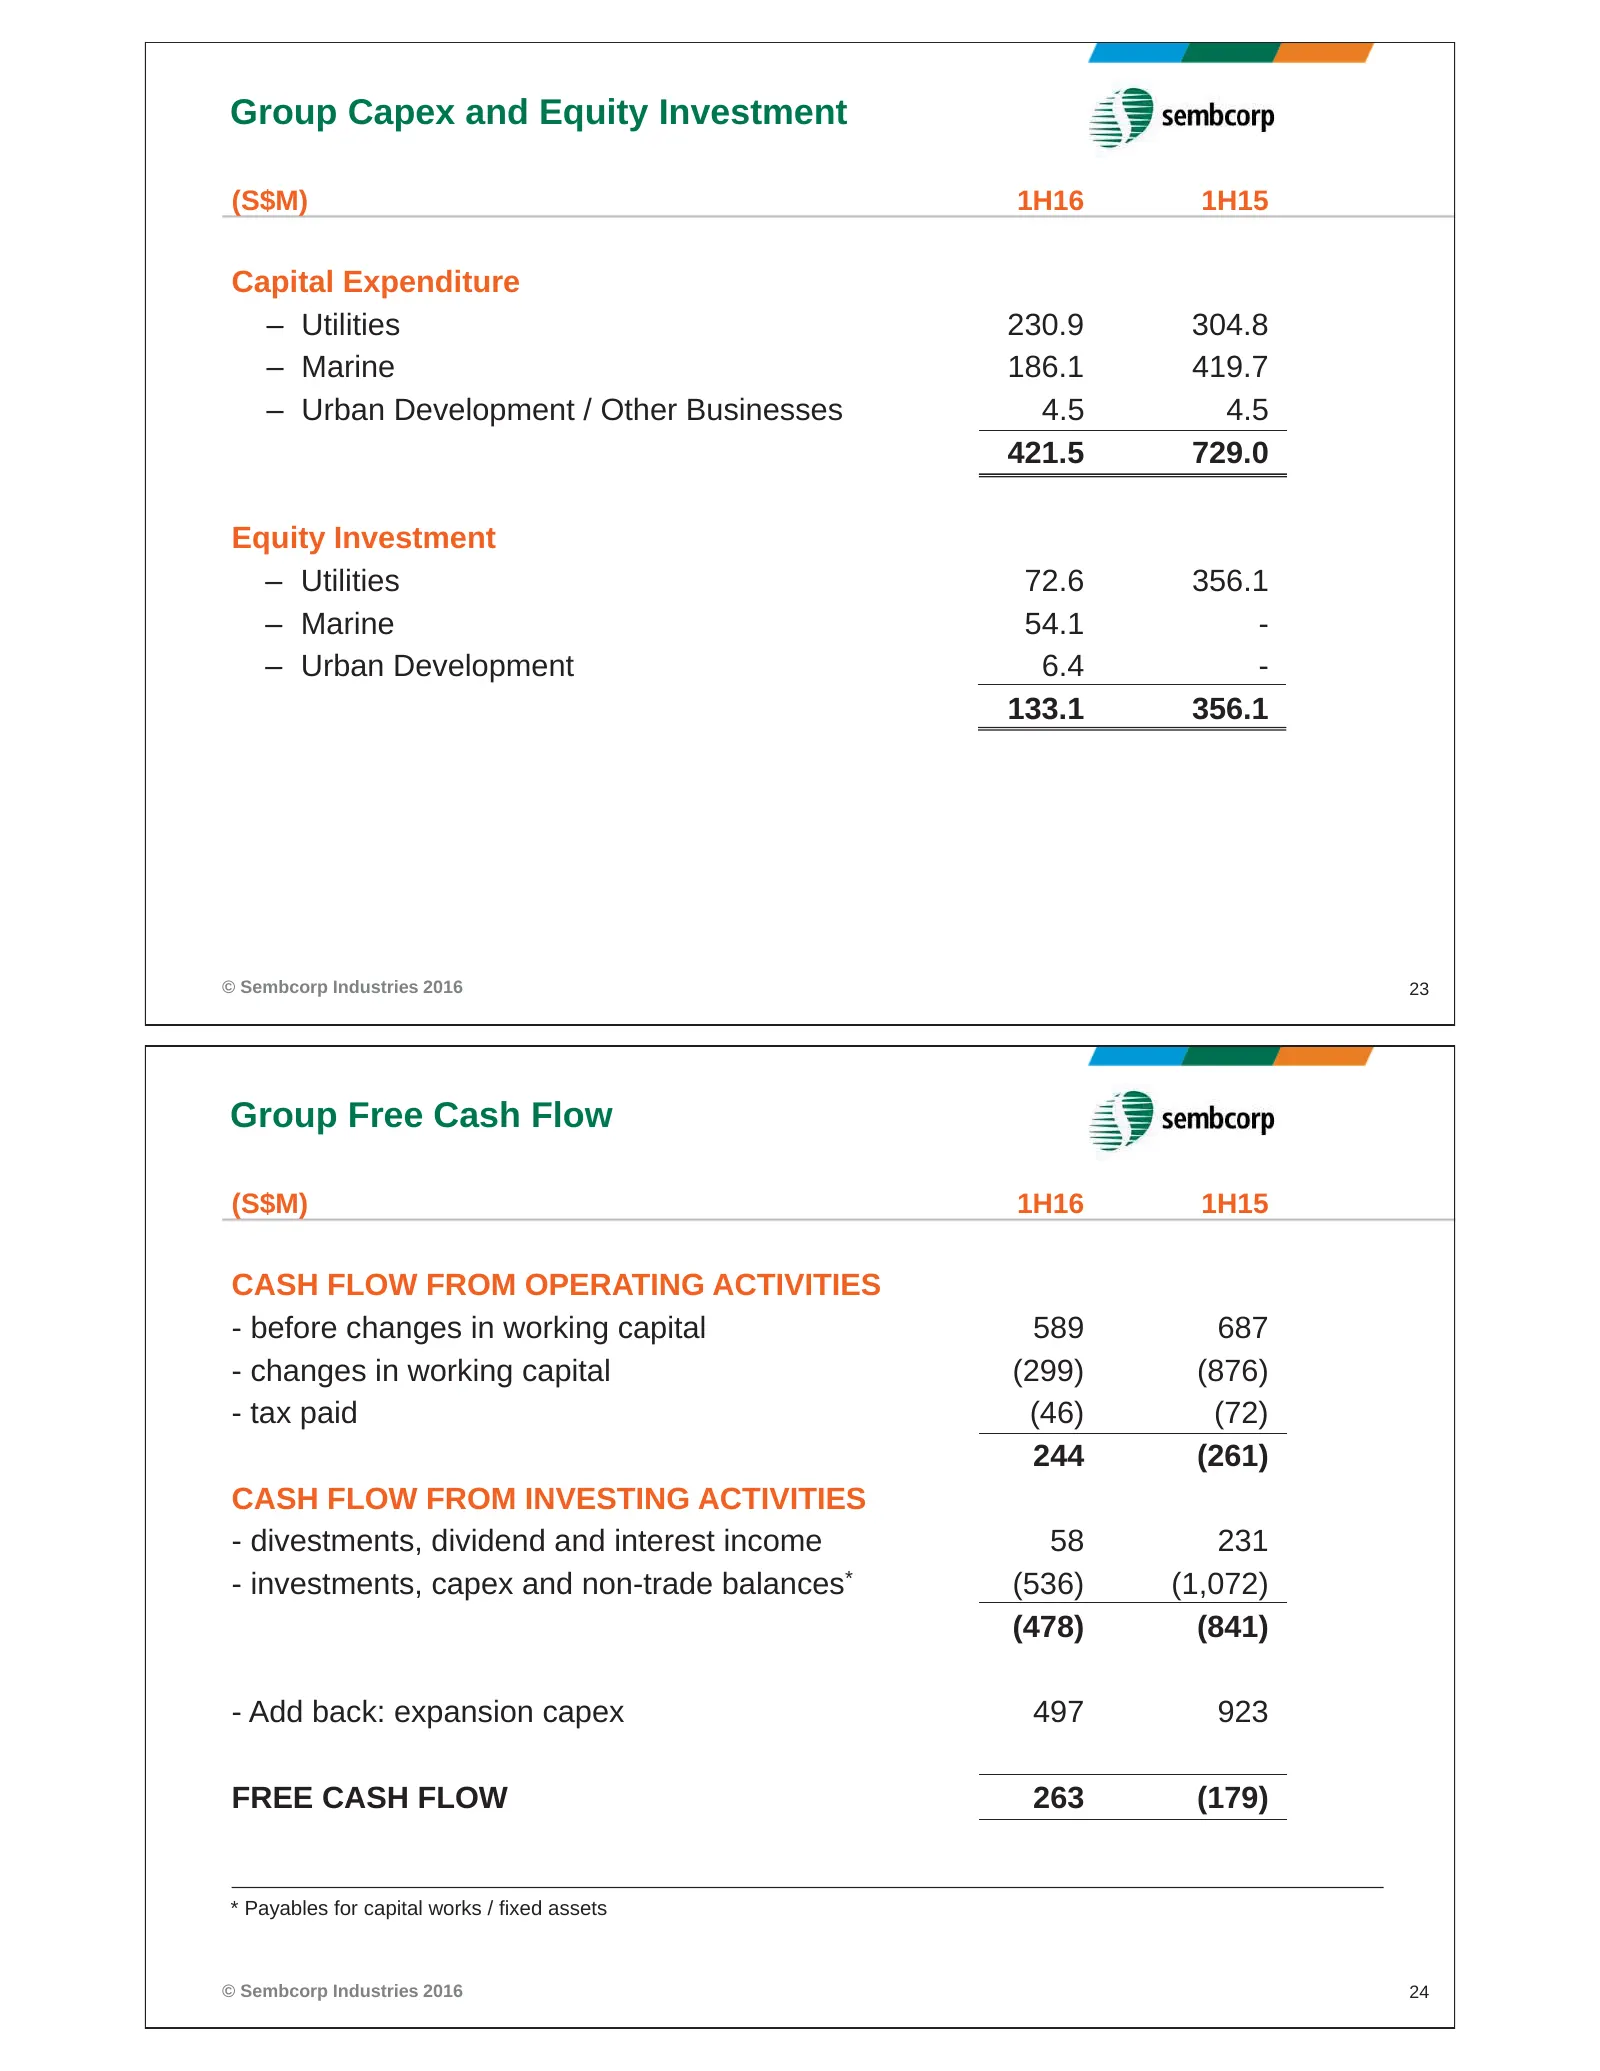
Group Capex and Equity Investment (S$M) 1H16 1H15 Capital Expenditure – Utilities 230.9 304.8 – Marine 186.1 419.7 – Urban Development / Other Businesses 4.5 4.5 421.5 729.0 Equity Investment – Utilities 72.6 356.1 – Marine 54.1 - – Urban Development 6.4 - 133.1 356.1 © Sembcorp Industries 2016 23 G
Slide 13: Group Borrowings and Financial Indicators
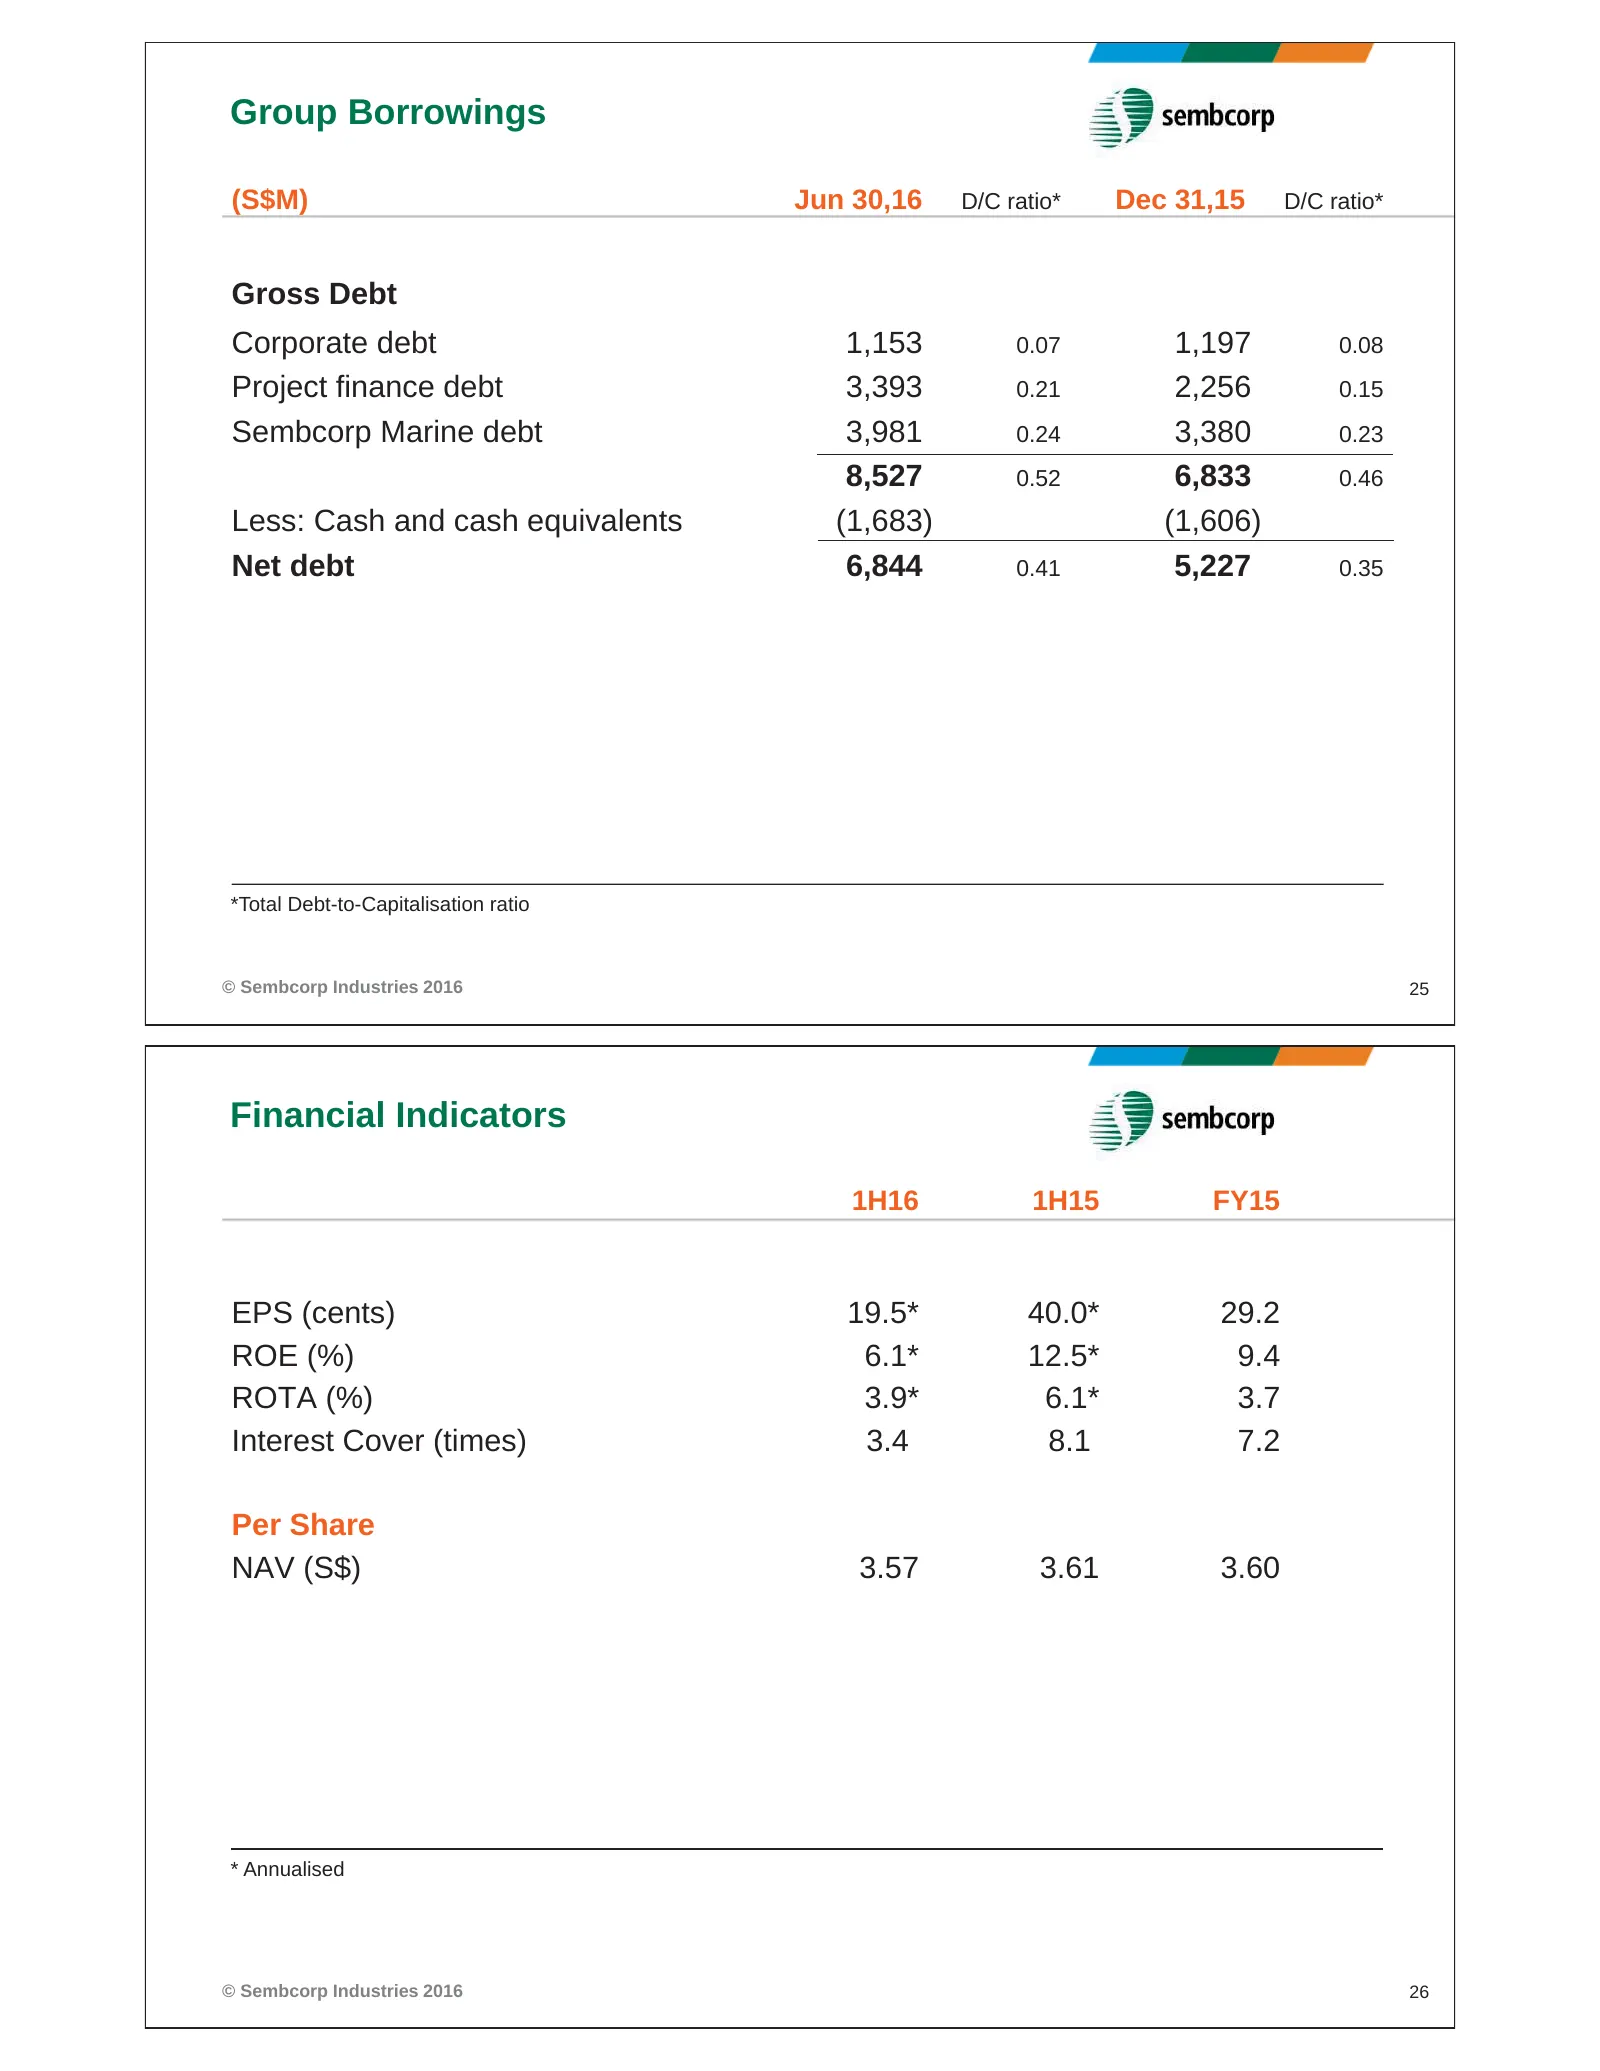
Group Borrowings (S$M) Jun 30,16 D/C ratio* Dec 31,15 D/C ratio* Gross Debt Corporate debt 1,153 0.07 1,197 0.08 Project finance debt 3,393 0.21 2,256 0.15 Sembcorp Marine debt 3,981 0.24 3,380 0.23 8,527 0.52 6,833 0.46 Less: Cash and cash equivalents (1,683) (1,606) Net debt 6,844 0.41 5,227 0.35
Slide 14: Group Outlook
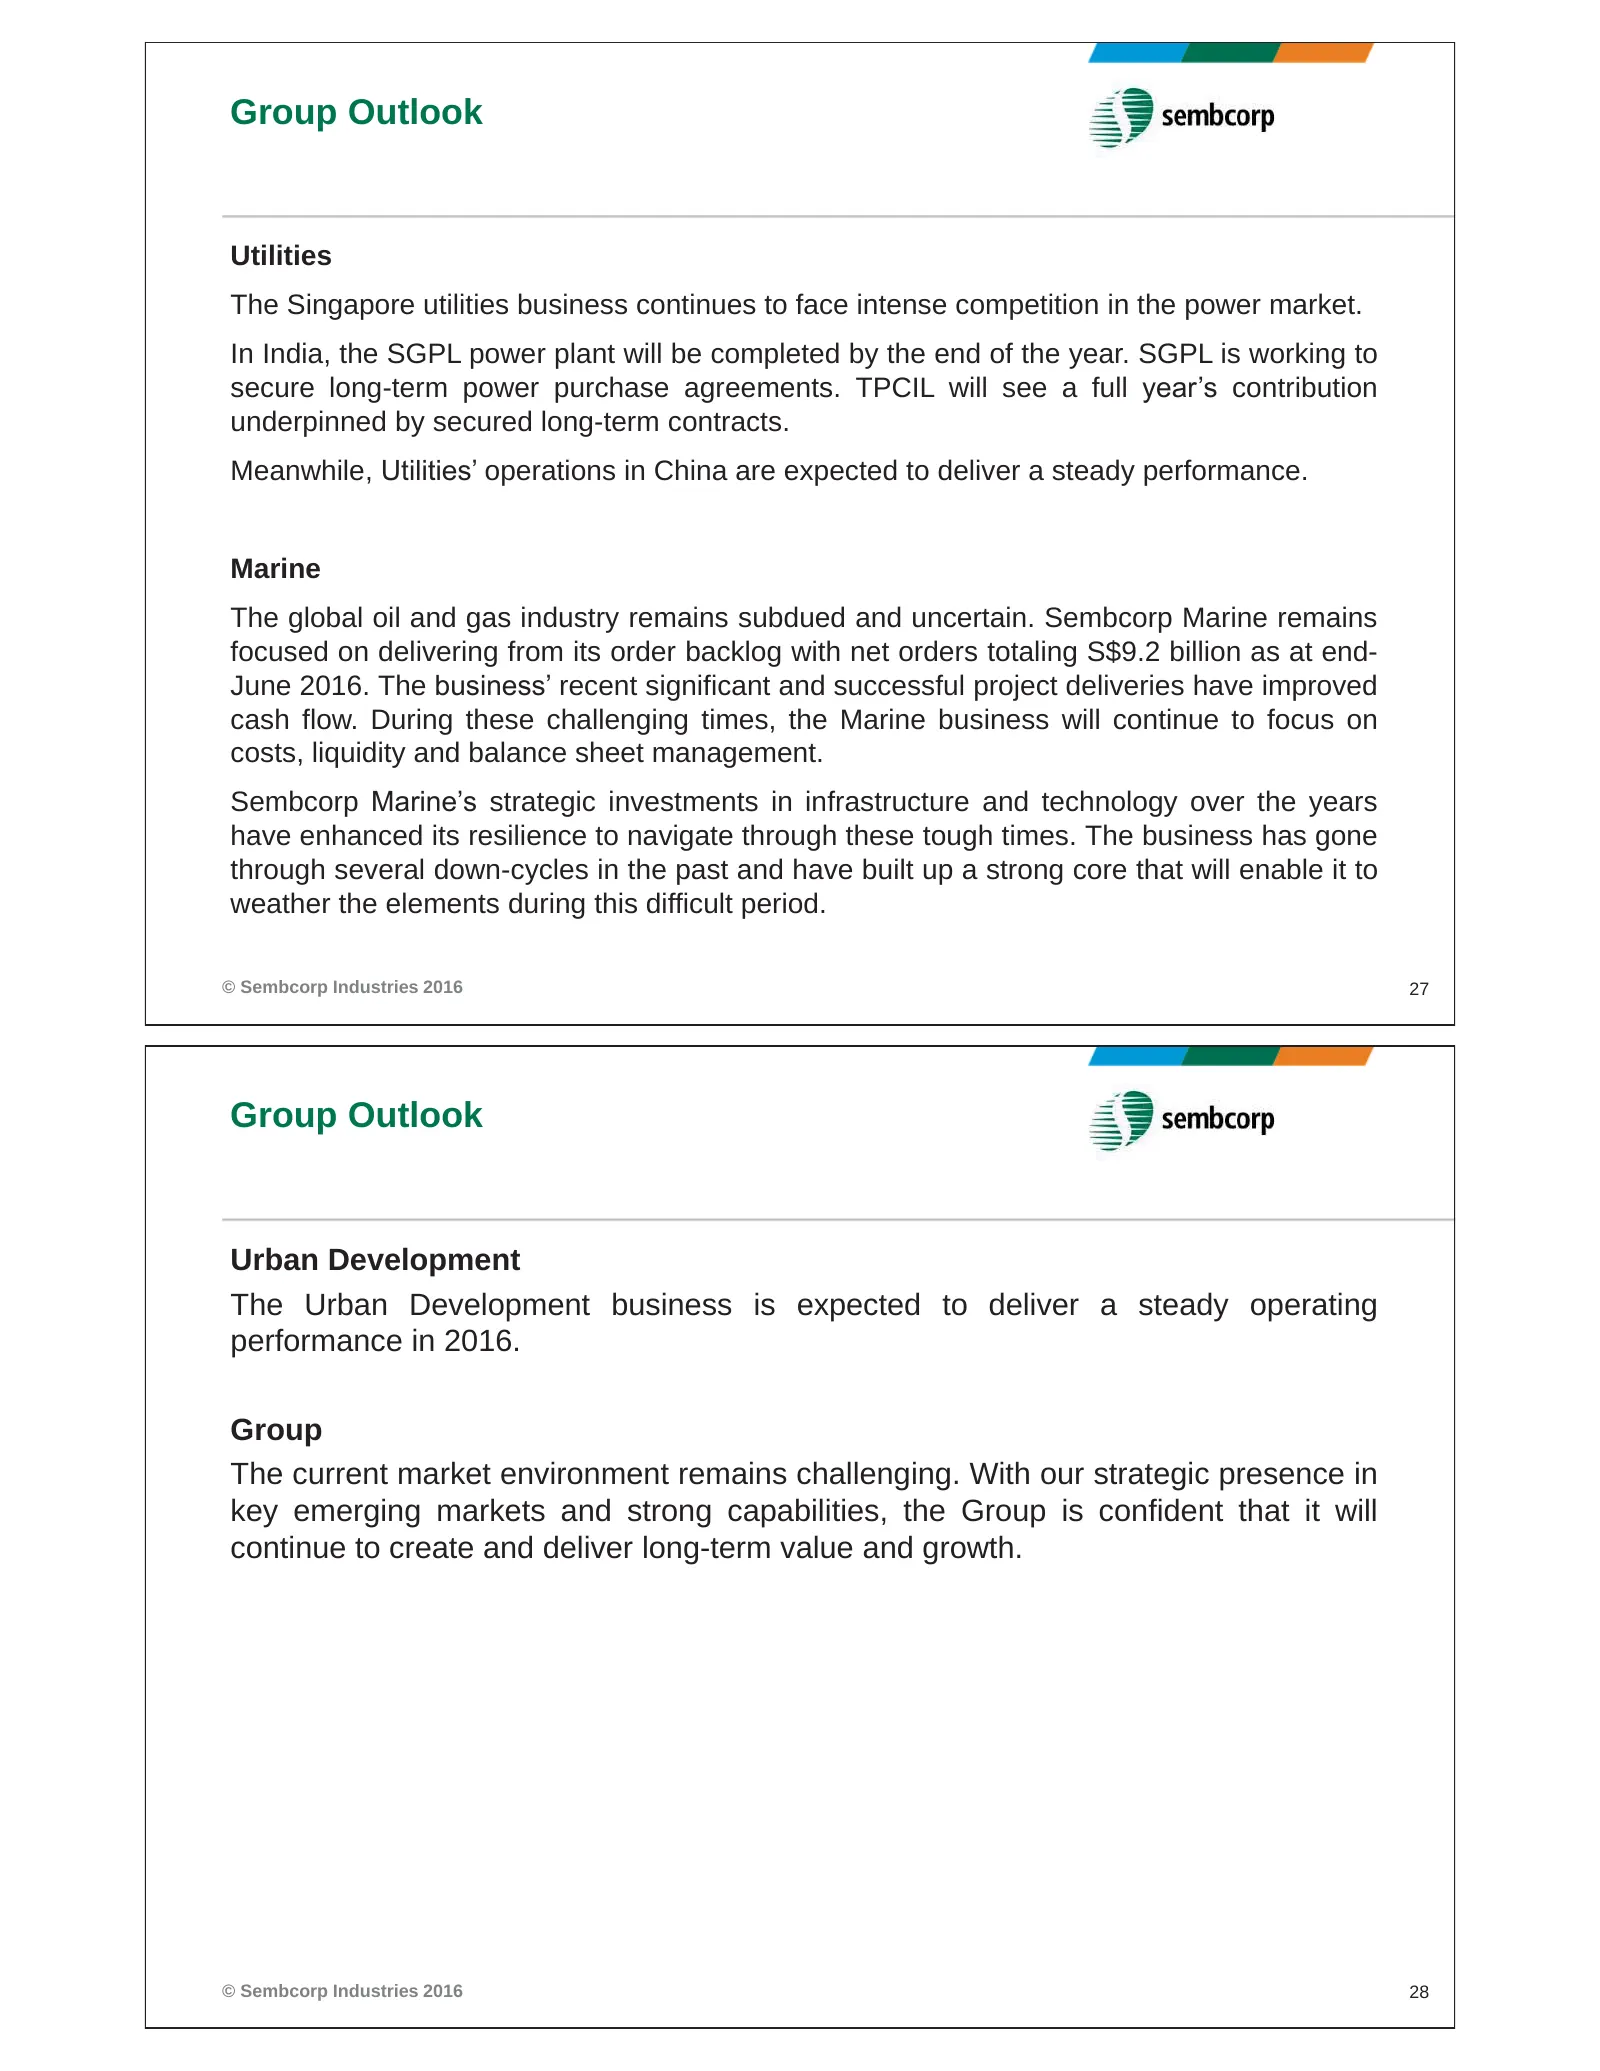
Group Outlook Utilities The Singapore utilities business continues to face intense competition in the power market. In India, the SGPL power plant will be completed by the end of the year. SGPL is working to secure long-term power purchase agreements. TPCIL will see a full year’s contribution underp
Slide 15: Disclaimer
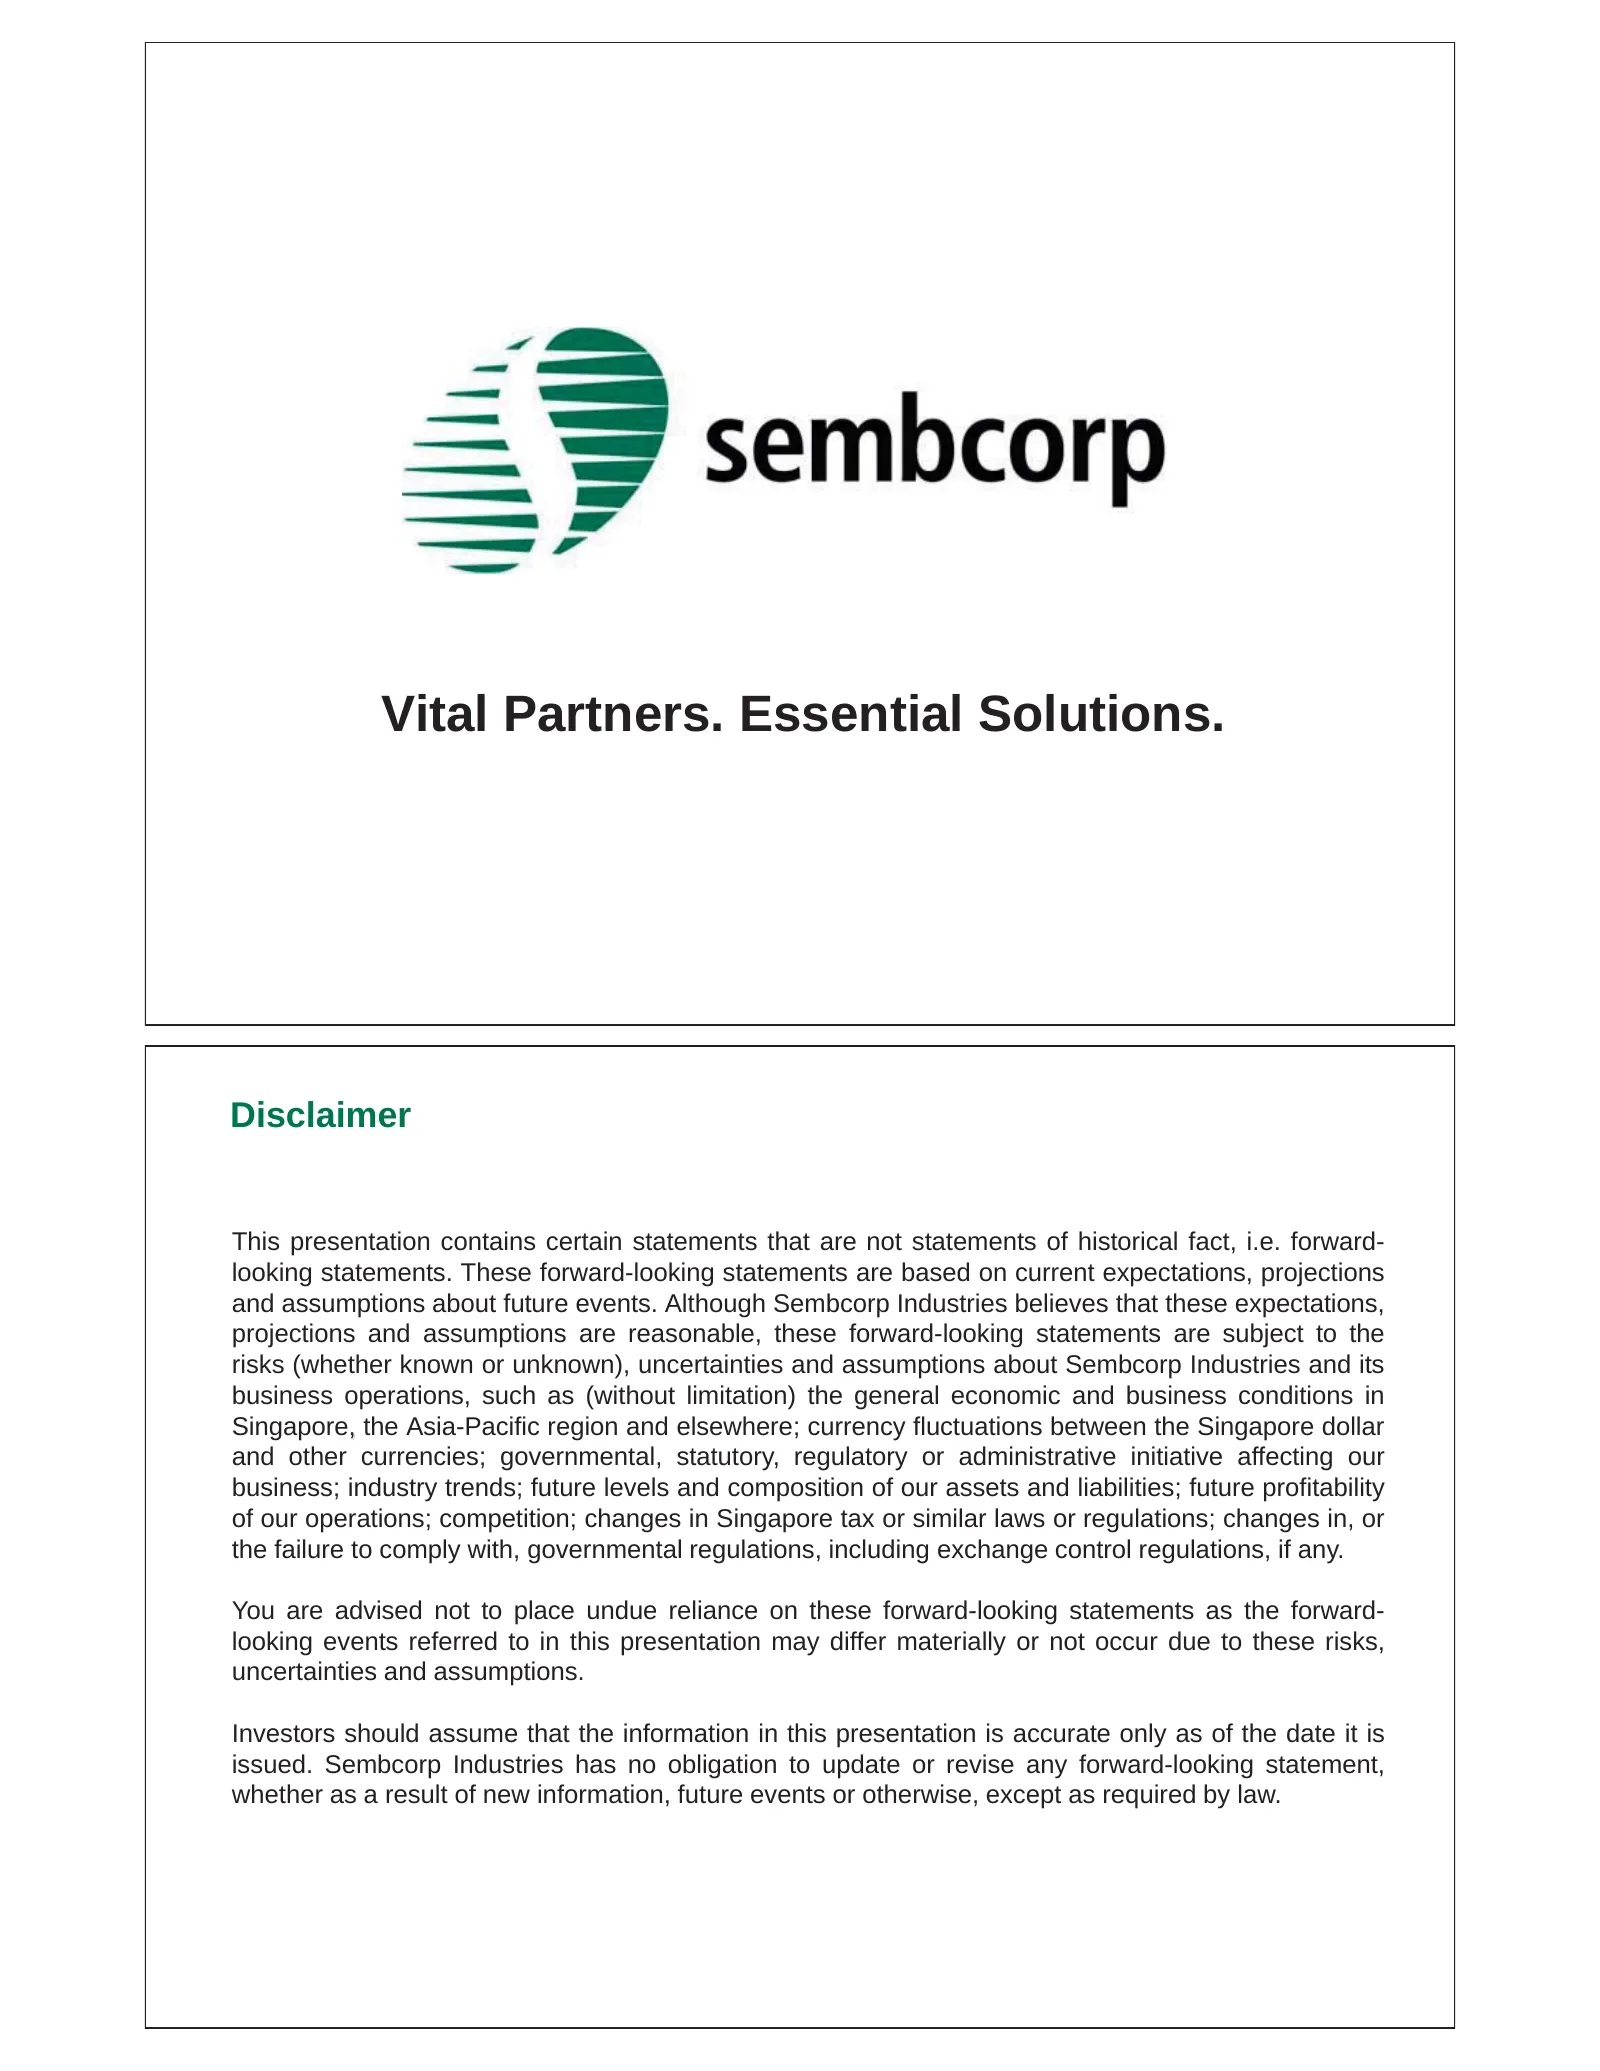
Vital Partners. Essential Solutions. Disclaimer This presentation contains certain statements that are not statements of historical fact, i.e. forward- looking statements. These forward-looking statements are based on current expectations, projections and assumptions about future events. Although Se
Slide 16: Appendix: Group Profit & Loss 2Q16
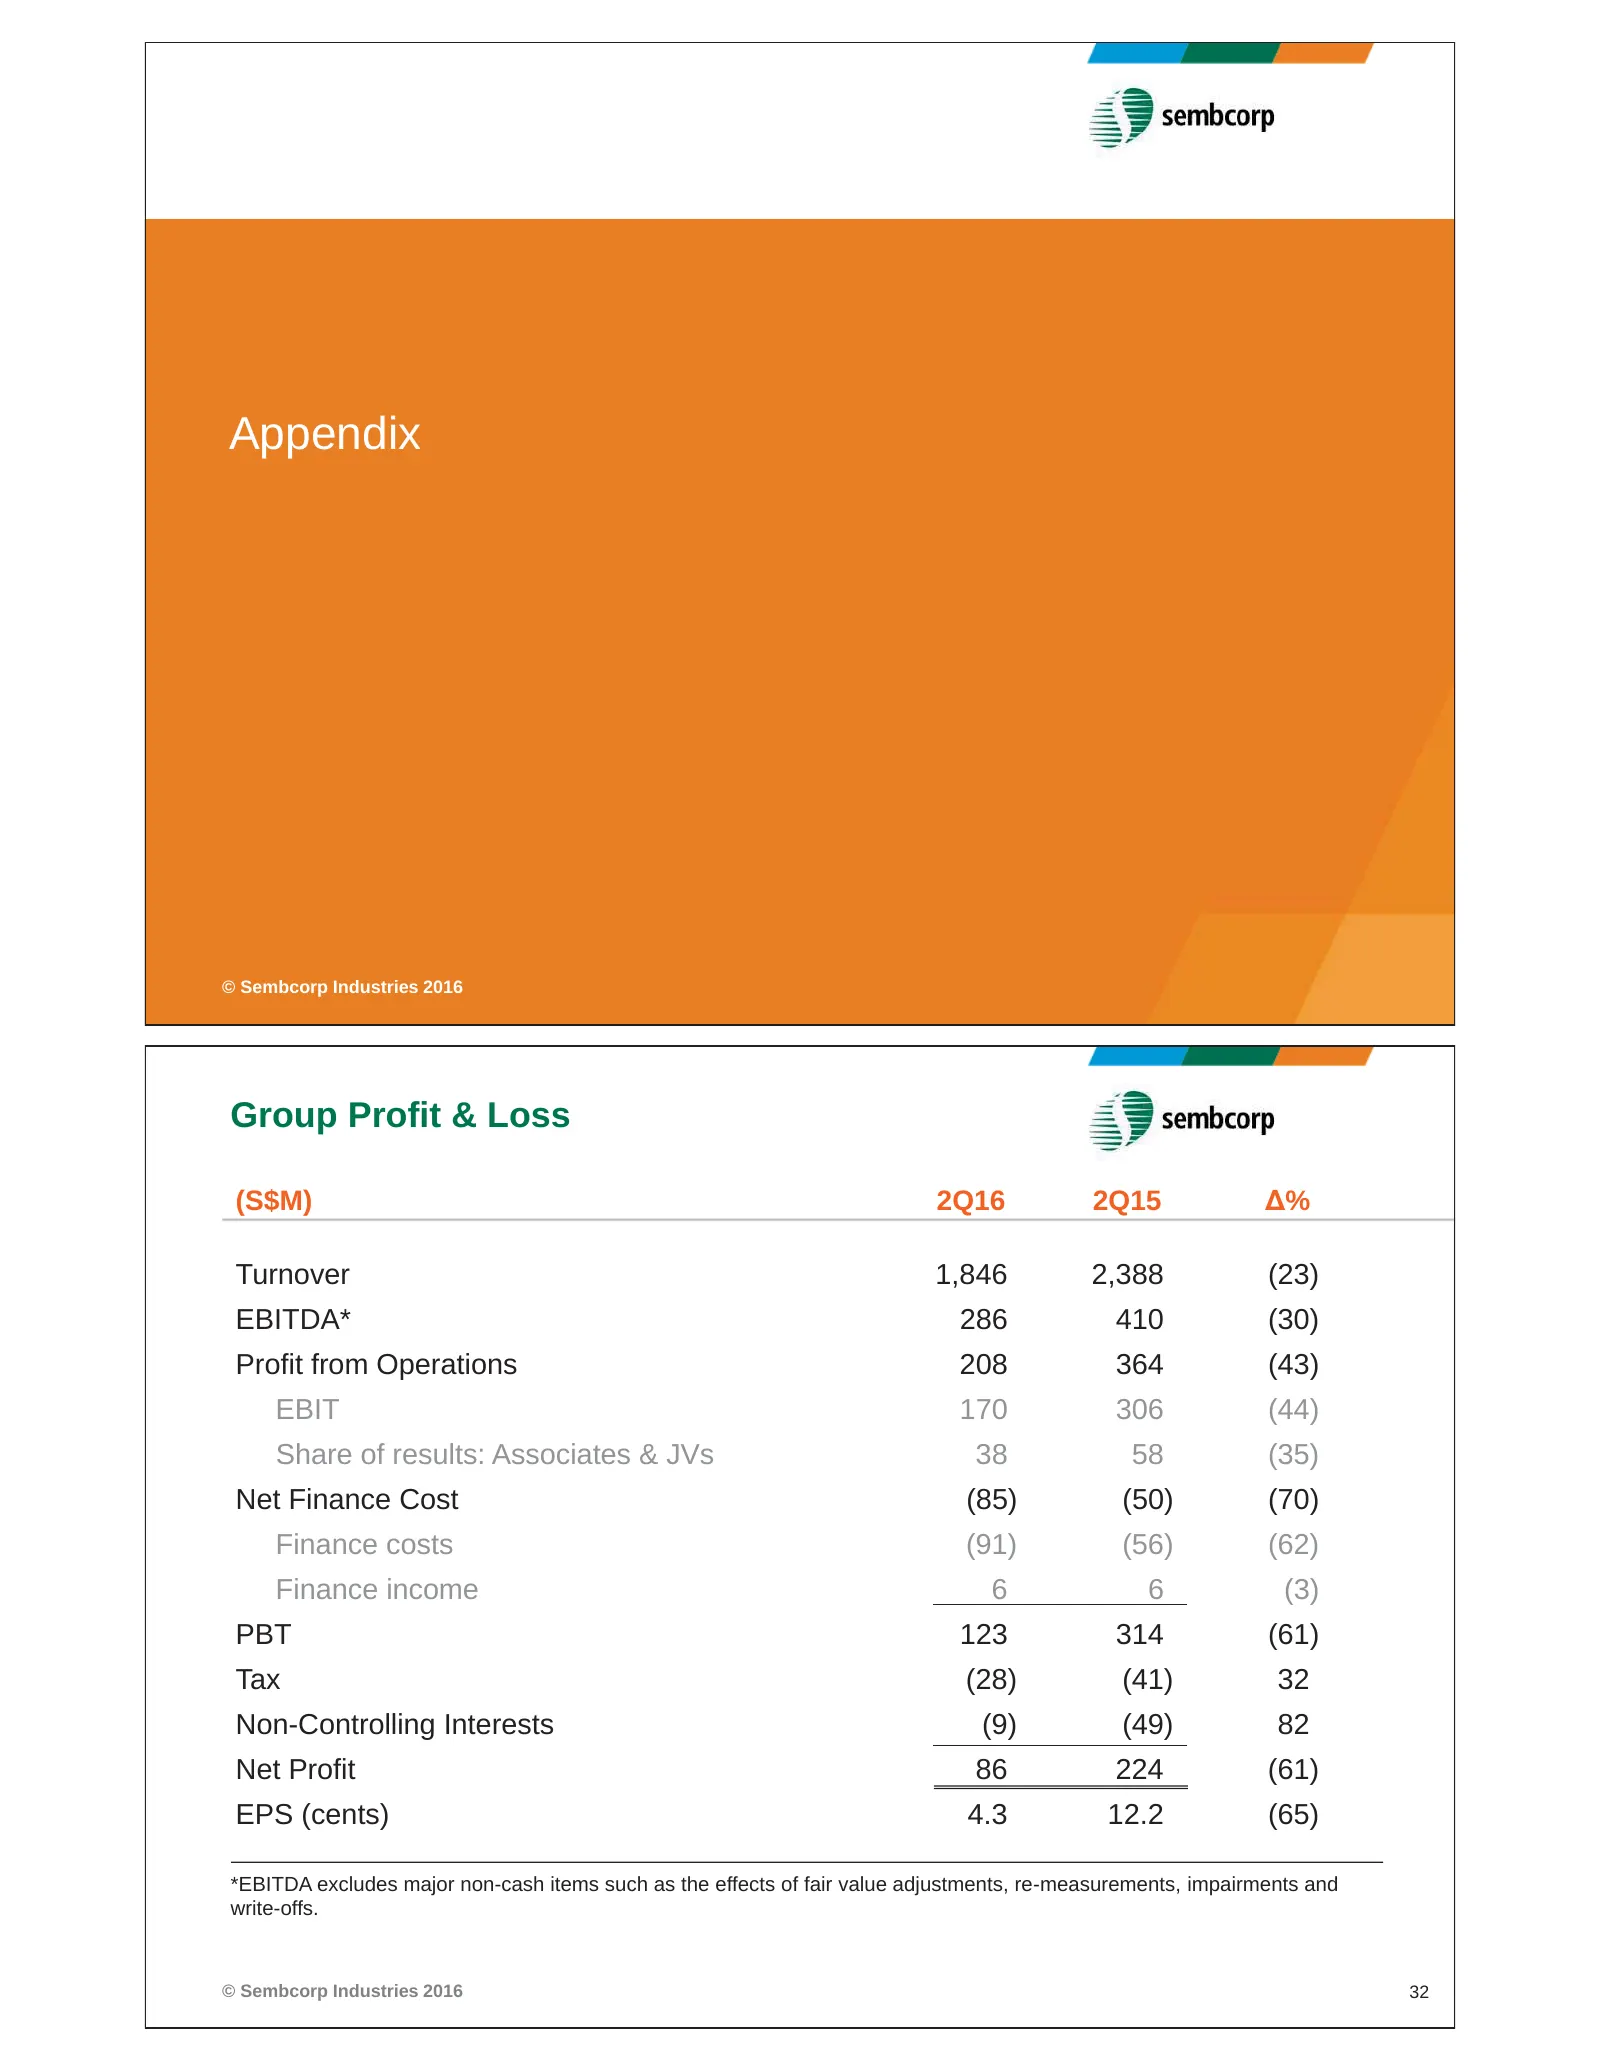
Appendix © Sembcorp Industries 2016 Group Profit & Loss (S$M) 2Q16 2Q15 Δ% Turnover 1,846 2,388 (23) EBITDA* 286 410 (30) Profit from Operations 208 364 (43) EBIT 170 306 (44) Share of results: Associates & JVs 38 58 (35) Net Finance Cost (85) (50) (70) Finance costs (91) (56) (62) Finance income 6
Slide 17: Group Turnover and Profit from Operations
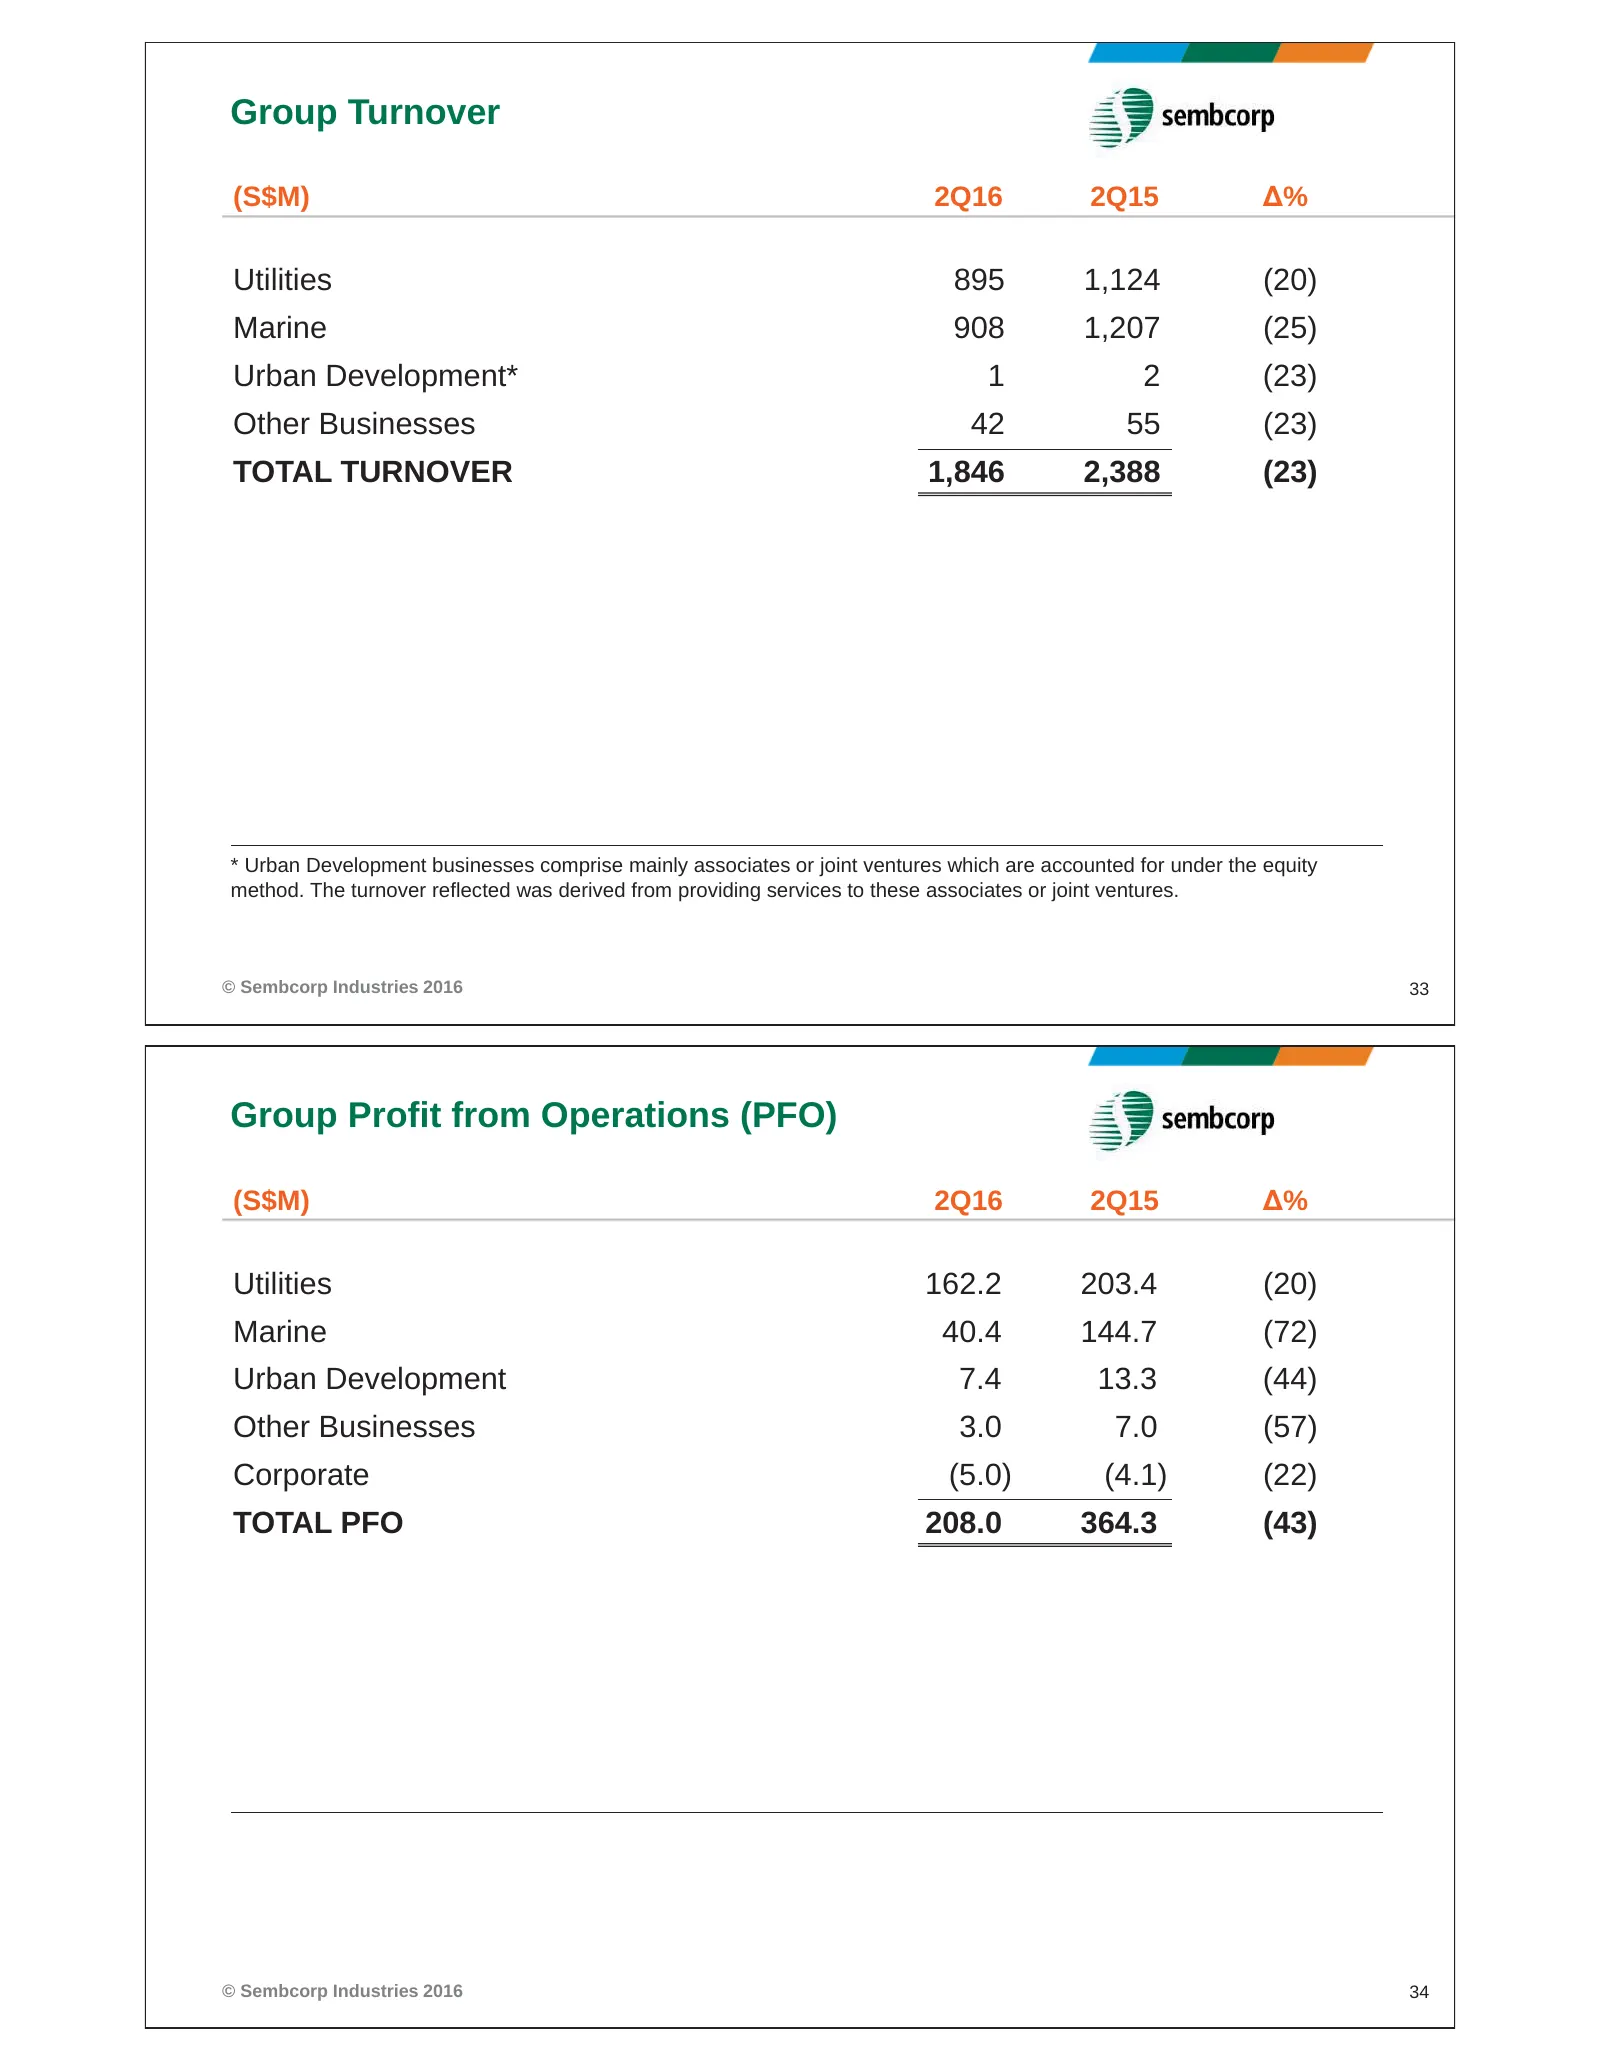
Group Turnover (S$M) 2Q16 2Q15 Δ% Utilities 895 1,124 (20) Marine 908 1,207 (25) Urban Development* 1 2 (23) Other Businesses 42 55 (23) TOTAL TURNOVER 1,846 2,388 (23) * Urban Development businesses comprise mainly associates or joint ventures which are accounted for under the equity method. The tu
Slide 18: Group Net Profit and Utilities Turnover
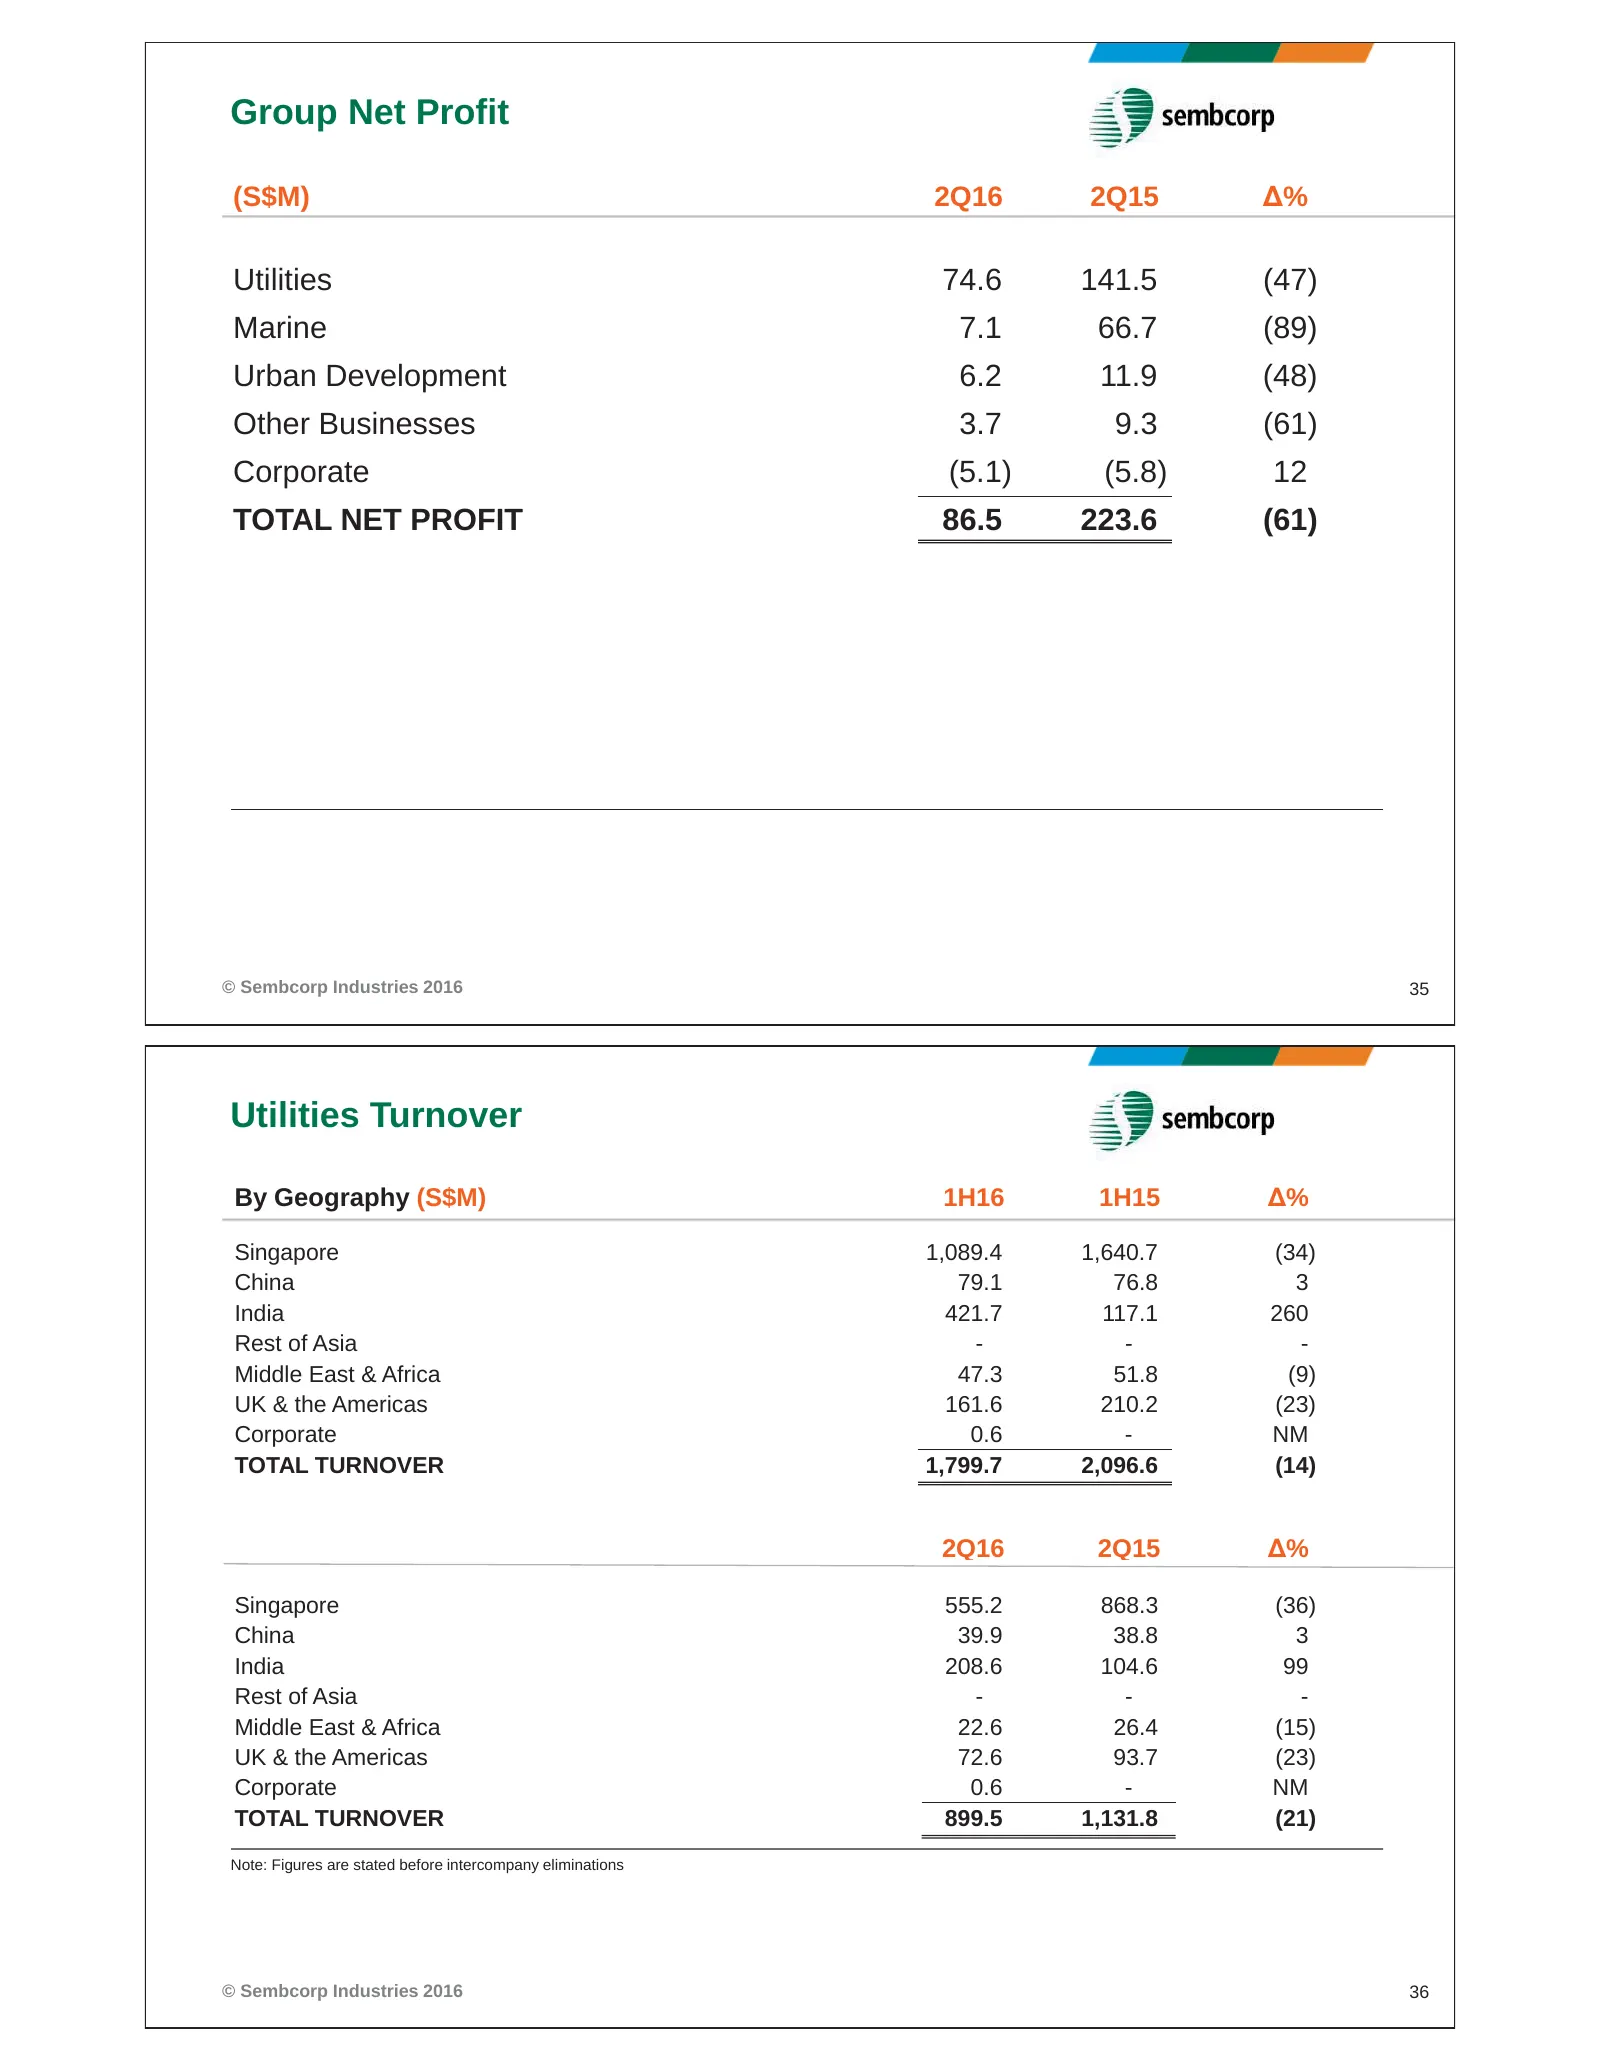
Group Net Profit (S$M) 2Q16 2Q15 Δ% Utilities 74.6 141.5 (47) Marine 7.1 66.7 (89) Urban Development 6.2 11.9 (48) Other Businesses 3.7 9.3 (61) Corporate (5.1) (5.8) 12 TOTAL NET PROFIT 86.5 223.6 (61) © Sembcorp Industries 2016 35 Utilities Turnover By Geography (S$M) 1H16 1H15 Δ% Singapore 1,089.
Slide 19: Utilities Profit From Operations by Geography
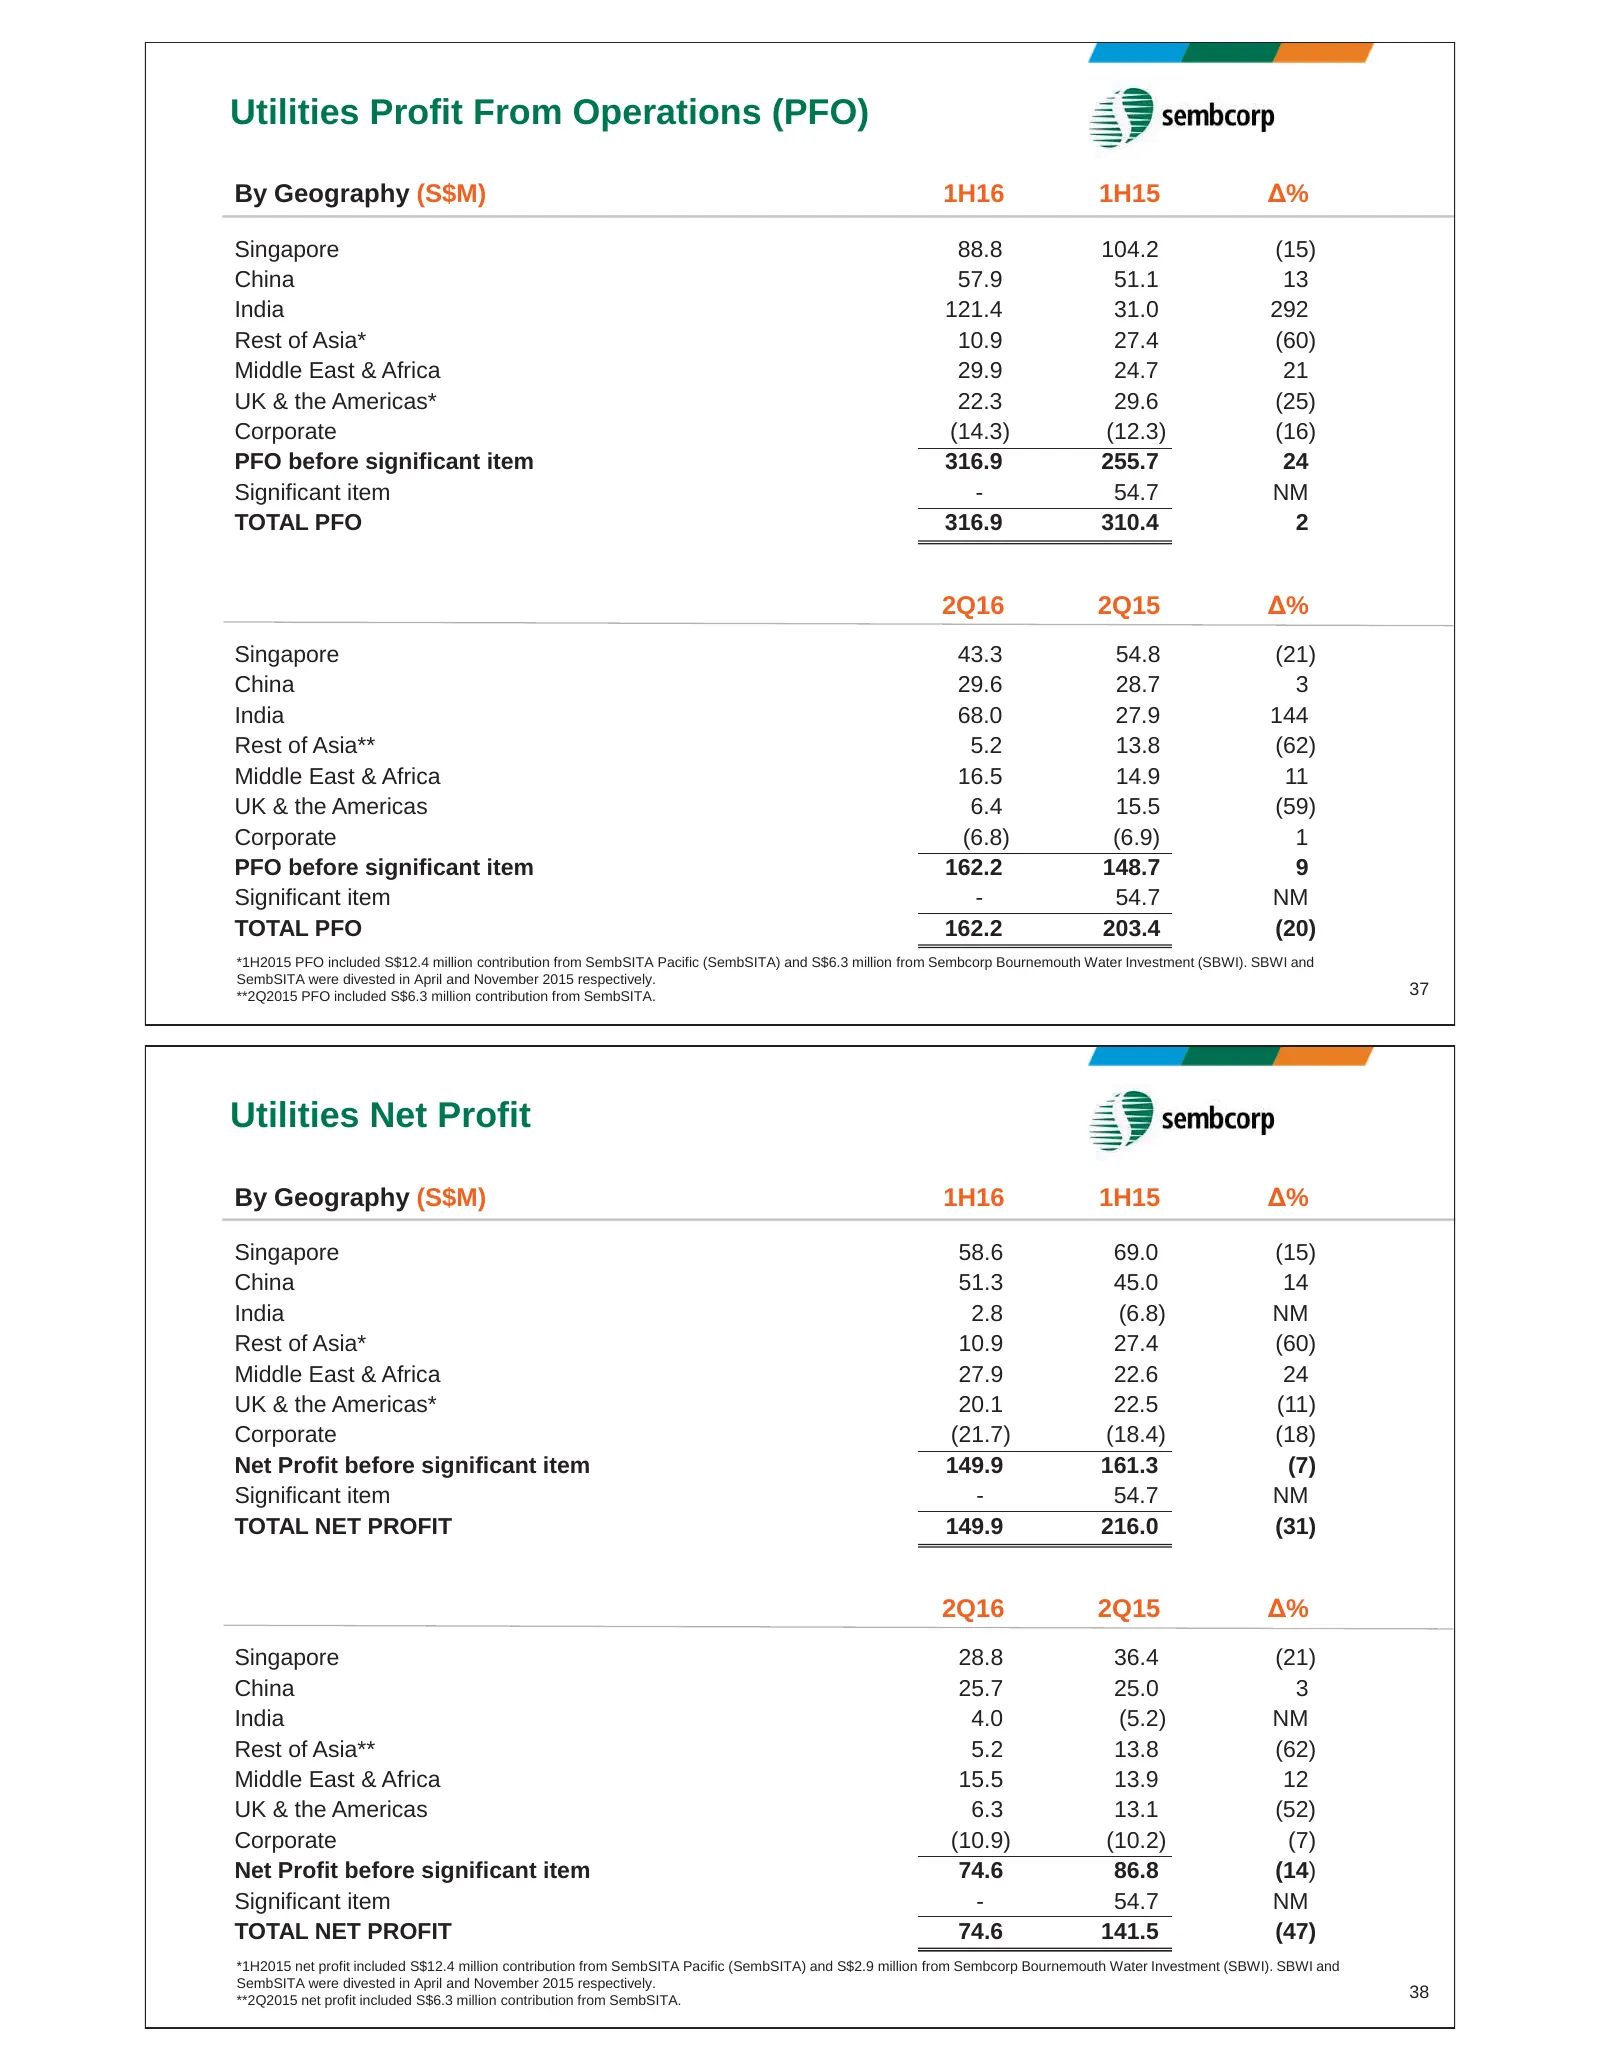
Utilities Profit From Operations (PFO) By Geography (S$M) 1H16 1H15 Δ% Singapore 88.8 104.2 (15) China 57.9 51.1 13 India 121.4 31.0 292 Rest of Asia* 10.9 27.4 (60) Middle East & Africa 29.9 24.7 21 UK & the Americas* 22.3 29.6 (25) Corporate (14.3) (12.3) (16) PFO before significant item 316.9 255
Slide 20: Utilities Turnover and PFO by Product Segment
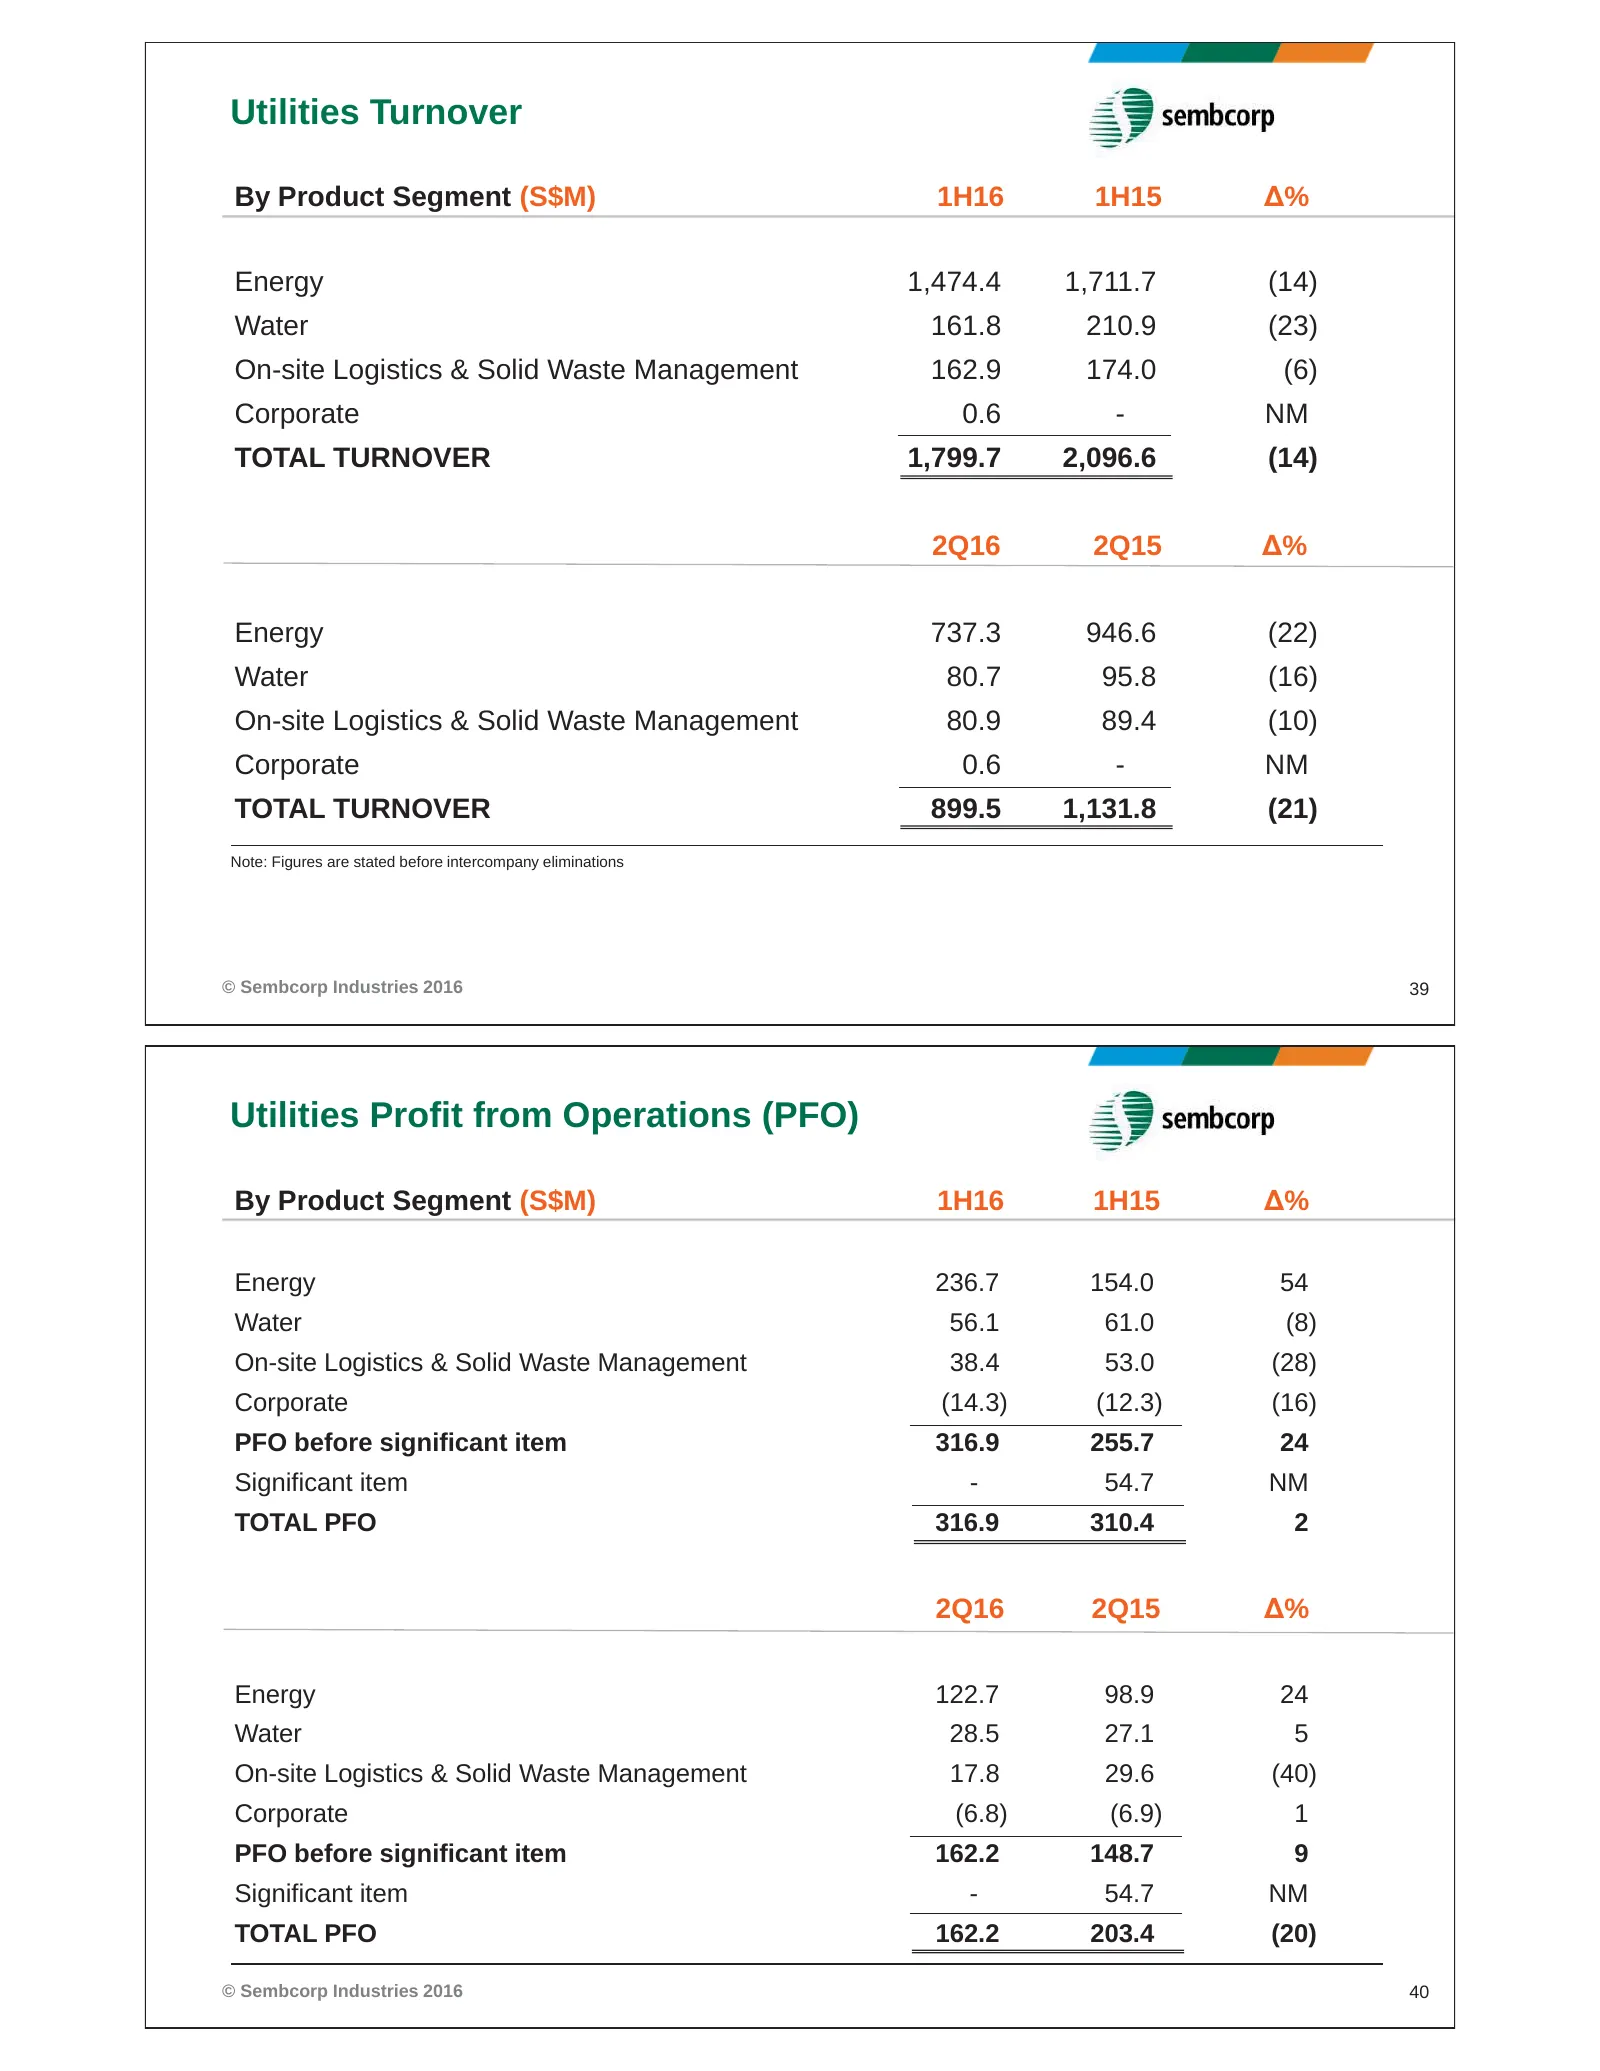
Utilities Turnover By Product Segment (S$M) 1H16 1H15 Δ% Energy 1,474.4 1,711.7 (14) Water 161.8 210.9 (23) On-site Logistics & Solid Waste Management 162.9 174.0 (6) Corporate 0.6 - NM TOTAL TURNOVER 1,799.7 2,096.6 (14) 2Q16 2Q15 Δ% Energy 737.3 946.6 (22) Water 80.7 95.8 (16) On-site Logistics &
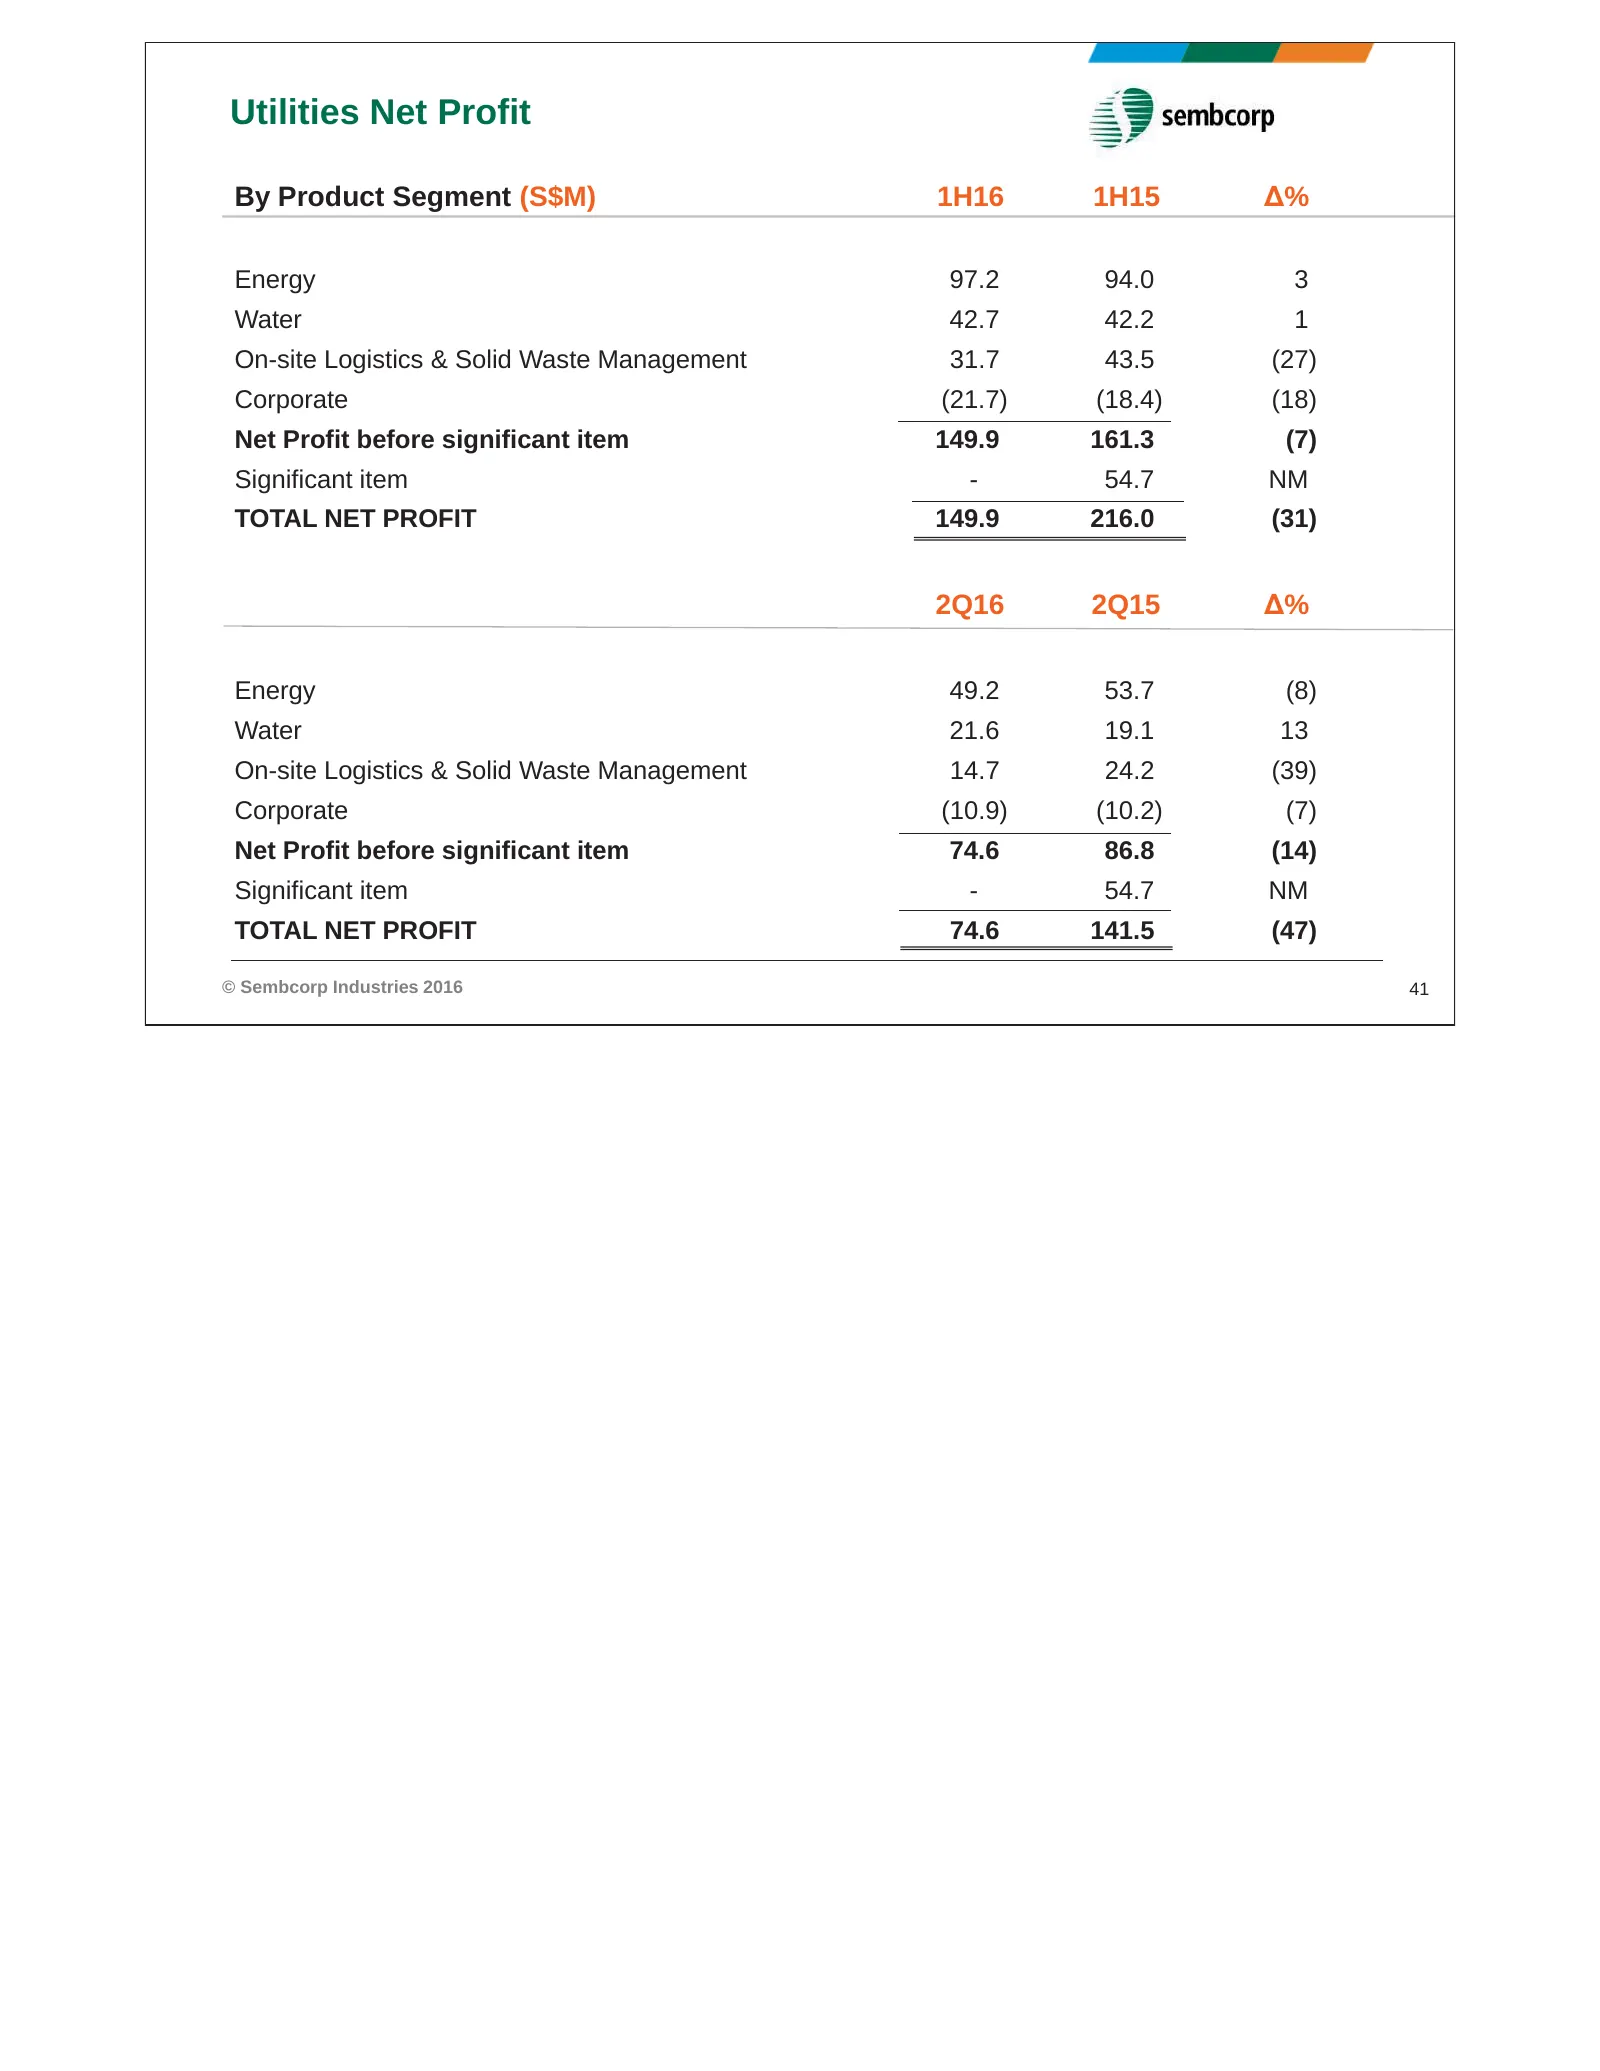
Slide 21: Utilities Net Profit by Product Segment
Utilities Net Profit By Product Segment (S$M) 1H16 1H15 Δ% Energy 97.2 94.0 3 Water 42.7 42.2 1 On-site Logistics & Solid Waste Management 31.7 43.5 (27) Corporate (21.7) (18.4) (18) Net Profit before significant item 149.9 161.3 (7) Significant item - 54.7 NM TOTAL NET PROFIT 149.9 216.0 (31) 2Q16
Source: Internet Archive copy of sembcorp.com
More decks from Sembcorp Industries Ltd.
 H1 2026 Earnings Presentation26 slides · Aug 13, 2026
 Investor Presentation (June 2026)52 slides · June 2026
 Shareholder Meeting (April 2026)11 slides · Apr 29, 2026
 FY2025 Earnings Presentation35 slides · Feb 25, 2026
 Merger or Acquisition (January 2026)13 slides · Jan 30, 2026
 Merger or Acquisition (December 2025)24 slides · Dec 11, 2025