Bob Evans Farms — Evans BOB Farms — Investor Day (June 2010)
165 slides from Bob Evans Farms's investor day presentation, Jun 9, 2010
Slide 1: Analyst and Investor Day June 9, 2010
1 Analyst and Investor Day June 9, 2010
Slide 2: Dave Poplar, Vice President Investor Relations
2 Dave Poplar Vice President Investor Relations
Slide 3: Safe Harbor Statement
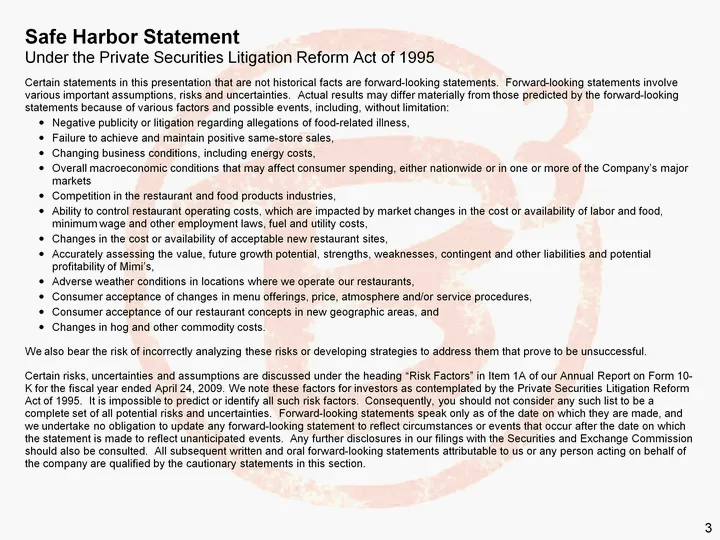
3 Safe Harbor Statement Under the Private Securities Litigation Reform Act of 1995 Certain statements in this presentation that are not historical facts are forward-looking statements. Forward-looking statements involve various important assumptions, risks and uncertainties. Actual results may diffe
Slide 4: Agenda
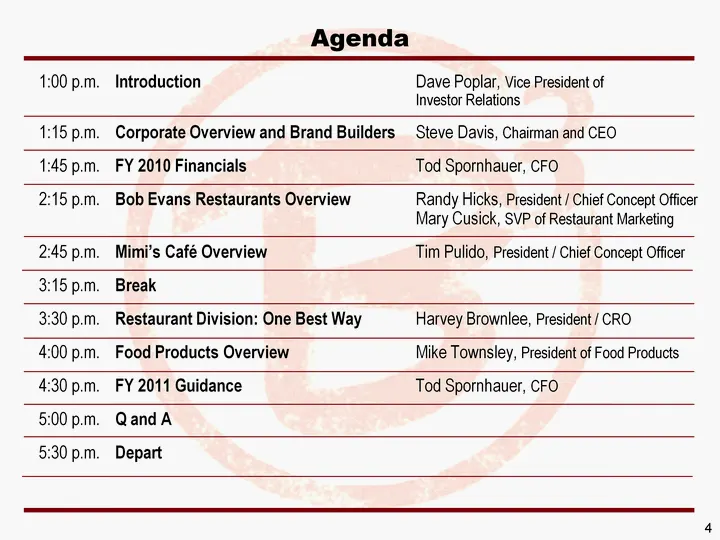
4 Agenda 1:00 p.m. Introduction Dave Poplar, Vice President of Investor Relations 1:15 p.m. Corporate Overview and Brand Builders Steve Davis, Chairman and CEO 1:45 p.m. FY 2010 Financials Tod Spornhauer, CFO 2:15 p.m. Bob Evans Restaurants Overview Randy Hicks, President / Chief Concept Officer Mar
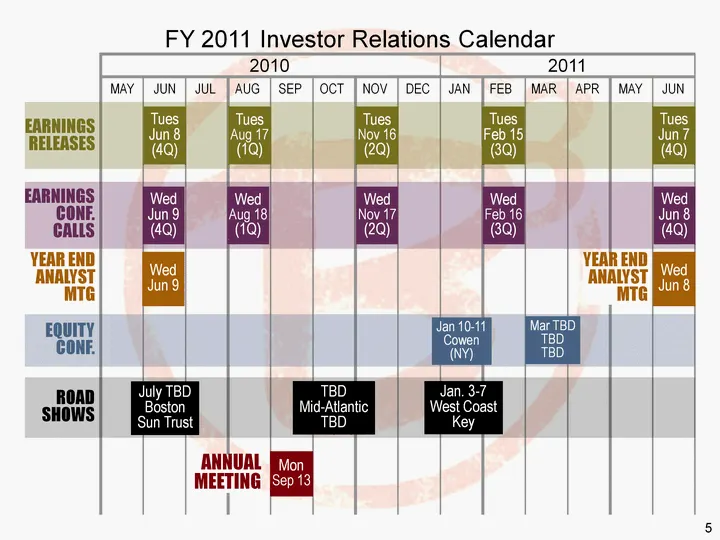
Slide 5: FY 2011 Investor Relations Calendar
5 FY 2011 Investor Relations Calendar EARNINGS RELEASES EARNINGS CONF. CALLS EQUITY CONF. ROAD SHOWS YEAR END ANALYST MTG JUN JUL AUG SEP OCT NOV DEC JAN FEB MAR APR MAY JUN MAY Tues Aug 17 (1Q) Tues Nov 16 (2Q) Tues Feb 15 (3Q) Tues Jun 7 (4Q) Tues Jun 8 (4Q) Wed Jun 9 (4Q) Wed Aug 18 (1Q) Wed Nov
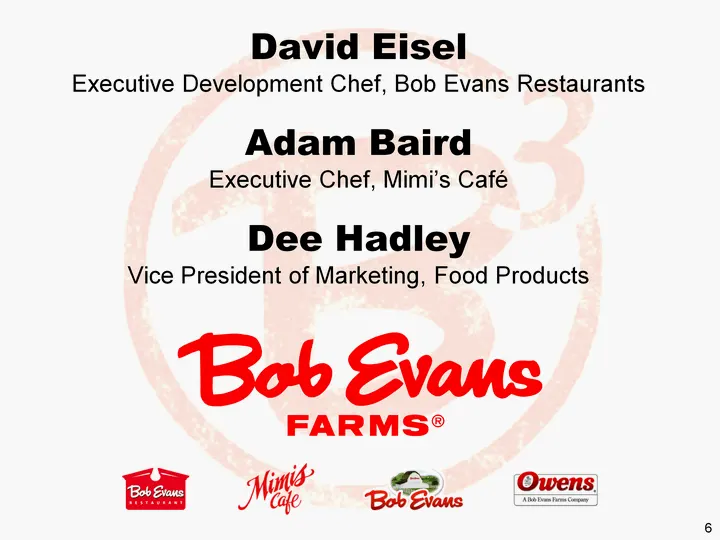
Slide 6: Chefs and Food Products marketing presenters
6 David Eisel Executive Development Chef, Bob Evans Restaurants Adam Baird Executive Chef, Mimi's Cafe Dee Hadley Vice President of Marketing, Food Products
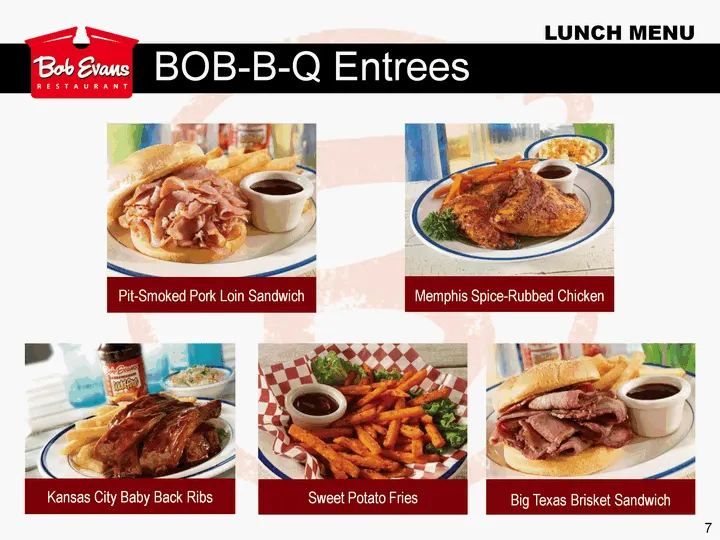
Slide 7: BOB-B-Q Entrees Lunch Menu
7 BOB-B-Q Entrees LUNCH MENU Kansas City Baby Back Ribs Sweet Potato Fries Big Texas Brisket Sandwich Memphis Spice-Rubbed Chicken Pit-Smoked Pork Loin Sandwich
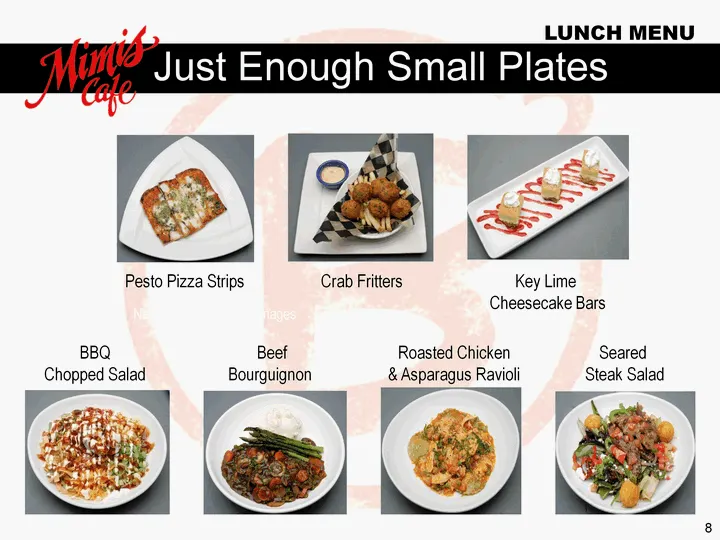
Slide 8: Just Enough Small Plates Lunch Menu
8 Just Enough Small Plates LUNCH MENU Need item names and images Pesto Pizza Strips BBQ Chopped Salad Roasted Chicken & Asparagus Ravioli Crab Fritters Seared Steak Salad Beef Bourguignon Key Lime Cheesecake Bars
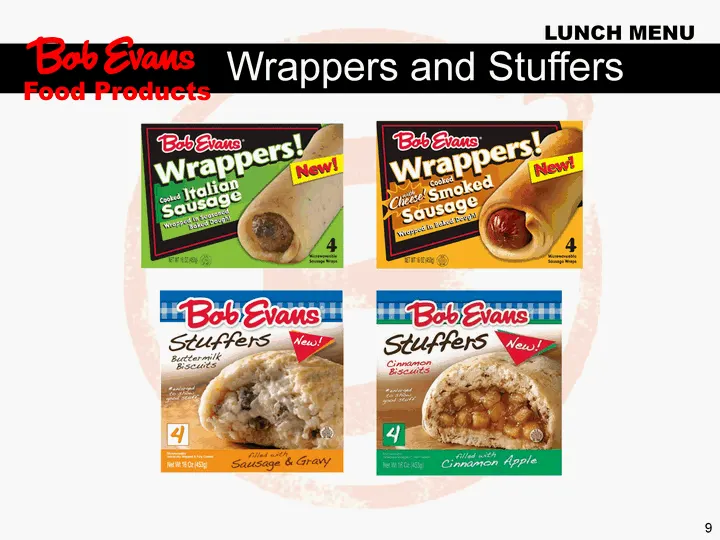
Slide 9: Wrappers and Stuffers Food Products
9 Wrappers and Stuffers LUNCH MENU Food Products
Slide 10: Steve Davis, Chairman and Chief Executive Officer
10 Steve Davis Chairman and Chief Executive Officer
Slide 11: BEST Brand Builders Company & Segment Overview
11 BEST Brand Builders Company & Segment Overview
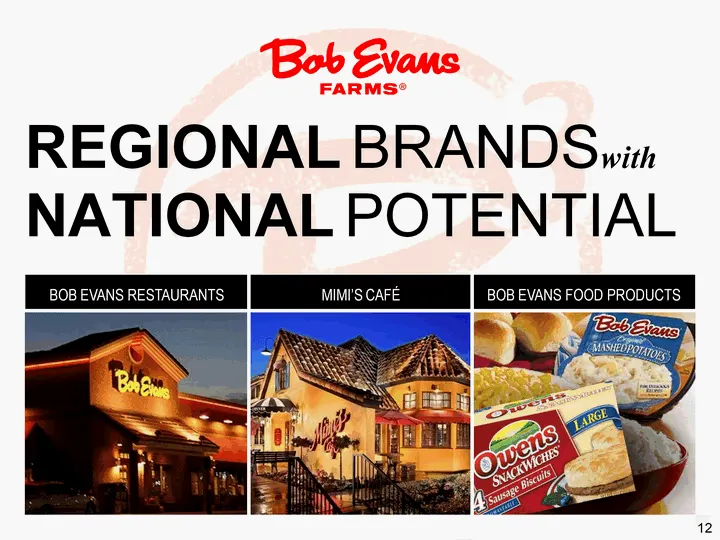
Slide 12: Bob Evans Food Products Regional Brands with National Potential
12 BOB EVANS FOOD PRODUCTS REGIONAL BRANDSwith NATIONAL POTENTIAL
Slide 13: Our Way of Doing Business
13 "Our Way of Doing Business"
Slide 14: Company Overview
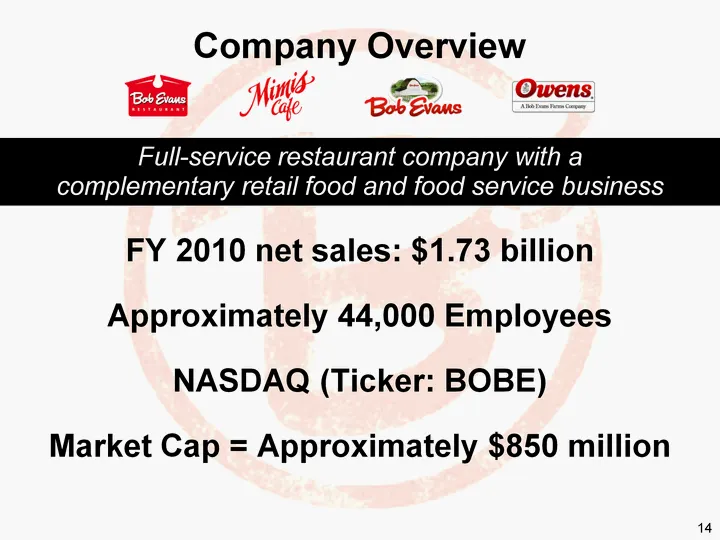
14 Company Overview FY 2010 net sales: $1.73 billion Approximately 44,000 Employees NASDAQ (Ticker: BOBE) Market Cap = Approximately $850 million Full-service restaurant company with a complementary retail food and food service business
Slide 15: Adjusted Operating Income
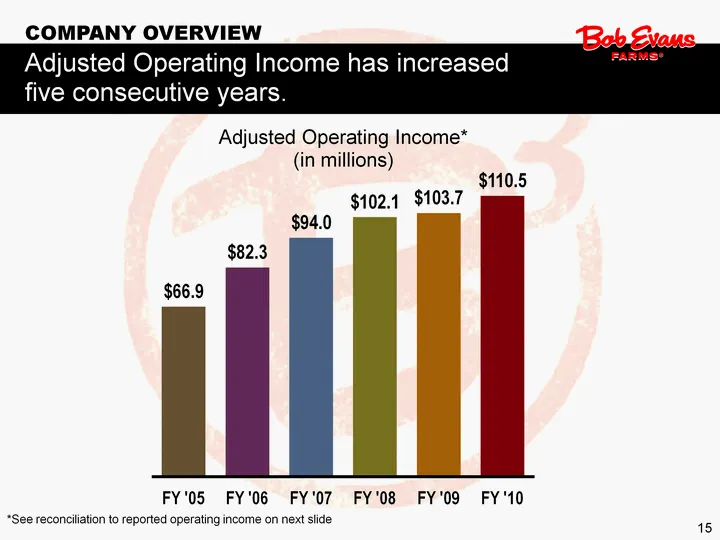
15 COMPANY OVERVIEW Adjusted Operating Income* (in millions) Adjusted Operating Income has increased five consecutive years. (CHART) *See reconciliation to reported operating income on next slide
Slide 16: Reconciliations
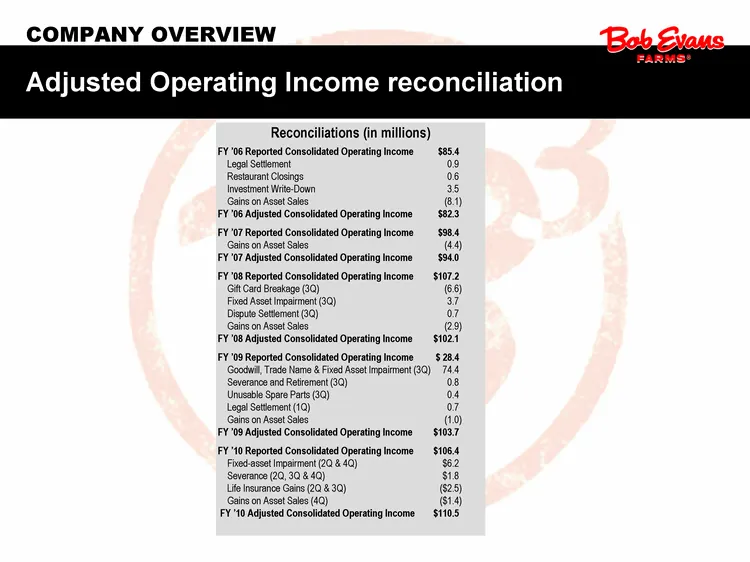
COMPANY OVERVIEW Reconciliations (in millions) FY '06 Reported Consolidated Operating Income $85.4 Legal Settlement 0.9 Restaurant Closings 0.6 Investment Write-Down 3.5 Gains on Asset Sales (8.1) FY '06 Adjusted Consolidated Operating Income $82.3 FY '07 Reported Consolidated Operating Income $98.4
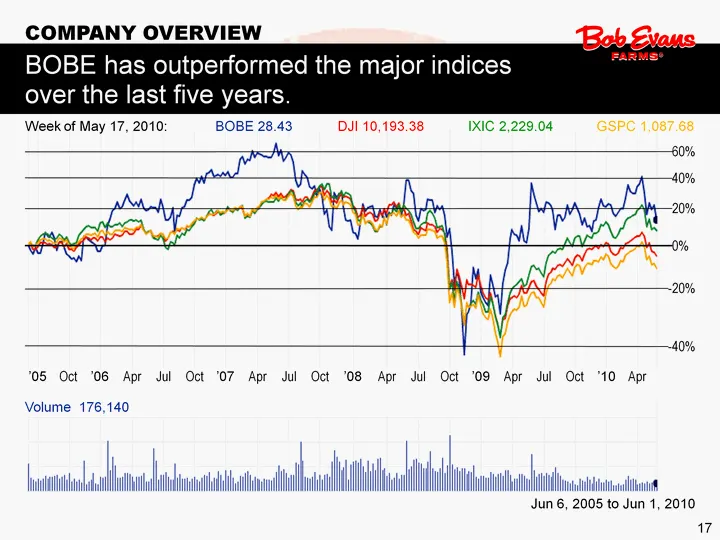
Slide 17: BOBE Outperformed Major Indices Over Five Years
17 COMPANY OVERVIEW BOBE has outperformed the major indices over the last five years. 60% 40% 20% 0% - -20% - -40% Apr '10 Oct Jul Apr '09 Oct Jul Apr '08 Oct Jul Apr '07 Oct Jul Apr '06 Oct '05 BOBE 28.43 DJI 10,193.38 IXIC 2,229.04 GSPC 1,087.68 Week of May 17, 2010: Volume 176,140 Jun 6, 2005 to
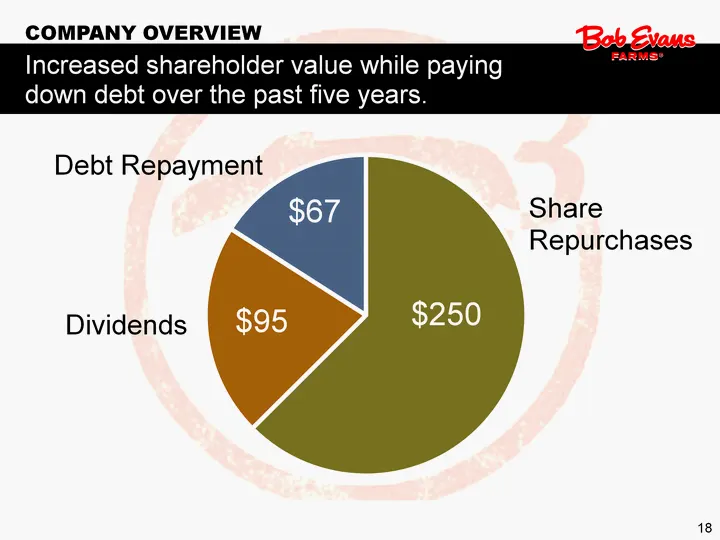
Slide 18: Shareholder Value While Paying Down Debt
18 COMPANY OVERVIEW Increased shareholder value while paying down debt over the past five years. (CHART) Dividends $250 $95 $67 Share Repurchases Debt Repayment
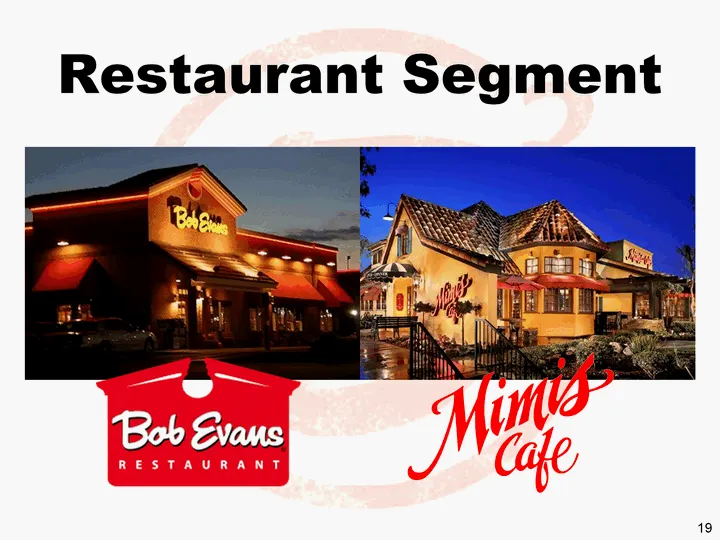
Slide 19: Restaurant Segment
19 Restaurant Segment
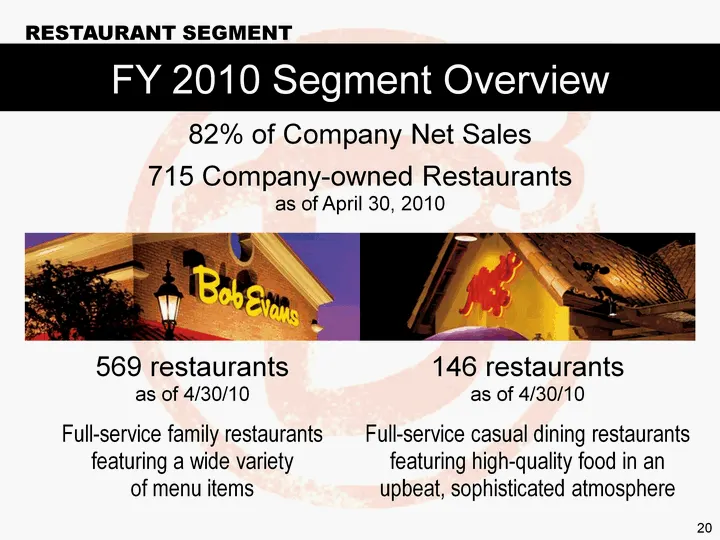
Slide 20: FY 2010 Segment Overview
20 FY 2010 Segment Overview 82% of Company Net Sales 715 Company-owned Restaurants as of April 30, 2010 569 restaurants as of 4/30/10 Full-service family restaurants featuring a wide variety of menu items 146 restaurants as of 4/30/10 Full-service casual dining restaurants featuring high-quality foo
Slide 21: Bob Evans FY 2010 Overview
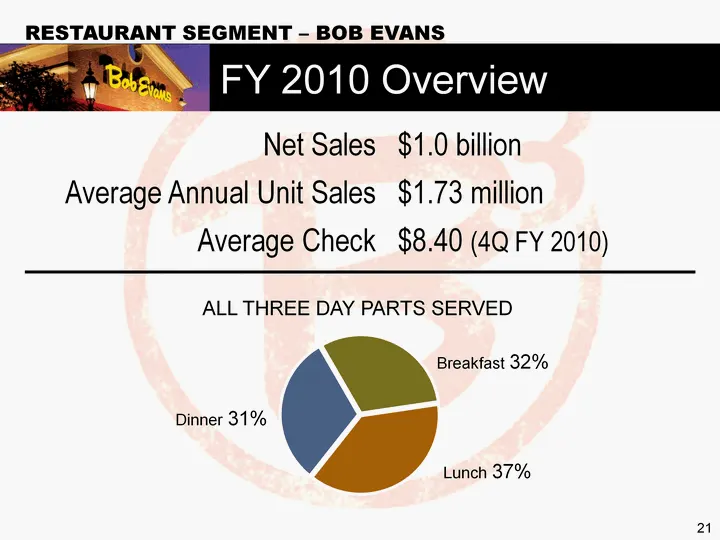
21 Net Sales $1.0 billion Average Annual Unit Sales $1.73 million Average Check $8.40 (4Q FY 2010) FY 2010 Overview RESTAURANT SEGMENT - BOB EVANS ALL THREE DAY PARTS SERVED (CHART) Breakfast 32% Lunch 37% Dinner 31%
Slide 22: Geographic Concentration - Bob Evans
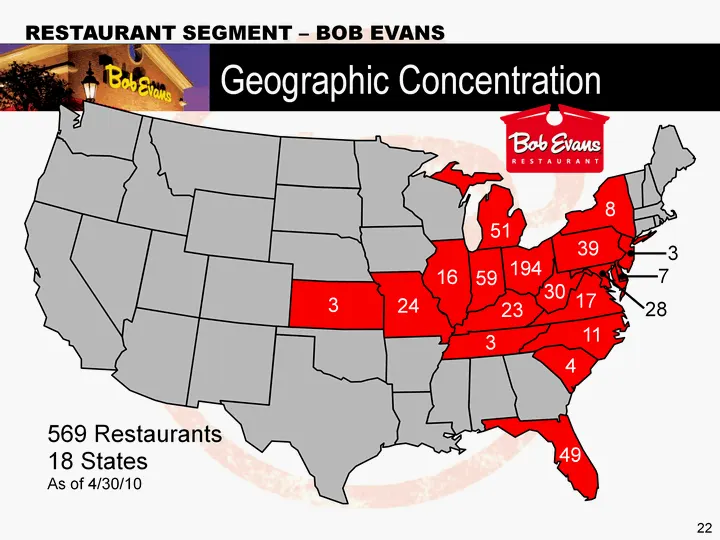
22 Geographic Concentration RESTAURANT SEGMENT - BOB EVANS 194 59 16 24 3 51 30 39 8 3 7 28 23 3 17 11 4 49 569 Restaurants 18 States As of 4/30/10
Slide 23: Five-Year Strategic Plan Summary
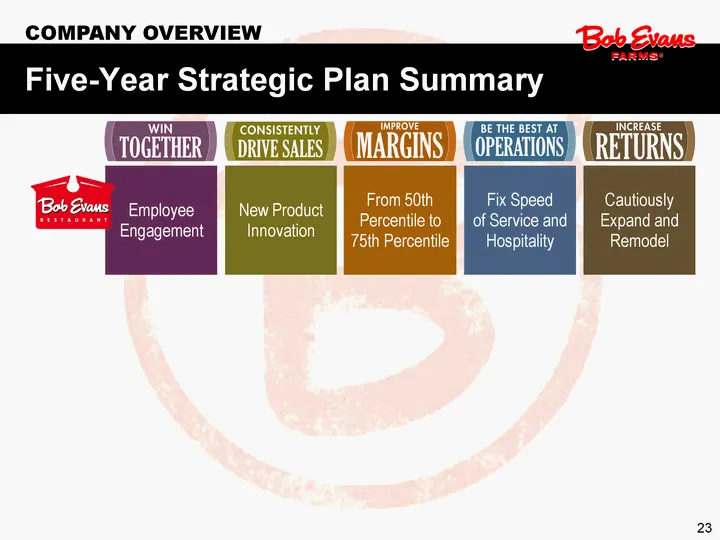
23 COMPANY OVERVIEW Five-Year Strategic Plan Summary Employee Engagement New Product Innovation From 50th Percentile to 75th Percentile Fix Speed of Service and Hospitality Cautiously Expand and Remodel
Slide 24: Mimi's Cafe FY 2010 Overview
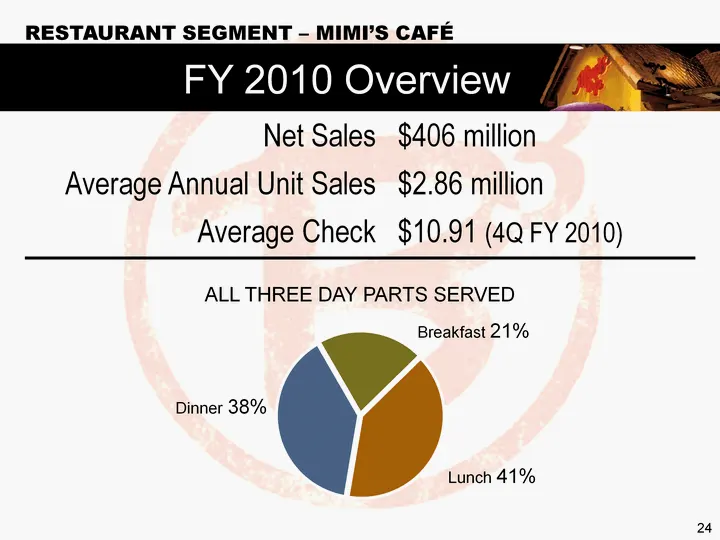
24 RESTAURANT SEGMENT - MIMI'S CAFE FY 2010 Overview Net Sales $406 million Average Annual Unit Sales $2.86 million Average Check $10.91 (4Q FY 2010) ALL THREE DAY PARTS SERVED (CHART) Breakfast 21% Lunch 41% Dinner 38%
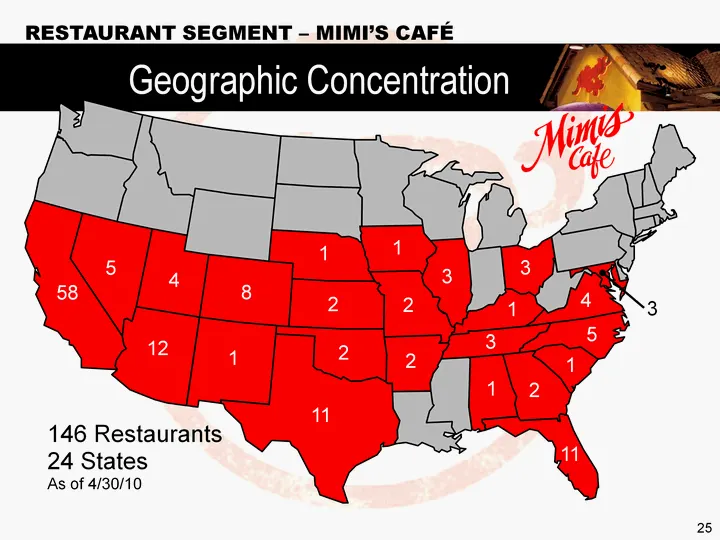
Slide 25: Geographic Concentration - Mimi's Cafe
25 RESTAURANT SEGMENT - MIMI'S CAFE Geographic Concentration 3 3 2 2 3 1 3 4 5 1 11 2 2 1 2 11 1 8 4 12 58 5 1 146 Restaurants 24 States As of 4/30/10 1
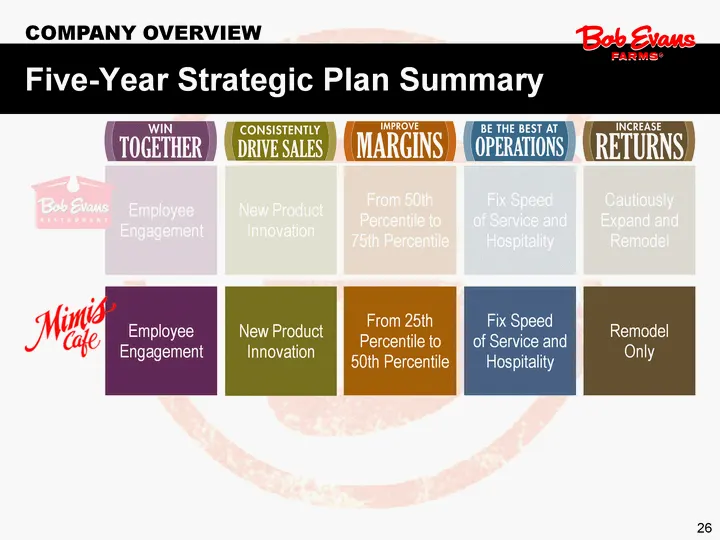
Slide 26: Five-Year Strategic Plan Summary
26 COMPANY OVERVIEW Five-Year Strategic Plan Summary Employee Engagement New Product Innovation From 50th Percentile to 75th Percentile Fix Speed of Service and Hospitality Cautiously Expand and Remodel Employee Engagement New Product Innovation From 25th Percentile to 50th Percentile Fix Speed of S
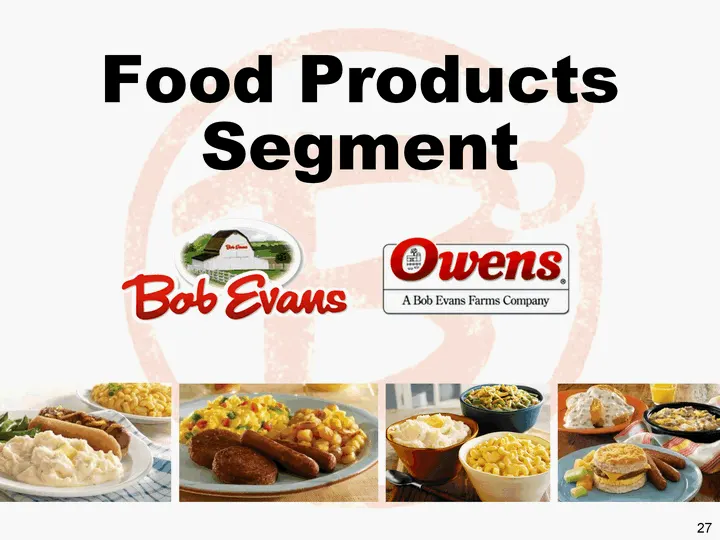
Slide 27: Food Products Segment
Food Products Segment iwi a Owens' ‘A Bob Evans Farms Company
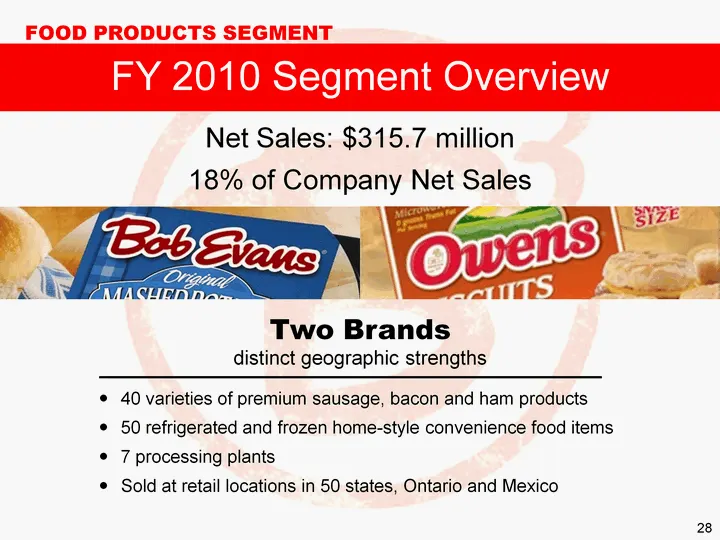
Slide 28: Food Products FY 2010 Segment Overview
28 Two Brands distinct geographic strengths FY 2010 Segment Overview FOOD PRODUCTS SEGMENT Net Sales: $315.7 million 18% of Company Net Sales 40 varieties of premium sausage, bacon and ham products 50 refrigerated and frozen home-style convenience food items 7 processing plants Sold at retail locati
Slide 29: Retail Distribution
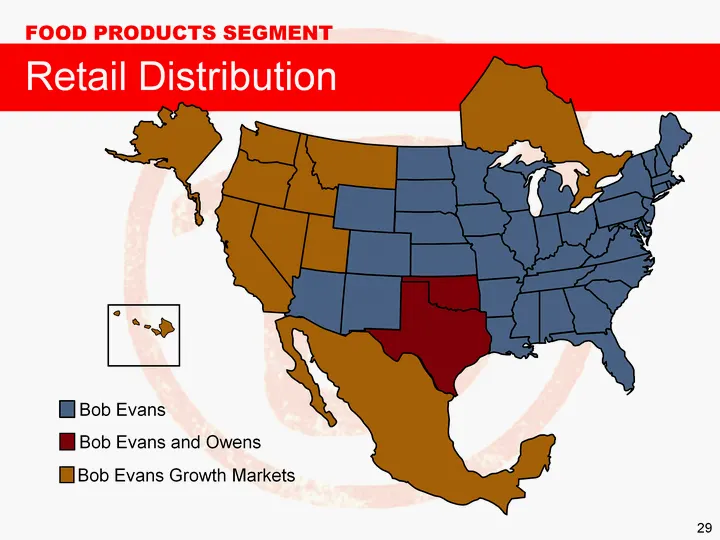
29 FOOD PRODUCTS SEGMENT Retail Distribution Bob Evans Bob Evans and Owens Bob Evans Growth Markets
Slide 30: Five-Year Strategic Plan Summary
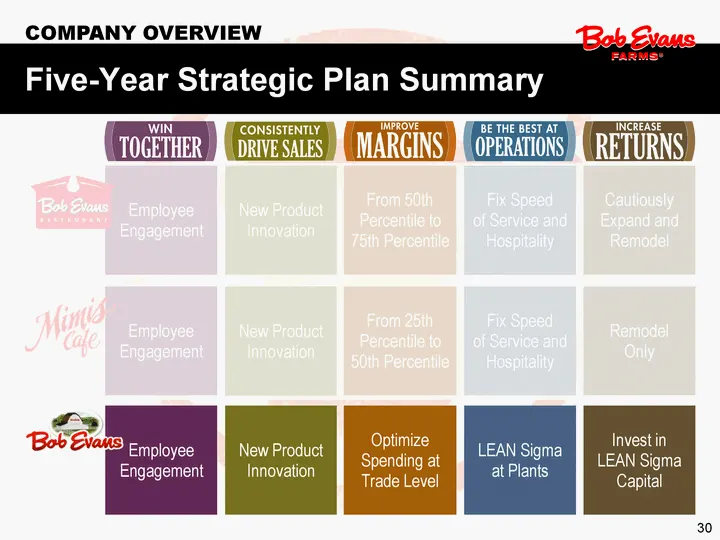
30 COMPANY OVERVIEW Five-Year Strategic Plan Summary Employee Engagement New Product Innovation From 50th Percentile to 75th Percentile Fix Speed of Service and Hospitality Cautiously Expand and Remodel Employee Engagement New Product Innovation From 25th Percentile to 50th Percentile Fix Speed of S
Slide 31: FY 2011 Re-Invention of Bob Evans Farms
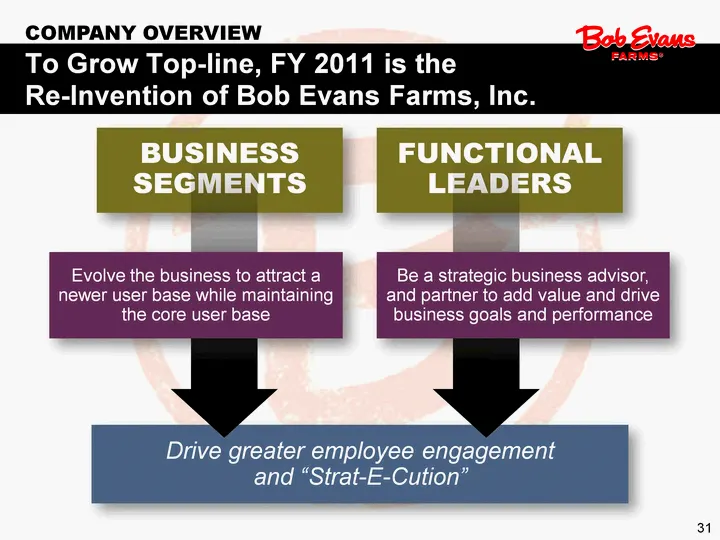
Drive greater employee engagement and "Strat-E-Cution" Business Segments FUNCTIONAL LEADERS 31 COMPANY OVERVIEW Evolve the business to attract a newer user base while maintaining the core user base To Grow Top-line, FY 2011 is the Re-Invention of Bob Evans Farms, Inc. Be a strategic business advisor
Slide 32: FY2011 Transformation of our Brand
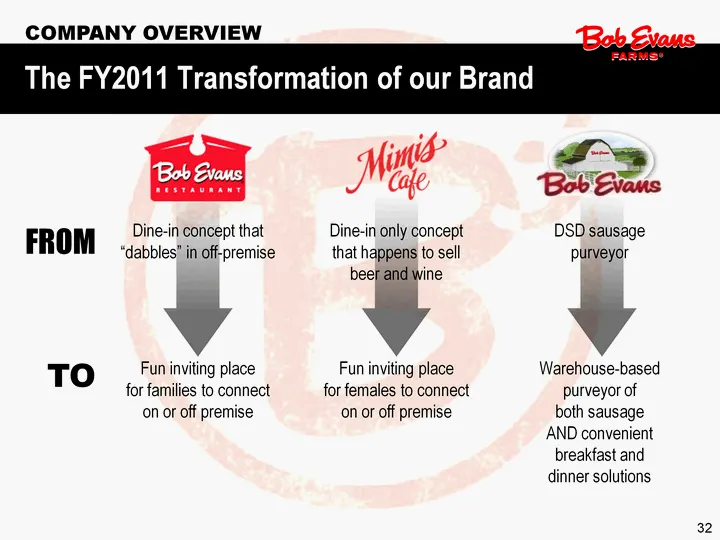
32 COMPANY OVERVIEW The FY2011 Transformation of our Brand FROM TO Dine-in concept that "dabbles" in off-premise Fun inviting place for families to connect on or off premise Dine-in only concept that happens to sell beer and wine Fun inviting place for females to connect on or off premise DSD sausag
Slide 33: Business Segment Challenges
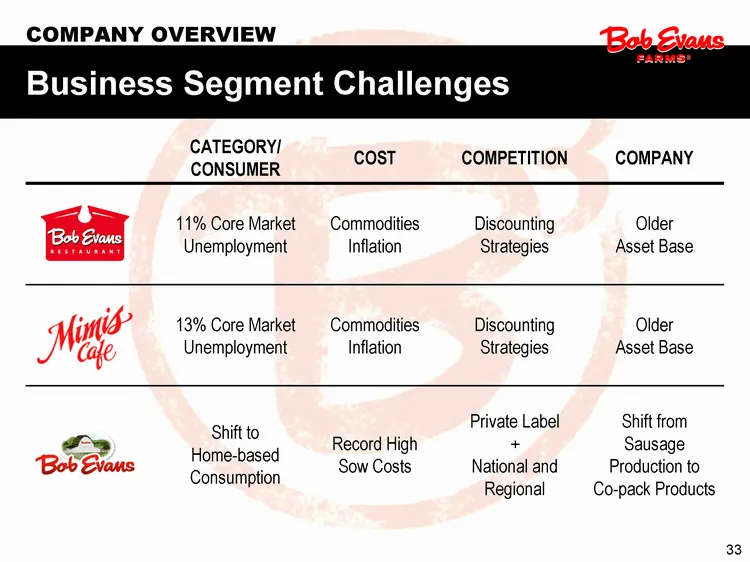
33 COMPANY OVERVIEW Business Segment Challenges CATEGORY/ CONSUMER COST COMPETITION COMPANY 11% Core Market Unemployment Commodities Inflation Discounting Strategies Older Asset Base 13% Core Market Unemployment Commodities Inflation Discounting Strategies Older Asset Base Shift to Home-based Consum
Slide 34: Drive Culture to the Front Line
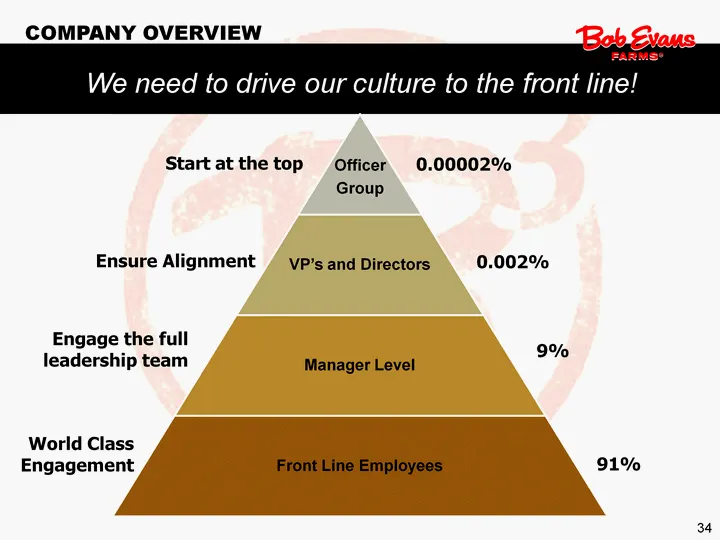
34 COMPANY OVERVIEW We need to drive our culture to the front line! Start at the top Ensure Alignment Engage the full leadership team World Class Engagement 0.00002% 0.002% 9% 91%
Slide 35: Regional Brands with National Potential
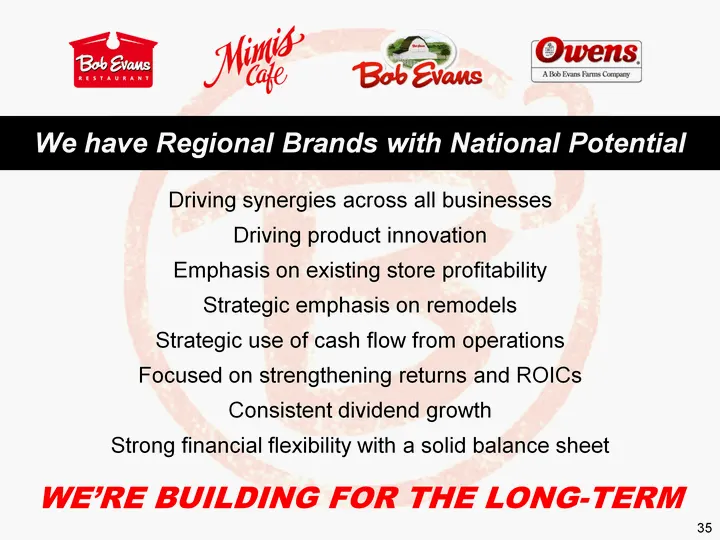
35 We have Regional Brands with National Potential Driving synergies across all businesses Driving product innovation Emphasis on existing store profitability Strategic emphasis on remodels Strategic use of cash flow from operations Focused on strengthening returns and ROICs Consistent dividend grow
Slide 36: Tod Spornhauer, Chief Financial Officer
36 Tod Spornhauer Chief Financial Officer
Slide 37: 4th Quarter and FY 2010 Financial Highlights
37 4th Quarter and FY 2010 Financial Highlights
Slide 38: Comparable Sales FY 2009 and 2010
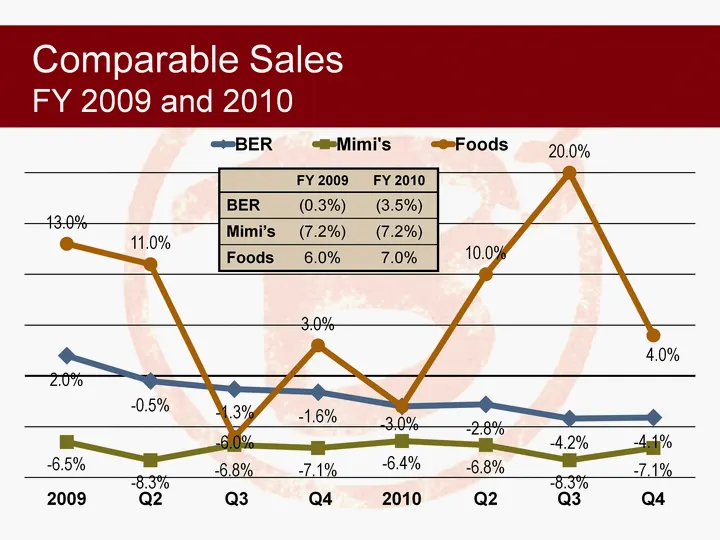
(CHART) FY 2009 FY 2010 BER (0.3%) (3.5%) Mimi's (7.2%) (7.2%) Foods 6.0% 7.0% Comparable Sales FY 2009 and 2010
Slide 39: Sow Cost History
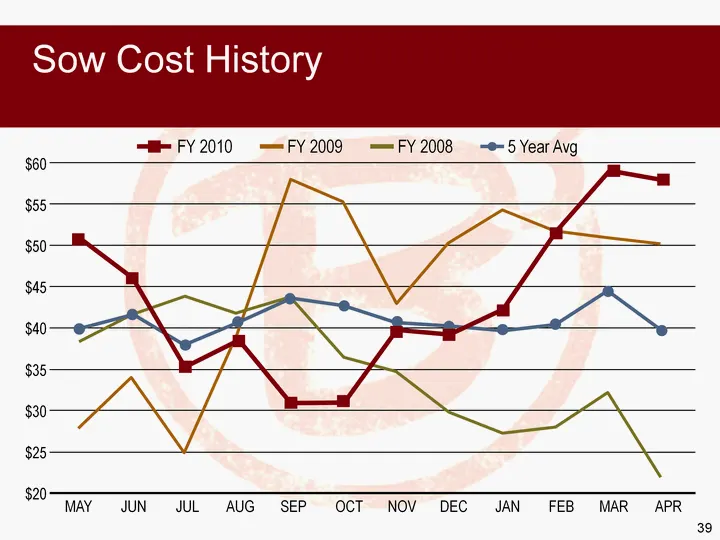
39 Sow Cost History $20 $25 $30 $35 $40 $45 $50 $55 MAY JUN JUL AUG SEP OCT NOV DEC JAN FEB MAR APR FY 2009 FY 2008 5 Year Avg $60
Slide 40: Fourth Quarter Overview
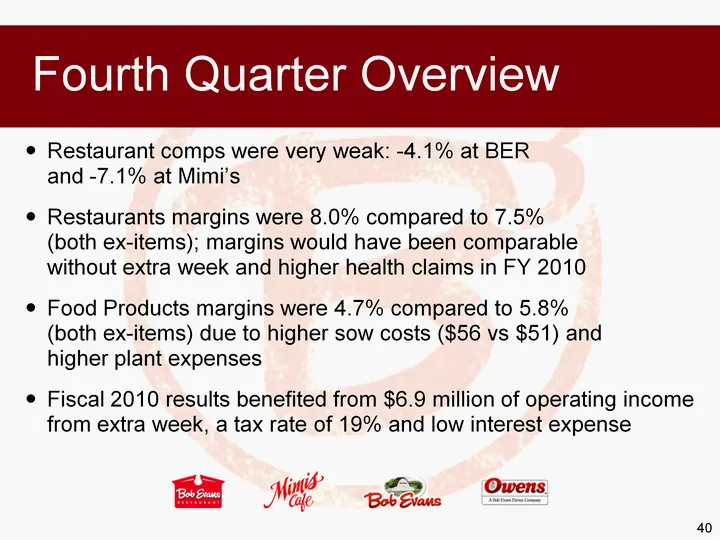
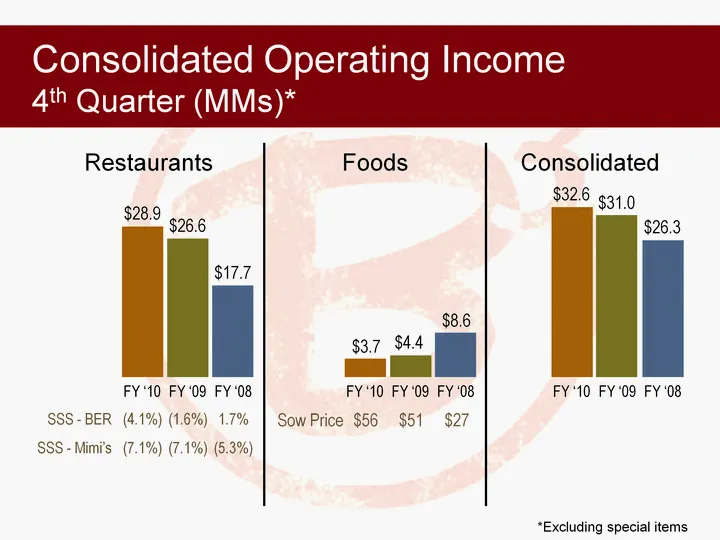
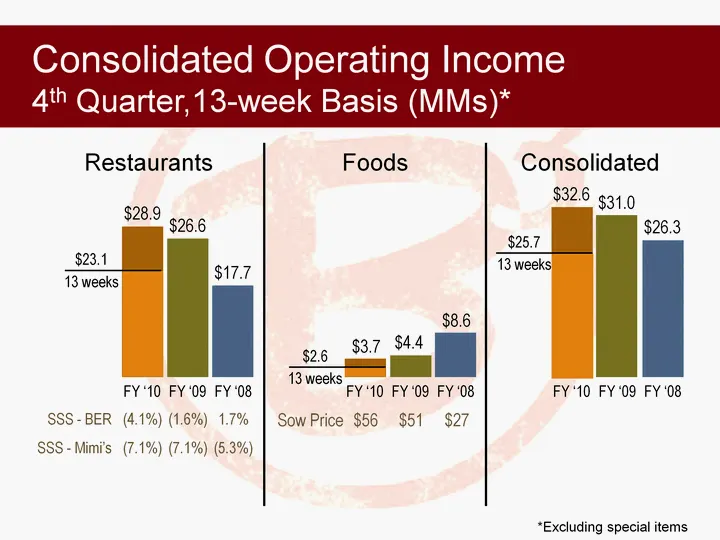
40 Fourth Quarter Overview Restaurant comps were very weak: -4.1% at BER and -7.1% at Mimi's Restaurants margins were 8.0% compared to 7.5% (both ex-items); margins would have been comparable without extra week and higher health claims in FY 2010 Food Products margins were 4.7% compared to 5.8% (bot
Slide 41: Consolidated Operating Income 4th Quarter
*Excluding special items Consolidated Operating Income 4th Quarter (MMs)* $17.7 $26.6 $28.9 Restaurants $8.6 $4.4 $3.7 Foods $26.3 $31.0 $32.6 Consolidated FY '10 FY '09 FY '08 FY '10 FY '09 FY '08 FY '10 FY '09 FY '08 (4.1%) (1.6%) 1.7% SSS - BER (7.1%) (7.1%) (5.3%) SSS - Mimi's $56 $51 $27 Sow Pr
Slide 42: Operating Income 4th Quarter, 13-week Basis
*Excluding special items Consolidated Operating Income 4th Quarter,13-week Basis (MMs)* $17.7 $26.6 $28.9 Restaurants $8.6 $4.4 $3.7 Foods $26.3 $31.0 $32.6 Consolidated FY '10 FY '09 FY '08 FY '10 FY '09 FY '08 FY '10 FY '09 FY '08 (4.1%) (1.6%) 1.7% SSS - BER (7.1%) (7.1%) (5.3%) SSS - Mimi's $56
Slide 43: FY 2010 Overview
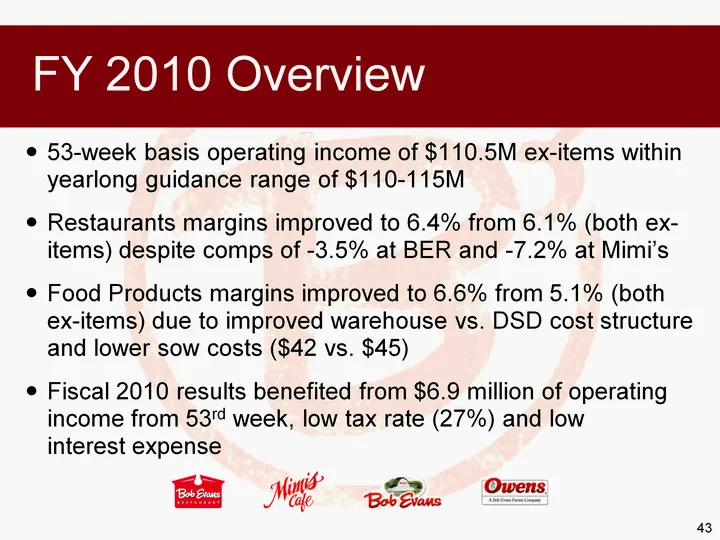
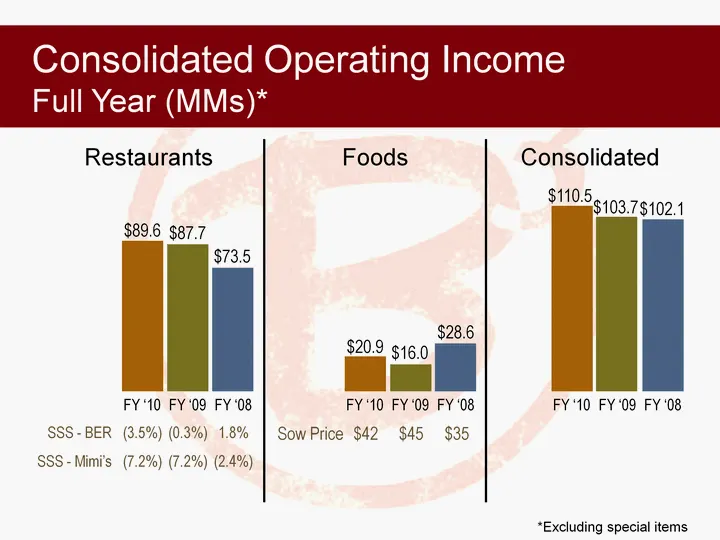
43 FY 2010 Overview 53-week basis operating income of $110.5M ex-items within yearlong guidance range of $110-115M Restaurants margins improved to 6.4% from 6.1% (both ex- items) despite comps of -3.5% at BER and -7.2% at Mimi's Food Products margins improved to 6.6% from 5.1% (both ex-items) due to
Slide 44: Consolidated Operating Income Full Year
*Excluding special items Consolidated Operating Income Full Year (MMs)* $73.5 $87.7 $89.6 Restaurants $28.6 $16.0 $20.9 Foods $102.1 $103.7 $110.5 Consolidated FY '10 FY '09 FY '08 FY '10 FY '09 FY '08 FY '10 FY '09 FY '08 (3.5%) (0.3%) 1.8% SSS - BER (7.2%) (7.2%) (2.4%) SSS - Mimi's $42 $45 $35 So
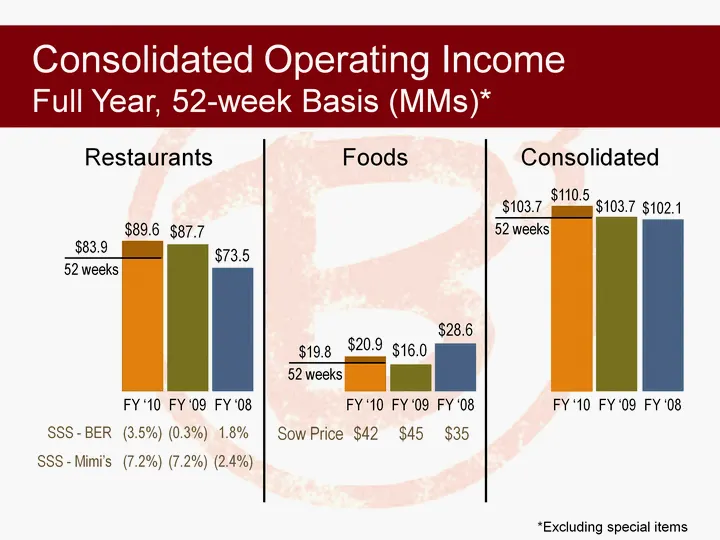
Slide 45: Operating Income Full Year, 52-week Basis
*Excluding special items Consolidated Operating Income Full Year, 52-week Basis (MMs)* $73.5 $87.7 $89.6 Restaurants $28.6 $16.0 $20.9 Foods $102.1 $103.7 $110.5 Consolidated FY '10 FY '09 FY '08 FY '10 FY '09 FY '08 FY '10 FY '09 FY '08 (3.5%) (0.3%) 1.8% SSS - BER (7.2%) (7.2%) (2.4%) SSS - Mimi's
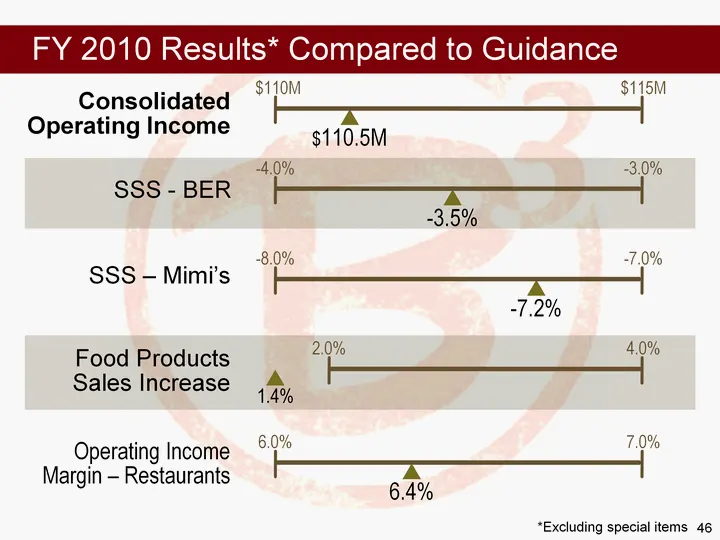
Slide 46: FY 2010 Results Compared to Guidance
46 Consolidated Operating Income FY 2010 Results* Compared to Guidance *Excluding special items $110M $115M $110.5M SSS - BER - -4.0% - -3.0% - -3.5% SSS - Mimi's - -8.0% - -7.0% - -7.2% Food Products Sales Increase 2.0% 4.0% 1.4% Operating Income Margin - Restaurants 6.0% 7.0% 6.4%
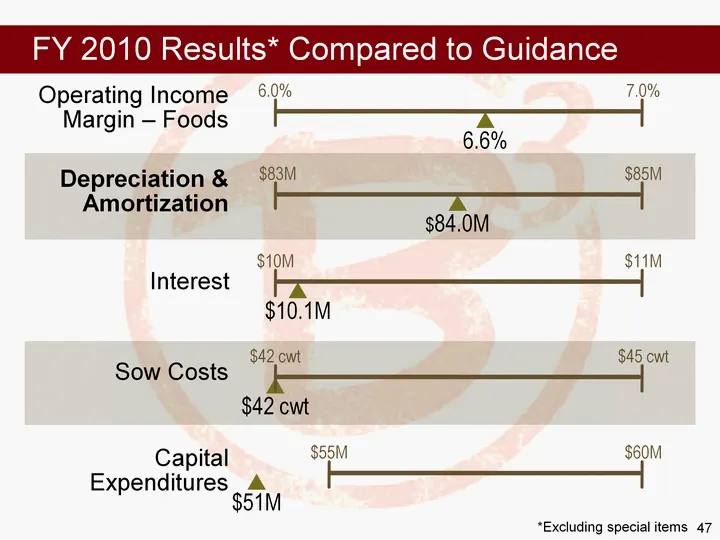
Slide 47: FY 2010 Results Compared to Guidance
47 Depreciation & Amortization FY 2010 Results* Compared to Guidance Capital Expenditures *Excluding special items $84.0M $83M $85M Interest $10.1M $10M $11M Sow Costs $42 cwt $42 cwt $45 cwt $51M $55M $60M Operating Income Margin - Foods 6.0% 7.0% 6.6%
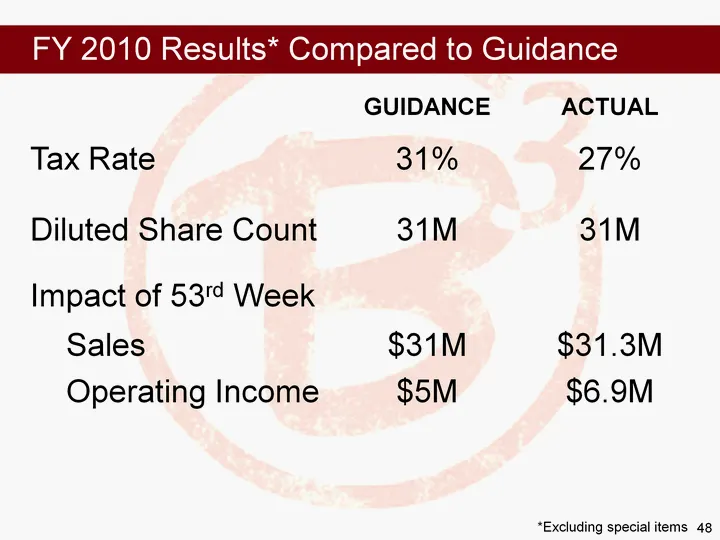
Slide 48: FY 2010 Results Compared to Guidance
48 FY 2010 Results* Compared to Guidance *Excluding special items GUIDANCE ACTUAL Tax Rate 31% 27% Diluted Share Count 31M 31M Impact of 53rd Week Sales $31M $31.3M Operating Income $5M $6.9M
Slide 49: Capital Allocation Update Fiscal 2010
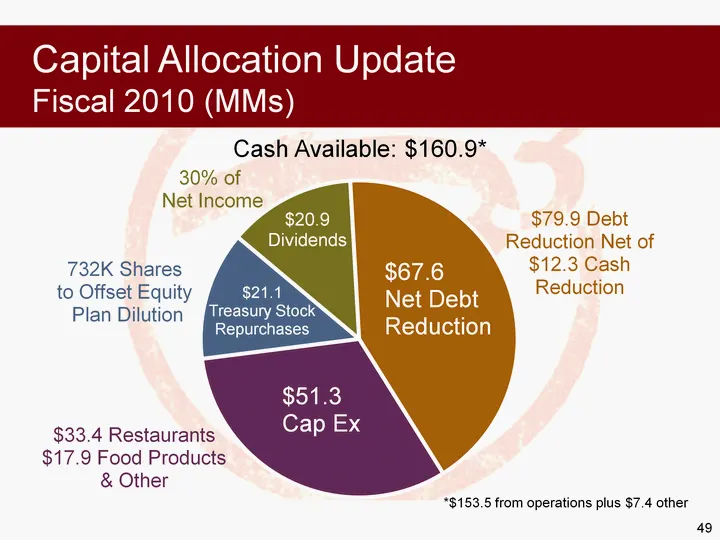
(CHART) 49 30% of Net Income $67.6 Net Debt Reduction $51.3 Cap Ex $20.9 Dividends Cash Available: $160.9* Capital Allocation Update Fiscal 2010 (MMs) 732K Shares to Offset Equity Plan Dilution $33.4 Restaurants $17.9 Food Products & Other $79.9 Debt Reduction Net of $12.3 Cash Reduction $21.1 Treas
Slide 50: Debt Summary
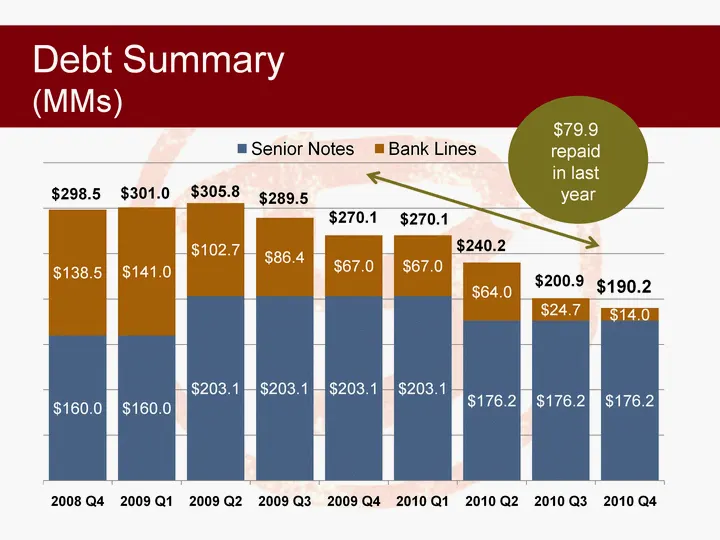
(CHART) Debt Summary (MMs) $79.9 repaid in last year
Slide 51: Reconciliation of Special Items
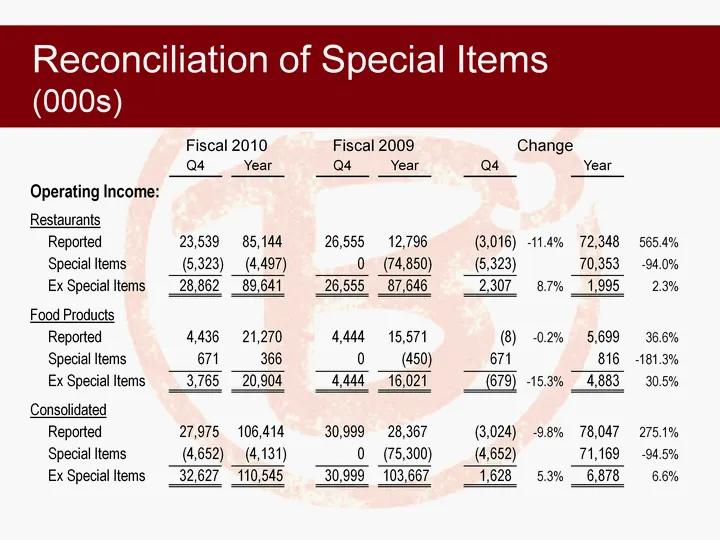
Reconciliation of Special Items (000s) Operating Income: Restaurants Reported Special Items Ex Special Items 23,539 (5,323) 28,862 85,144 (4,497) 89,641 26,555 0 26,555 12,796 (74,850) 87,646 (3,016) (5,323) 2,307 - -11.4% 8.7% 72,348 70,353 1,995 565.4% - -94.0% 2.3% Food Products Reported Special
Slide 52: GAAP to Non-GAAP Reconciliation of Operating Income
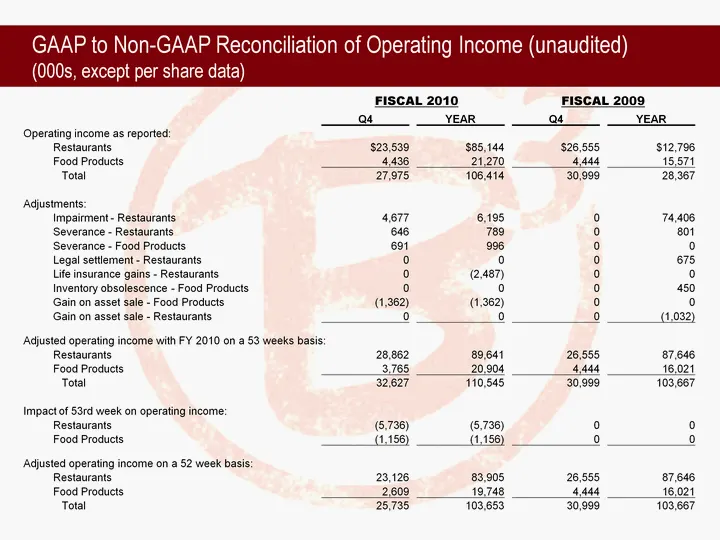
GAAP to Non-GAAP Reconciliation of Operating Income (unaudited) (000s, except per share data) Q4 YEAR Q4 YEAR Operating income as reported: Operating income as reported: Restaurants $23,539 $85,144 $26,555 $12,796 Food Products 4,436 21,270 4,444 15,571 Total 27,975 106,414 30,999 28,367 Adjustments
Slide 53: Randy Hicks and Mary Cusick, Bob Evans Restaurants
53 Randy Hicks President and Chief Concept Officer Mary Cusick Senior Vice President of Marketing
Slide 54: FY 2010 Review
54 FY 2010 Review
Slide 55: Executive Summary FY 2010 Review
55 Executive Summary FY 2010 REVIEW Same-Store Sales: -3.5% Employee & Management turnover continued to improve Implemented new guest satisfaction measure Initiated transformation of brand Asset - Look and Feel Food - Innovate People - Service
Slide 56: Guest Experience Survey
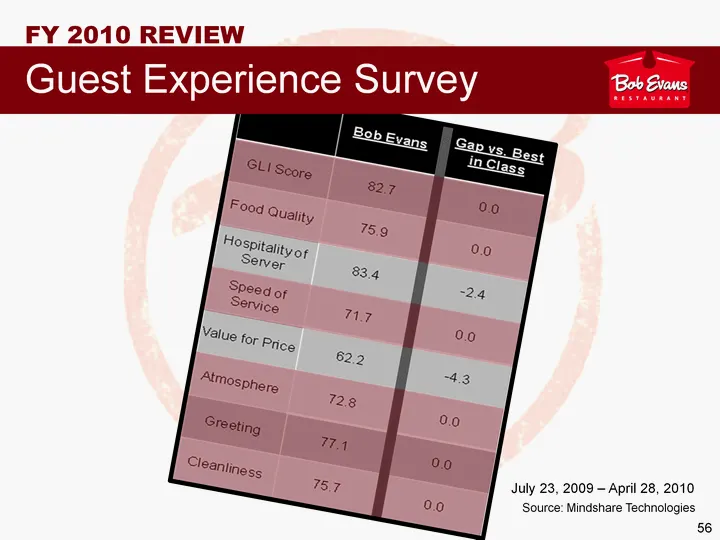
56 Guest Experience Survey FY 2010 REVIEW Source: Mindshare Technologies July 23, 2009 - April 28, 2010
Slide 57: Major Marketing Programs
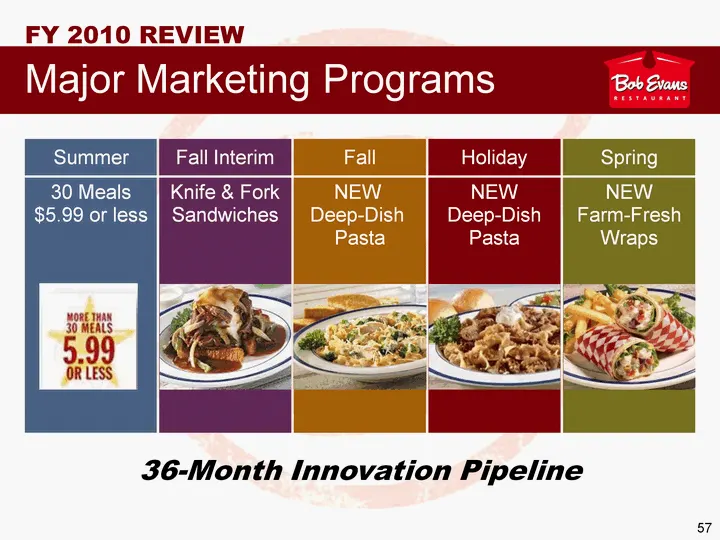
57 Major Marketing Programs FY 2010 REVIEW Fall Interim Knife & Fork Sandwiches Fall NEW Deep-Dish Pasta Holiday NEW Deep-Dish Pasta Spring NEW Farm-Fresh Wraps Summer 30 Meals $5.99 or less 36-Month Innovation Pipeline
Slide 58: Restaurants Challenge: Building Types
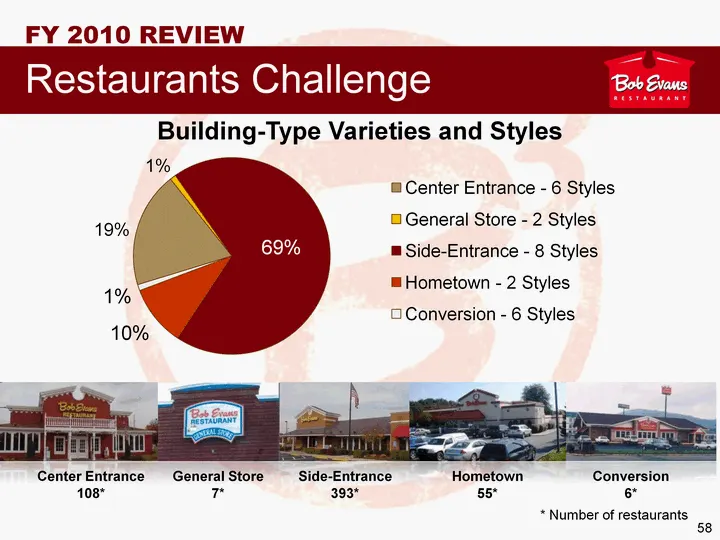
58 (CHART) Building-Type Varieties and Styles Center Entrance 108* Side-Entrance 393* General Store 7* Hometown 55* Conversion 6* * Number of restaurants Restaurants Challenge FY 2010 REVIEW
Slide 59: Transform Restaurant Look and Feel: Prototype
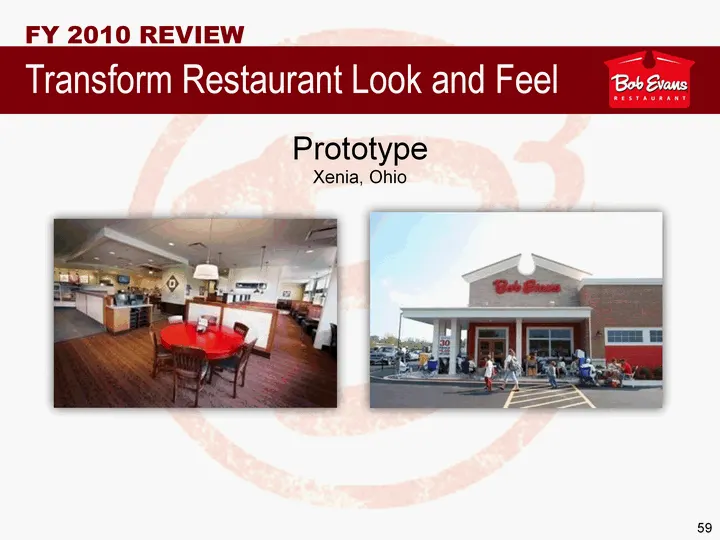
59 Transform Restaurant Look and Feel FY 2010 REVIEW Prototype Xenia, Ohio
Slide 60: Side-Entrance Remodel Canal Winchester
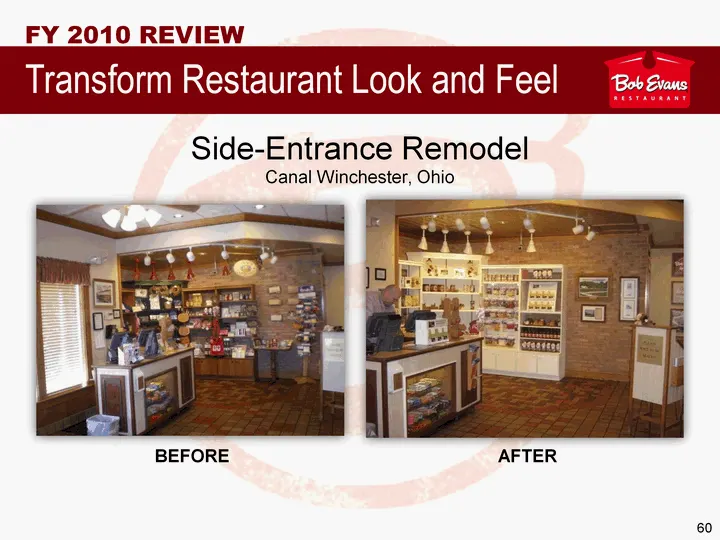
60 Transform Restaurant Look and Feel Side-Entrance Remodel Canal Winchester, Ohio BEFORE AFTER FY 2010 REVIEW
Slide 61: Hometown Remodel Marion
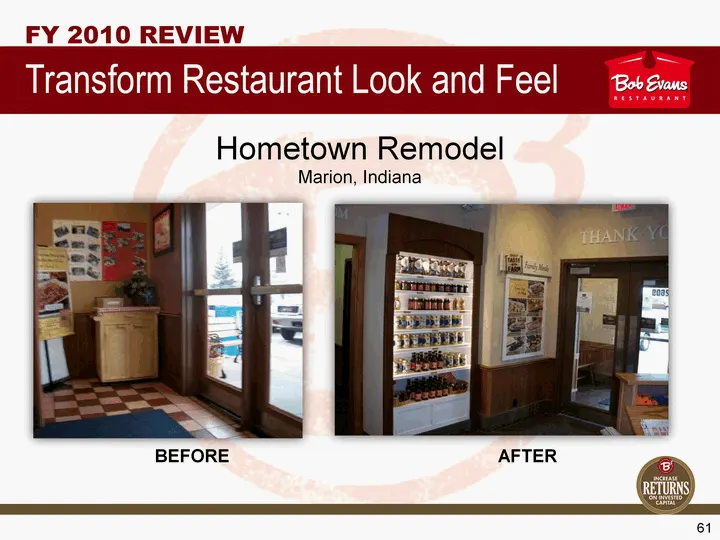
61 Transform Restaurant Look and Feel Hometown Remodel Marion, Indiana BEFORE AFTER FY 2010 REVIEW
Slide 62: Center-Entrance Remodel Portsmouth
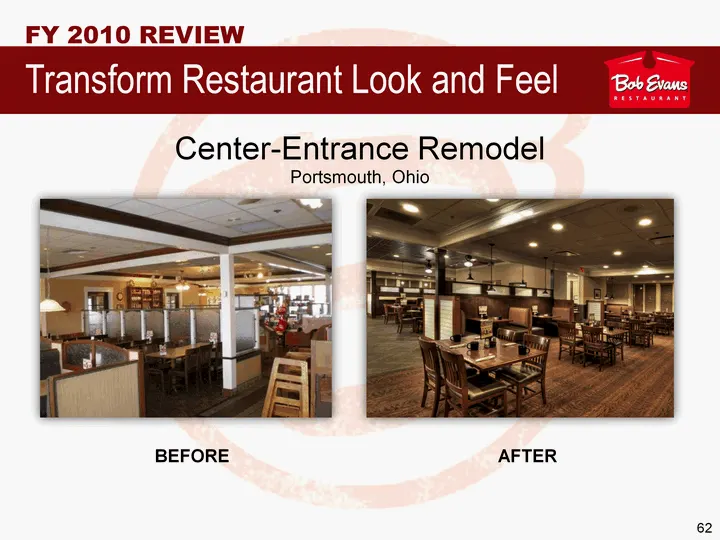
62 Transform Restaurant Look and Feel Center-Entrance Remodel Portsmouth, Ohio BEFORE AFTER FY 2010 REVIEW
Slide 63: Side-Entrance Remodel with Sales Layers
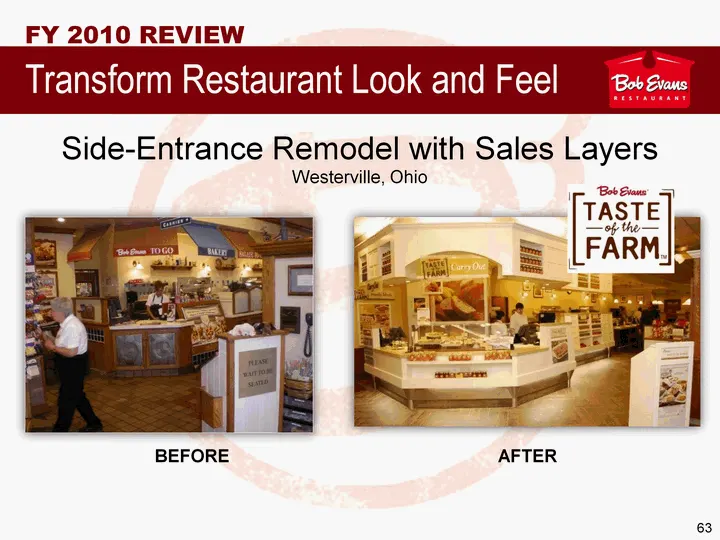
63 Transform Restaurant Look and Feel Side-Entrance Remodel with Sales Layers Westerville, Ohio BEFORE AFTER FY 2010 REVIEW
Slide 64: Side-Entrance with Sales Layers Westerville
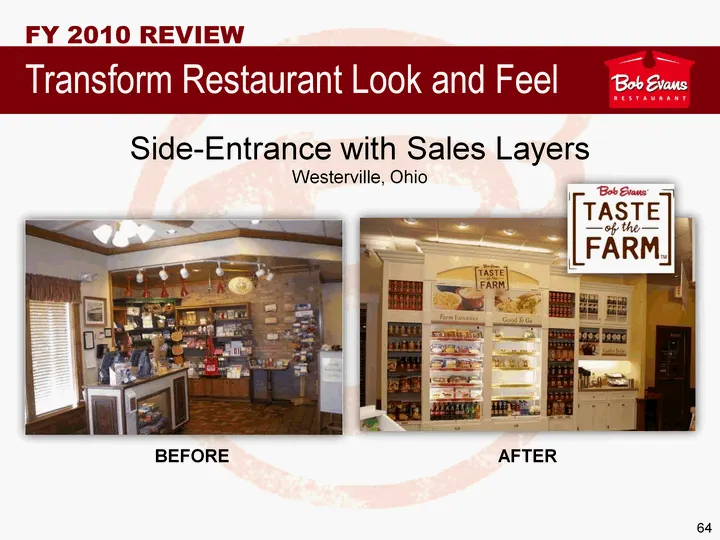
64 Transform Restaurant Look and Feel Side-Entrance with Sales Layers Westerville, Ohio BEFORE AFTER FY 2010 REVIEW
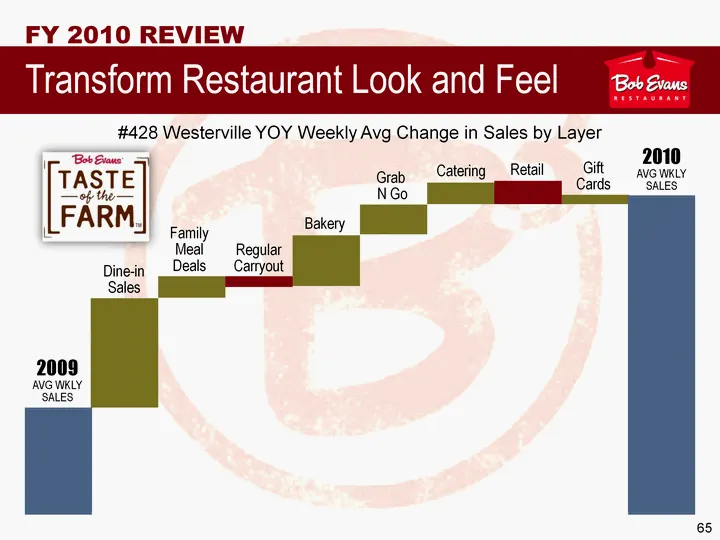
Slide 65: Westerville Sales Change by Layer
65 Transform Restaurant Look and Feel #428 Westerville YOY Weekly Avg Change in Sales by Layer FY 2010 REVIEW 2009 AVG WKLY SALES Dine-in Sales Family Meal Deals Regular Carryout Bakery Grab N Go Catering Retail Gift Cards 2010 AVG WKLY SALES
Slide 66: Restaurant FY 2011 Strategic Plan
wei Bob Braue RESTAURANT FY 2011 Strategic Plan
Slide 67: Vision
Vision To drive BEST-in-CLASS performance through innovation that changes the way people think about Bob Evans Restaurants and generates growth
Slide 68: FY 2011 Innovations and Strategic Pillars
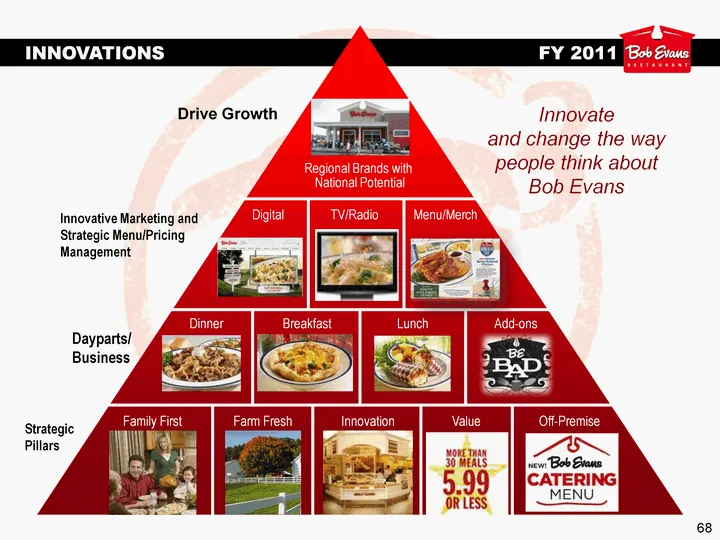
68 INNOVATIONS FY 2011 Drive Growth Innovative Marketing and Strategic Menu/Pricing Management Dayparts/ Business Strategic Pillars Innovate and change the way people think about Bob Evans Family First Farm Fresh Innovation Value Off-Premise Dinner Breakfast Lunch Add-ons Digital TV/Radio Menu/Merch
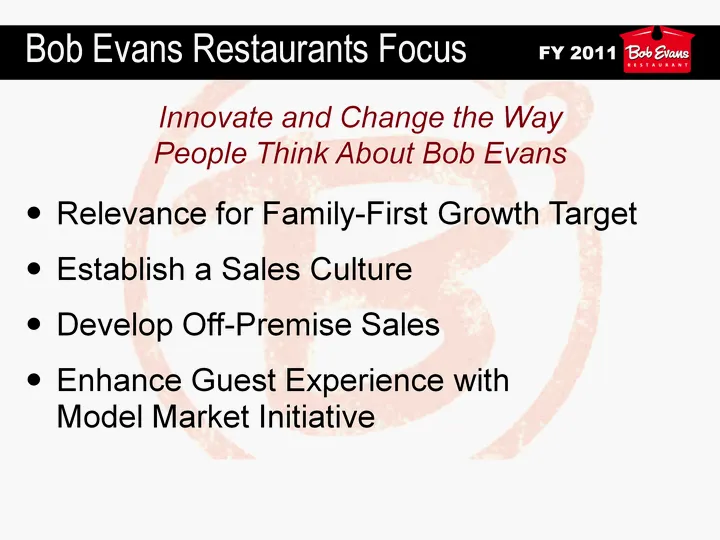
Slide 69: Bob Evans Restaurants Focus FY 2011
69 Relevance for Family-First Growth Target Establish a Sales Culture Develop Off-Premise Sales Enhance Guest Experience with Model Market Initiative Innovate and Change the Way People Think About Bob Evans FY 2011 Bob Evans Restaurants Focus
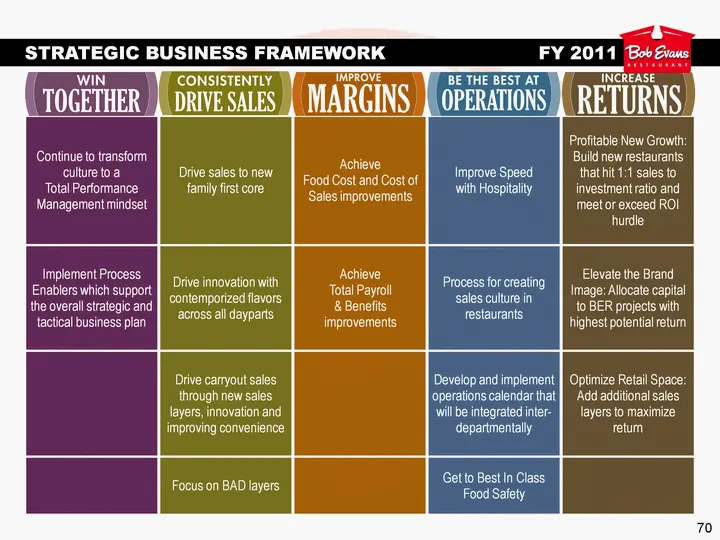
Slide 70: FY 2011 Strategic Initiatives
70 Continue to transform culture to a Total Performance Management mindset Drive sales to new family first core Achieve Food Cost and Cost of Sales improvements Improve Speed with Hospitality Profitable New Growth: Build new restaurants that hit 1:1 sales to investment ratio and meet or exceed ROI h
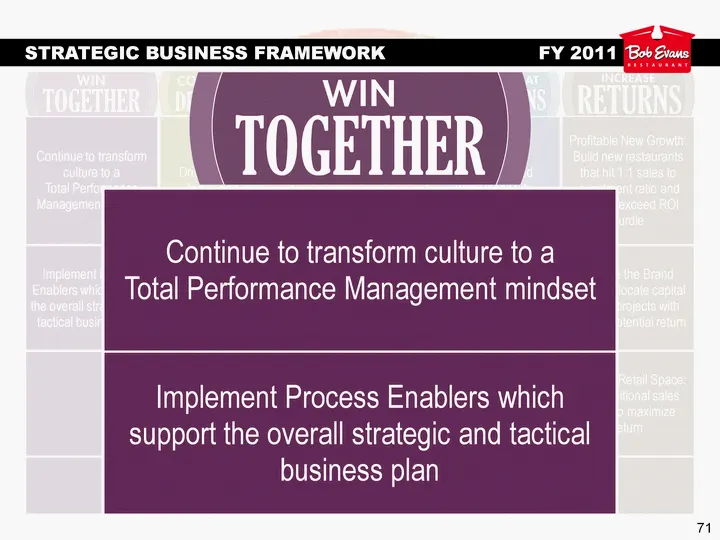
Slide 71: FY 2011 Strategic Initiatives
71 Continue to transform culture to a Total Performance Management mindset Drive sales to new family first core Achieve Food Cost and Cost of Sales improvements Improve Speed with Hospitality Profitable New Growth: Build new restaurants that hit 1:1 sales to investment ratio and meet or exceed ROI h
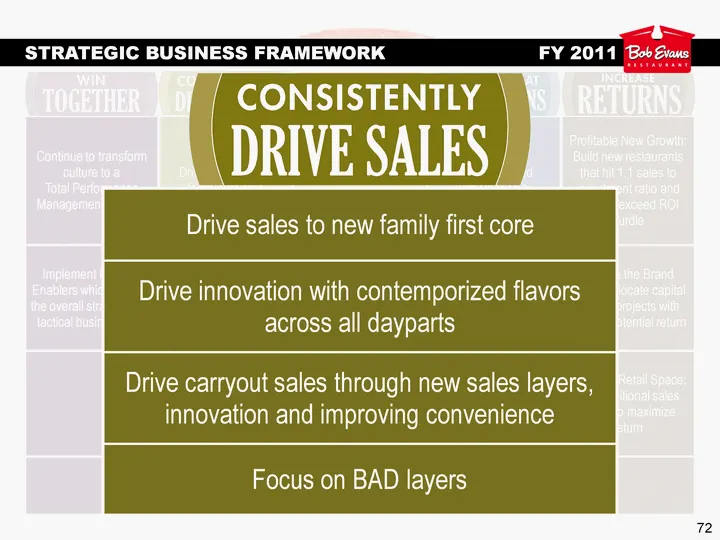
Slide 72: FY 2011 Strategic Initiatives
72 Continue to transform culture to a Total Performance Management mindset Drive sales to new family first core Achieve Food Cost and Cost of Sales improvements Improve Speed with Hospitality Profitable New Growth: Build new restaurants that hit 1:1 sales to investment ratio and meet or exceed ROI h
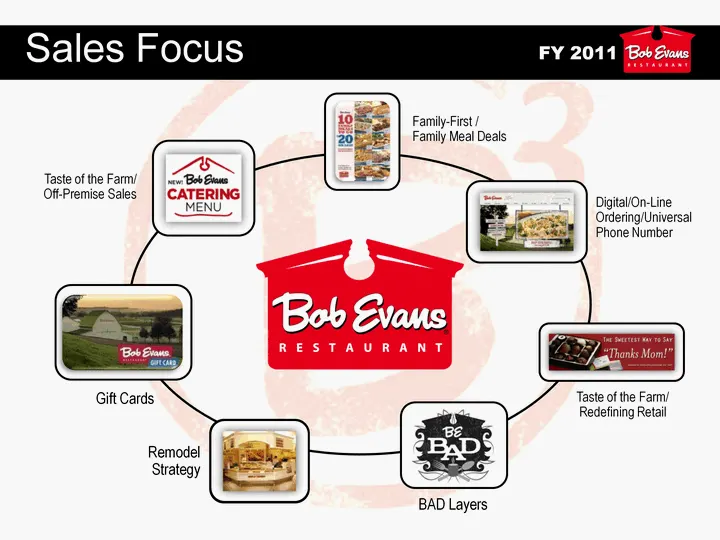
Slide 73: FY 2011 Sales Focus
FY 2011 Sales Focus Digital/On-Line Ordering/Universal Phone Number Taste of the Farm/ Redefining Retail BAD Layers Gift Cards Remodel Strategy Family-First / Family Meal Deals Taste of the Farm/ Off-Premise Sales
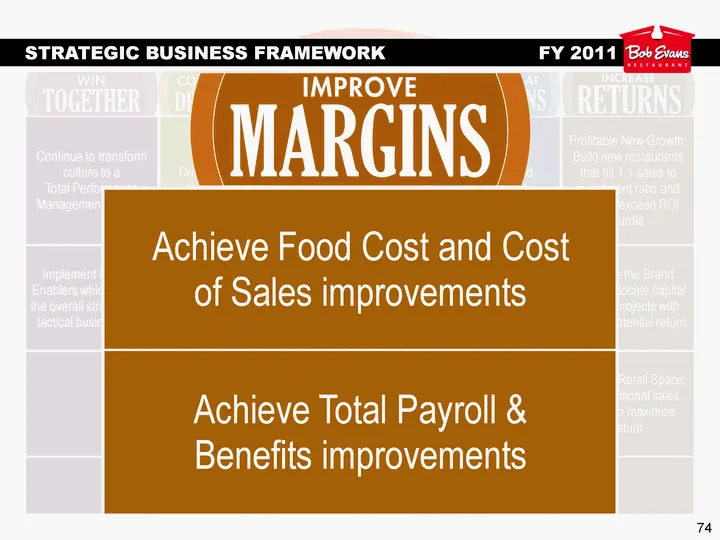
Slide 74: FY 2011 Strategic Initiatives
74 Continue to transform culture to a Total Performance Management mindset Drive sales to new family first core Achieve Food Cost and Cost of Sales improvements Improve Speed with Hospitality Profitable New Growth: Build new restaurants that hit 1:1 sales to investment ratio and meet or exceed ROI h
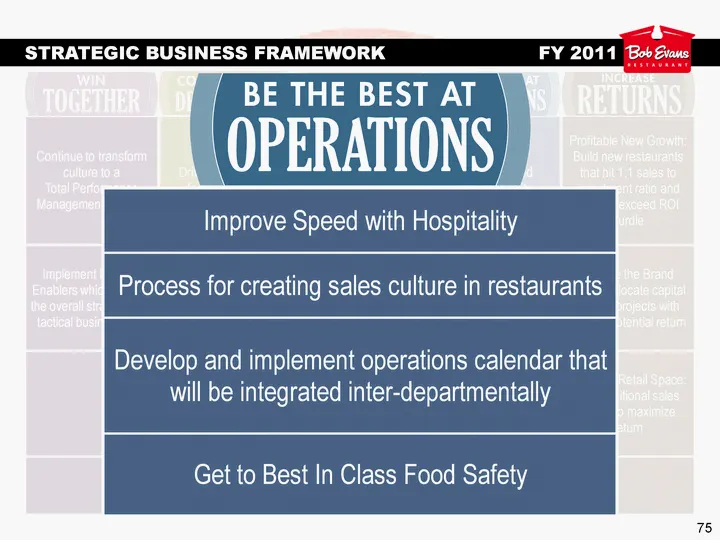
Slide 75: FY 2011 Strategic Initiatives
75 Continue to transform culture to a Total Performance Management mindset Drive sales to new family first core Achieve Food Cost and Cost of Sales improvements Improve Speed with Hospitality Profitable New Growth: Build new restaurants that hit 1:1 sales to investment ratio and meet or exceed ROI h
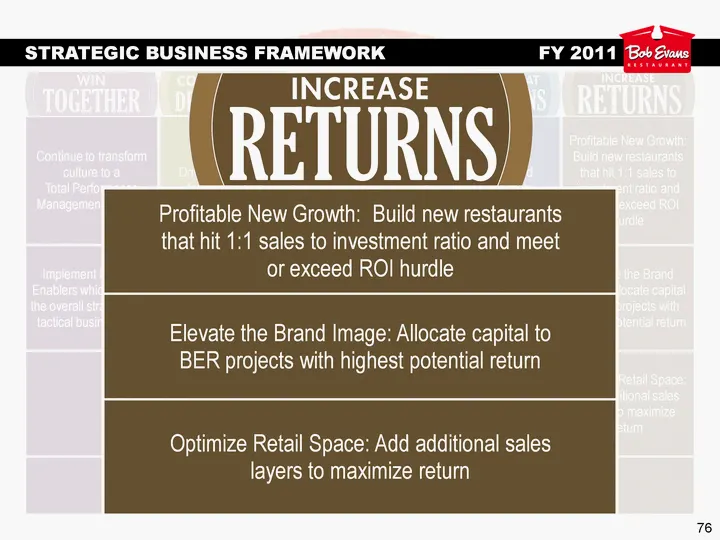
Slide 76: FY 2011 Strategic Initiatives
76 Continue to transform culture to a Total Performance Management mindset Drive sales to new family first core Achieve Food Cost and Cost of Sales improvements Improve Speed with Hospitality Profitable New Growth: Build new restaurants that hit 1:1 sales to investment ratio and meet or exceed ROI h
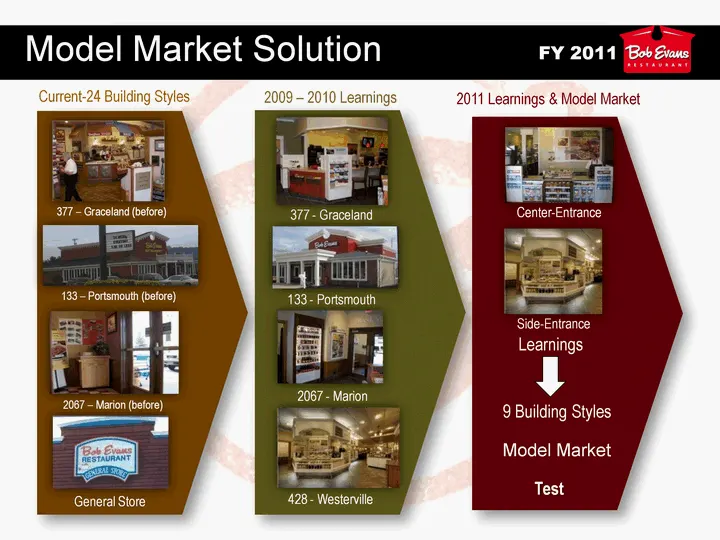
Slide 77: Building Styles and Model Market Learnings
Current-24 Building Styles 2011 Learnings & Model Market 2009 - 2010 Learnings 133 - Portsmouth (before) 2067 - Marion (before) General Store 133 - Portsmouth 2067 - Marion 377 - Graceland 377 - Graceland (before) 428 - Westerville Center-Entrance Side-Entrance Model Market Learnings 9 Building Styl
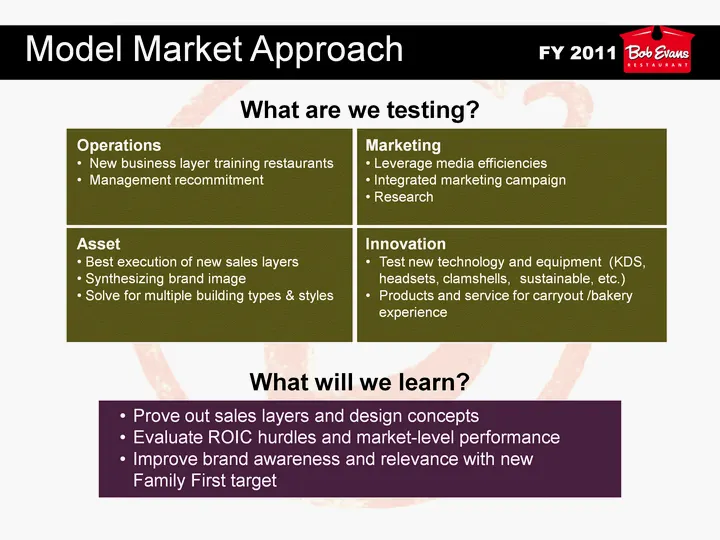
Slide 78: FY 2011 Model Market Approach
Operations New business layer training restaurants Management recommitment Marketing Leverage media efficiencies Integrated marketing campaign Research Asset Best execution of new sales layers Synthesizing brand image Solve for multiple building types & styles Innovation Test new technology and equi
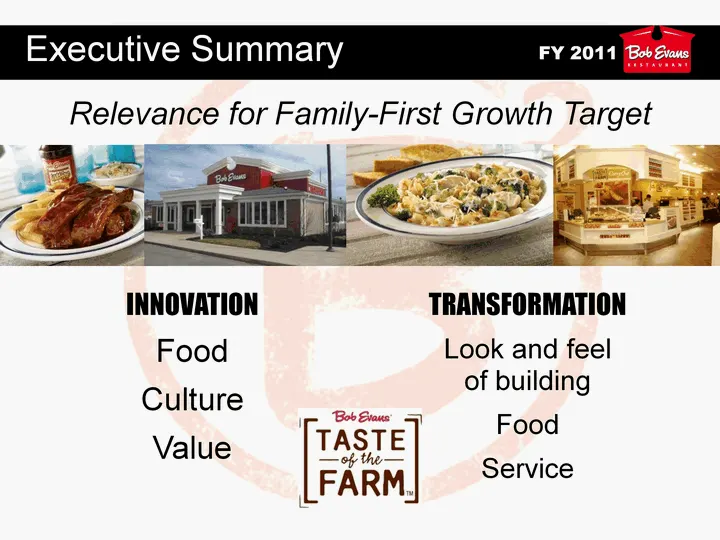
Slide 79: FY 2011 Executive Summary Transformation
Relevance for Family-First Growth Target INNOVATION Food Culture Value FY 2011 Executive Summary TRANSFORMATION Look and feel of building Food Service
Slide 80: Tim Pulido, President and Chief Concept Officer
80 Tim Pulido President and Chief Concept Officer
Slide 81: FY 2010 Review
81 FY 2010 Review
Slide 82: Business Transformation Vision
82 Re-vitalize Concept Define Brand/Concept Vision Rebuild guest satisfaction and frequency Renovate legacy stores Re-engineer Cost Structure Drive P&L improvements Focus on prime costs/Keep eye on the Guest Re-invest one point back into Marketing Business Transformation Vision FY 2010 REVIEW
Slide 83: Define Brand/Concept Vision
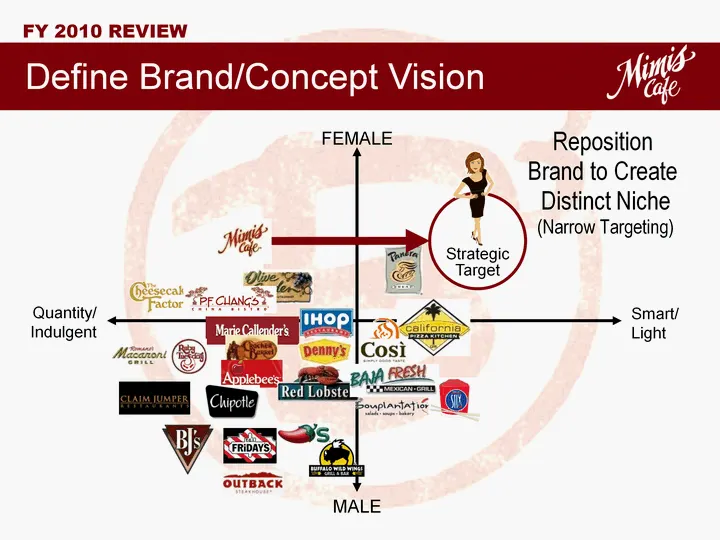
Define Brand/Concept Vision Quantity/ Indulgent MALE Smart/ Light FEMALE Strategic Target Reposition Brand to Create Distinct Niche (Narrow Targeting) FY 2010 REVIEW
Slide 84: FY 2010 Review Concept Vision
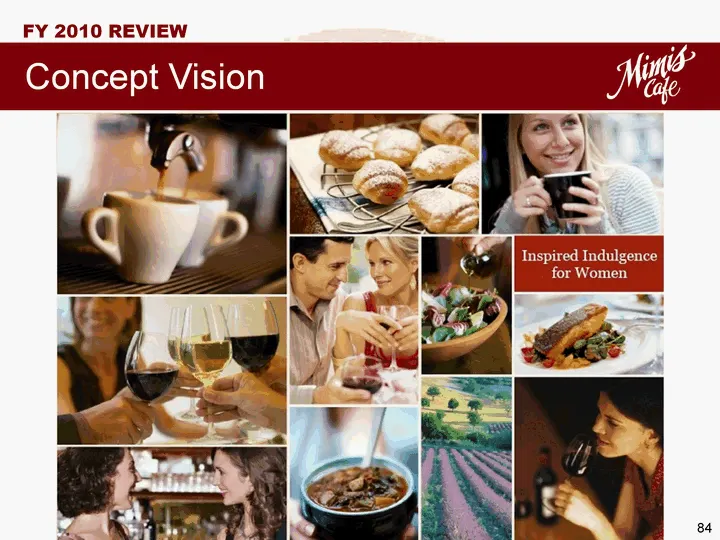
84 FY 2010 REVIEW Concept Vision
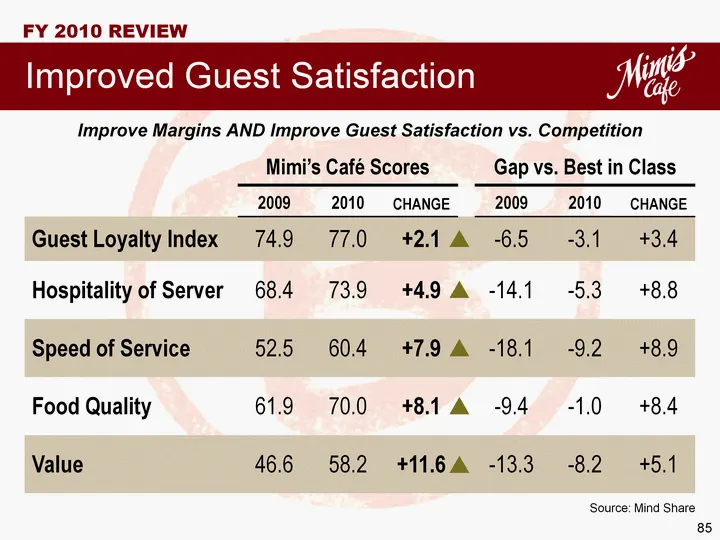
Slide 85: Improved Guest Satisfaction
85 Source: Mind Share Improved Guest Satisfaction Mimi's Cafe Scores Mimi's Cafe Scores Mimi's Cafe Scores Gap vs. Best in Class Gap vs. Best in Class Gap vs. Best in Class 2009 2010 CHANGE 2009 2010 CHANGE Guest Loyalty Index 74.9 77.0 +2.1 -6.5 -3.1 +3.4 Hospitality of Server 68.4 73.9 +4.9 -14.1
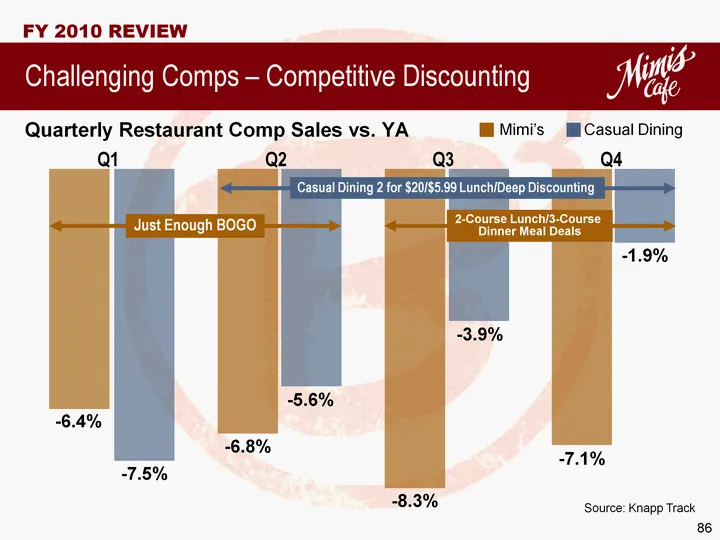
Slide 86: Quarterly Restaurant Comp Sales vs. YA
86 Quarterly Restaurant Comp Sales vs. YA Challenging Comps - Competitive Discounting Source: Knapp Track Q1 Q2 Q3 Q4 - -1.9% - -7.1% - -3.9% - -8.3% - -5.6% - -6.8% - -7.5% - -6.4% Mimi's Casual Dining Just Enough BOGO 2-Course Lunch/3-Course Dinner Meal Deals Casual Dining 2 for $20/$5.99 Lunch/De
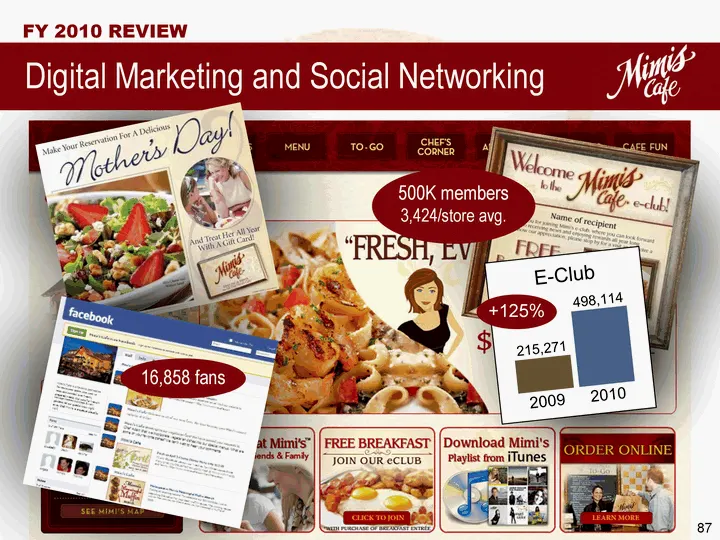
Slide 87: Digital Marketing and Social Networking
87 Digital Marketing and Social Networking 498,114 215,271 2009 2010 E-Club +125% 500K members 3,424/store avg. 16,858 fans FY 2010 REVIEW
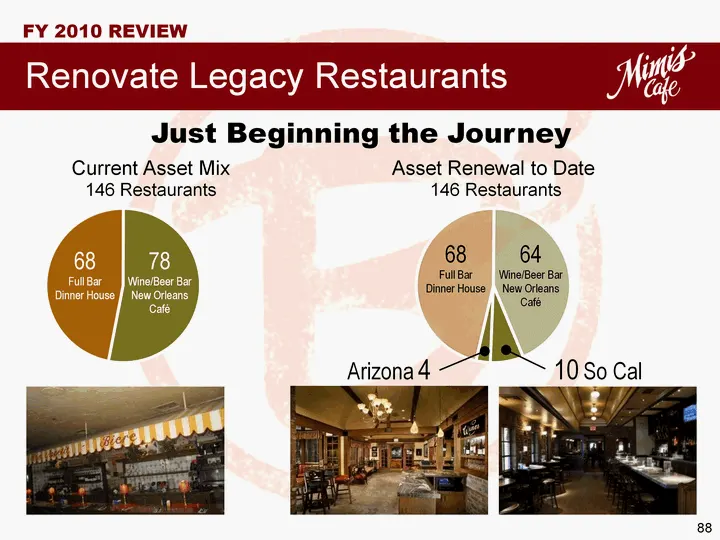
Slide 88: Renovate Legacy Restaurants
88 Renovate Legacy Restaurants Just Beginning the Journey Current Asset Mix 146 Restaurants Asset Renewal to Date 146 Restaurants (CHART) 78 Wine/Beer Bar New Orleans Cafe 68 Full Bar Dinner House (CHART) 64 Wine/Beer Bar New Orleans Cafe 68 Full Bar Dinner House Arizona 4 10 So Cal FY 2010 REVIEW
Slide 89: Re-engineer Cost Structure
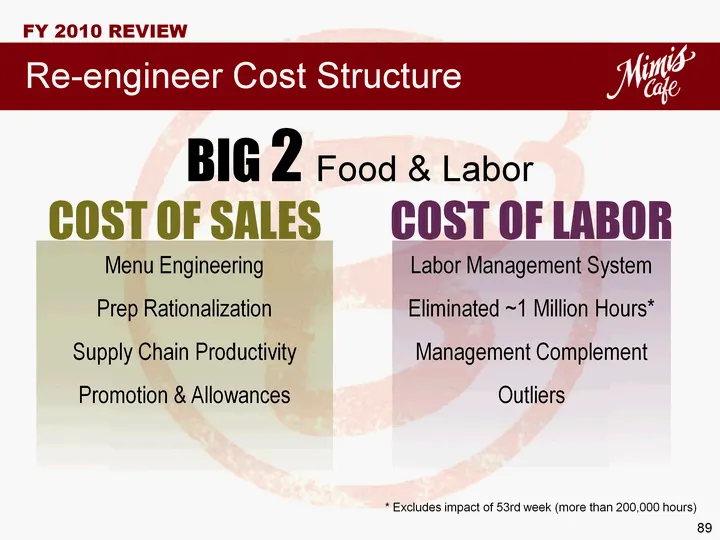
89 Re-engineer Cost Structure BIG 2 Food & Labor Menu Engineering Prep Rationalization Supply Chain Productivity Promotion & Allowances Labor Management System Eliminated ~1 Million Hours* Management Complement Outliers COST OF LABOR COST OF SALES * Excludes impact of 53rd week (more than 200,000 ho
Slide 90: FY 2011 Strategic Plan
90 Build the Niche to Win... Re-engineer the Cost Structure FY 2011 Strategic Plan
Slide 91: FY 2011 Annual Operating Plan Executive Summary
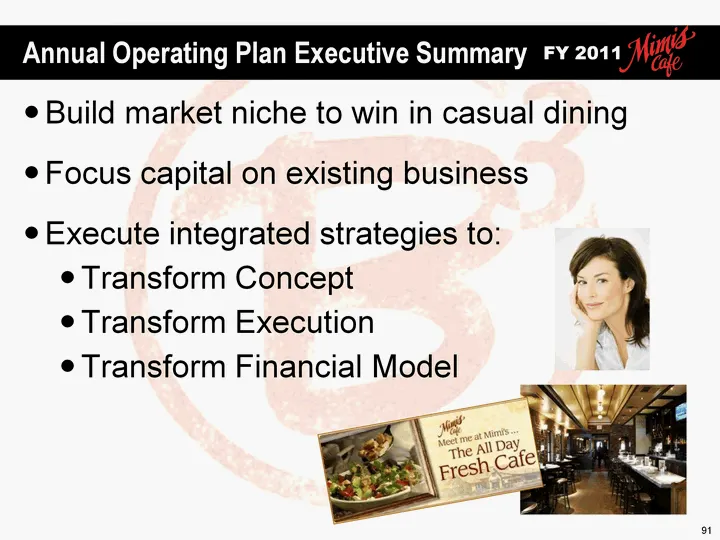
91 Build market niche to win in casual dining Focus capital on existing business Execute integrated strategies to: Transform Concept Transform Execution Transform Financial Model FY 2011 Annual Operating Plan Executive Summary
Slide 92: Strategic Business Framework FY 2011
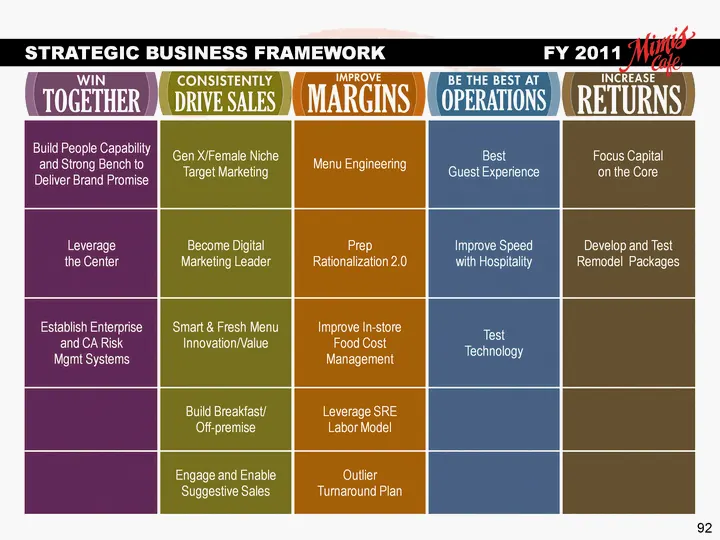
92 Build People Capability and Strong Bench to Deliver Brand Promise Gen X/Female Niche Target Marketing Menu Engineering Best Guest Experience Focus Capital on the Core Leverage the Center Become Digital Marketing Leader Prep Rationalization 2.0 Improve Speed with Hospitality Develop and Test Remod
Slide 93: Strategic Business Framework FY 2011
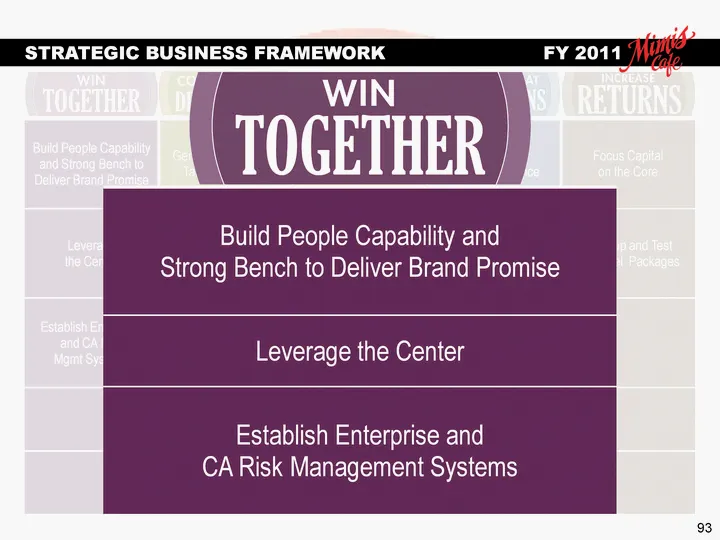
93 Build People Capability and Strong Bench to Deliver Brand Promise Gen X/Female Niche Target Marketing Menu Engineering Best Guest Experience Focus Capital on the Core Leverage the Center Become Digital Marketing Leader Prep Rationalization 2.0 Improve Speed with Hospitality Develop and Test Remod
Slide 94: Strategic Business Framework FY 2011
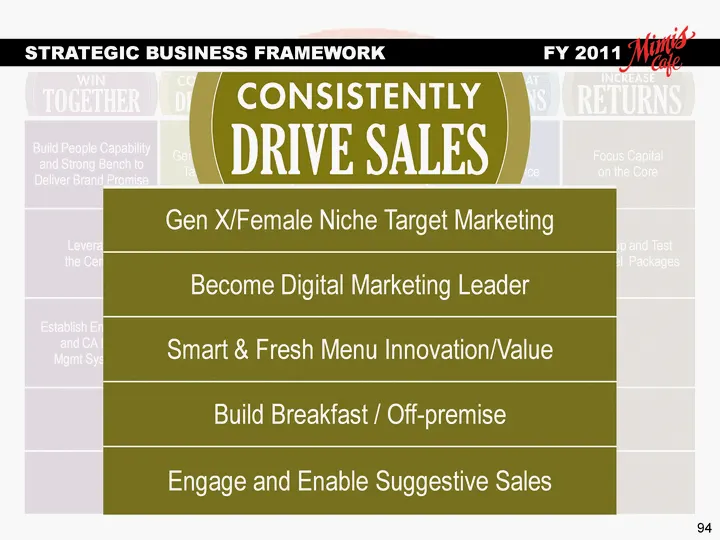
94 Build People Capability and Strong Bench to Deliver Brand Promise Gen X/Female Niche Target Marketing Menu Engineering Best Guest Experience Focus Capital on the Core Leverage the Center Become Digital Marketing Leader Prep Rationalization 2.0 Improve Speed with Hospitality Develop and Test Remod
Slide 95: Menu Innovation
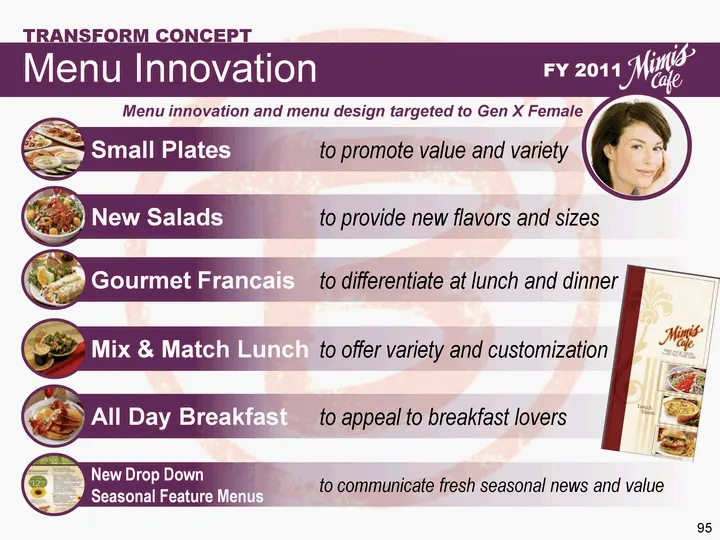
95 Small Plates to promote value and variety New Salads to provide new flavors and sizes Gourmet Francais to differentiate at lunch and dinner Mix & Match Lunch to offer variety and customization All Day Breakfast to appeal to breakfast lovers New Drop Down Seasonal Feature Menus to communicate fres
Slide 96: Digital Plan
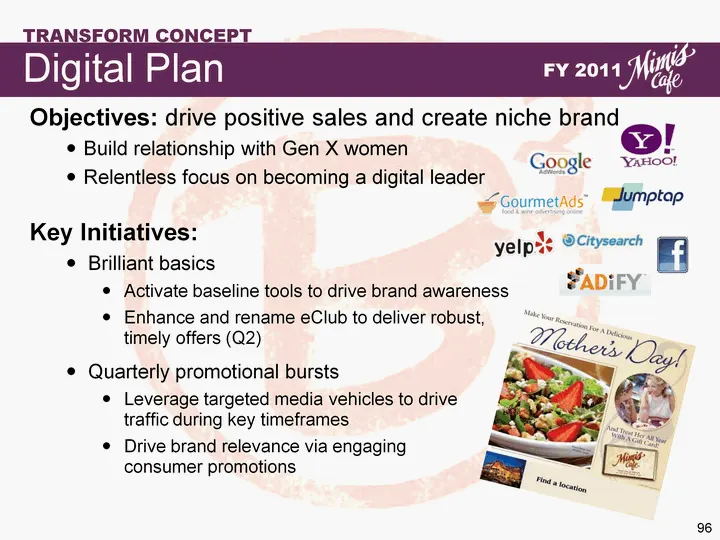
96 Objectives: drive positive sales and create niche brand Build relationship with Gen X women Relentless focus on becoming a digital leader Key Initiatives: Brilliant basics Activate baseline tools to drive brand awareness Enhance and rename eClub to deliver robust, timely offers (Q2) Quarterly pro
Slide 97: Transform Restaurants
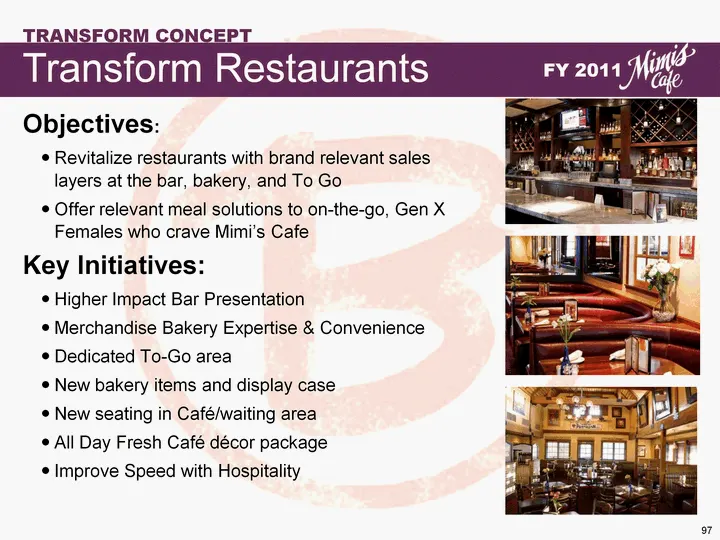
97 Objectives: Revitalize restaurants with brand relevant sales layers at the bar, bakery, and To Go Offer relevant meal solutions to on-the-go, Gen X Females who crave Mimi's Cafe Key Initiatives: Higher Impact Bar Presentation Merchandise Bakery Expertise & Convenience Dedicated To-Go area New bak
Slide 98: Transform Restaurants Old vs New
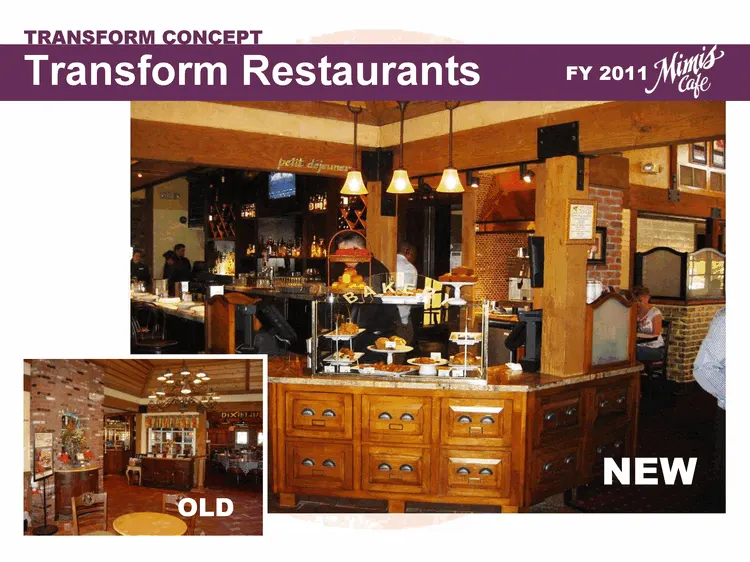
OLD NEW Transform Restaurants FY 2011 TRANSFORM CONCEPT
Slide 99: Bar/Cafe Old vs New
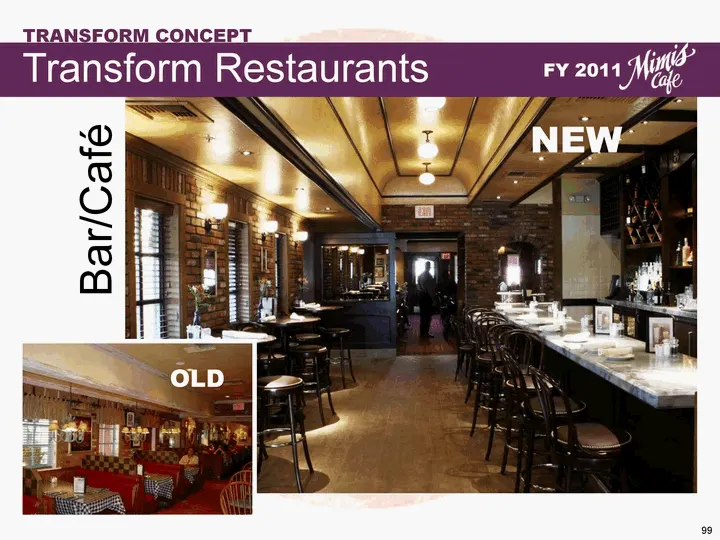
99 Bar/Cafe NEW OLD Transform Restaurants FY 2011 TRANSFORM CONCEPT
Slide 100: Model Market Game Plan
Concept Transformation at Market Level All Day Fresh Cafe Concept brought to life Test market restaurants will move to one brand look (Market Coach Leadership/Ownership) Consistent presentation of concept and offerings/services Restaurant level leaders and teams: to deliver concept transformation fo
Slide 101: Weekend Sales Focus
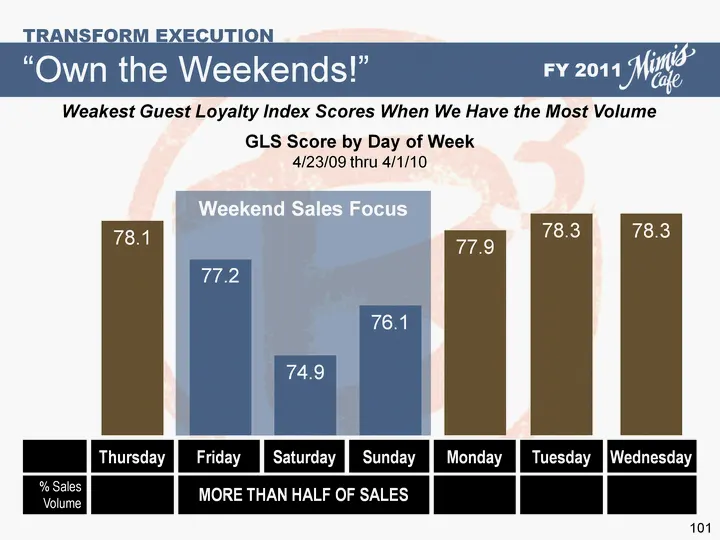
101 Weakest Guest Loyalty Index Scores When We Have the Most Volume GLS Score by Day of Week 4/23/09 thru 4/1/10 78.1 77.2 74.9 76.1 77.9 78.3 78.3 "Own the Weekends!" FY 2011 TRANSFORM EXECUTION Weekend Sales Focus Thursday Friday Saturday Sunday Monday Tuesday Wednesday % Sales Volume MORE THAN HA
Slide 102: Sales Manager Program
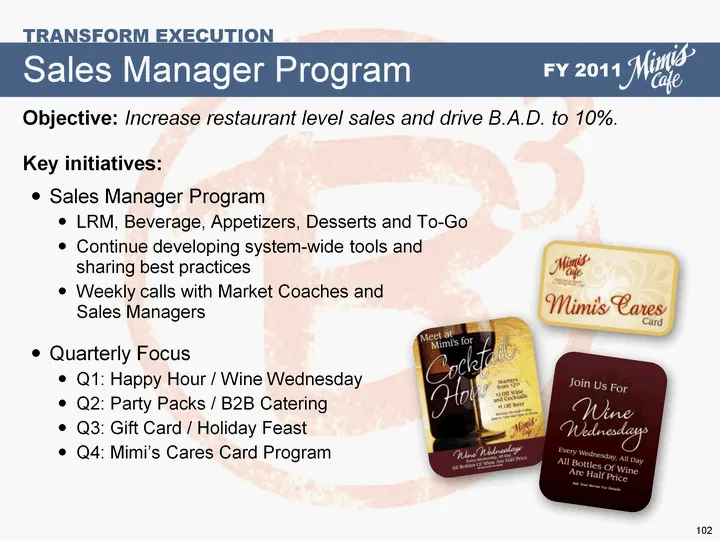
Objective: Increase restaurant level sales and drive B.A.D. to 10%. Key initiatives: Sales Manager Program LRM, Beverage, Appetizers, Desserts and To-Go Continue developing system-wide tools and sharing best practices Weekly calls with Market Coaches and Sales Managers Quarterly Focus Q1: Happy Hour
Slide 103: Strategic Business Framework FY 2011
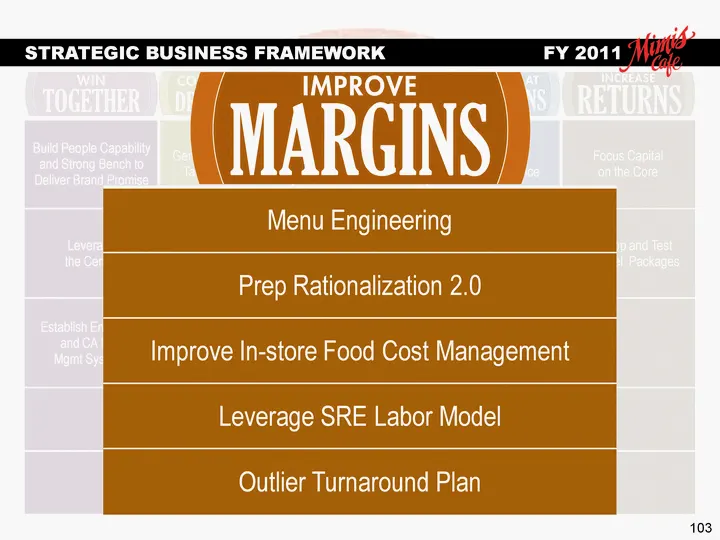
103 Build People Capability and Strong Bench to Deliver Brand Promise Gen X/Female Niche Target Marketing Menu Engineering Best Guest Experience Focus Capital on the Core Leverage the Center Become Digital Marketing Leader Prep Rationalization 2.0 Improve Speed with Hospitality Develop and Test Remo
Slide 104: Strategic Business Framework FY 2011
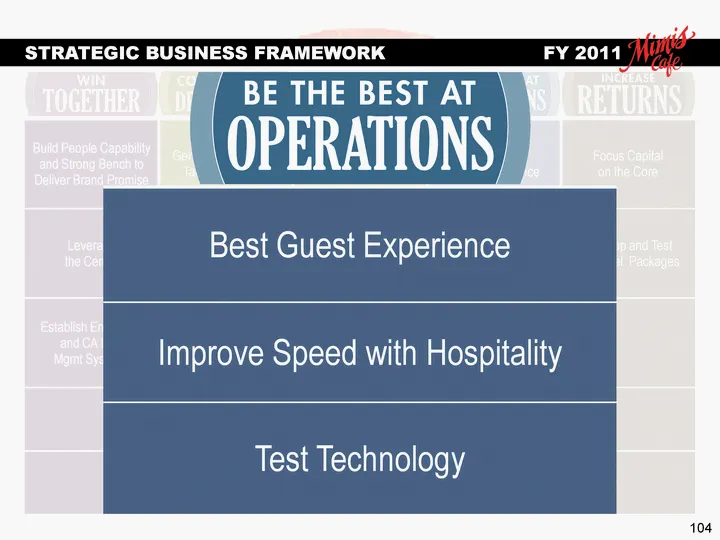
104 Build People Capability and Strong Bench to Deliver Brand Promise Gen X/Female Niche Target Marketing Menu Engineering Best Guest Experience Focus Capital on the Core Leverage the Center Become Digital Marketing Leader Prep Rationalization 2.0 Improve Speed with Hospitality Develop and Test Remo
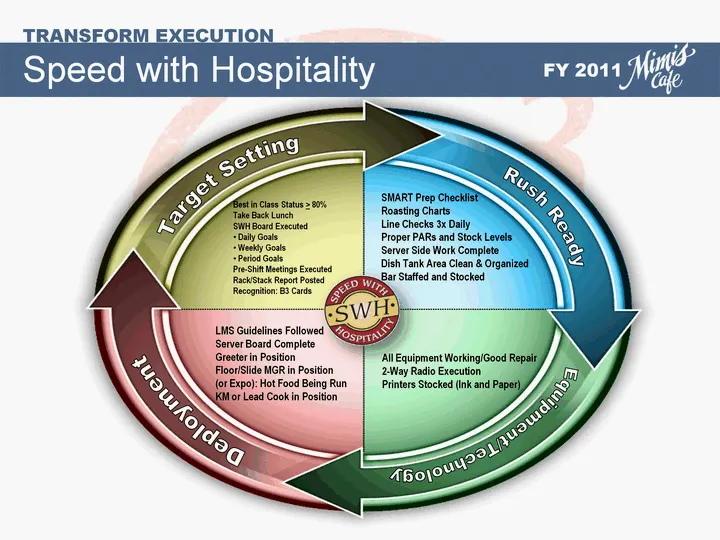
Slide 105: Speed with Hospitality
Target Setting Rush Ready Equipment/Technology Deployment FY 2011 TRANSFORM EXECUTION All Equipment Working/Good Repair 2-Way Radio Execution Printers Stocked (Ink and Paper) Best in Class Status > 80% Take Back Lunch SWH Board Executed Daily Goals Weekly Goals Period Goals Pre-Shift Meetings Execut
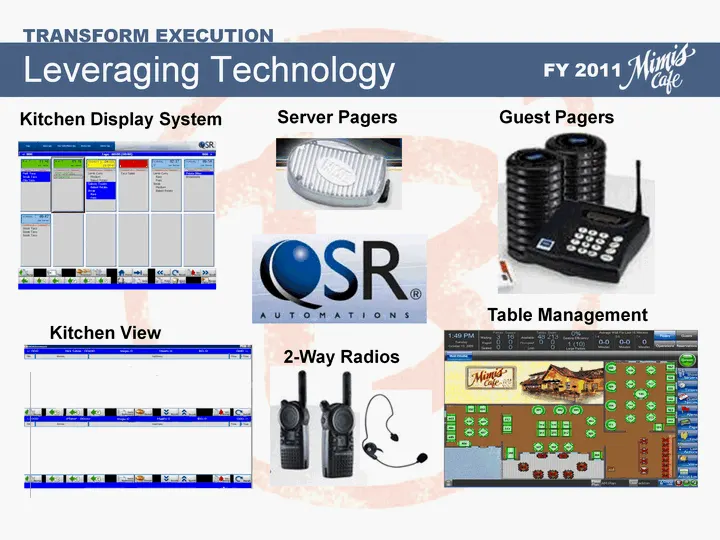
Slide 106: Leveraging Technology
Kitchen Display System Server Pagers Guest Pagers Table Management 2-Way Radios Kitchen View Leveraging Technology FY 2011 TRANSFORM EXECUTION
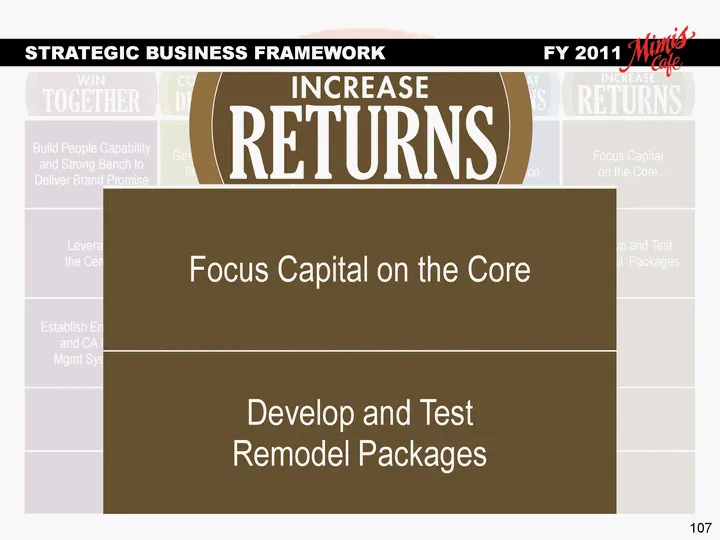
Slide 107: Strategic Business Framework FY 2011
107 Build People Capability and Strong Bench to Deliver Brand Promise Gen X/Female Niche Target Marketing Menu Engineering Best Guest Experience Focus Capital on the Core Leverage the Center Become Digital Marketing Leader Prep Rationalization 2.0 Improve Speed with Hospitality Develop and Test Remo
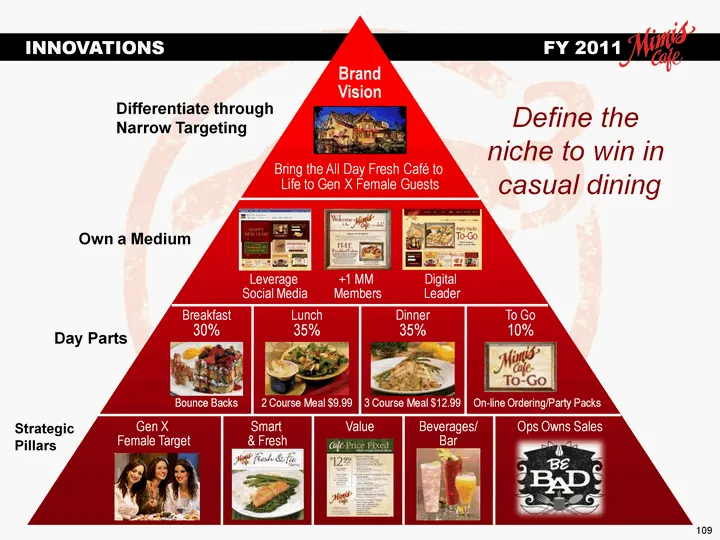
Slide 108: Brand Vision and Strategic Pillars
Differentiate through Narrow Targeting Own a Medium Day Parts Strategic Pillars Define the niche to win in casual dining Gen X Female Target Smart & Fresh Value Beverages/ Bar Ops Owns Sales Bounce Backs 2 Course Meal $9.99 3 Course Meal $12.99 On-line Ordering/Party Packs Breakfast 30% Lunch 35% Di
Slide 109: Annual Operating Plan Big Three
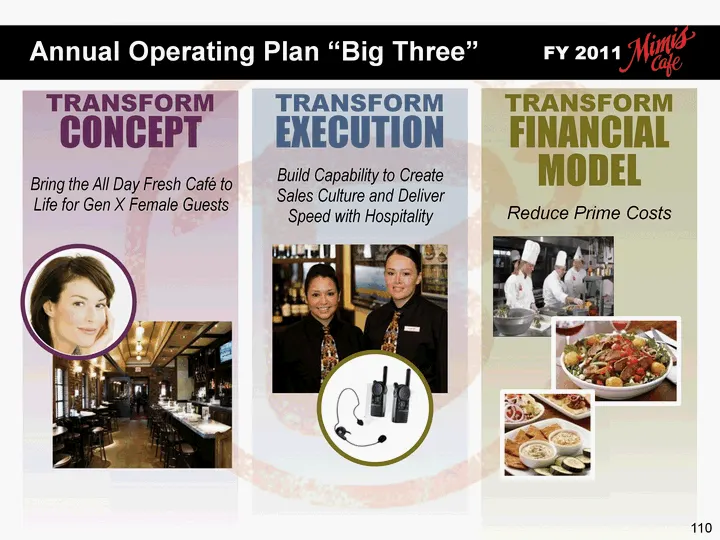
110 Bring the All Day Fresh Cafe to Life for Gen X Female Guests Build Capability to Create Sales Culture and Deliver Speed with Hospitality Reduce Prime Costs TRANSFORM CONCEPT TRANSFORM EXECUTION TRANSFORM FINANCIAL MODEL FY 2011 Annual Operating Plan "Big Three"
Slide 110: FY 2011 Annual Operating Plan Executive Summary
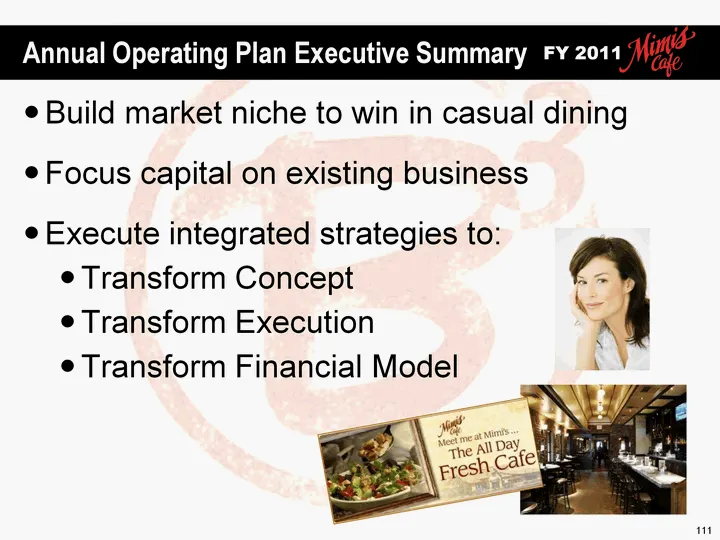
111 Build market niche to win in casual dining Focus capital on existing business Execute integrated strategies to: Transform Concept Transform Execution Transform Financial Model FY 2011 Annual Operating Plan Executive Summary
Slide 111: Harvey Brownlee, President and Chief Restaurant Operations Officer
112 Harvey Brownlee President and Chief Restaurant Operations Officer
Slide 112: FY 2010 Review FY 2011 Strategic Plan
113 FY 2010 Review FY 2011 Strategic Plan
Slide 113: We have made great progress
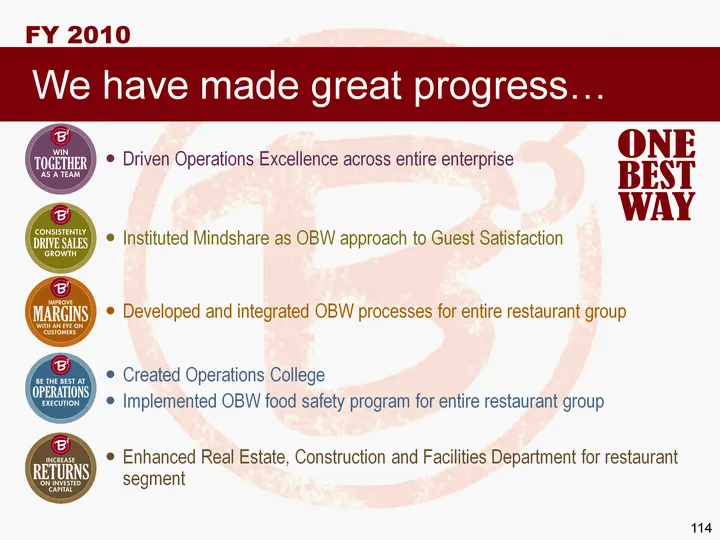
114 We have made great progress... FY 2010 Driven Operations Excellence across entire enterprise Instituted Mindshare as OBW approach to Guest Satisfaction Developed and integrated OBW processes for entire restaurant group Created Operations College Implemented OBW food safety program for entire res
Slide 114: We still have much to do
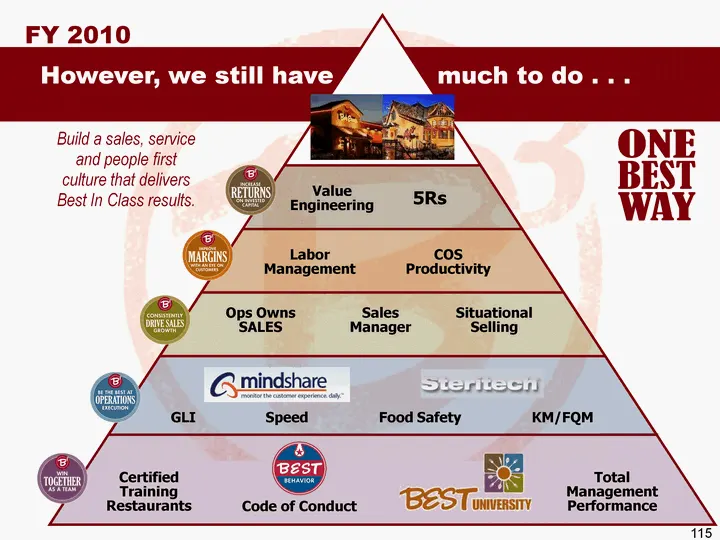
However, we still have much to do . . . 115 Build a sales, service and people first culture that delivers Best In Class results. Certified Training Restaurants Code of Conduct Total Management Performance GLI Speed Food Safety KM/FQM Ops Owns SALES Sales Manager Situational Selling Labor Management
Slide 115: Strategic Business Framework FY 2011
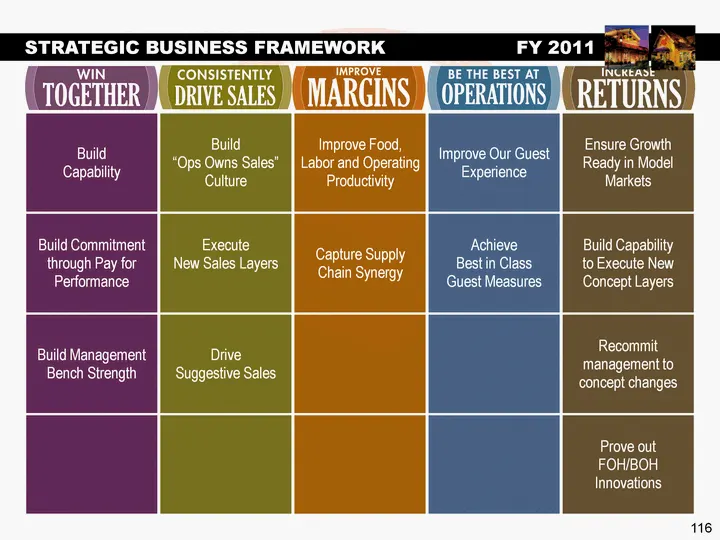
116 Build Capability Build "Ops Owns Sales" Culture Improve Food, Labor and Operating Productivity Improve Our Guest Experience Ensure Growth Ready in Model Markets Build Commitment through Pay for Performance Execute New Sales Layers Capture Supply Chain Synergy Achieve Best in Class Guest Measures
Slide 116: Strategic Business Framework FY 2011
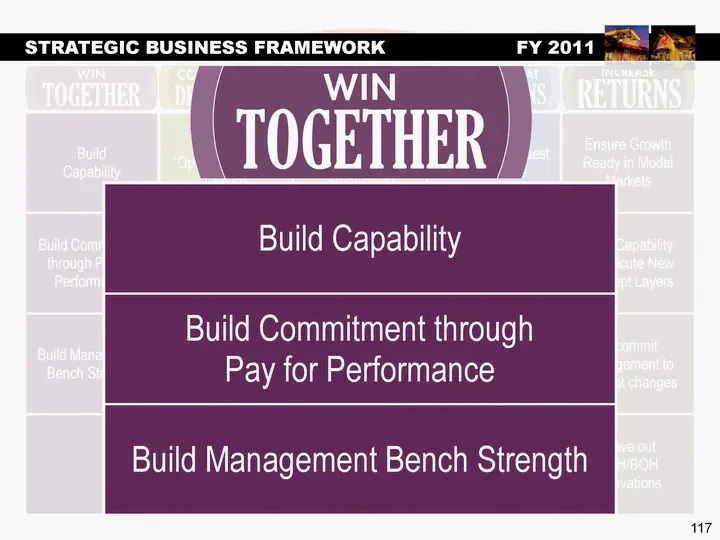
117 Build Capability Build "Ops Owns Sales" Culture Improve Food, Labor and Operating Productivity Improve Our Guest Experience Ensure Growth Ready in Model Markets Build Commitment through Pay for Performance Execute New Sales Layers Capture Supply Chain Synergy Achieve Best in Class Guest Measures
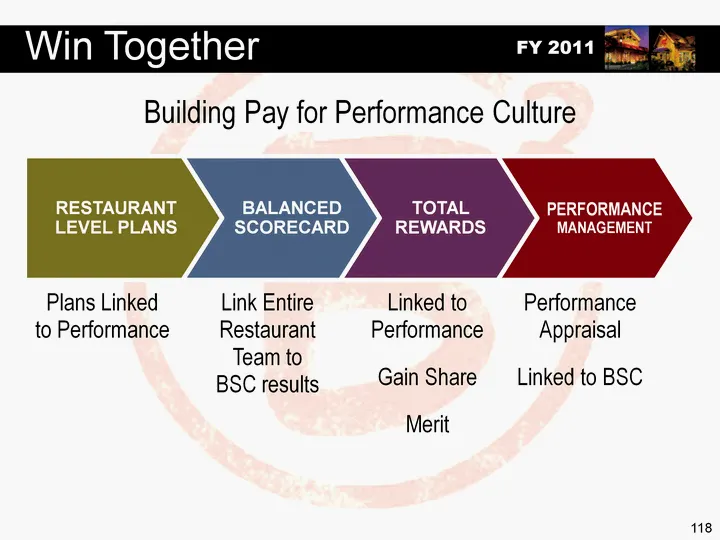
Slide 117: Building Pay for Performance Culture
118 RESTAURANT LEVEL PLANS BALANCED SCORECARD TOTAL REWARDS PERFORMANCE MANAGEMENT Plans Linked to Performance Link Entire Restaurant Team to BSC results Linked to Performance Gain Share Merit Performance Appraisal Linked to BSC Win Together FY 2011 Building Pay for Performance Culture
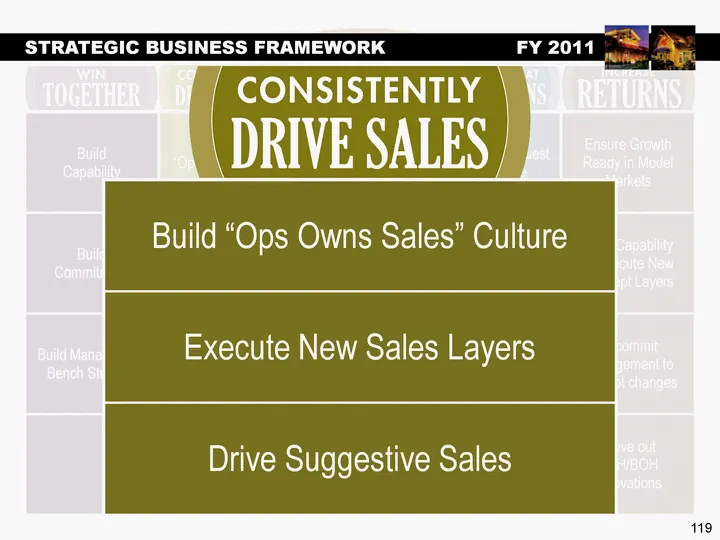
Slide 118: Strategic Business Framework FY 2011
119 Build Capability Build "Ops Owns Sales" Culture Improve Food, Labor and Operating Productivity Improve Our Guest Experience Ensure Growth Ready in Model Markets Build Commitment Execute New Sales Layers Capture Supply Chain Synergy Achieve Best in Class Guest Measures Build Capability to Execute
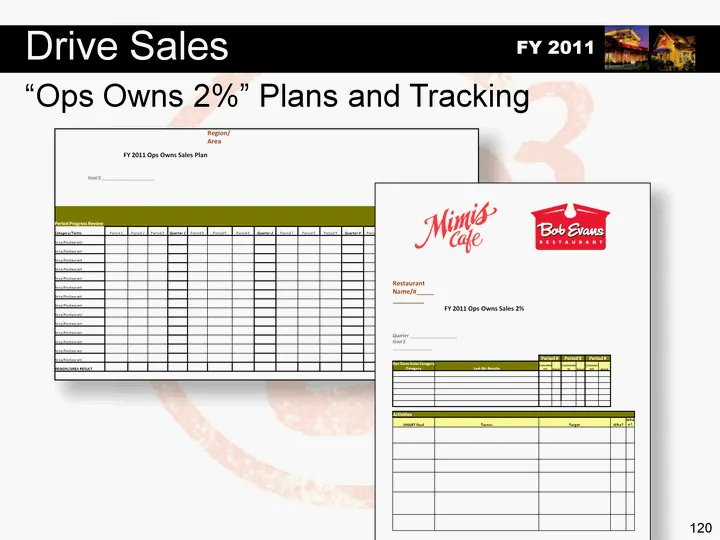
Slide 119: Ops Owns 2% Plans and Tracking
"Ops Owns 2%" Plans and Tracking FY 2011 FY 2011 Ops Owns Sales Plan FY 2011 Ops Owns Sales Plan FY 2011 Ops Owns Sales Plan FY 2011 Ops Owns Sales Plan FY 2011 Ops Owns Sales Plan FY 2011 Ops Owns Sales Plan Region/Area Goal $ _____________________ Goal $ _____________________ Goal $ ______________
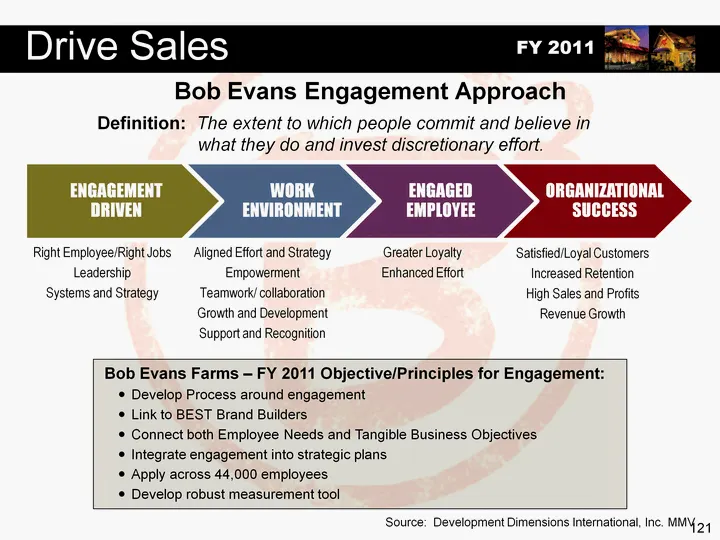
Slide 120: Bob Evans Engagement Approach
FY 2011 Drive Sales 121 Bob Evans Engagement Approach Bob Evans Farms - FY 2011 Objective/Principles for Engagement: Develop Process around engagement Link to BEST Brand Builders Connect both Employee Needs and Tangible Business Objectives Integrate engagement into strategic plans Apply across 44,00
Slide 121: Strategic Business Framework FY 2011
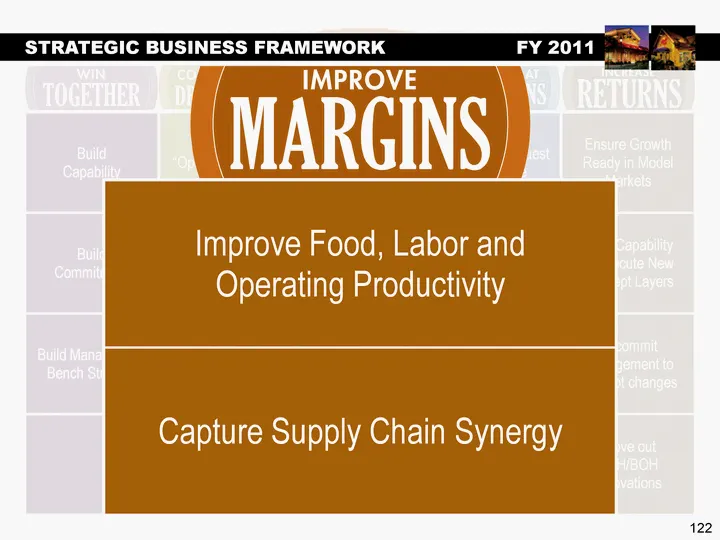
122 Build Capability Build "Ops Owns Sales" Culture Improve Food, Labor and Operating Productivity Improve Our Guest Experience Ensure Growth Ready in Model Markets Build Commitment Execute New Sales Layers Capture Supply Chain Synergy Achieve Best in Class Guest Measures Build Capability to Execute
Slide 122: Food Cost Outlook FY 2011
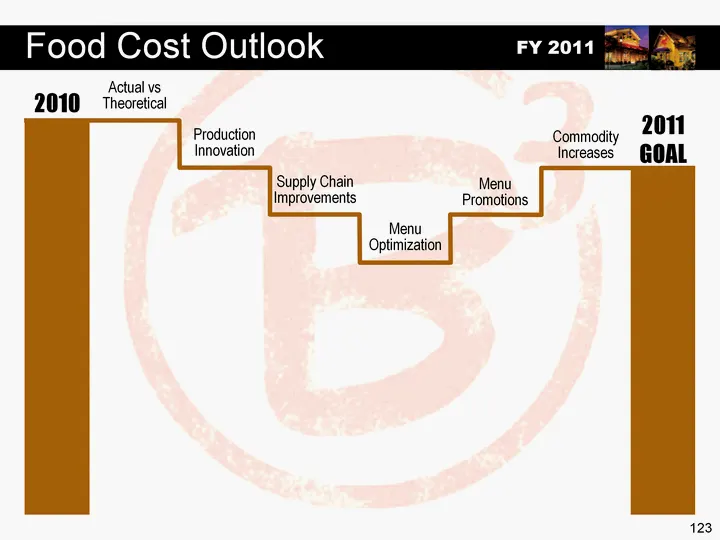
123 Food Cost Outlook FY 2011 2010 Actual vs Theoretical 2011 GOAL Production Innovation Commodity Increases 2011 GOAL Supply Chain Improvements Menu Promotions Menu Optimization
Slide 123: Pay & Benefits Outlook FY 2011
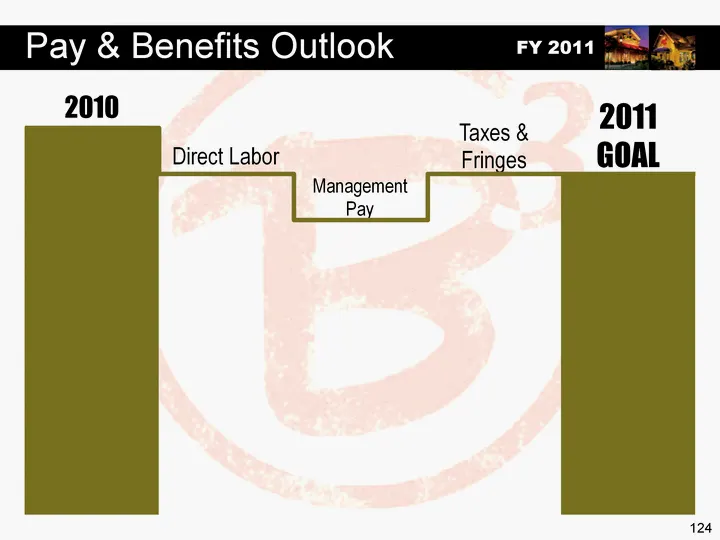
124 Pay & Benefits Outlook FY 2011 2010 Direct Labor Management Pay Taxes & Fringes 2011 GOAL Direct Labor Management Pay Taxes & Fringes 2011 GOAL Management Pay
Slide 124: Strategic Business Framework FY 2011
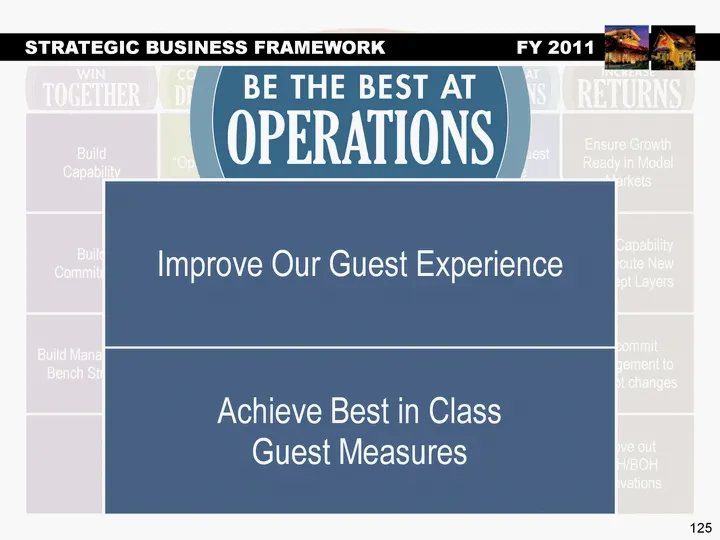
125 Build Capability Build "Ops Owns Sales" Culture Improve Food, Labor and Operating Productivity Improve Our Guest Experience Ensure Growth Ready in Model Markets Build Commitment Execute New Sales Layers Capture Supply Chain Synergy Achieve Best in Class Guest Measures Build Capability to Execute
Slide 125: Key Drivers of Guest Satisfaction
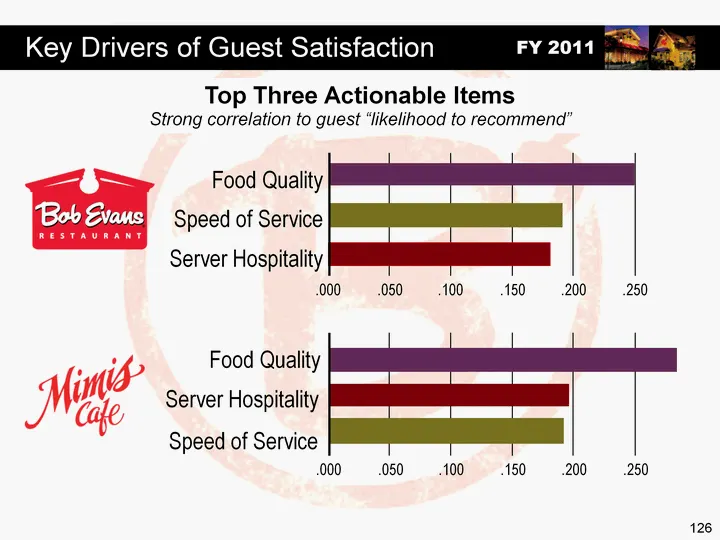
126 Key Drivers of Guest Satisfaction FY 2011 Food Quality Speed of Service Server Hospitality ..000 ..050 ..100 ..150 ..200 ..250 Top Three Actionable Items Strong correlation to guest "likelihood to recommend" Food Quality Speed of Service Server Hospitality ..000 ..050 ..100 ..150 ..200 ..250
Slide 126: Holistic Approach to Speed with Hospitality
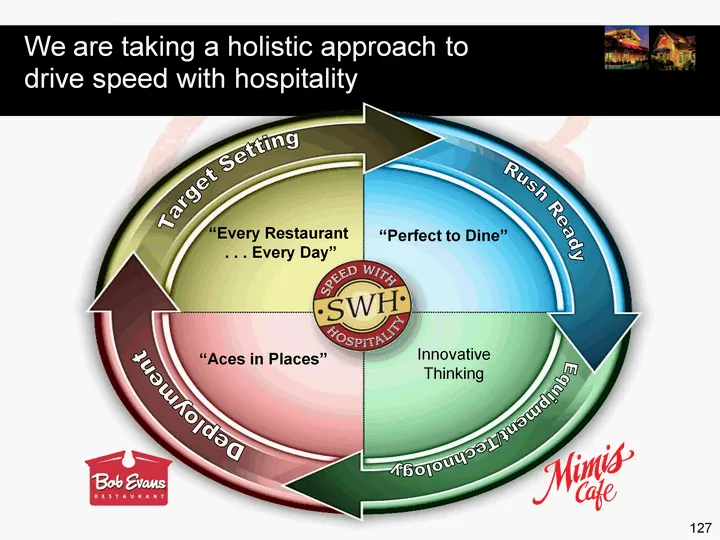
We are taking a holistic approach to drive speed with hospitality 127 Target Setting Rush Ready Equipment/Technology Deployment "Perfect to Dine" "Aces in Places" "Every Restaurant . . . Every Day" Innovative Thinking
Slide 127: Strategic Business Framework FY 2011
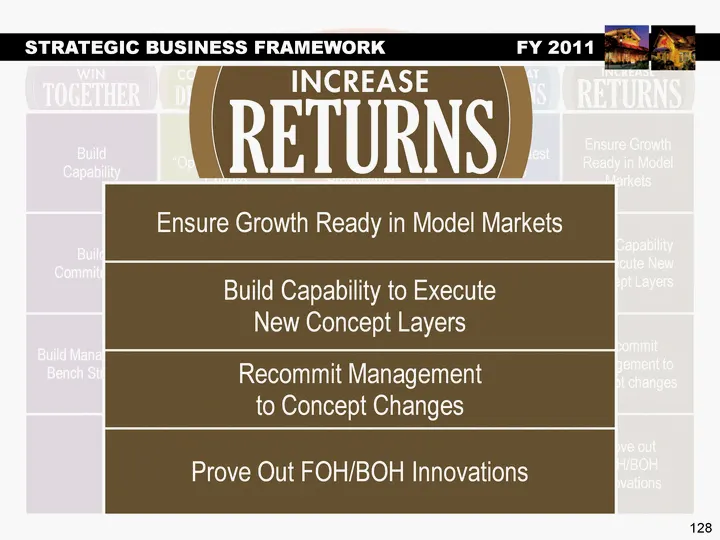
128 Build Capability Build "Ops Owns Sales" Culture Improve Food, Labor and Operating Productivity Improve Our Guest Experience Ensure Growth Ready in Model Markets Build Commitment Execute New Sales Layers Capture Supply Chain Synergy Achieve Best in Class Guest Measures Build Capability to Execute
Slide 128: FY 2010 Review FY 2011 Strategic Plan Development
129 FY 2010 Review FY 2011 Strategic Plan DEVELOPMENT
Slide 129: Development Overview
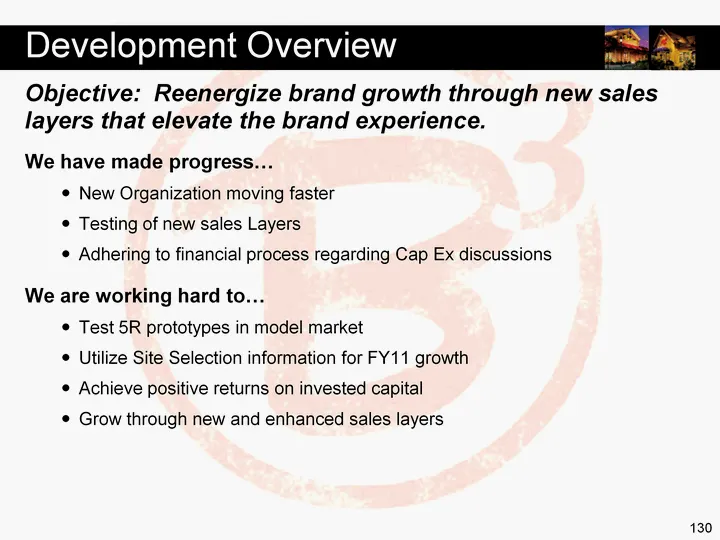
130 Development Overview We have made progress... New Organization moving faster Testing of new sales Layers Adhering to financial process regarding Cap Ex discussions We are working hard to... Test 5R prototypes in model market Utilize Site Selection information for FY11 growth Achieve positive ret
Slide 130: Our Plan to Win
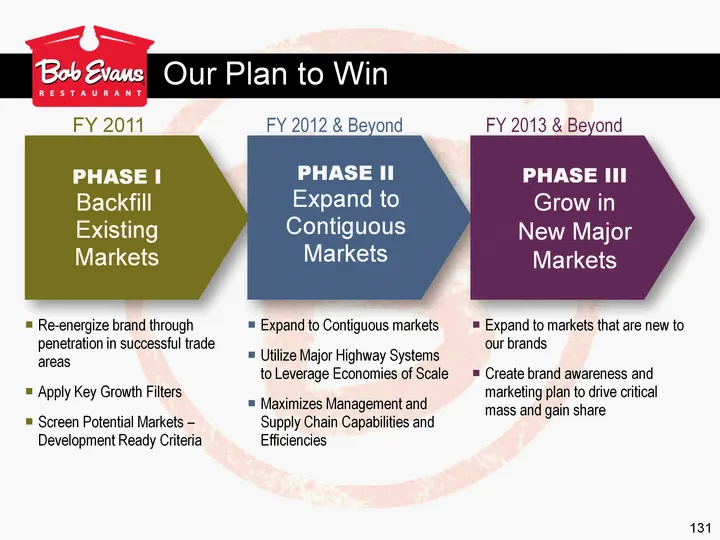
131 Our Plan to Win FY 2011 PHASE I Backfill Existing Markets FY 2012 & Beyond PHASE II Expand to Contiguous Markets FY 2013 & Beyond PHASE III Grow in New Major Markets Re-energize brand through penetration in successful trade areas Apply Key Growth Filters Screen Potential Markets - Development Re
Slide 131: Our Plan to Win Phases
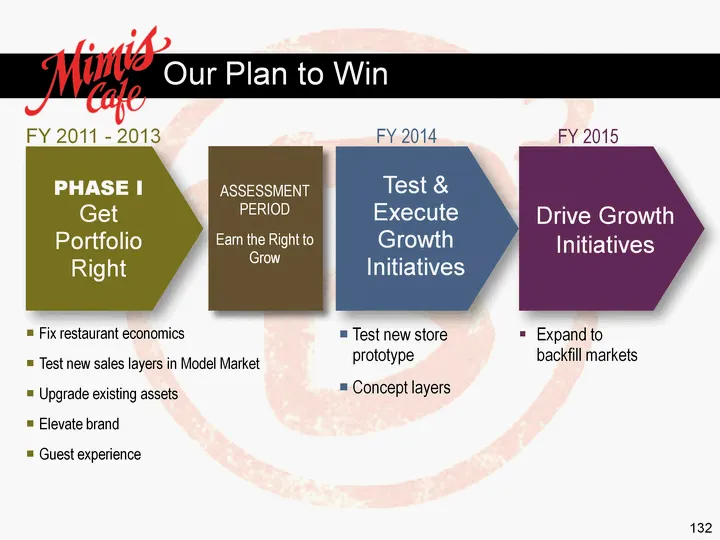
132 FY 2011 - 2013 PHASE I Get Portfolio Right FY 2014 Test & Execute Growth Initiatives FY 2015 Drive Growth Initiatives Fix restaurant economics Test new sales layers in Model Market Upgrade existing assets Elevate brand Guest experience Test new store prototype Concept layers Expand to backfill m
Slide 132: Model Market Approach
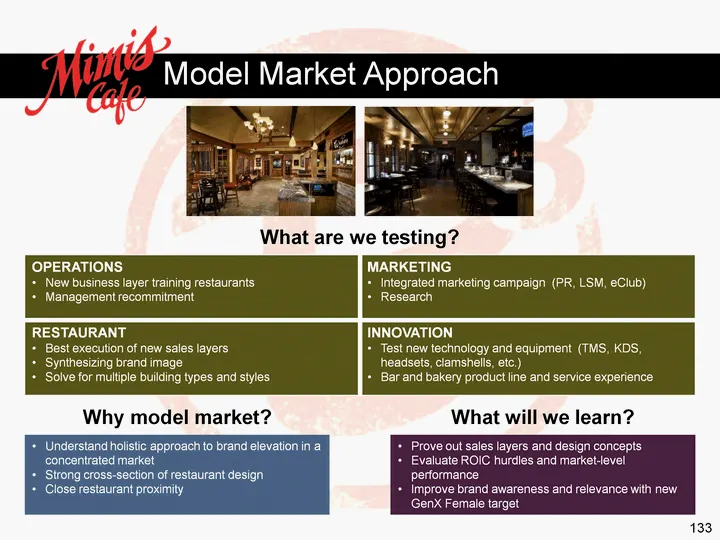
133 Model Market Approach Understand holistic approach to brand elevation in a concentrated market Strong cross-section of restaurant design Close restaurant proximity OPERATIONS New business layer training restaurants Management recommitment MARKETING Integrated marketing campaign (PR, LSM, eClub)
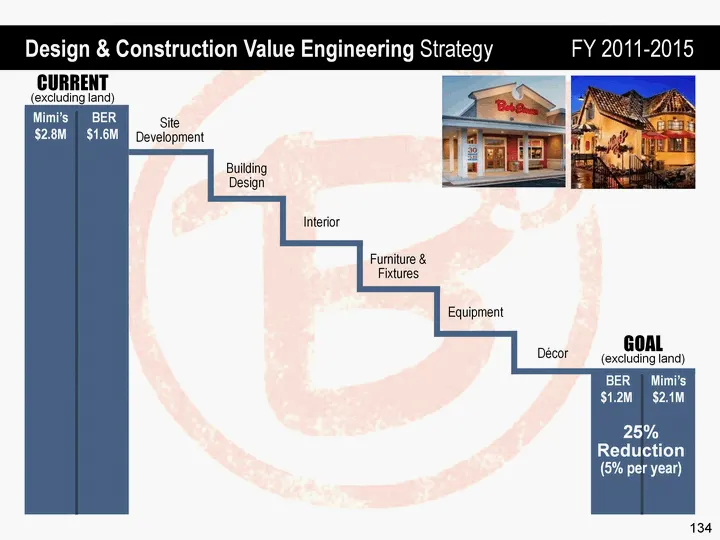
Slide 133: Design & Construction Value Engineering Strategy
134 Mimi's $2.8M BER $1.6M Site Development Mimi's $2.8M BER $1.6M Building Design Mimi's $2.8M BER $1.6M Interior Mimi's $2.8M BER $1.6M Furniture & Fixtures Mimi's $2.8M BER $1.6M Equipment Mimi's $2.8M BER $1.6M Decor Mimi's $2.8M BER $1.6M BER $1.2M Mimi's $2.1M CURRENT (excluding land) 25% Redu
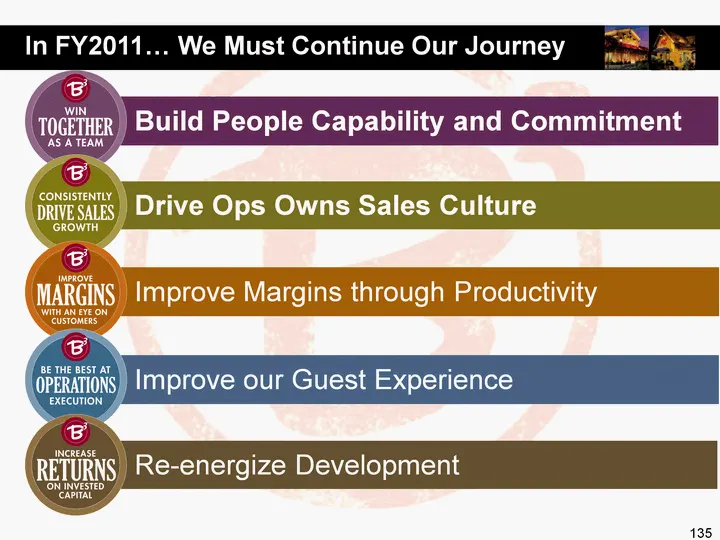
Slide 134: In FY2011 We Must Continue Our Journey
Build People Capability and Commitment Drive Ops Owns Sales Culture Improve Margins through Productivity Improve our Guest Experience Re-energize Development 135 In FY2011... We Must Continue Our Journey
Slide 135: Mike Townsley, President Food Products
136 Mike Townsley President Food Products
Slide 136: FY 2010 Review Food Products
137 FY 2010 Review Food Products
Slide 137: Key Metrics FY 2010 Review
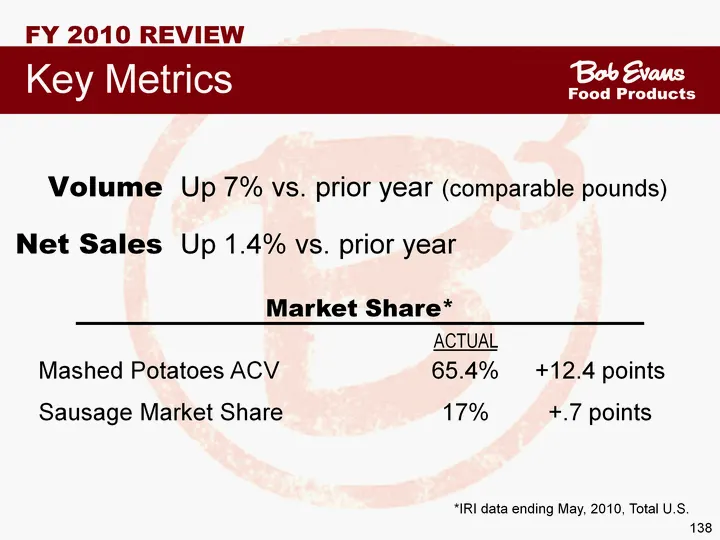
138 Key Metrics FY 2010 REVIEW Volume Up 7% vs. prior year (comparable pounds) Net Sales Up 1.4% vs. prior year Food Products Market Share* ACTUAL Mashed Potatoes ACV 65.4% +12.4 points Sausage Market Share 17% +.7 points *IRI data ending May, 2010, Total U.S.
Slide 138: Key Accomplishments Food Products
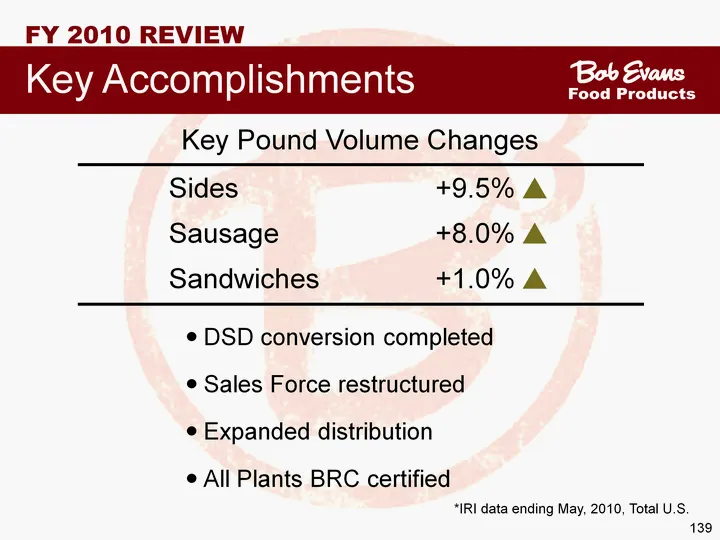
139 Key Accomplishments Food Products DSD conversion completed Sales Force restructured Expanded distribution All Plants BRC certified Key Pound Volume Changes Sides +9.5% Sausage +8.0% Sandwiches +1.0% *IRI data ending May, 2010, Total U.S. FY 2010 REVIEW
Slide 139: Distribution Map Food Products
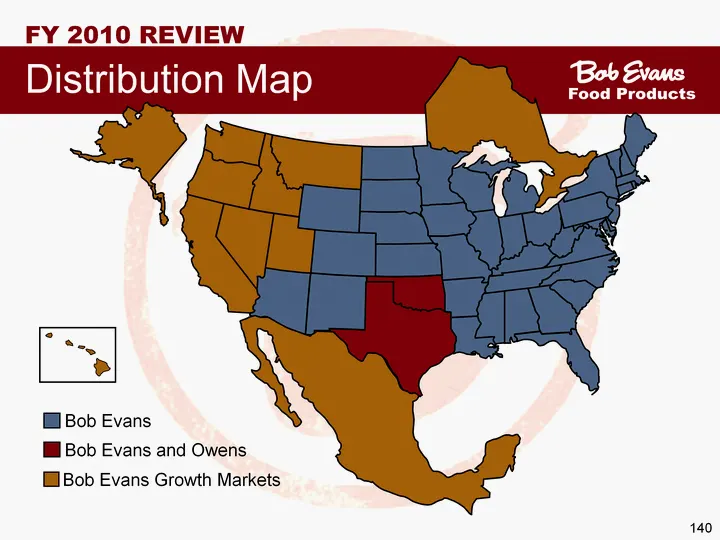
140 Distribution Map Food Products Bob Evans Bob Evans and Owens Bob Evans Growth Markets FY 2010 REVIEW
Slide 140: Business Profile Food Products
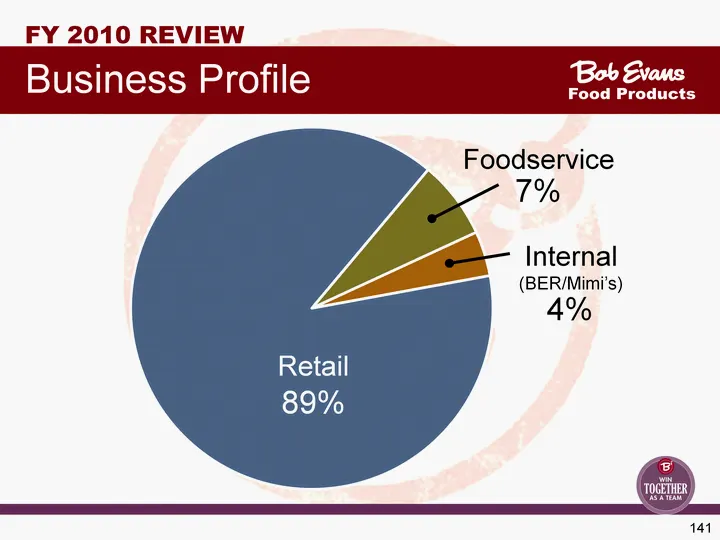
141 (CHART) Retail 89% Foodservice 7% Internal (BER/Mimi's) 4% Business Profile Food Products FY 2010 REVIEW
Slide 141: FY 2011 Strategic Plan Food Products
142 FY 2011 Strategic Plan Food Products
Slide 142: Vision
143 Vision Be "Best in Class" Food Business with a portfolio of convenient meal solutions that meet consumer needs driven by innovation and strong retail partnerships.
Slide 143: Innovations and Strategic Pillars
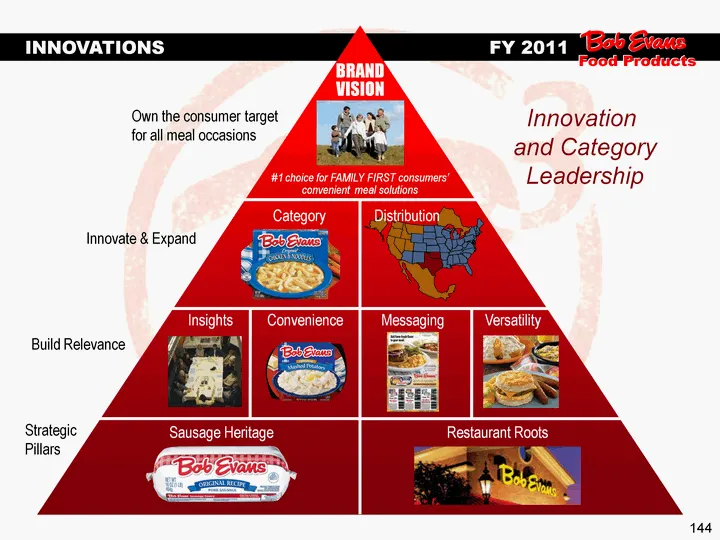
144 INNOVATIONS FY 2011 Insights Convenience Versatility Messaging Own the consumer target for all meal occasions Innovate & Expand Build Relevance Strategic Pillars Innovation and Category Leadership Category Sausage Heritage Restaurant Roots BRAND VISION Food Products #1 choice for FAMILY FIRST co
Slide 144: Food Products Strategic Framework
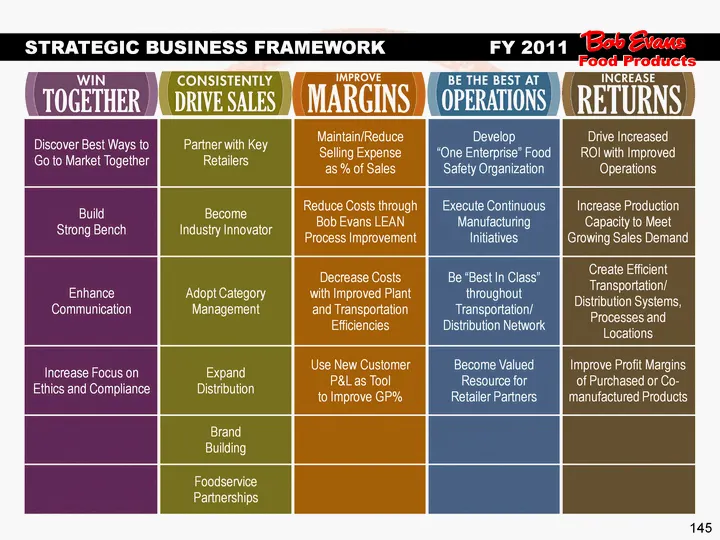
145 Discover Best Ways to Go to Market Together Partner with Key Retailers Maintain/Reduce Selling Expense as % of Sales Develop "One Enterprise" Food Safety Organization Drive Increased ROI with Improved Operations Build Strong Bench Become Industry Innovator Reduce Costs through Bob Evans LEAN Pro
Slide 145: Food Products Strategic Framework
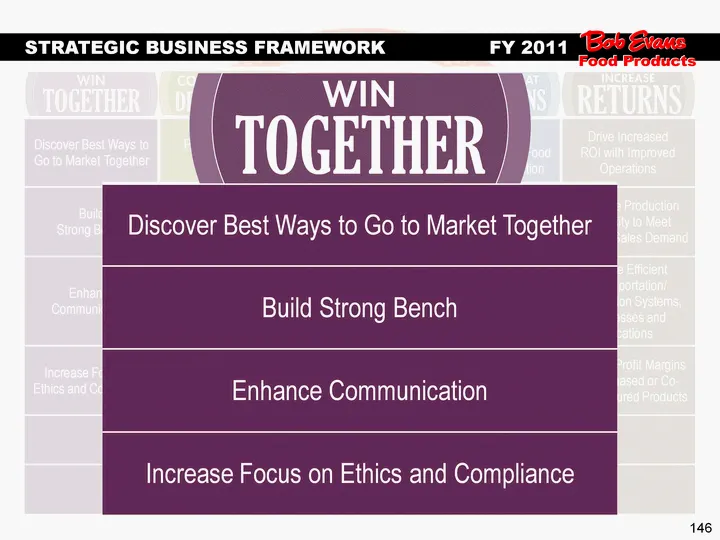
146 Discover Best Ways to Go to Market Together Partner with Key Retailers Maintain/Reduce Selling Expense as % of Sales Develop "One Enterprise" Food Safety Organization Drive Increased ROI with Improved Operations Build Strong Bench Become Industry Innovator Reduce Costs through Bob Evans LEAN Pro
Slide 146: Food Products Strategic Framework
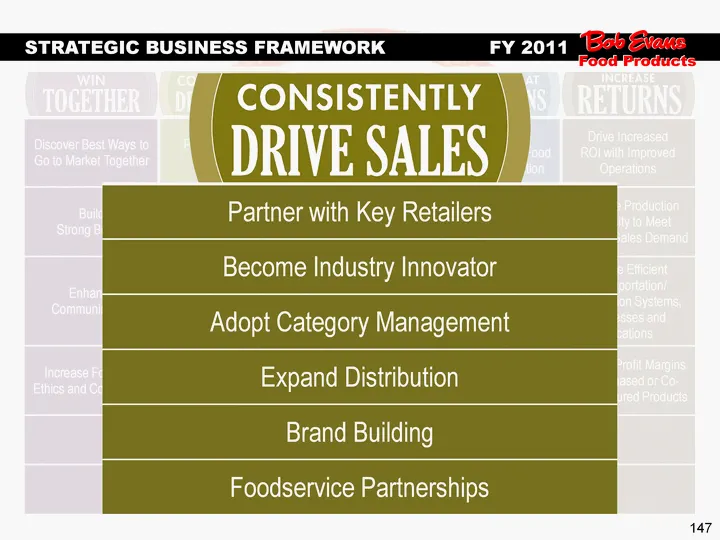
147 Discover Best Ways to Go to Market Together Partner with Key Retailers Maintain/Reduce Selling Expense as % of Sales Develop "One Enterprise" Food Safety Organization Drive Increased ROI with Improved Operations Build Strong Bench Become Industry Innovator Reduce Costs through Bob Evans LEAN Pro
Slide 147: Must Do Initiatives FY 2011
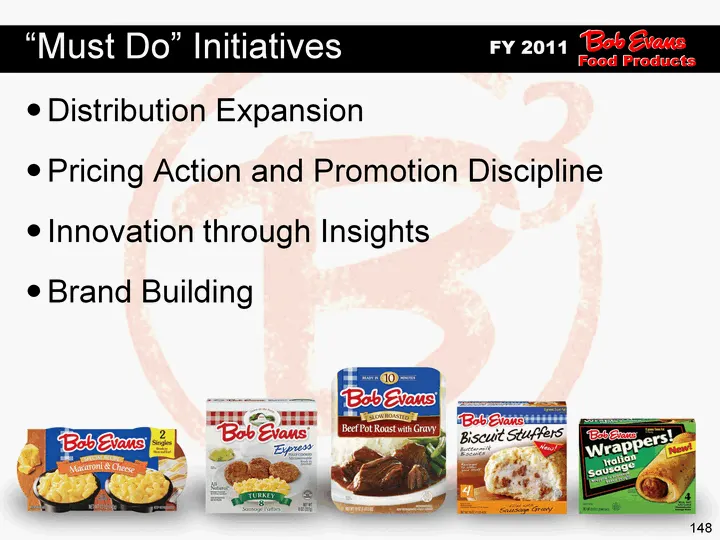
148 Distribution Expansion Pricing Action and Promotion Discipline Innovation through Insights Brand Building Food Products "Must Do" Initiatives FY 2011
Slide 148: Food Products Strategic Opportunities
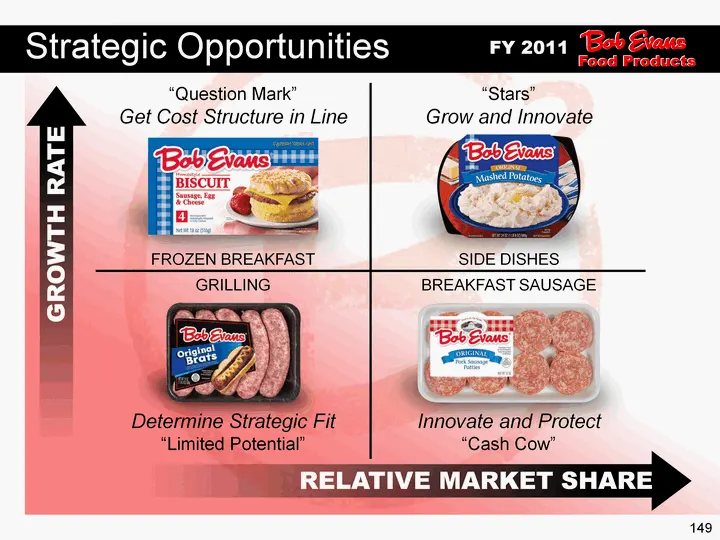
149 Food Products Strategic Opportunities FY 2011 RELATIVE MARKET SHARE GROWTH RATE FROZEN BREAKFAST SIDE DISHES GRILLING BREAKFAST SAUSAGE "Question Mark" Get Cost Structure in Line "Stars" Grow and Innovate Determine Strategic Fit "Limited Potential" Innovate and Protect "Cash Cow"
Slide 149: Total Sausage Market Growth Opportunities
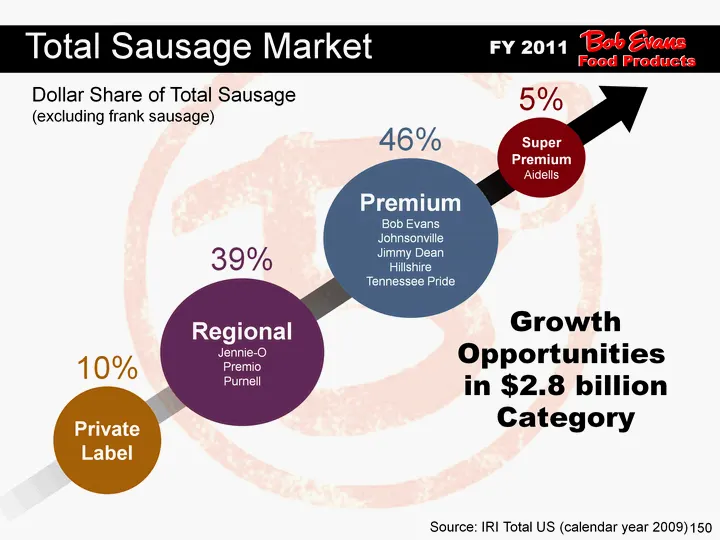
150 Food Products Total Sausage Market FY 2011 Growth Opportunities in $2.8 billion Category Dollar Share of Total Sausage (excluding frank sausage) Source: IRI Total US (calendar year 2009) Premium Bob Evans Johnsonville Jimmy Dean Hillshire Tennessee Pride Super Premium Aidells Regional Jennie-O P
Slide 150: Side Dish Category
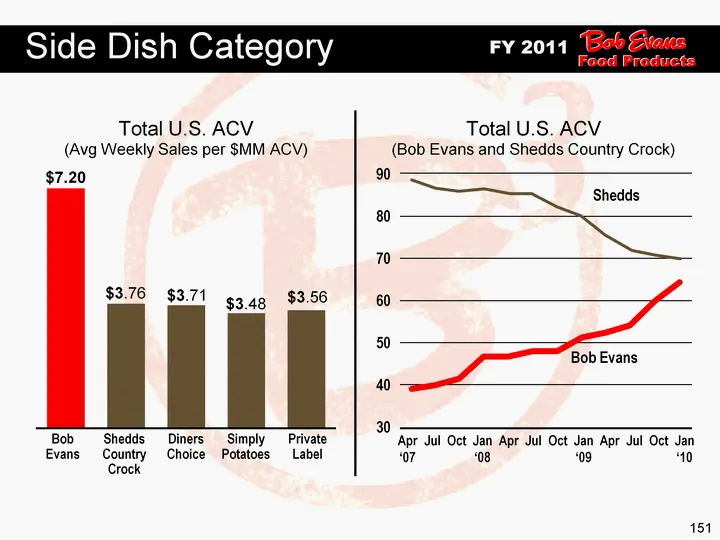
151 FY 2011 Food Products Side Dish Category Apr '07 Jul Oct Jan '08 Apr Jul Oct Jan '09 Apr Jul Oct Jan '10 Total U.S. ACV (Avg Weekly Sales per $MM ACV) Total U.S. ACV (Bob Evans and Shedds Country Crock) Bob Evans Shedds Country Crock Diners Choice Simply Potatoes Private Label $3.56 $3.48 $3.71
Slide 151: Top Refrigerated Items by Top Retailer
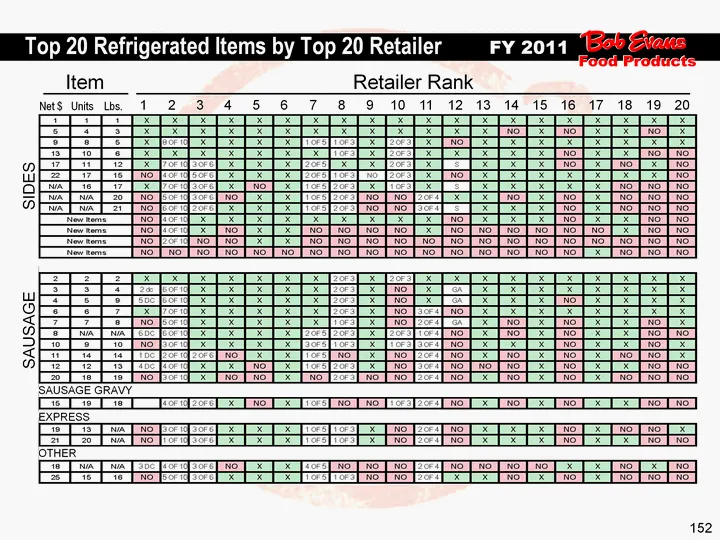
152 FY 2011 Food Products Top 20 Refrigerated Items by Top 20 Retailer Net $ Units Lbs. 1 2 3 4 5 6 7 8 9 10 11 12 13 14 15 16 17 18 19 20 SIDES SAUSAGE SAUSAGE GRAVY EXPRESS OTHER Retailer Rank Item
Slide 152: Food Products Strategic Framework
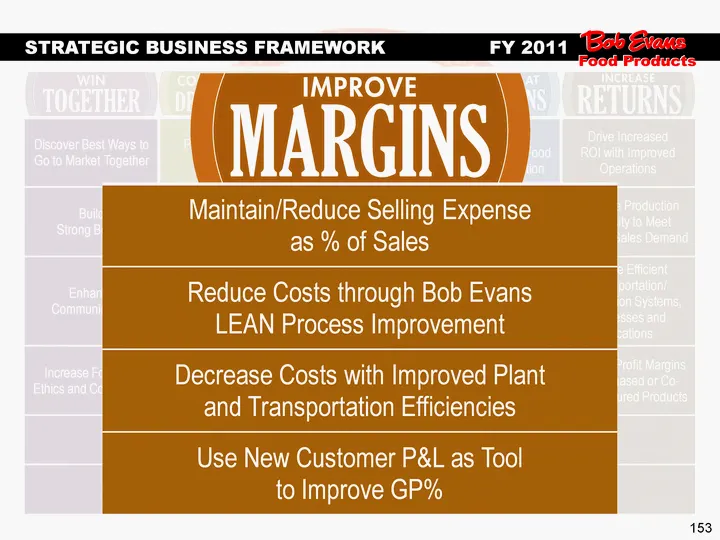
153 Discover Best Ways to Go to Market Together Partner with Key Retailers Maintain/Reduce Selling Expense as % of Sales Develop "One Enterprise" Food Safety Organization Drive Increased ROI with Improved Operations Build Strong Bench Become Industry Innovator Reduce Costs through Bob Evans LEAN Pro
Slide 153: Food Products Historical Performance
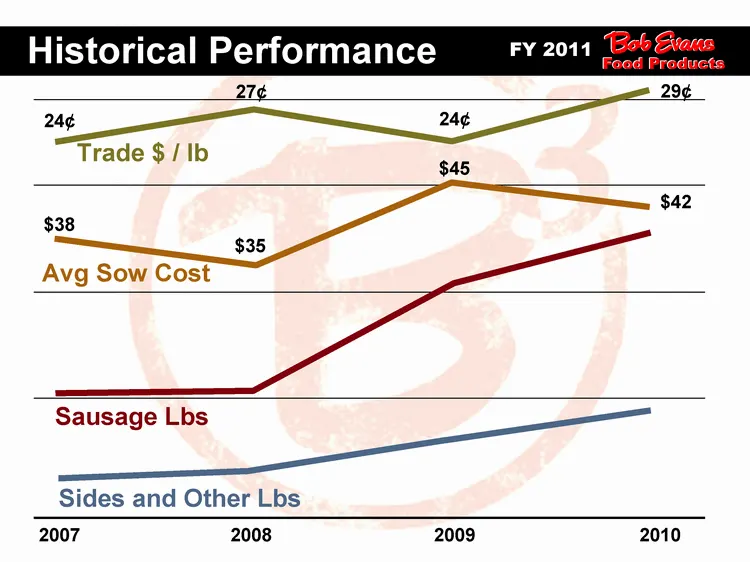
FY 2011 Food Products Food Products Historical Performance 2007 2008 2009 2010 Trade $ / lb Avg Sow Cost 24¢ 27¢ 24¢ 29¢ Sausage Lbs $38 $35 $45 $42 Sides and Other Lbs
Slide 154: Improving the Process: LEAN
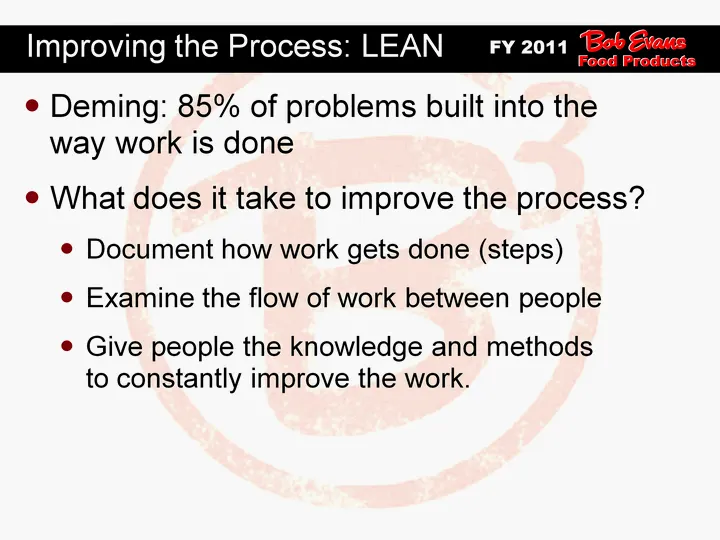
Deming: 85% of problems built into the way work is done What does it take to improve the process? Document how work gets done (steps) Examine the flow of work between people Give people the knowledge and methods to constantly improve the work. FY 2011 Food Products Improving the Process: LEAN
Slide 155: Food Products Strategic Framework
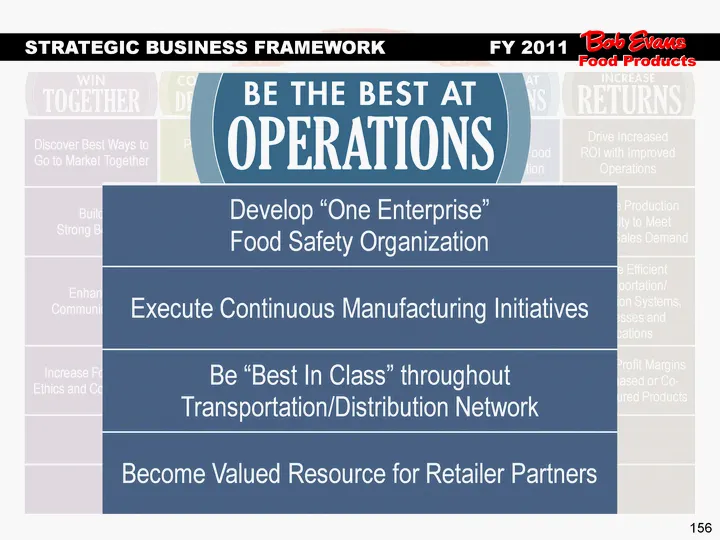
156 Discover Best Ways to Go to Market Together Partner with Key Retailers Maintain/Reduce Selling Expense as % of Sales Develop "One Enterprise" Food Safety Organization Drive Increased ROI with Improved Operations Build Strong Bench Become Industry Innovator Reduce Costs through Bob Evans LEAN Pro
Slide 156: Food Products Strategic Framework
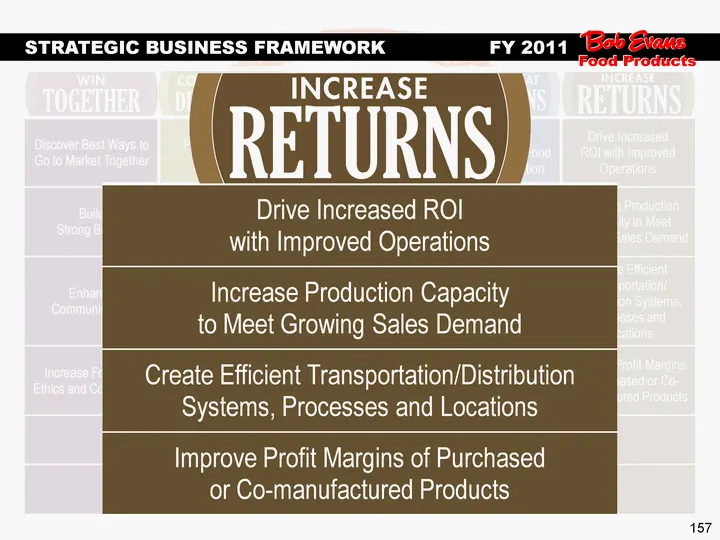
157 Discover Best Ways to Go to Market Together Partner with Key Retailers Maintain/Reduce Selling Expense as % of Sales Develop "One Enterprise" Food Safety Organization Drive Increased ROI with Improved Operations Build Strong Bench Become Industry Innovator Reduce Costs through Bob Evans LEAN Pro
Slide 157: Food Products Key Takeaways
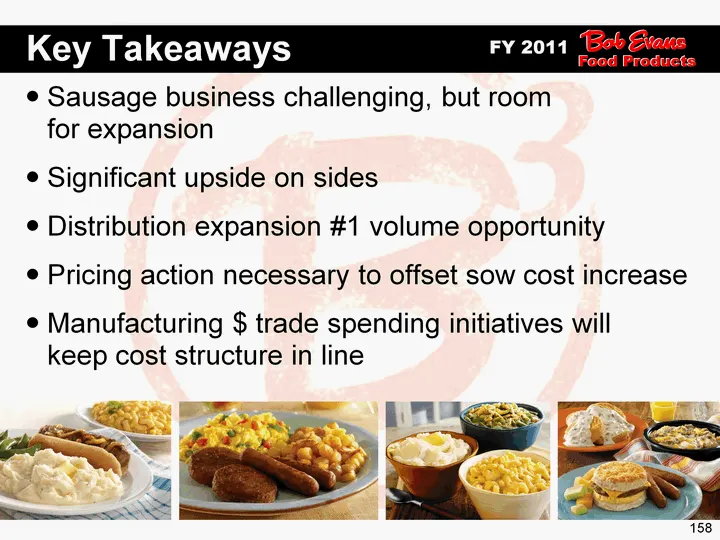
158 Sausage business challenging, but room for expansion Significant upside on sides Distribution expansion #1 volume opportunity Pricing action necessary to offset sow cost increase Manufacturing $ trade spending initiatives will keep cost structure in line FY 2011 Food Products Key Takeaways
Slide 158: FY 2011 Outlook
FY 2011 Outlook Bob Evaus FARMS® GE We Of, wll
Slide 159: FY 2011 Outlook: Operating Income
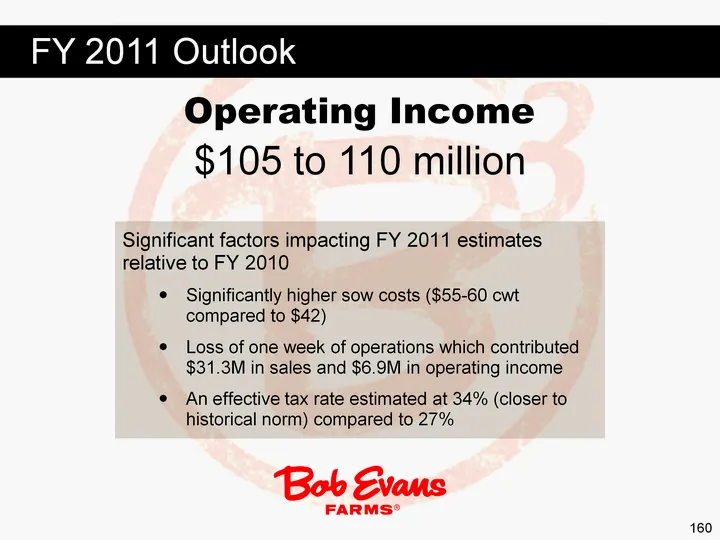
160 $105 to 110 million Operating Income Significant factors impacting FY 2011 estimates relative to FY 2010 Significantly higher sow costs ($55-60 cwt compared to $42) Loss of one week of operations which contributed $31.3M in sales and $6.9M in operating income An effective tax rate estimated at 3
Slide 160: FY 2011 Outlook: Annual Sales
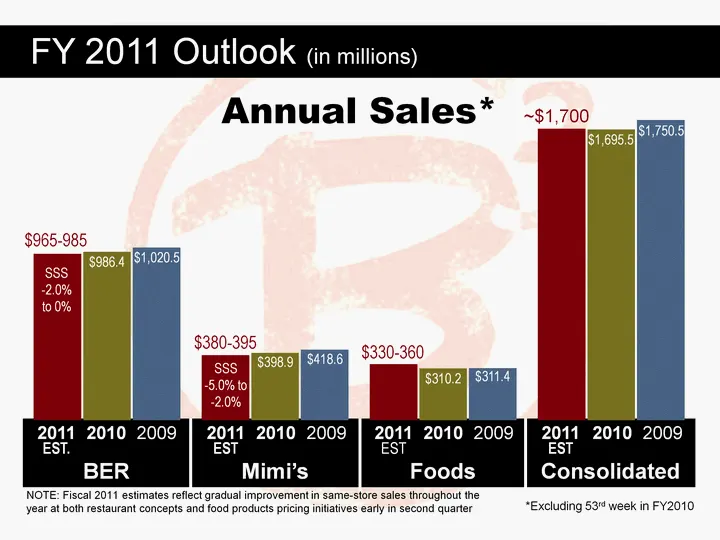
Annual Sales* BER Mimi's Foods Consolidated (CHART) 2011 EST. *Excluding 53rd week in FY2010 2010 2009 2010 2009 2010 2009 2010 2009 NOTE: Fiscal 2011 estimates reflect gradual improvement in same-store sales throughout the year at both restaurant concepts and food products pricing initiatives early
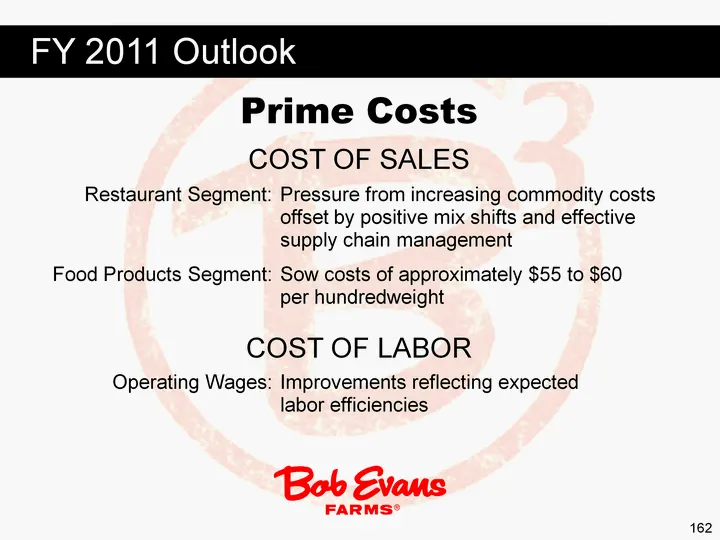
Slide 161: FY 2011 Outlook: Prime Costs
162 COST OF SALES Sow costs of approximately $55 to $60 per hundredweight Food Products Segment: Pressure from increasing commodity costs offset by positive mix shifts and effective supply chain management Restaurant Segment: Operating Wages: Improvements reflecting expected labor efficiencies COST
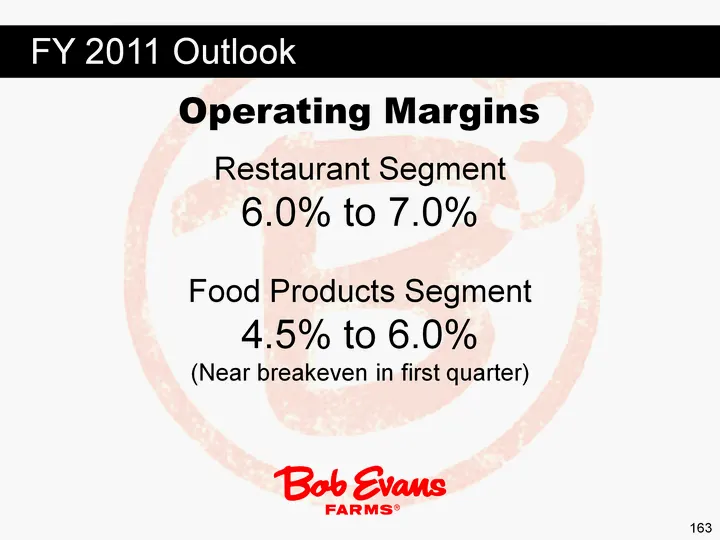
Slide 162: FY 2011 Outlook: Operating Margins
163 Restaurant Segment 6.0% to 7.0% Food Products Segment 4.5% to 6.0% (Near breakeven in first quarter) FY 2011 Outlook Operating Margins
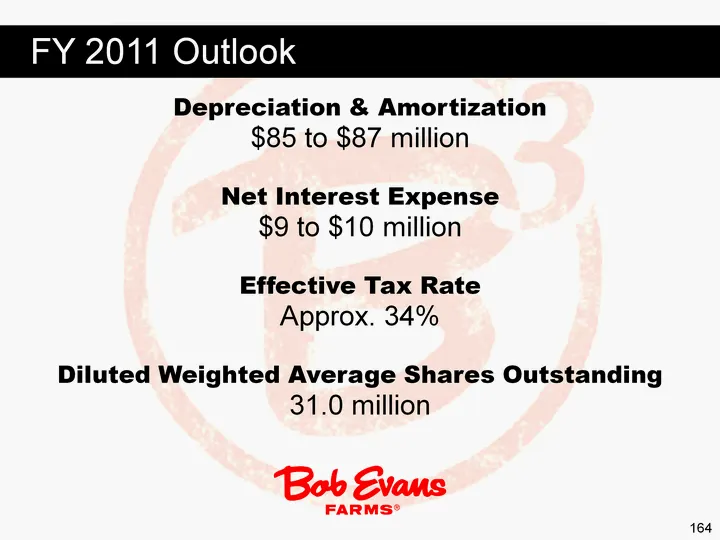
Slide 163: FY 2011 Outlook: D&A, Interest, Tax, Shares
164 Depreciation & Amortization $85 to $87 million Net Interest Expense $9 to $10 million Effective Tax Rate Approx. 34% Diluted Weighted Average Shares Outstanding 31.0 million FY 2011 Outlook
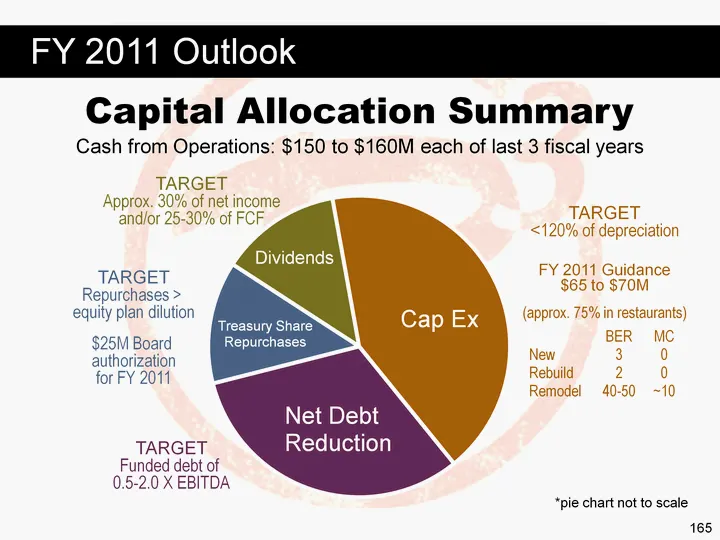
Slide 164: FY 2011 Outlook: Capital Allocation Summary
(CHART) 165 Net Debt Reduction Cap Ex Dividends Cash from Operations: $150 to $160M each of last 3 fiscal years TARGET <120% of depreciation Treasury Share Repurchases *pie chart not to scale FY 2011 Guidance $65 to $70M (approx. 75% in restaurants) BER MC New 3 0 Rebuild 2 0 Remodel 40-50 ~10 TARGE
Slide 165: Thank you!
166 Thank you!
Source: SEC EDGAR · 8-K filed Jun 9, 2010
More decks from Bob Evans Farms Inc
 Merger or Acquisition (September 2017)18 slides · Sep 28, 2017
 Merger or Acquisition (September 2017)12 slides · Sep 19, 2017
 Merger or Acquisition (September 2017)17 slides · Sep 19, 2017
 Merger or Acquisition (September 2017)10 slides · Sep 19, 2017
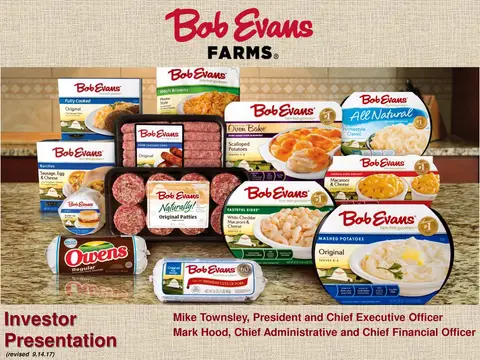 Investor Presentation (September 2017)32 slides · Sep 14, 2017
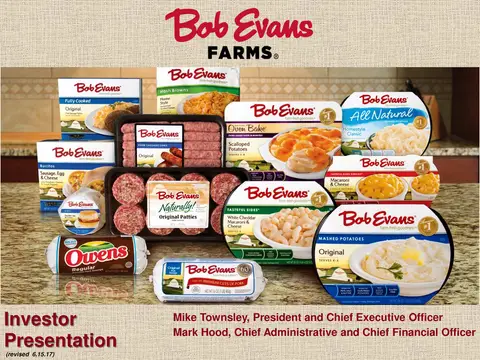 Investor Presentation (June 2017)30 slides · Jun 15, 2017