Metaldyne Performance Group Inc
Metaldyne Performance — Debt Investor Presentation (February 2017)
55 slides from Metaldyne Performance's debt investor presentation, Feb 23, 2017
Slide 1: American Axle & Manufacturing Holdings, Inc. Lender Presentation
AMERICAN AXLE & MANUFACTURING HOLDINGS, INC. LENDER PRESENTATION FEBRUARY 23, 2017
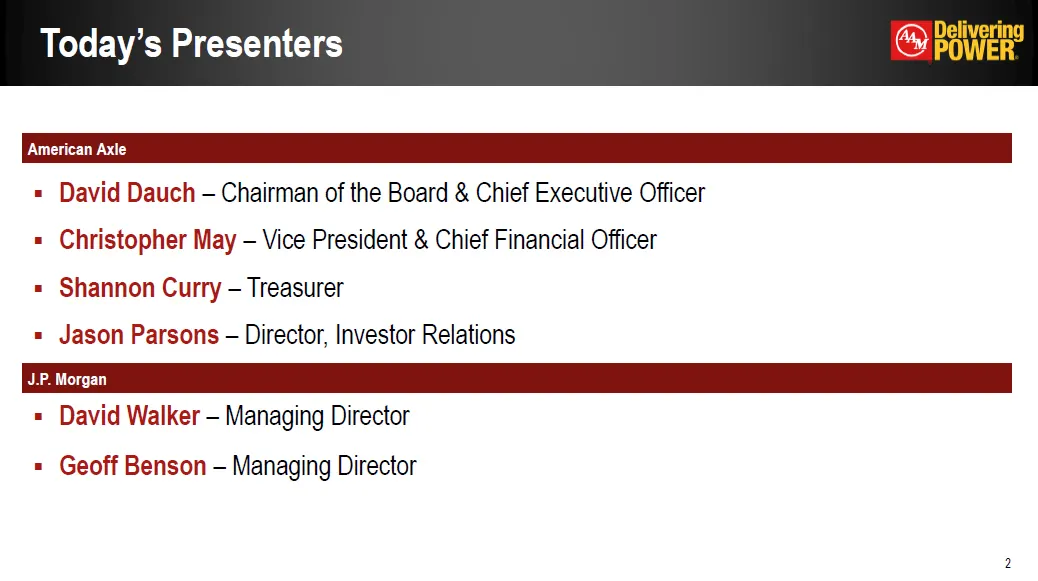
Slide 2: Today's Presenters
Today’s Presenters * David Dauch – Chairman of the Board & Chief Executive OfficerChristopher May – Vice President & Chief Financial OfficerShannon Curry – TreasurerJason Parsons – Director, Investor Relations American Axle J.P. Morgan David Walker – Managing DirectorGeoff Benson – Managing Director
Slide 3: Agenda
2016 AAM Highlights2017 AAM TargetsAAM’s 2017 – 2019 New Business BacklogTechnology LeadershipAcquisition of MPGTransaction OverviewQuestions Agenda *
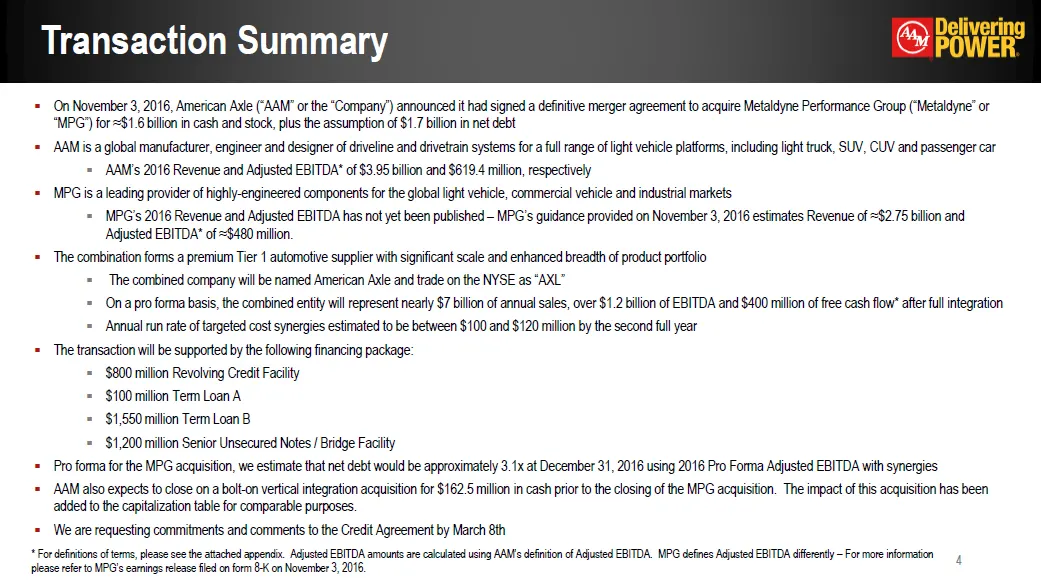
Slide 4: Transaction Summary
Transaction Summary * On November 3, 2016, American Axle (“AAM” or the “Company”) announced it had signed a definitive merger agreement to acquire Metaldyne Performance Group (“Metaldyne” or “MPG”) for ≈$1.6 billion in cash and stock, plus the assumption of $1.7 billion in net debtAAM is a global ma
Slide 5: AAM Highlights and Targets
Opie AAM HIGHLIGHTS AND TARGETS
Slide 6: Forward-Looking Statements
Some of the information presented in this document and discussions that follow, including, without limitation, statements with respect to the proposed acquisition of Metaldyne Performance Group, Inc (“MPG”) and the anticipated consequences and benefits of the acquisition, the targeted close date for
Slide 7: Important Information for Stockholders and Investors
Important Information for Stockholders and Investors This presentation is provided for informational purposes only and is neither an offer to purchase nor a solicitation of an offer to sell shares of AAM or MPG. In connection with the proposed acquisition of MPG, AAM has filed with the SEC a Registr
Slide 8: 2016 AAM Highlights
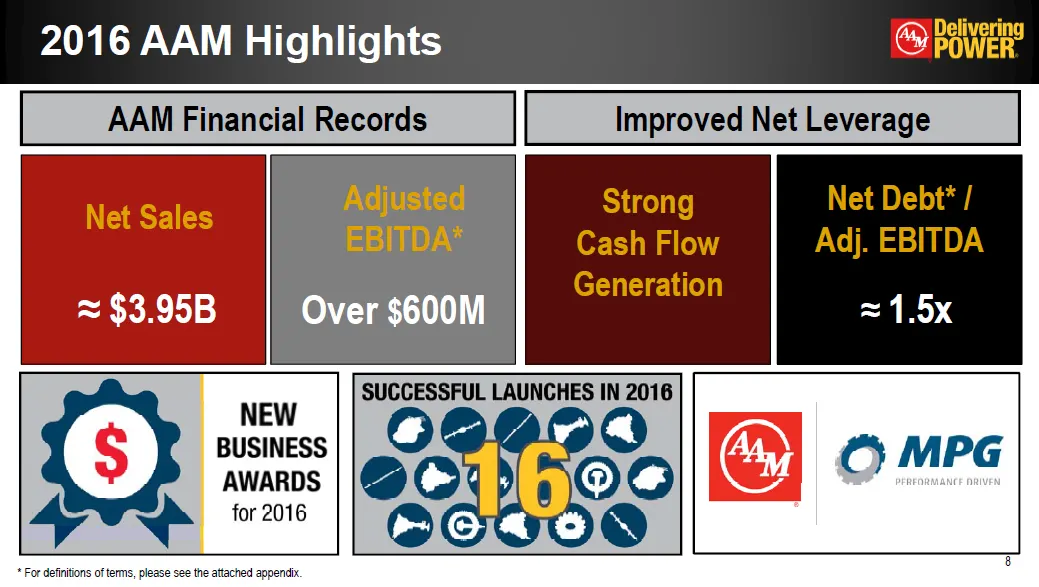
2016 AAM Highlights Net Debt* / Adj. EBITDA≈ 1.5x AAM Financial Records Improved Net Leverage Net Sales Adjusted EBITDA* Strong Cash Flow Generation Net Debt* / Adj. EBITDA ≈ $3.95B Over $600M ≈ 1.5x * For definitions of terms, please see the attached appendix. *
Slide 9: 2016 AAM Financial Performance
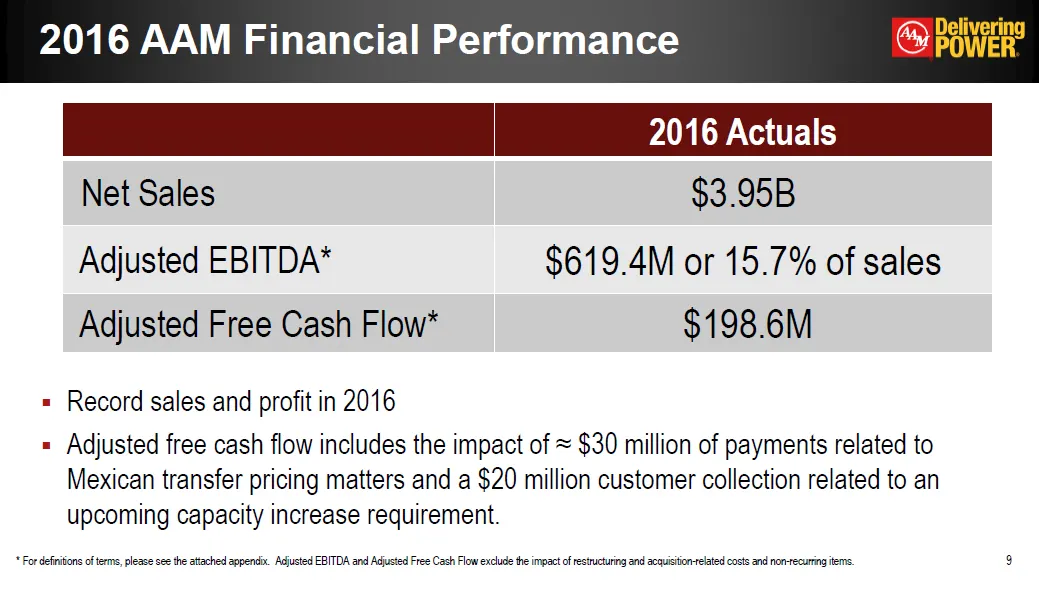
* 2016 Actuals Net Sales $3.95B Adjusted EBITDA* $619.4M or 15.7% of sales Adjusted Free Cash Flow* $198.6M 2016 AAM Financial Performance * For definitions of terms, please see the attached appendix. Adjusted EBITDA and Adjusted Free Cash Flow exclude the impact of restructuring and acquisition-rel
Slide 10: Sales Growth and Operational Performance
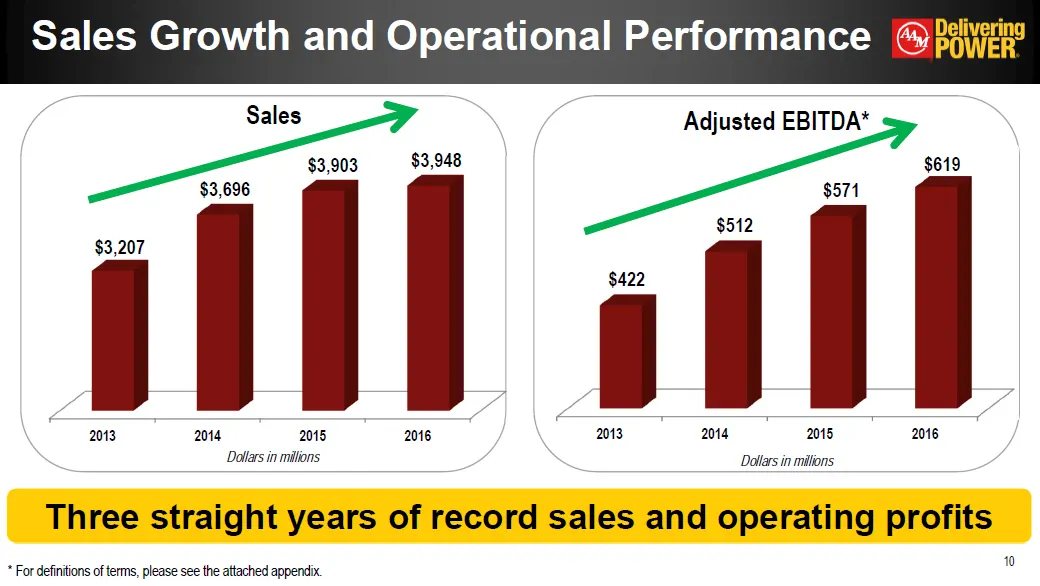
* Sales Growth and Operational Performance Three straight years of record sales and operating profits Dollars in millions $123.1 $189.5 Dollars in millions * For definitions of terms, please see the attached appendix.
Slide 11: Free Cash Flow & Leverage
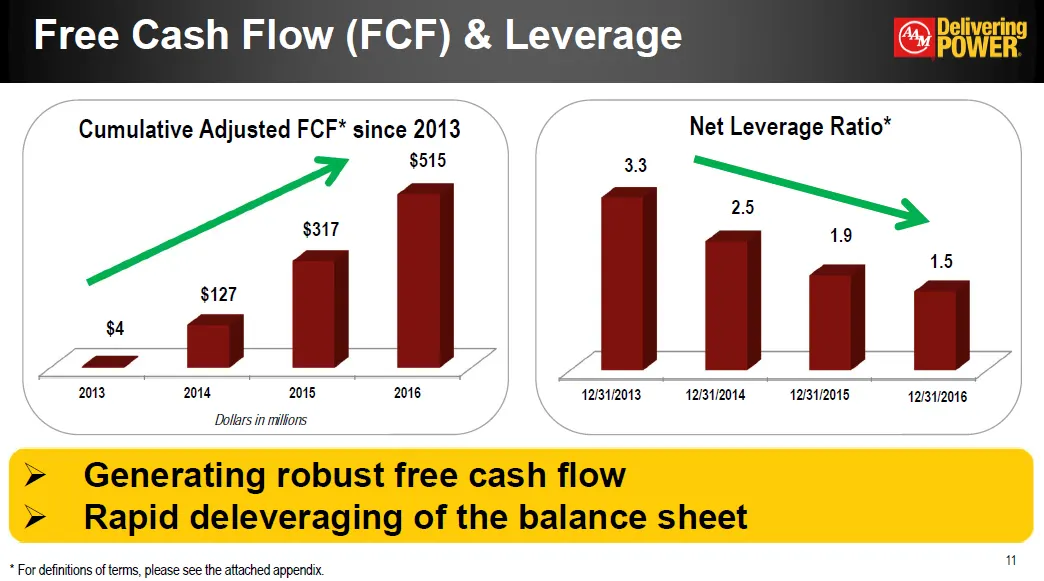
* Free Cash Flow (FCF) & Leverage Generating robust free cash flow Rapid deleveraging of the balance sheet Dollars in millions $123.1 $189.5 * For definitions of terms, please see the attached appendix.
Slide 12: Debt Maturities & Liquidity
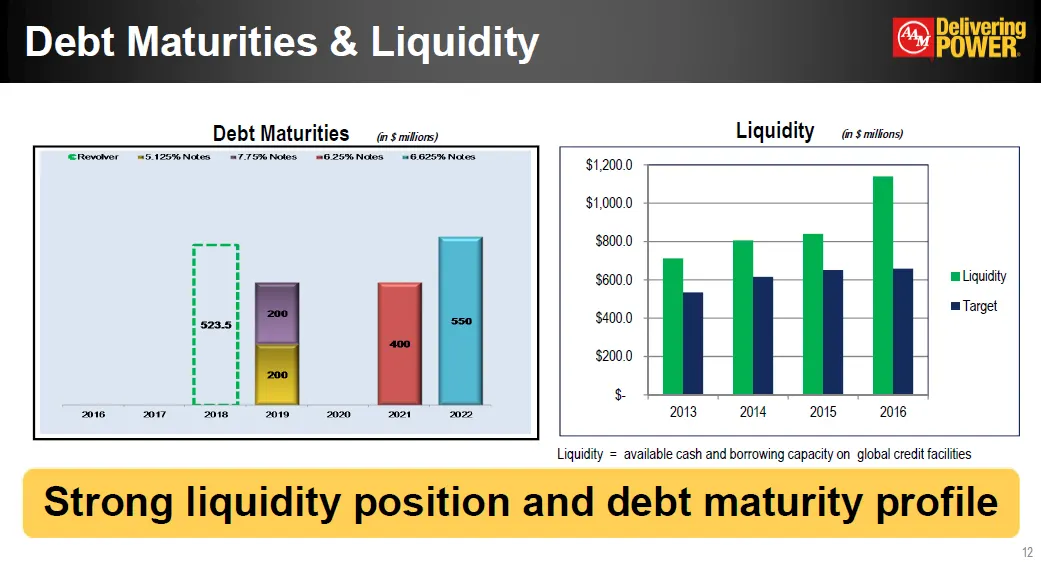
Debt Maturities & Liquidity * Strong liquidity position and debt maturity profile Liquidity (in $ millions) Debt Maturities (in $ millions) Liquidity = available cash and borrowing capacity on global credit facilities
Slide 13: 2017 AAM Financial Targets
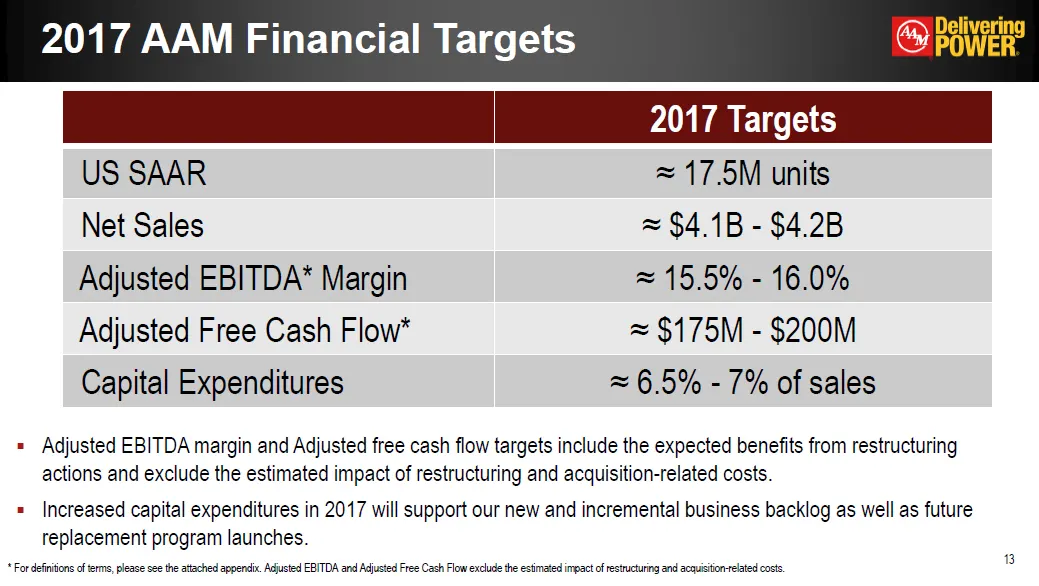
2017 AAM Financial Targets * 2017 Targets US SAAR ≈ 17.5M units Net Sales ≈ $4.1B - $4.2B Adjusted EBITDA* Margin ≈ 15.5% - 16.0% Adjusted Free Cash Flow* ≈ $175M - $200M Capital Expenditures ≈ 6.5% - 7% of sales Adjusted EBITDA margin and Adjusted free cash flow targets include the expected benefit
Slide 14: AAM's New and Incremental Business Backlog
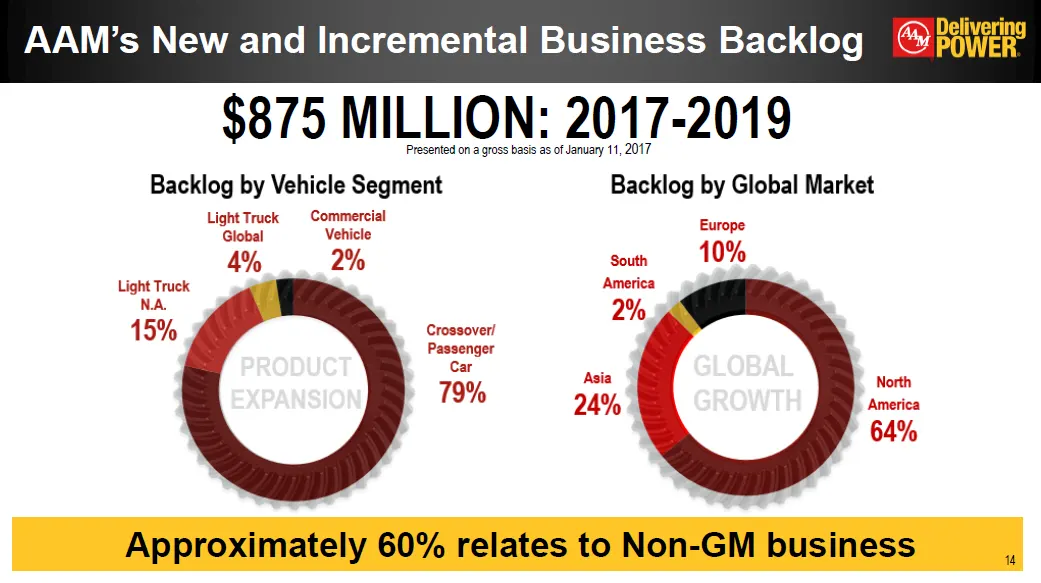
AAM’s New and Incremental Business Backlog $875 MILLION: 2017-2019 Presented on a gross basis as of January 11, 2017 Approximately 60% relates to Non-GM business *
Slide 15: Backlog and Impact of GM's Sourcing Decision
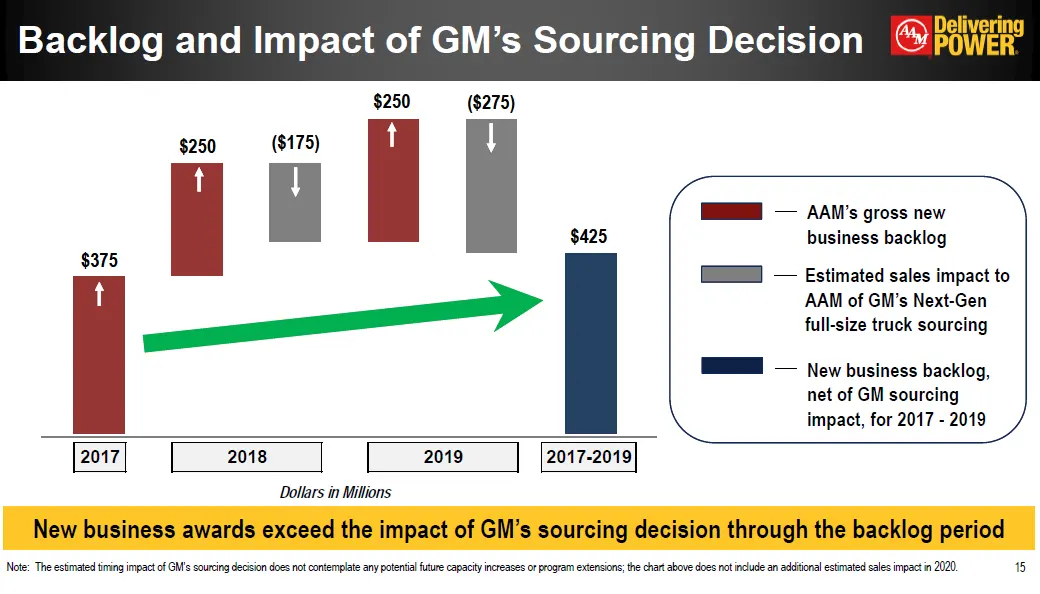
Backlog and Impact of GM’s Sourcing Decision * New business awards exceed the impact of GM’s sourcing decision through the backlog period AAM’s gross new business backlog Estimated sales impact to AAM of GM’s Next-Gen full-size truck sourcing New business backlog, net of GM sourcing impact, for 2017
Slide 16: US SAAR and NA Production Assumptions
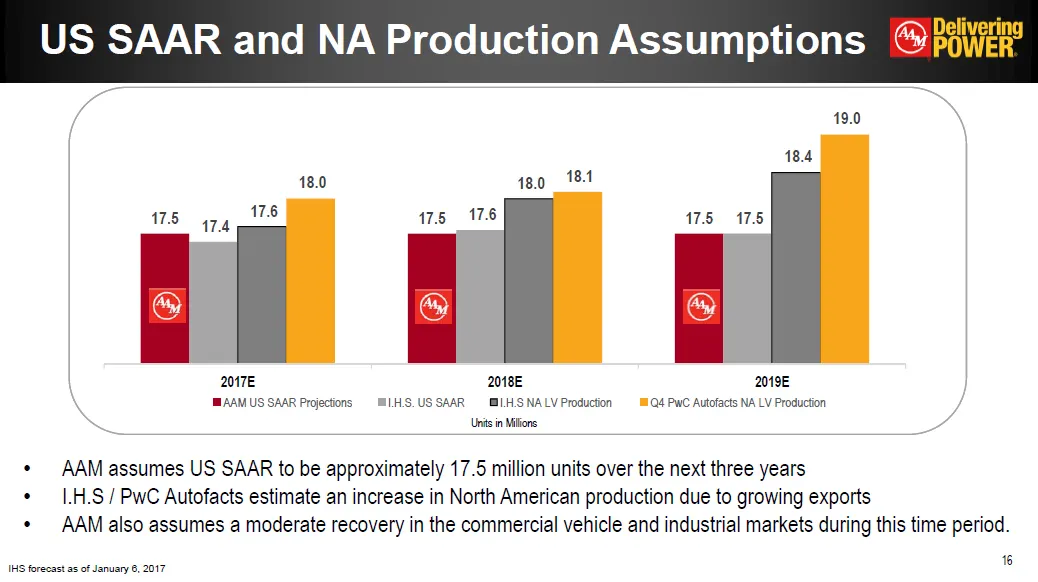
US SAAR and NA Production Assumptions * AAM assumes US SAAR to be approximately 17.5 million units over the next three yearsI.H.S / PwC Autofacts estimate an increase in North American production due to growing exportsAAM also assumes a moderate recovery in the commercial vehicle and industrial mark
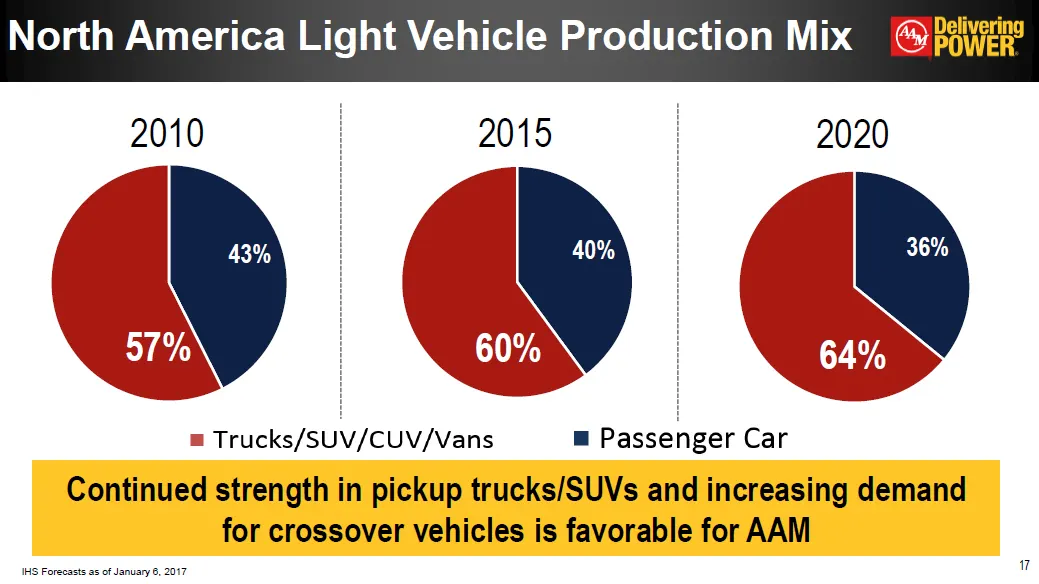
Slide 17: North America Light Vehicle Production Mix
* 2010 2015 2020 North America Light Vehicle Production Mix Continued strength in pickup trucks/SUVs and increasing demand for crossover vehicles is favorable for AAM IHS Forecasts as of January 6, 2017
Slide 18: Technology Leadership
TECHNOLOGY LEADERSHIP *
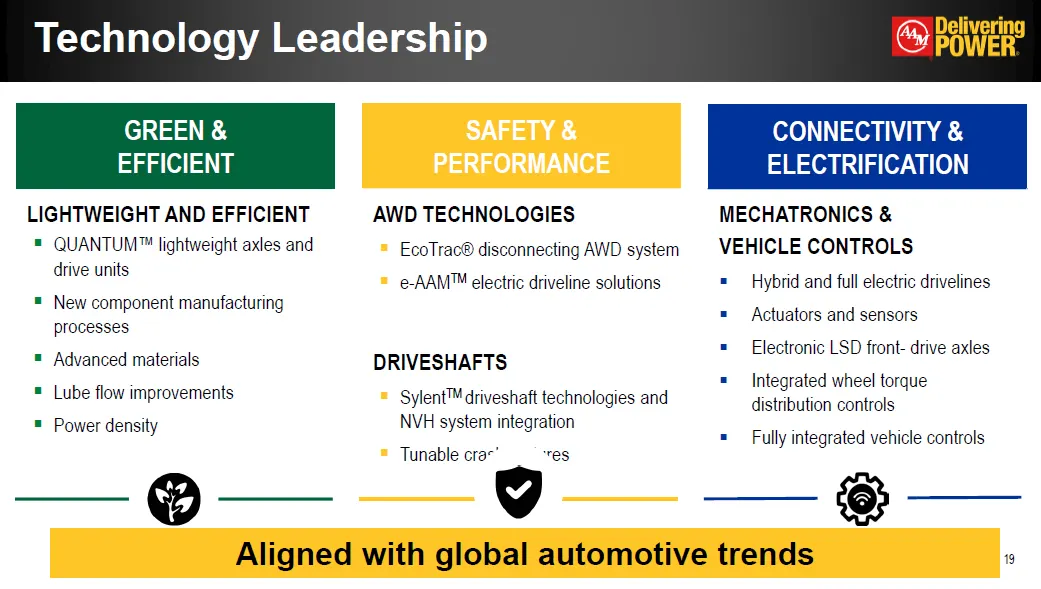
Slide 19: Technology Leadership
* Technology Leadership LIGHTWEIGHT AND EFFICIENTQUANTUM™ lightweight axles and drive unitsNew component manufacturing processesAdvanced materialsLube flow improvementsPower density GREEN & EFFICIENT SAFETY & PERFORMANCE CONNECTIVITY & ELECTRIFICATION MECHATRONICS & VEHICLE CONTROLSHybrid and full e
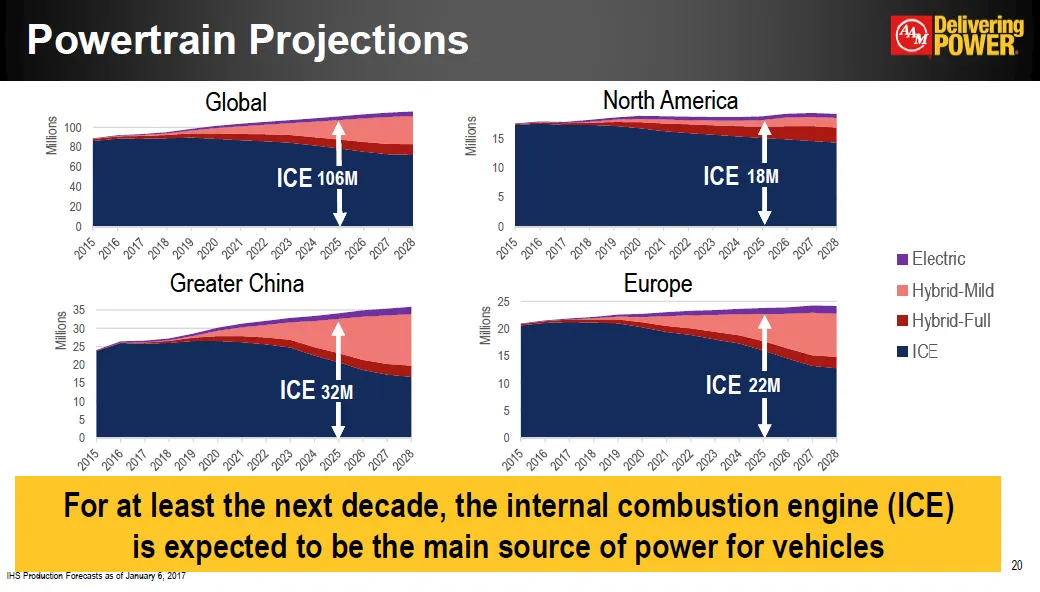
Slide 20: Powertrain Projections
Powertrain Projections * Global North America For at least the next decade, the internal combustion engine (ICE) is expected to be the main source of power for vehicles Greater China Europe 106M 18M 32M 22M ICE ICE ICE ICE IHS Production Forecasts as of January 6, 2017
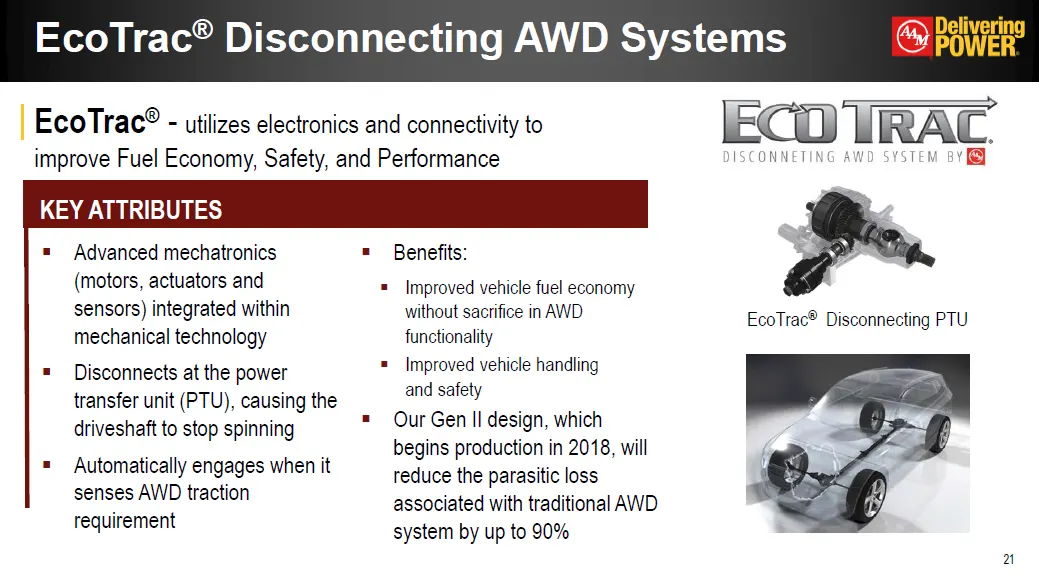
Slide 21: EcoTrac Disconnecting AWD Systems
* EcoTrac® Disconnecting AWD Systems EcoTrac® Disconnecting PTU KEY ATTRIBUTES EcoTrac® - utilizes electronics and connectivity to improve Fuel Economy, Safety, and Performance
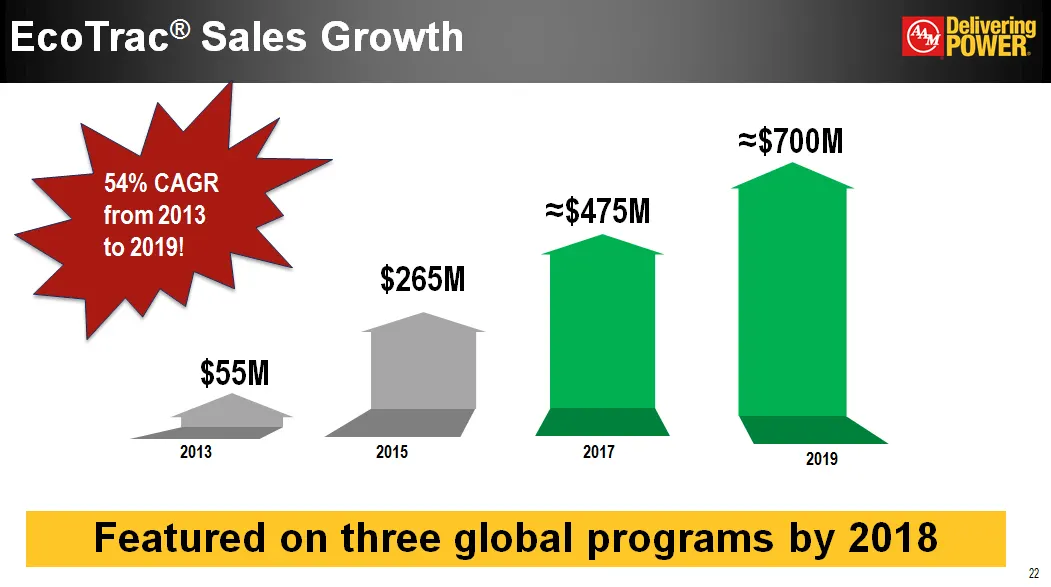
Slide 22: EcoTrac Sales Growth
* EcoTrac® Sales Growth $55M ≈$700M 54% CAGR from 2013 to 2019! Featured on three global programs by 2018 $265M ≈$475M
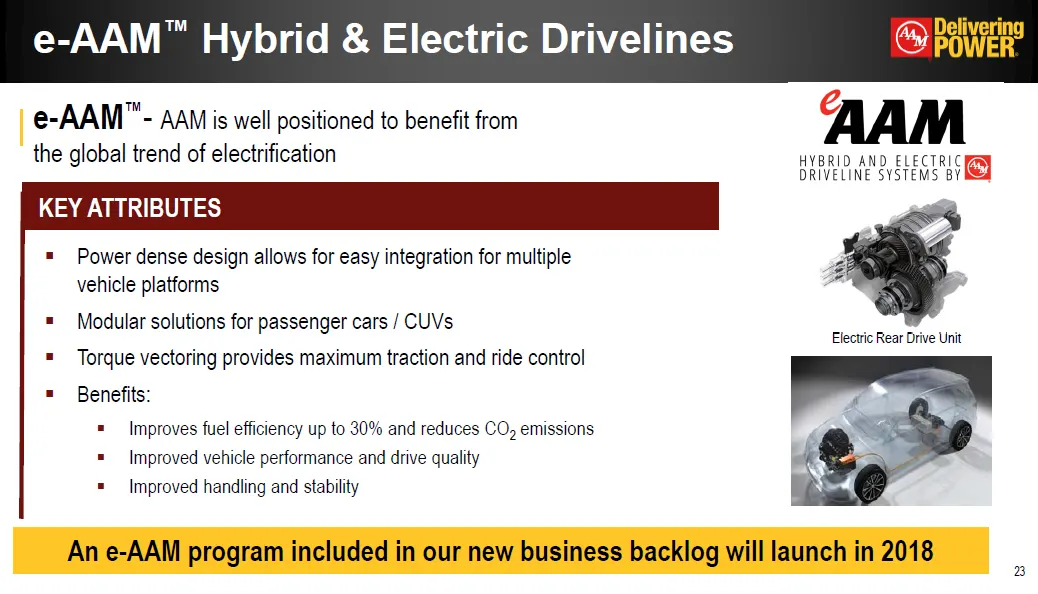
Slide 23: e-AAM Hybrid & Electric Drivelines
* e-AAM™ Hybrid & Electric Drivelines Power dense design allows for easy integration for multiple vehicle platformsModular solutions for passenger cars / CUVsTorque vectoring provides maximum traction and ride control Benefits:Improves fuel efficiency up to 30% and reduces CO2 emissionsImproved vehi
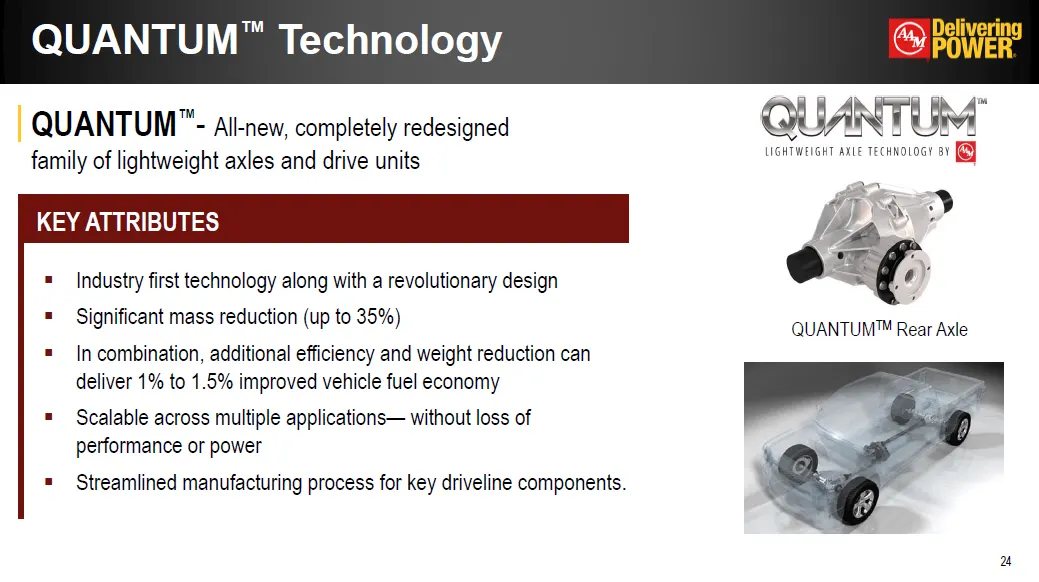
Slide 24: QUANTUM Technology
* QUANTUM™ Technology Industry first technology along with a revolutionary designSignificant mass reduction (up to 35%)In combination, additional efficiency and weight reduction can deliver 1% to 1.5% improved vehicle fuel economyScalable across multiple applications— without loss of performance or
Slide 25: AAM's Acquisition of MPG (Metaldyne Performance Group)
AAM’S ACQUISITION OF MPG (METALDYNE PERFORMANCE GROUP) Increased Global Scale │ Expanded Product Portfolio │ Accelerated Diversification │ Enhanced Cash Flow Generation
Slide 26: Compelling Strategic Acquisition
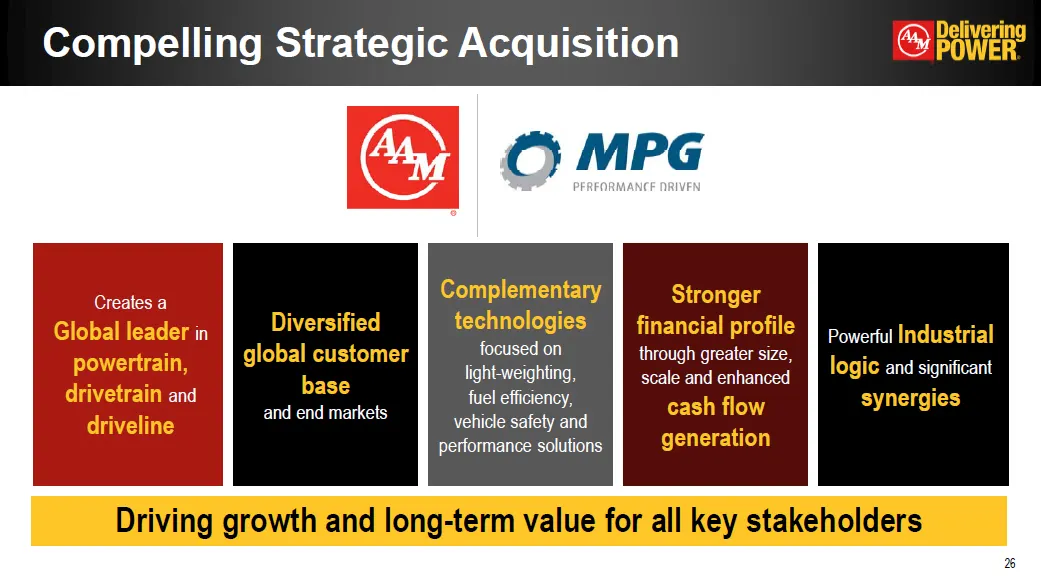
Driving growth and long-term value for all key stakeholders Creates a Global leader in powertrain, drivetrain and driveline Diversified global customer base and end markets Complementary technologies focused on light-weighting, fuel efficiency, vehicle safety and performance solutions Stronger finan
Slide 27: Transaction Details
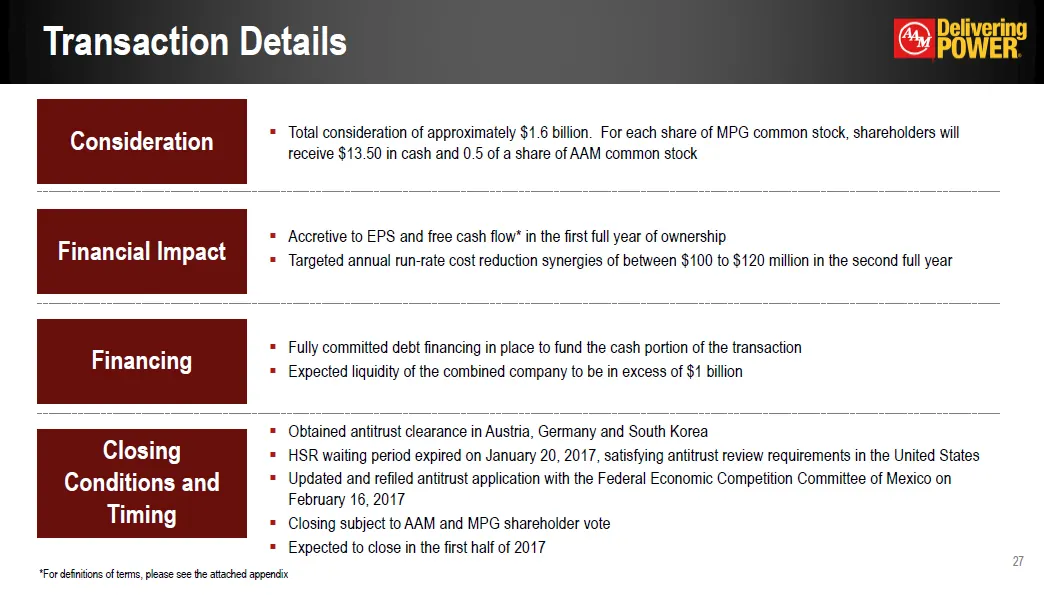
Transaction Details * Consideration Total consideration of approximately $1.6 billion. For each share of MPG common stock, shareholders will receive $13.50 in cash and 0.5 of a share of AAM common stock Financial Impact Accretive to EPS and free cash flow* in the first full year of ownershipTargeted
Slide 28: MPG's Value Proposition
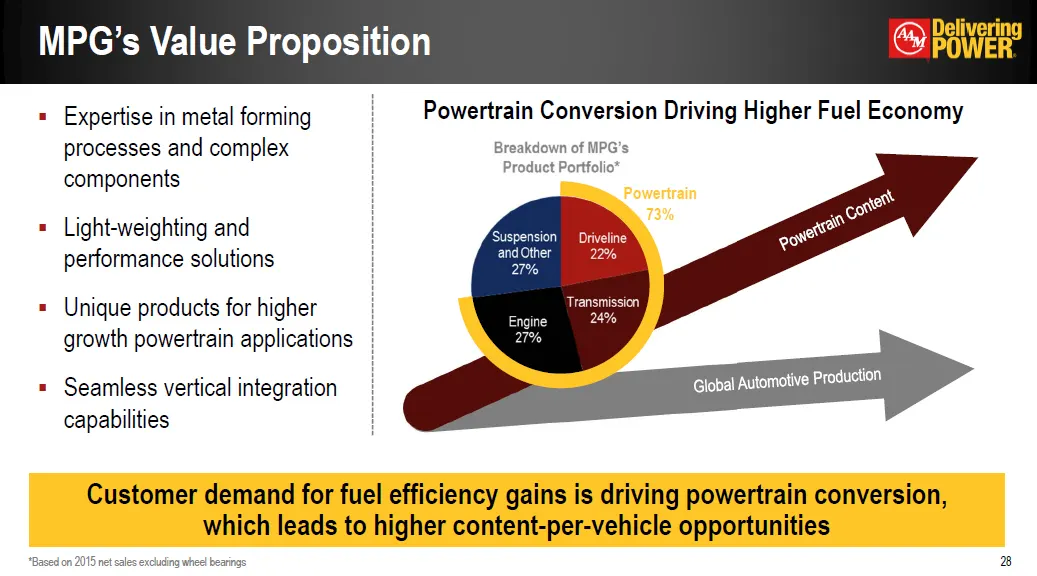
Expertise in metal forming processes and complex componentsLight-weighting and performance solutionsUnique products for higher growth powertrain applicationsSeamless vertical integration capabilities MPG’s Value Proposition * Powertrain73% Powertrain Content Global Automotive Production Powertrain C
Slide 29: Significantly Enhanced Scale and Profitability
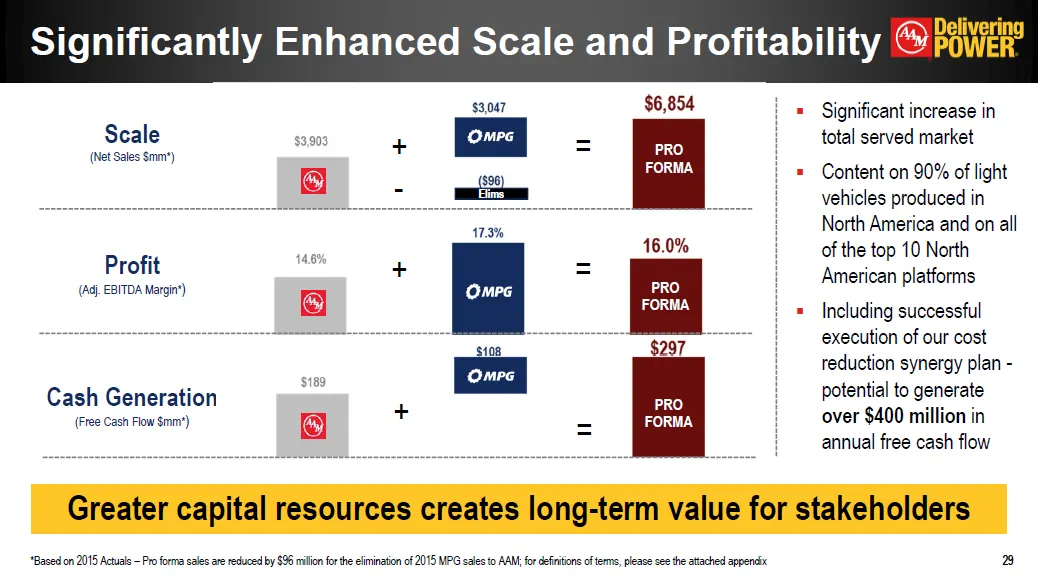
Significantly Enhanced Scale and Profitability * Scale(Net Sales $mm*) Profit(Adj. EBITDA Margin*) Cash Generation(Free Cash Flow $mm*) Significant increase in total served marketContent on 90% of light vehicles produced in North America and on all of the top 10 North American platformsIncluding suc
Slide 30: Combined Company Business Units
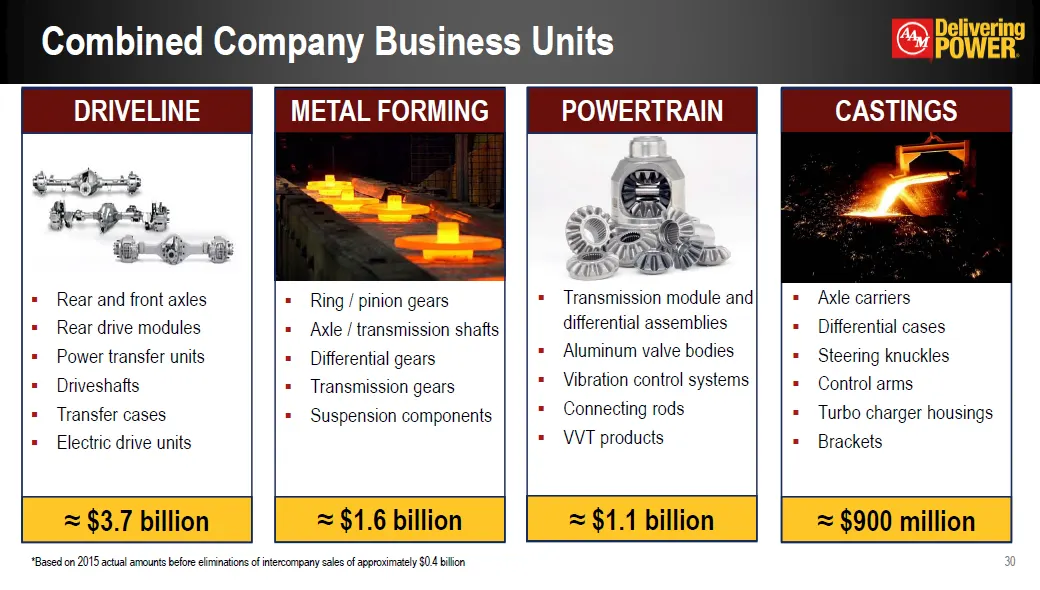
Combined Company Business Units * Rear and front axlesRear drive modulesPower transfer unitsDriveshaftsTransfer casesElectric drive units ≈ $3.7 billion DRIVELINE Ring / pinion gearsAxle / transmission shaftsDifferential gearsTransmission gearsSuspension components ≈ $1.6 billion METAL FORMING Trans
Slide 31: Comprehensive Solutions from Engine to Driveline
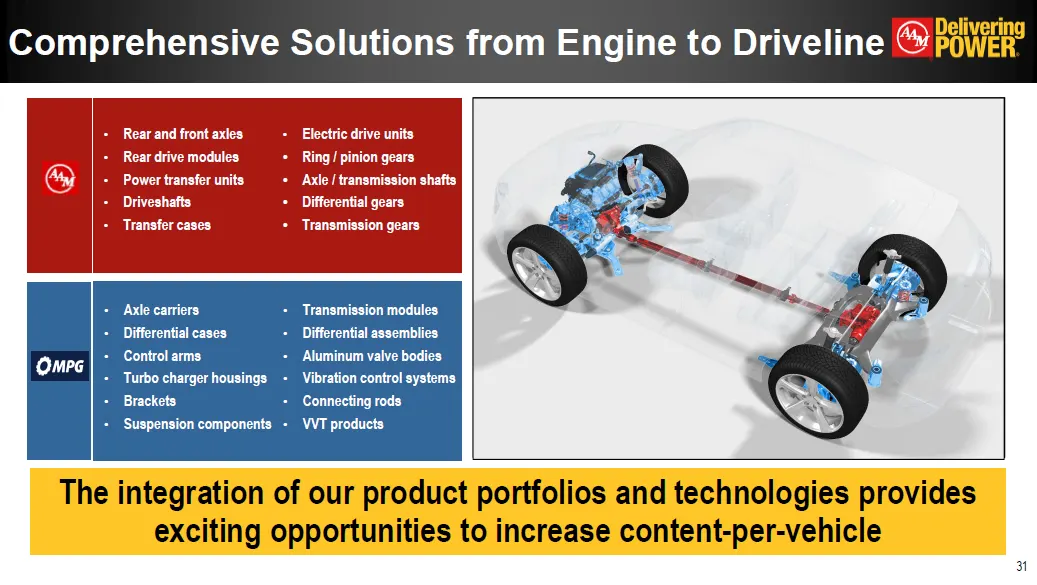
Comprehensive Solutions from Engine to Driveline * The integration of our product portfolios and technologies provides exciting opportunities to increase content-per-vehicle
Slide 32: Expanded Product Portfolio
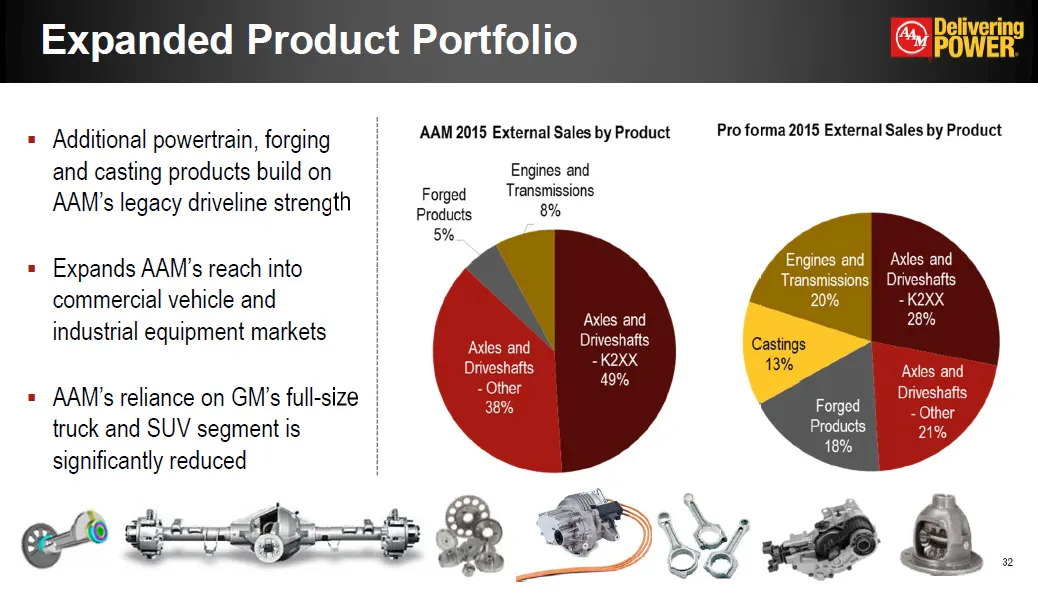
Additional powertrain, forging and casting products build on AAM’s legacy driveline strengthExpands AAM’s reach into commercial vehicle and industrial equipment marketsAAM’s reliance on GM’s full-size truck and SUV segment is significantly reduced Expanded Product Portfolio *
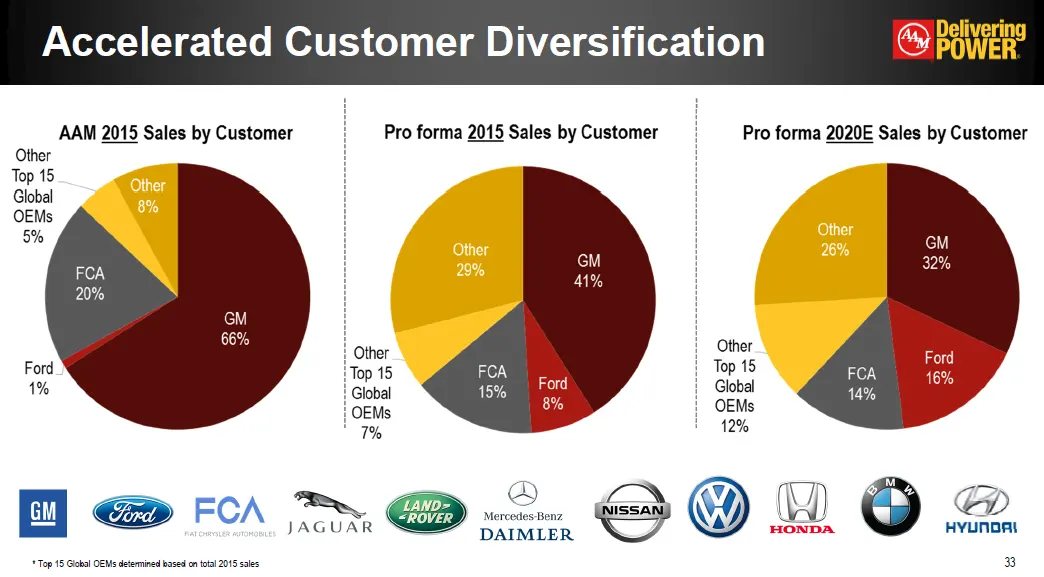
Slide 33: Accelerated Customer Diversification
Accelerated Customer Diversification * * Top 15 Global OEMs determined based on total 2015 sales
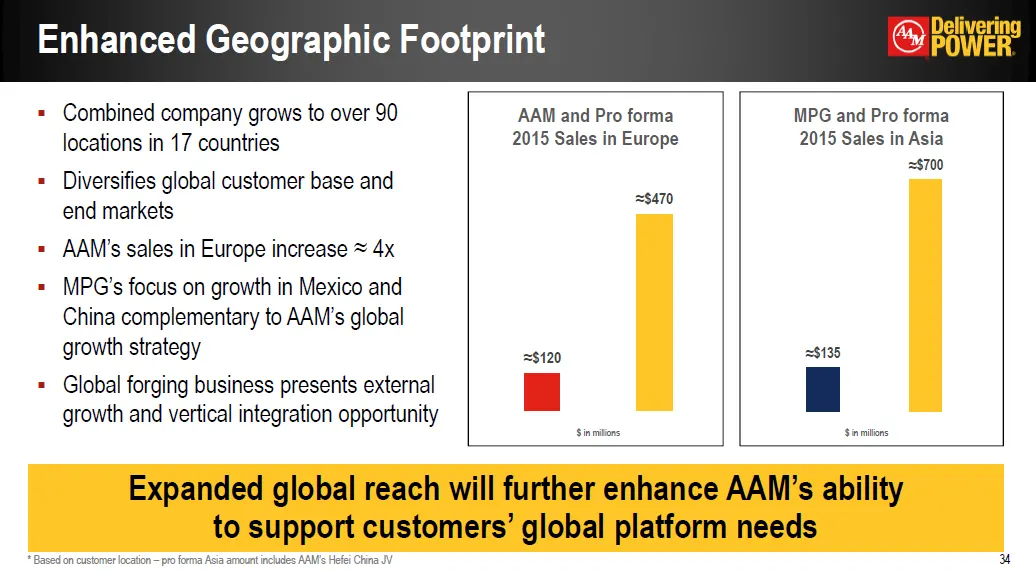
Slide 34: Enhanced Geographic Footprint
Combined company grows to over 90 locations in 17 countriesDiversifies global customer base and end marketsAAM’s sales in Europe increase ≈ 4xMPG’s focus on growth in Mexico and China complementary to AAM’s global growth strategyGlobal forging business presents external growth and vertical integrati
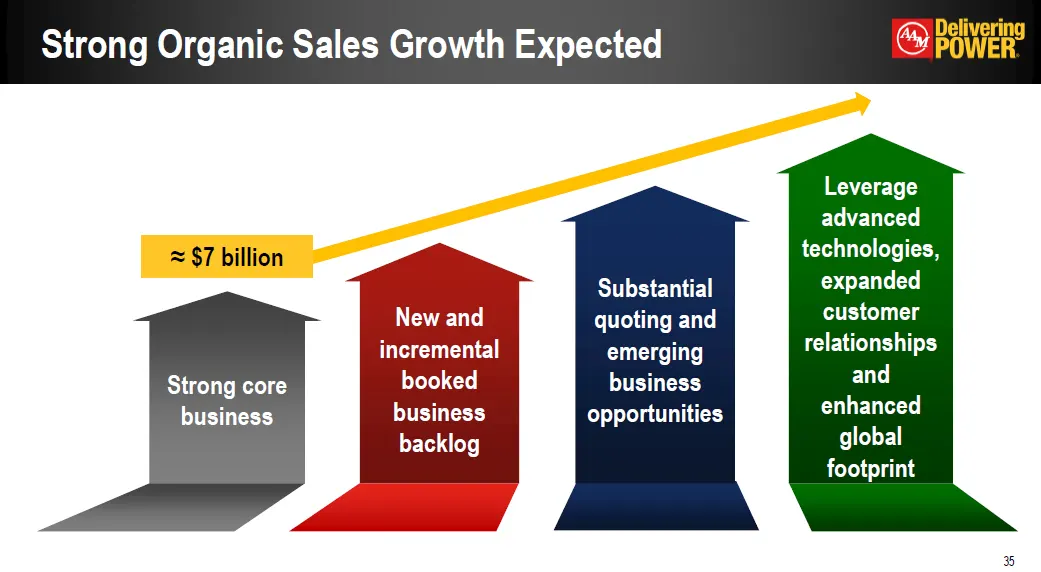
Slide 35: Strong Organic Sales Growth Expected
Strong Organic Sales Growth Expected * ≈ $7 billion
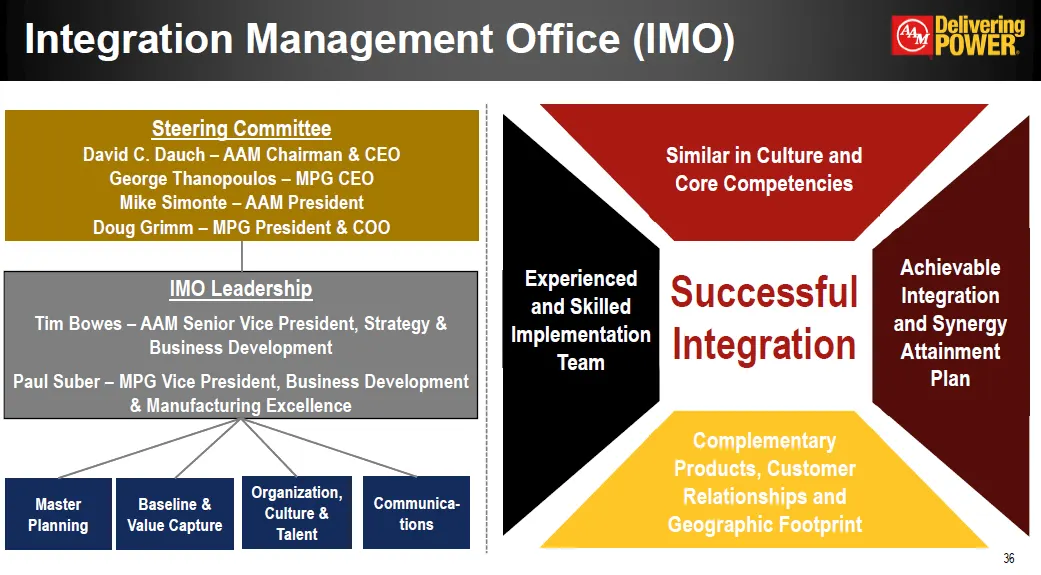
Slide 36: Integration Management Office (IMO)
Integration Management Office (IMO) * Successful Integration Steering CommitteeDavid C. Dauch – AAM Chairman & CEOGeorge Thanopoulos – MPG CEOMike Simonte – AAM PresidentDoug Grimm – MPG President & COO IMO LeadershipTim Bowes – AAM Senior Vice President, Strategy & Business DevelopmentPaul Suber –
Slide 37: Anticipated Synergies
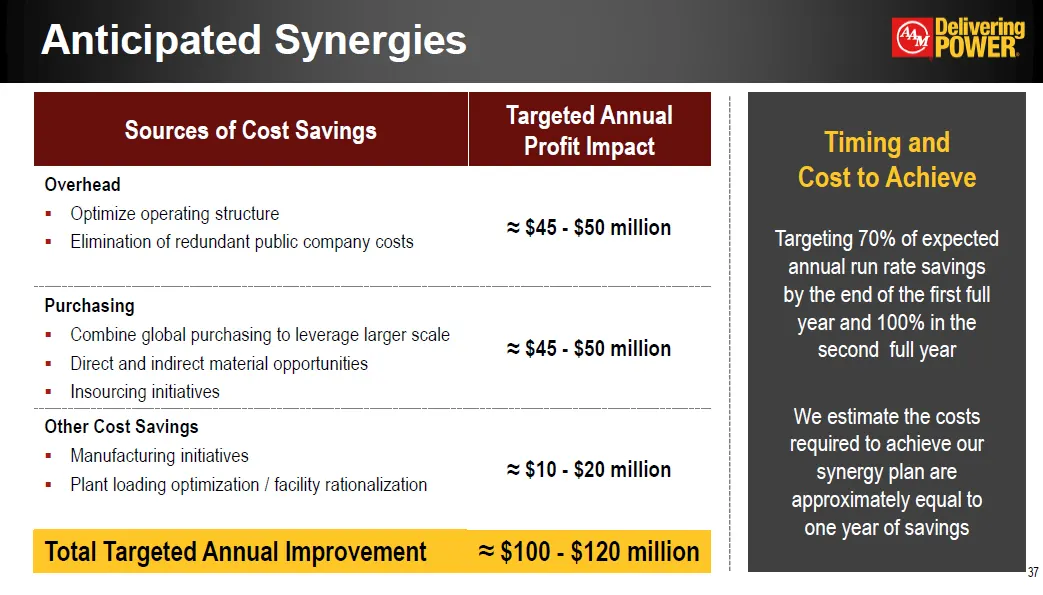
Anticipated Synergies * Sources of Cost Savings Targeted Annual Profit Impact OverheadOptimize operating structureElimination of redundant public company costs ≈ $45 - $50 million PurchasingCombine global purchasing to leverage larger scaleDirect and indirect material opportunitiesInsourcing initiat
Slide 38: Combined Pro Forma Financial Targets
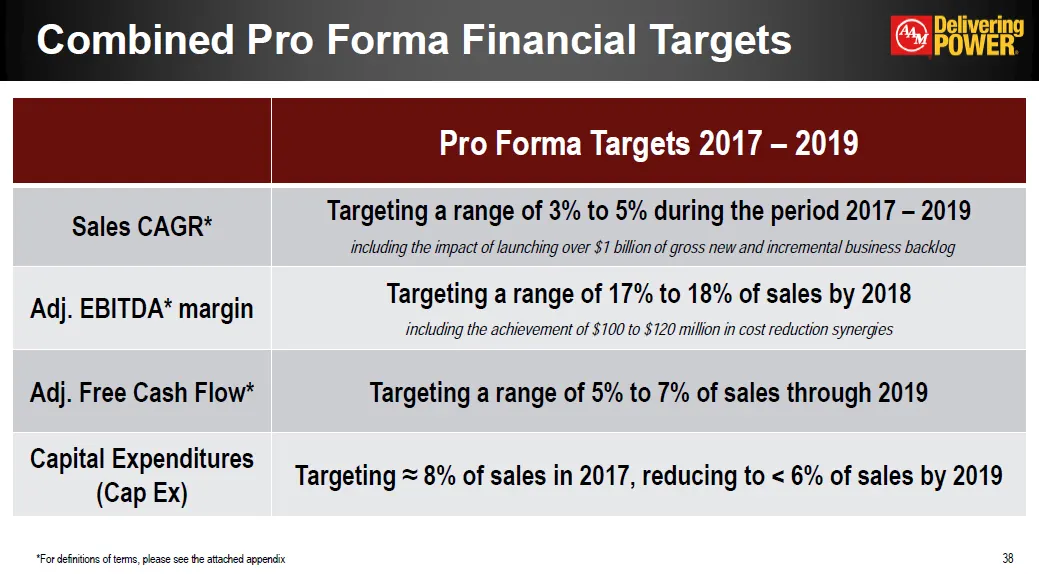
Combined Pro Forma Financial Targets * Pro Forma Targets 2017 – 2019 Sales CAGR* Targeting a range of 3% to 5% during the period 2017 – 2019 including the impact of launching over $1 billion of gross new and incremental business backlog Adj. EBITDA* margin Targeting a range of 17% to 18% of sales by
Slide 39: Expected Pro Forma EBITDA vs. Cash Payments
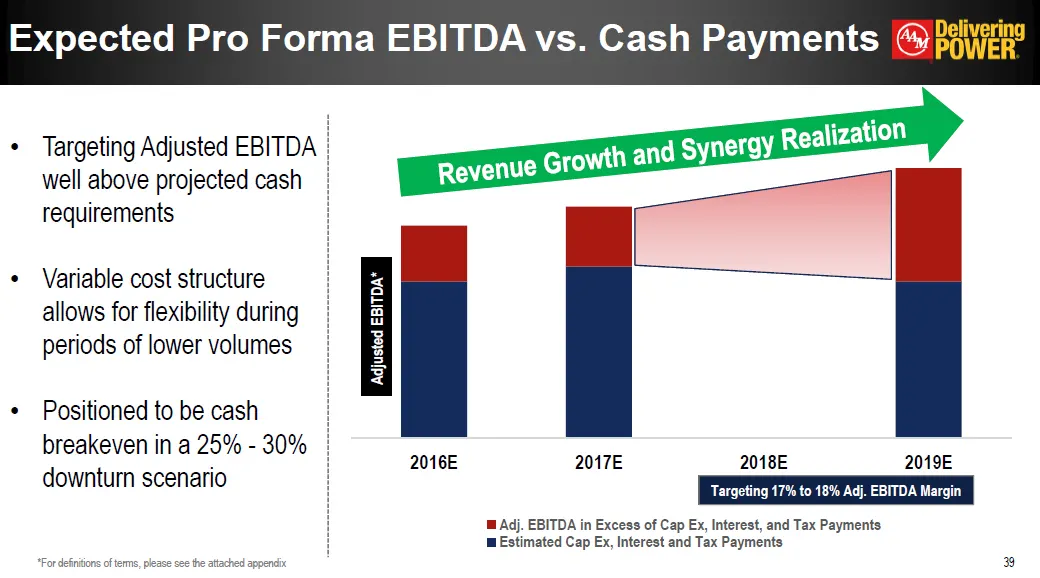
Expected Pro Forma EBITDA vs. Cash Payments * Revenue Growth and Synergy Realization Adjusted EBITDA* Targeting Adjusted EBITDA well above projected cash requirementsVariable cost structure allows for flexibility during periods of lower volumesPositioned to be cash breakeven in a 25% - 30% downturn
Slide 40: Pro Forma Debt Paydown and Net Leverage
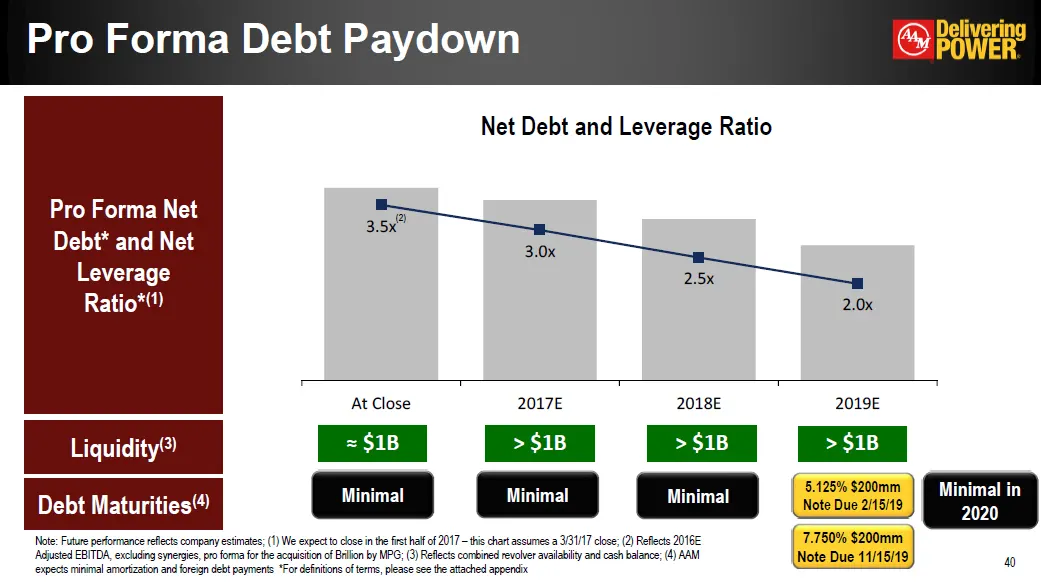
* Note: Future performance reflects company estimates; (1) We expect to close in the first half of 2017 – this chart assumes a 3/31/17 close; (2) Reflects 2016E Adjusted EBITDA, excluding synergies, pro forma for the acquisition of Brillion by MPG; (3) Reflects combined revolver availability and cas
Slide 41: Enhanced Credit Profile
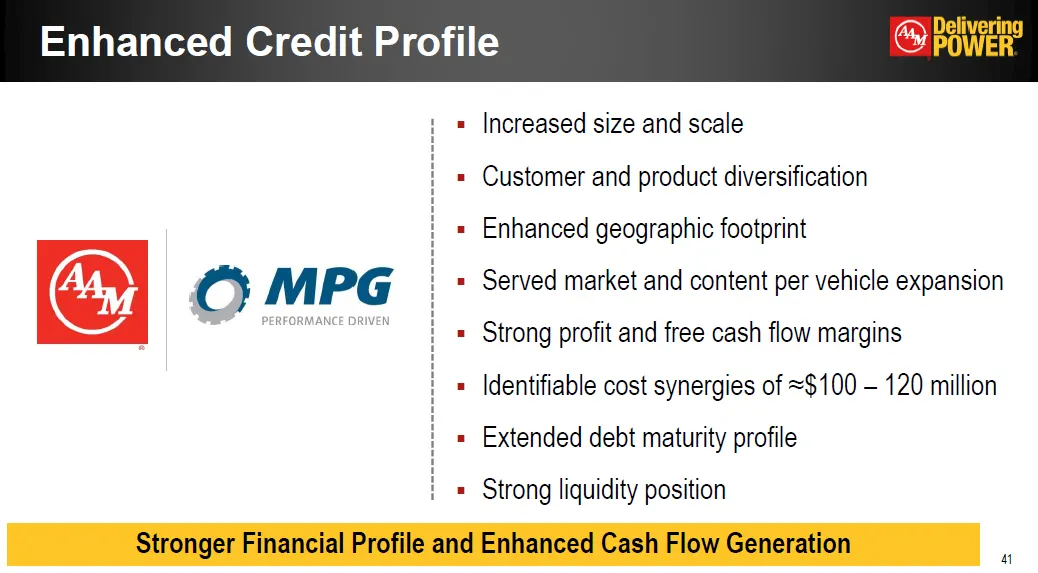
Enhanced Credit Profile * Stronger Financial Profile and Enhanced Cash Flow Generation Increased size and scaleCustomer and product diversificationEnhanced geographic footprintServed market and content per vehicle expansionStrong profit and free cash flow marginsIdentifiable cost synergies of ≈$100
Slide 42: Powerful Industrial Logic
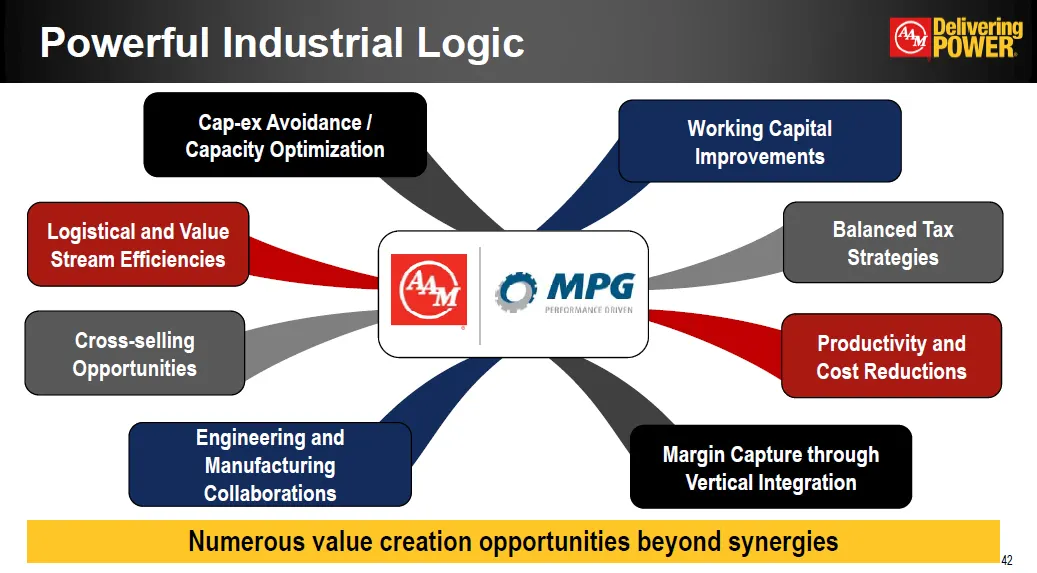
Powerful Industrial Logic * Logistical and Value Stream Efficiencies Cross-selling Opportunities Cap-ex Avoidance / Capacity Optimization Balanced Tax Strategies Margin Capture through Vertical Integration Productivity and Cost Reductions Working Capital Improvements Numerous value creation opportun
Slide 43: Transaction Overview
Opie TRANSACTION OVERVIEW
Slide 44: Sources and Uses – MPG Acquisition
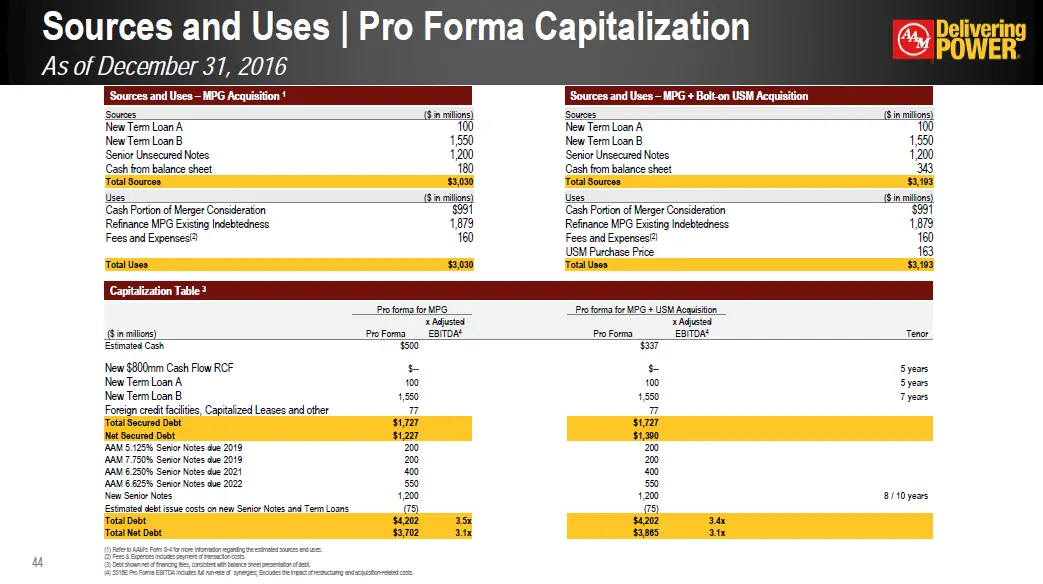
* Sources and Uses – MPG Acquisition 1 Capitalization Table 3 Sources ($ in millions) Sources ($ in millions) New Term Loan A 100 New Term Loan A 100 New Term Loan B 1,550 New Term Loan B 1,550 Senior Unsecured Notes 1,200 Senior Unsecured Notes 1,200 Cash from balance sheet 180 Cash from balance sh
Slide 45: Summary Terms – Senior Secured Credit Facilities
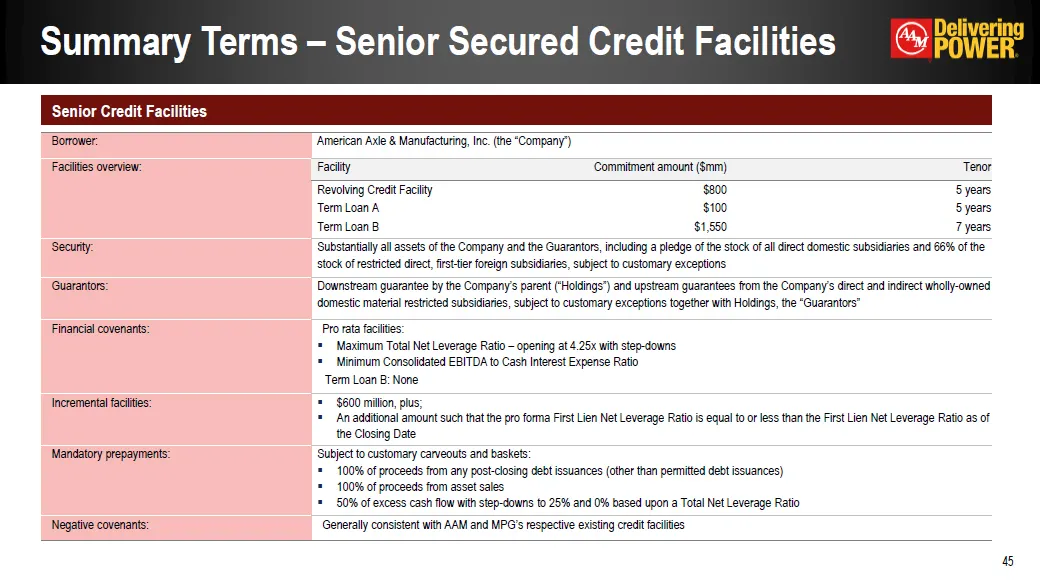
Summary Terms – Senior Secured Credit Facilities Senior Credit Facilities * Borrower: American Axle & Manufacturing, Inc. (the “Company”) American Axle & Manufacturing, Inc. (the “Company”) American Axle & Manufacturing, Inc. (the “Company”) Facilities overview: Facility Commitment amount ($mm) Teno
Slide 46: Transaction Timeline
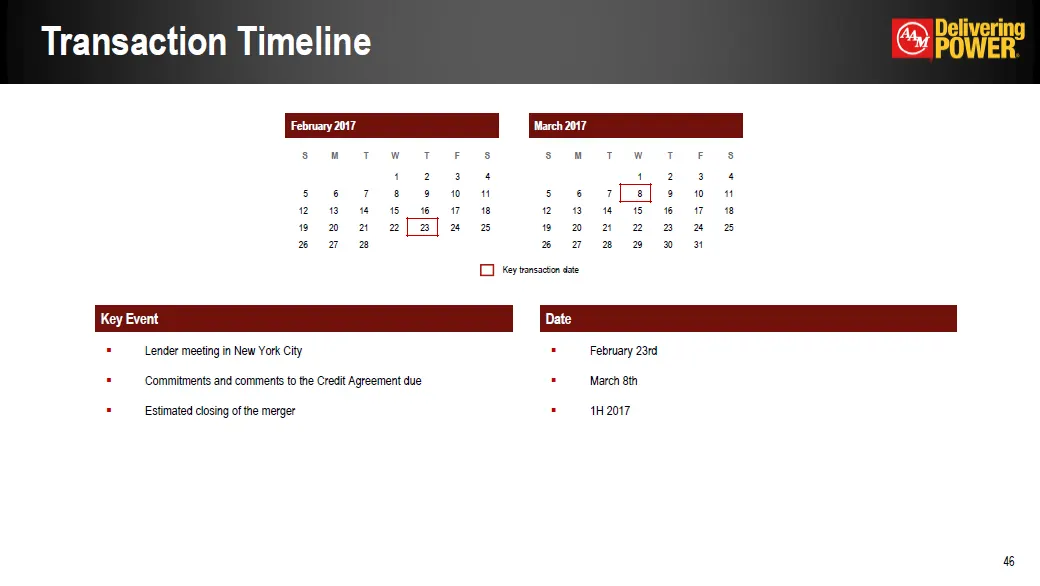
Transaction Timeline Lender meeting in New York CityCommitments and comments to the Credit Agreement dueEstimated closing of the merger February 2017 February 2017 February 2017 February 2017 February 2017 February 2017 February 2017 March 2017 March 2017 March 2017 March 2017 March 2017 March 2017
Slide 47: Q&A
Opie Q&A
Slide 48: >< Oo z Lu Oo. Oo. <
>< Oo z Lu Oo. Oo. <
Slide 49: Non-GAAP Financial Measures
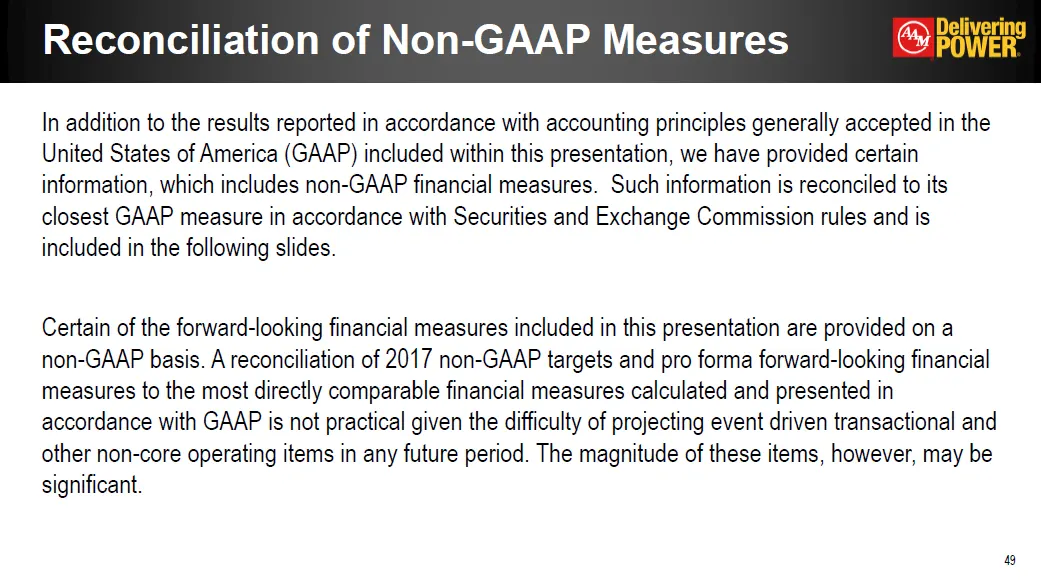
In addition to the results reported in accordance with accounting principles generally accepted in the United States of America (GAAP) included within this presentation, we have provided certain information, which includes non-GAAP financial measures. Such information is reconciled to its closest GA
Slide 50: Reconciliation of Non-GAAP Measures
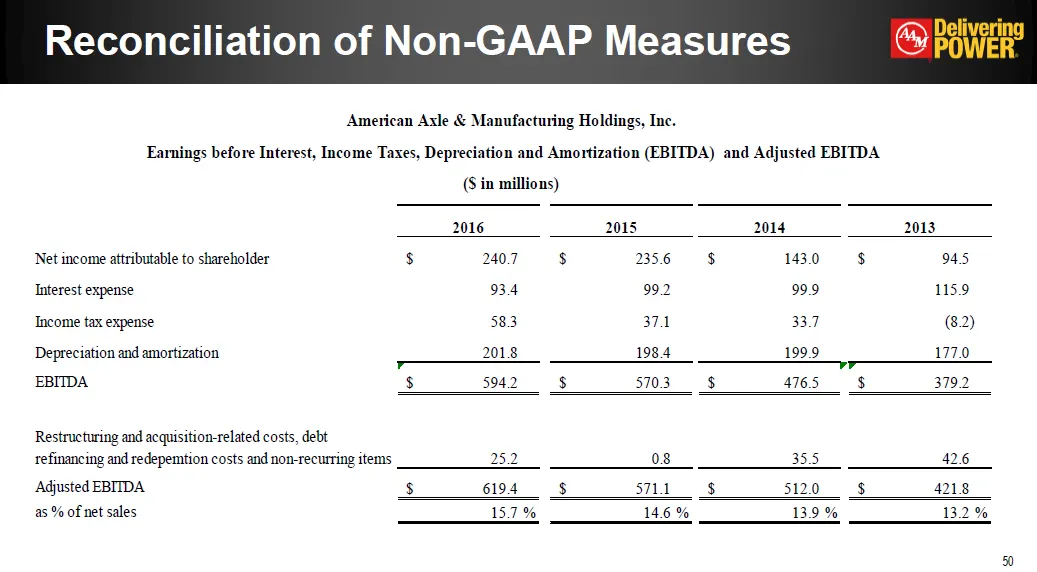
Reconciliation of Non-GAAP Measures *
Slide 51: Reconciliation of Non-GAAP Measures
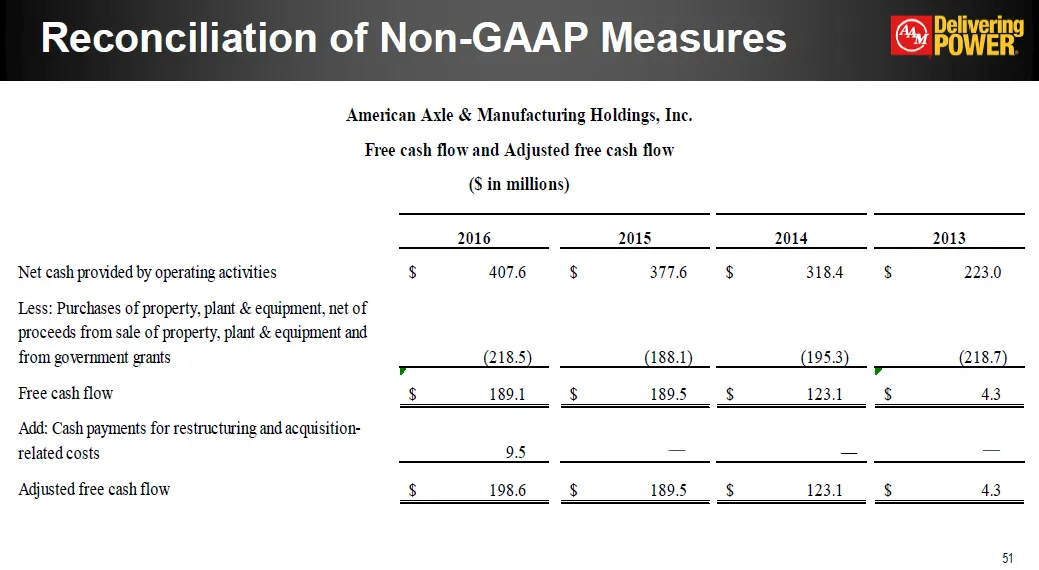
Reconciliation of Non-GAAP Measures *
Slide 52: Reconciliation of Non-GAAP Measures
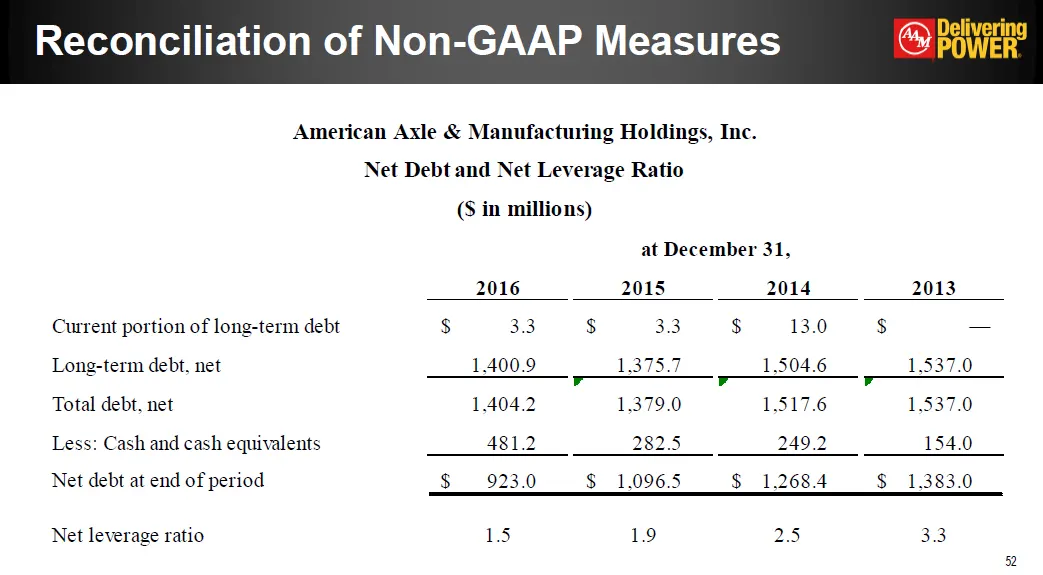
Reconciliation of Non-GAAP Measures *
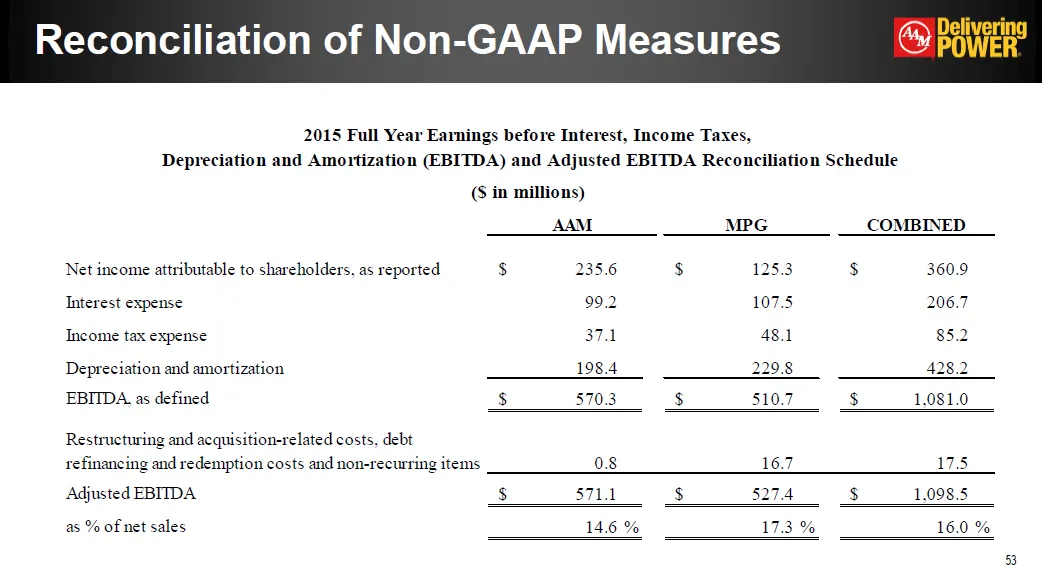
Slide 53: Reconciliation of Non-GAAP Measures
Reconciliation of Non-GAAP Measures *
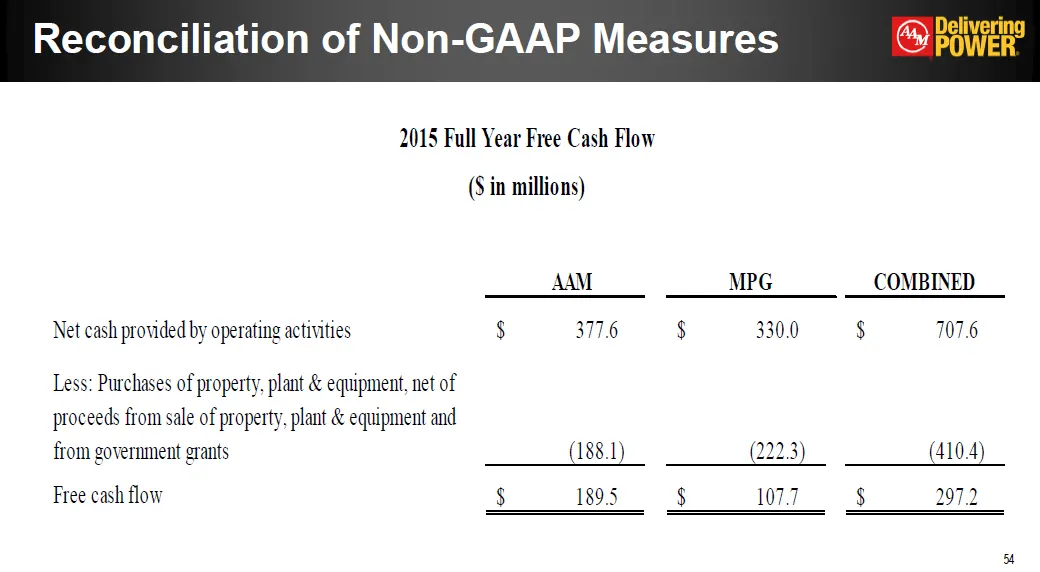
Slide 54: Reconciliation of Non-GAAP Measures
Reconciliation of Non-GAAP Measures *
Slide 55: Reconciliation of Non-GAAP Measures
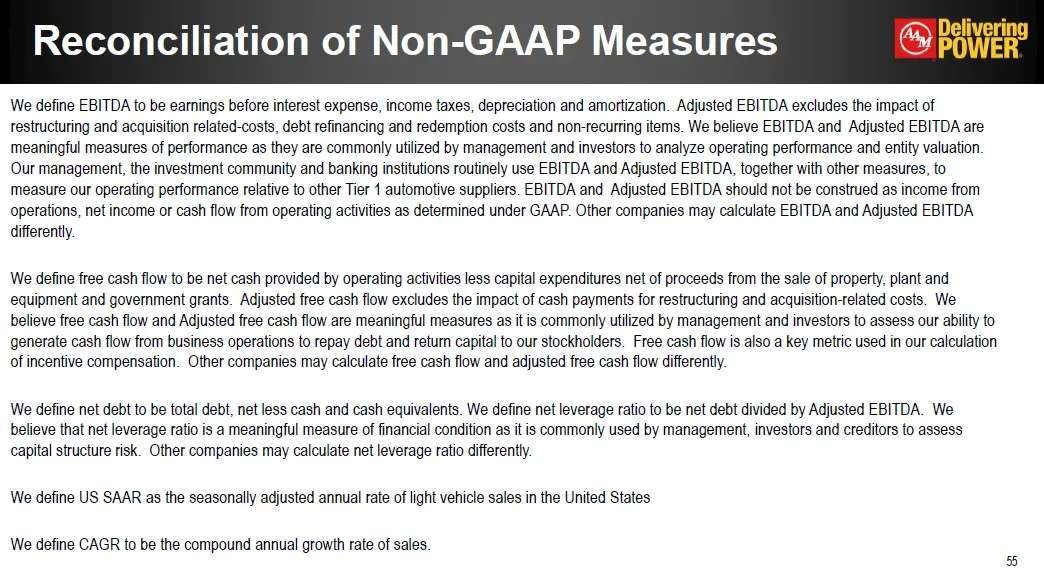
Reconciliation of Non-GAAP Measures We define EBITDA to be earnings before interest expense, income taxes, depreciation and amortization. Adjusted EBITDA excludes the impact of restructuring and acquisition related-costs, debt refinancing and redemption costs and non-recurring items. We believe EBIT
Source: SEC EDGAR · 425 filed Feb 23, 2017
More decks from Metaldyne Performance Group Inc
 Merger or Acquisition (January 2017)37 slides · Jan 11, 2017
 2016 Bank of America Merrill Lynch Leveraged Finance Conference38 slides · Nov 30, 2016
 Merger or Acquisition (November 2016)26 slides · Nov 17, 2016
 Merger or Acquisition (November 2016)25 slides · Nov 3, 2016
 Deutsche Bank Leveraged Finance Conference 201630 slides · Sep 27, 2016
 Goldman Sachs Leveraged Finance Conference 201627 slides · May 17, 2016