Limestone Bancorp — Porter Bancorp — Sandler O'Neill + Partners Financial Services Conference 2006
19 slides from Limestone Bancorp's conference presentation, Nov 15, 2006
Slide 1: Sandler O'Neill + Partners Financial Services Conference
Exhibit 99.2 Sandler O ’ Neill + Partners, L.P. Financial Services Conference November 16, 2006

Slide 2: Disclaimer
2 Disclaimer This presentation contains forward-looking statements that involve risks and uncertainties. These forward-looking statements are based on management’s current expectations. Porter Bancorp’s actual results in future periods may differ materially from those currently expected due to vario

Slide 3: Company Overview
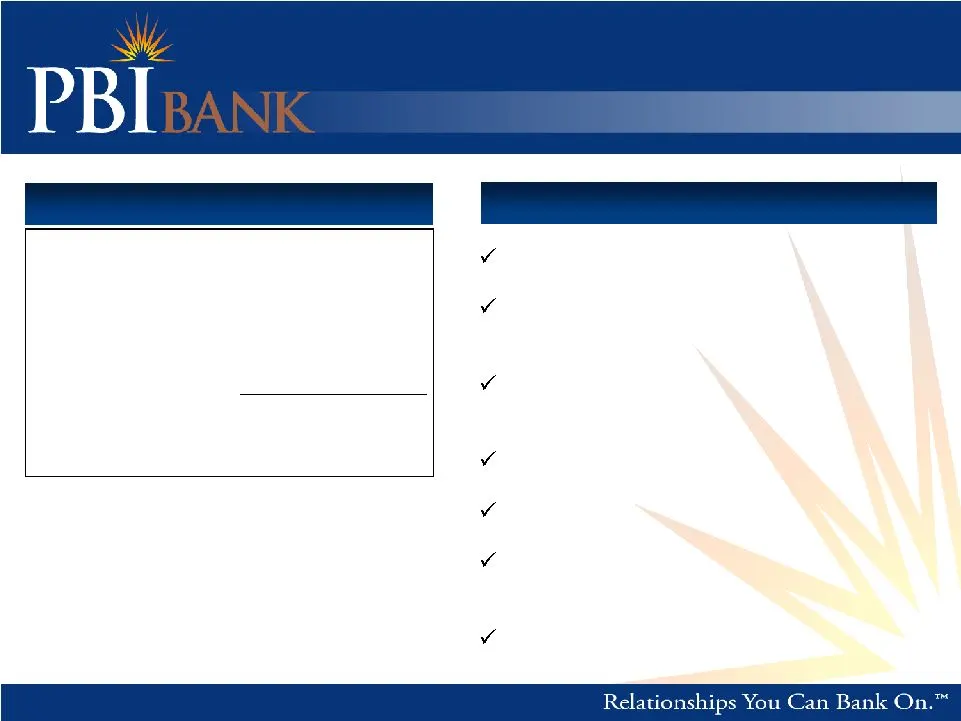
3 Note: (1) Based on November 10, 2006 closing price of $22.75 (2) For the last 30 calendar days Company Overview IPO Date: NSDQ Symbol: Shares Outstanding: Market Capitalization: Average Daily Volume: Insider Ownership: September 22, 2006 PBIB 7.62 Million $173 Million 2,972 Shares 69% (1) (2)
Slide 4: Franchise Overview
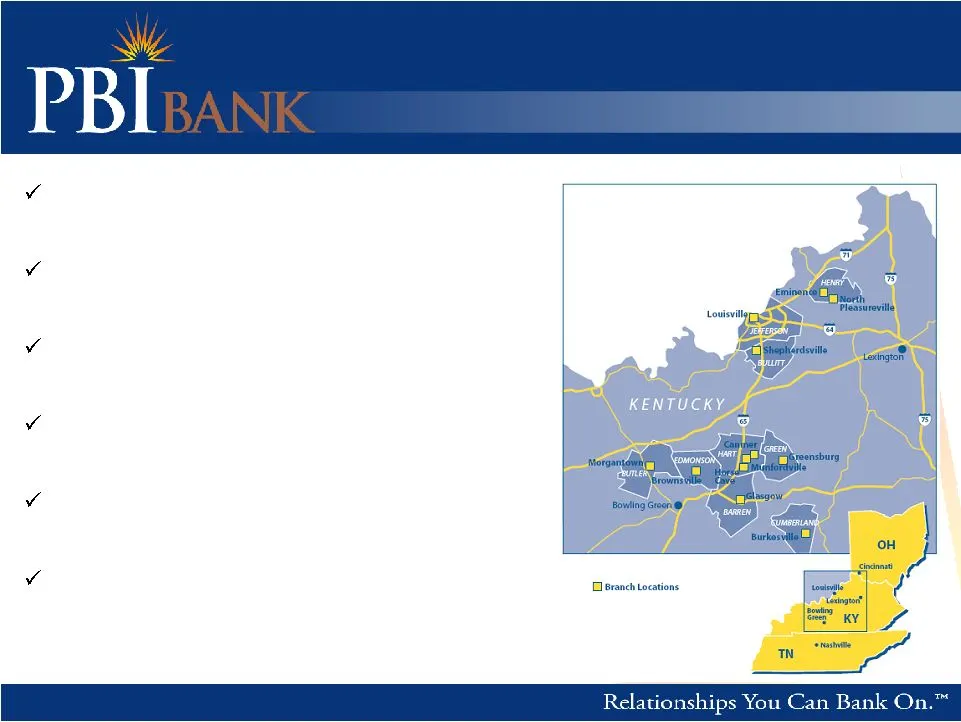
4 Note: (1) Financial data as of and for the 9 months ended September 30, 2006 Franchise Overview Headquartered in Louisville, KY 13 branches $1.0 billion in assets $817 million in loans $802 million in deposits Focused on developing the I-65 corridor
Slide 5: Louisville and Louisville Area Market Snapshot
5 Notes: (1) In millions; deposits as of June 30, 2006; excludes $335 million of Ascencia deposits (2) In millions; deposits as of June 30, 2006; Source: SNL Financial Louisville and Louisville Area Market Market Snapshot Market Characteristics th largest city in the U.S. 12 counties with over 1.2 m
Slide 6: South Central Kentucky Market Snapshot
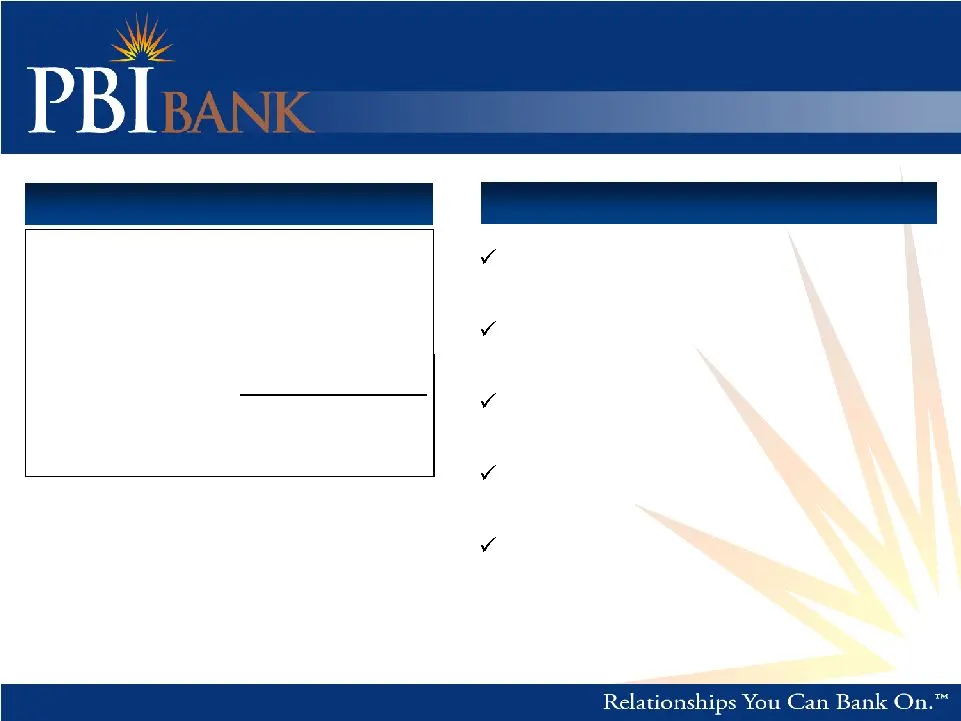
6 Notes: (1) In millions; deposits as of June 30, 2006 (2) In millions; deposits as of June 30, 2006; Source: SNL Financial South Central Kentucky Market Market Snapshot Market Characteristics Several stable community markets Stable source of deposits and loans Lower cost of funds Porter ’ s main ba
Slide 7: Bowling Green / Glasgow Market Snapshot
7 Bowling Green / Glasgow Market Notes: (1) In millions; deposits as of June 30, 2006 (2) In millions; deposits as of June 30, 2006; Source: SNL Financial Market Snapshot Market Characteristics th largest city in Kentucky 425,000 person labor market Attractive growth market Major employers include G
Slide 8: Successful Track Record: Franchise Evolution
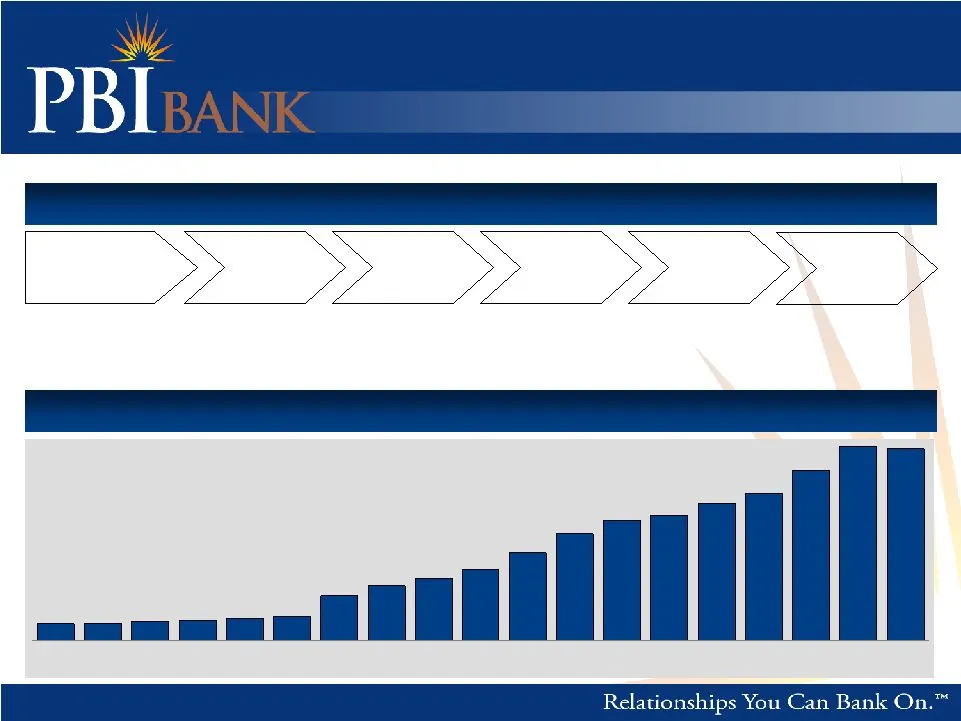
8 Note: (1) J. Chester Porter and Maria L. Bouvette acquired 3 banks in 1985 – 1986; Bill Porter participated in 2 of the 3 bank acquisitions Successful Track Record $122 $230 $281 $319 $368 $454 $553 $623 $653 $715 $767 $887 $1,011 $1,000 $111 $101 $94 $88 $85 Total Assets ($M) Franchise Evolution
Slide 9: Historical Franchise Growth
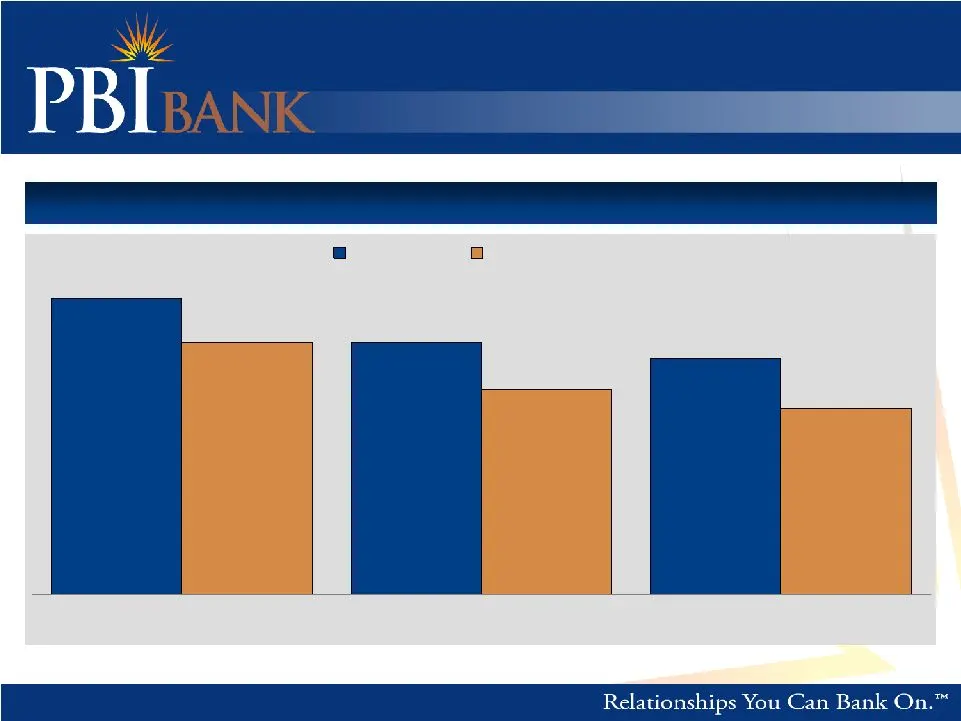
9 Historical Franchise Growth Notes: * 2 acquisitions made in the last 5 years ($76 million in total assets at closing) Compounded Annual Growth Rates – 12/31/01 through 9/30/06 11.00% 9.40% 7.60% 6.90% 9.40% 8.80% Assets Deposits Loans Actual Net of Acquisitions*
Slide 10: Future Success Drivers
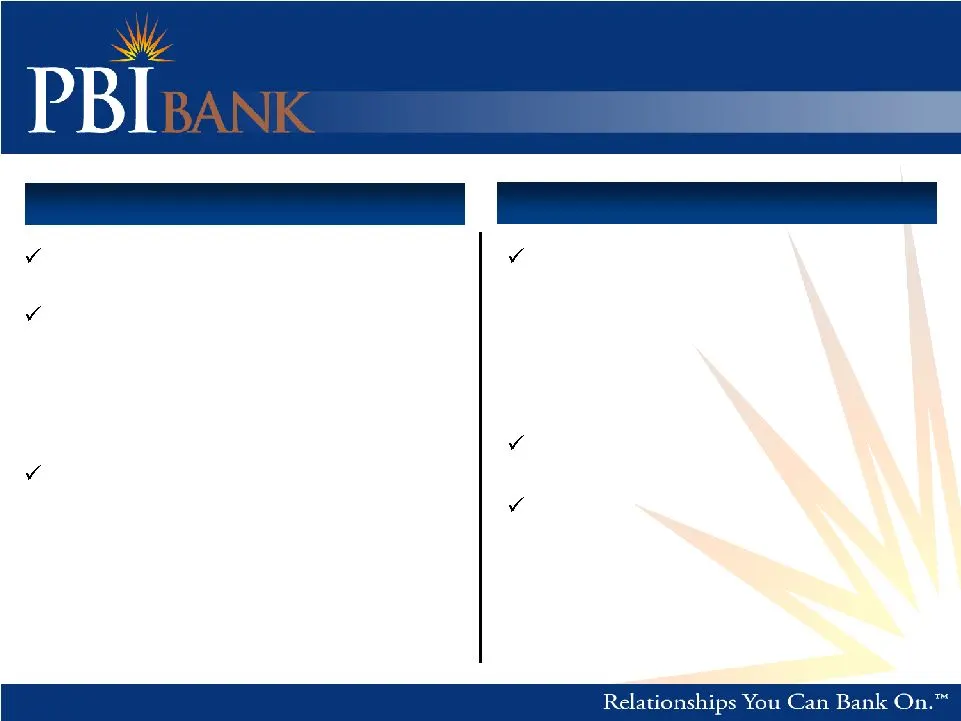
10 Growth Driven by: Future Success Drivers Areas for Improvement: Core franchise growth De novo branches - Markets with existing lending presences Whole bank acquisitions - Experienced integrators - Extensive in-state connections Core deposits - Existing customer base - New customer bases Non-inter
Slide 11: Future Success Driven by: Operating Strengths
11 Future Success Driven by: Operating Strengths Experienced management team Extensive market knowledge and community relationships Acquisition and integration capabilities Highly efficient organizational structure Scalable operating platform Diversified funding sources
Slide 12: Experienced Management Team
12 Average Years Experience 21 11 Experienced Management Team Name Age Position Industry Experience Porter Experience J. Chester Porter Chairman of the Board, General Counsel and Director of Porter Bancorp and PBI Bank Maria L. Bouvette President, CEO and Director of Porter Bancorp and PBI Bank Davi
Slide 13: Loan Portfolio Composition
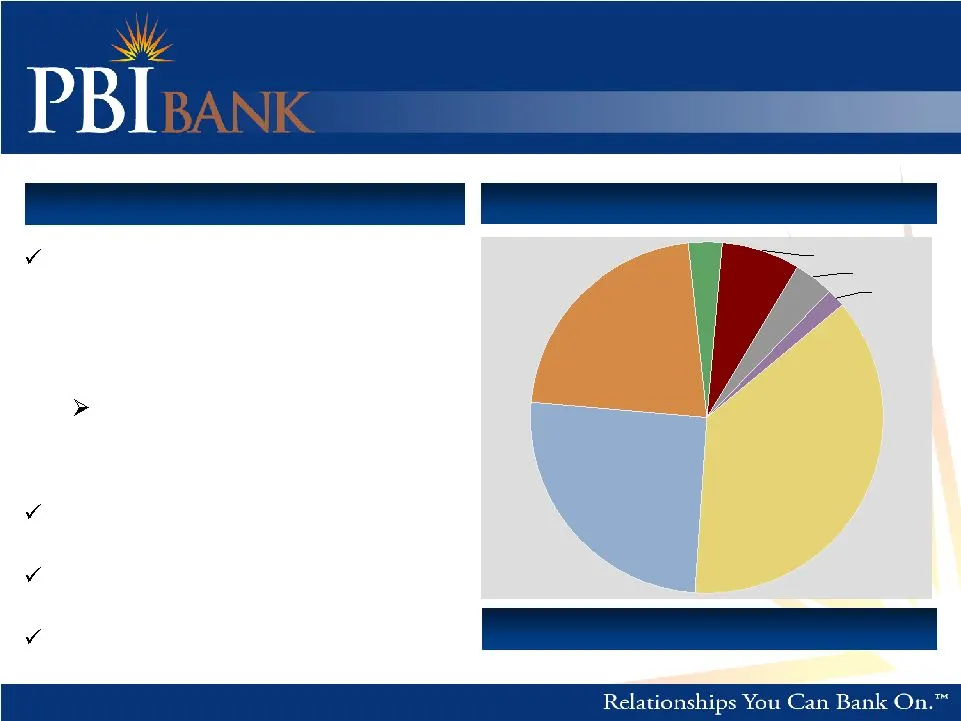
13 Note: (1) As of September 30, 2006 Loan Portfolio Composition (1) Total Loans: $817M Loan Stratification Highlights Primary focus on commercial, commercial real estate and construction lending 69.4% of total loans at September 30, 2006 Granular portfolio Loyal and experienced producers Team appro
Slide 14: Consistent Credit Performance
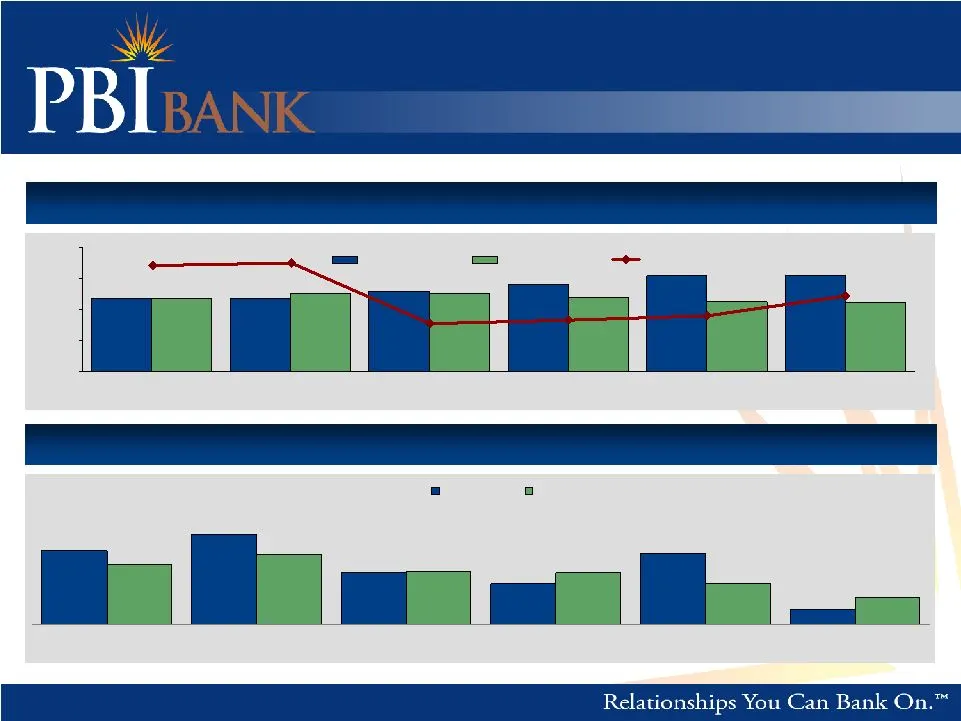
14 Note: (1) Includes 30 banks with assets $750M - $2B in IL, IN, KY, MO, OH, TN and WV Reserves / Total Loans 1.18% 1.18% 1.28% 1.40% 1.54% 1.55% 1.17% 1.26% 1.26% 1.19% 1.12% 1.10% NCOs / Average Loans 0.33% 0.27% 0.31% 0.24% 0.23% 0.18% 0.12% 0.07% 0.32% 0.18% 0.23% 0.40% Consistent Credit Perfor
Slide 15: Deposit Mix
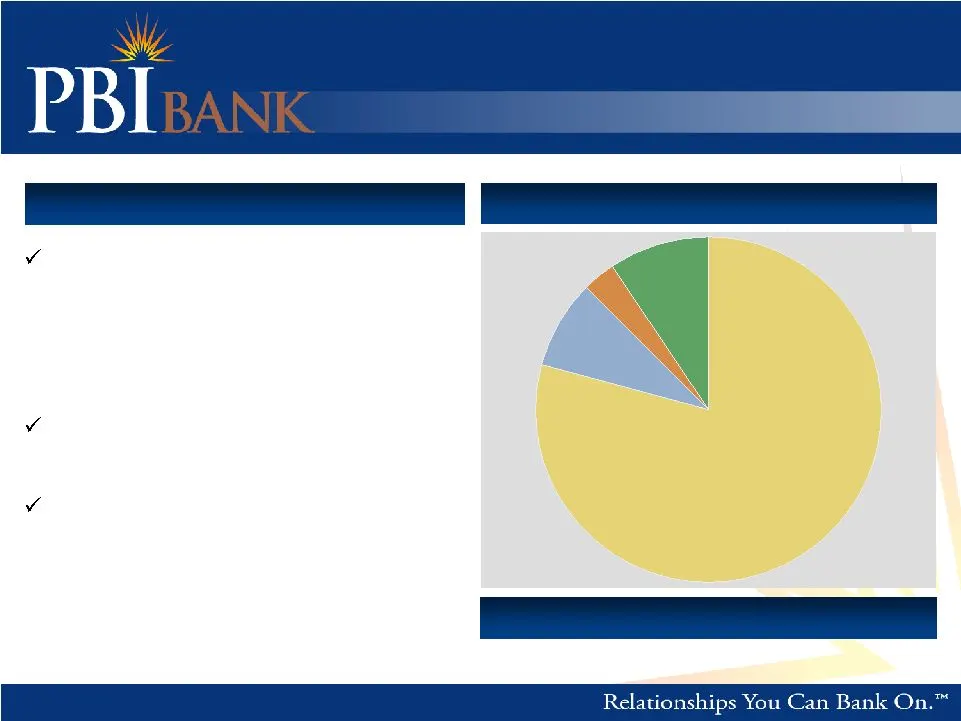
15 Notes: (1) For the three months ended September 30, 2006; based on average daily deposit balances Deposit Mix (1) Total Deposits: $802M Deposit Stratification Highlights Cost of Deposits: (1) 3.58% Time Deposits, 79.3% NOW and MMDA, 9.5% Savings, 3.0% Non-Interest Bearing, 8.2% Internet banking u
Slide 16: Operating and Performance Metrics
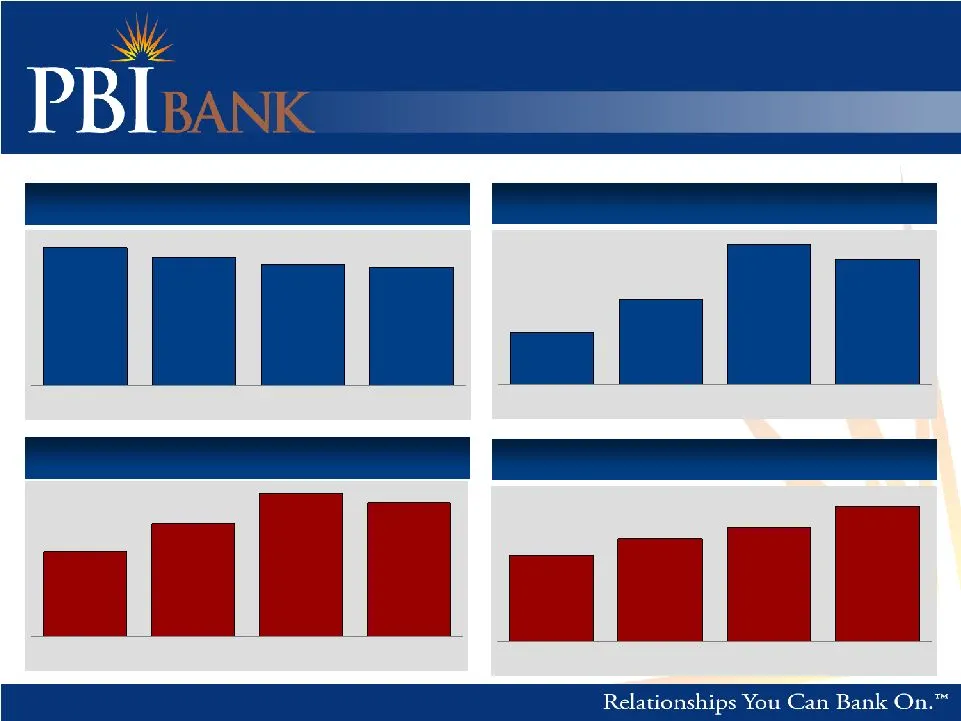
16 Net Income (1) Return on Average Assets (1) $6,750 $10,642 $11,379 $9,012 0.91% 1.44% 1.21% 1.09% Operating and Performance Metrics Notes: (1) Adjusted for consolidation through add-back of minority interests, deduction of applicable income taxes and deduction of acquisition funding (net of tax)
Slide 17: Recent Financial Performance
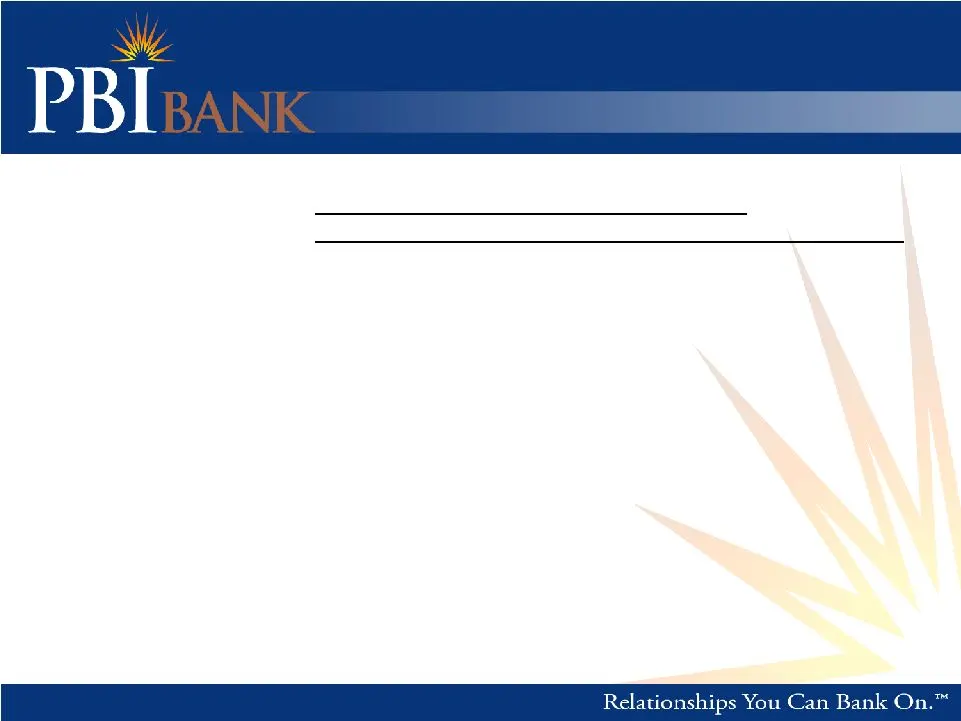
17 Recent Financial Performance Notes: (1) Pro forma for the infusion of equity, shares and a 6% opportunity cost of cash on proceeds related to the IPO; For a reconciliation, see the Investor Relations page of our website: www.pbibank.com 2006 Quarters 2006 YTD First Second Third Annualized Earning
Slide 18: Trading Multiples
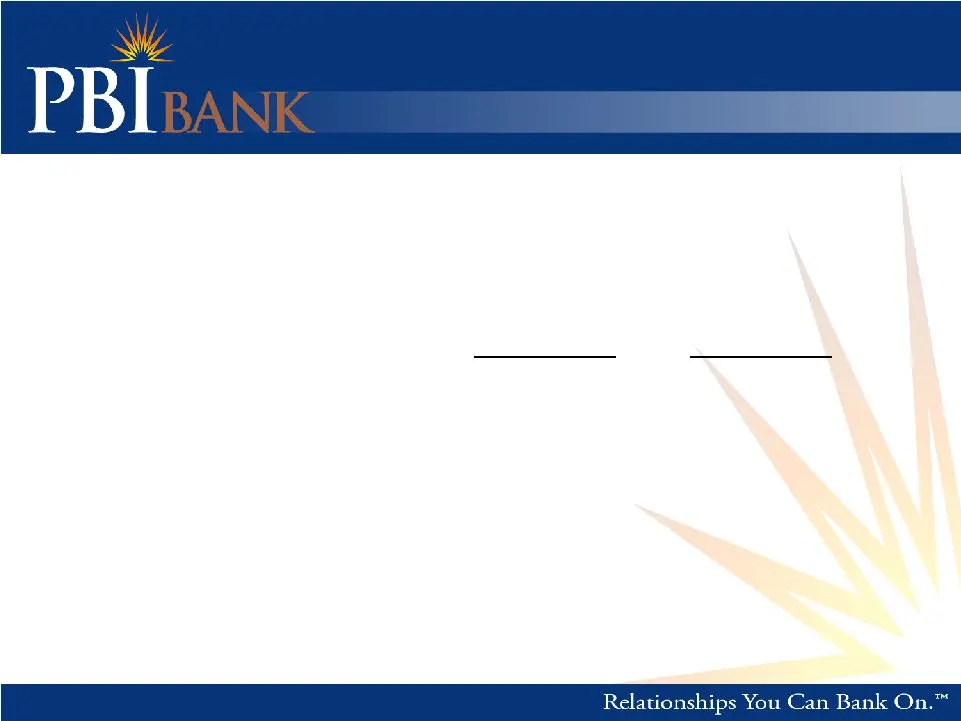
18 Trading Multiples Notes: (1) Pro forma for the infusion of equity, shares and a 6% opportunity cost of cash on proceeds related to the IPO; For a reconciliation, see the Investor Relations page of our website: www.pbibank.com Current Market Price (11/10/06) $22.75 Trading Multiples (based on 9/30
Slide 19: Investment Highlights: The PBIB Difference
19 Investment Highlights The “ PBIB ” Difference Seasoned and experienced management team Efficient organization Strong EPS, asset, loan and deposit growth Attractive, diversified growth markets
Source: SEC EDGAR · 8-K filed Nov 15, 2006
More decks from Limestone Bancorp Inc
 Q4 2022 Earnings Presentation44 slides · Feb 10, 2023
 Q3 2022 Earnings Presentation44 slides · Nov 1, 2022
 Merger or Acquisition (October 2022)15 slides · Oct 25, 2022
 Q2 2022 Earnings Presentation20 slides · Jul 29, 2022
 Q1 2022 Earnings Presentation20 slides · Apr 29, 2022
 Q2 2021 Earnings Presentation20 slides · Jul 21, 2021