Iskenderun Demir ve Celik AS · BIST:ISDMR
Iskenderun Demir ve Celik AS — 9M 2019 Earnings Presentation
15 slides from Iskenderun Demir ve Celik AS's earnings presentation, Oct 24, 2019

Slide 1: ISDEMIR
ISDEMIR MINING METALLURGY Gi @ak ))
Slide 2: 2019 9 Months Investor Presentation
2019 9 Months Investor Presentation 24.10.2019
Slide 3: Disclaimer
Disclaimer İskenderun Demir ve Çelik A.Ş. (İsdemir) may, when necessary, make written or verbal announcements about forward-looking information, expectations, estimates, targets, assessments and opinions. İsdemir has made the necessary arrangements about the amounts and results of such information t
Slide 4: Operational and Financial Highlights
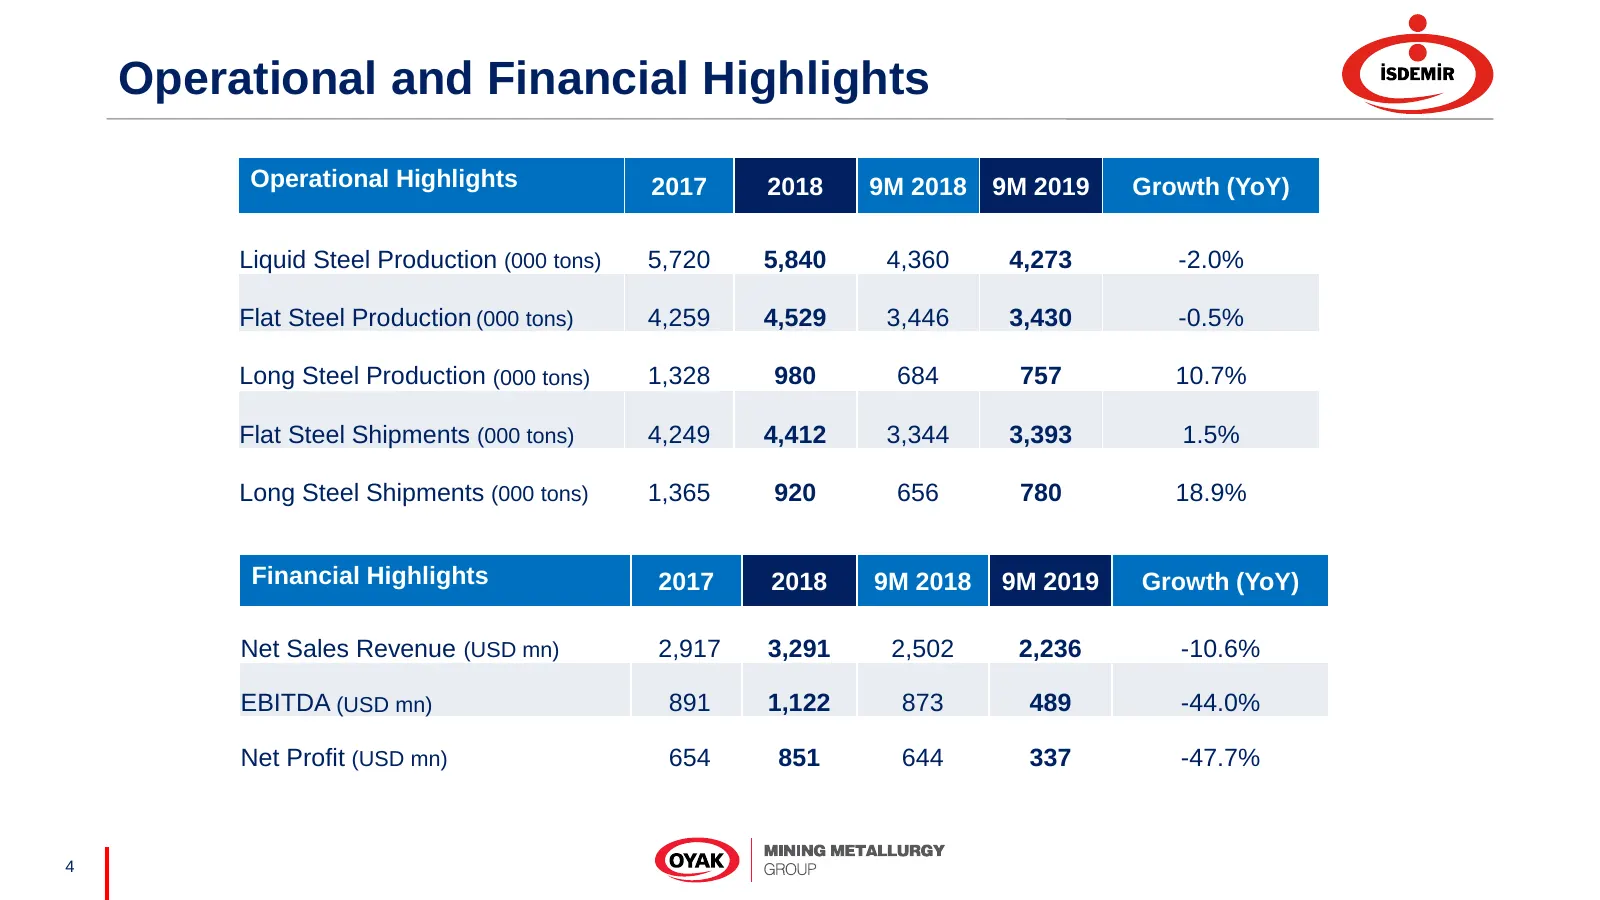
Operational and Financial Highlights Operational Highlights 2017 2018 9M 2018 9M 2019 Growth (YoY) Liquid Steel Production (000 tons) 5,720 5,840 4,360 4,273 -2.0% Flat Steel Production (000 tons) 4,259 4,529 3,446 3,430 -0.5% Long Steel Production (000 tons) 1,328 980 684 757 10.7% Flat Steel Shipm
Slide 5: Liquid Steel Production (000 tons)
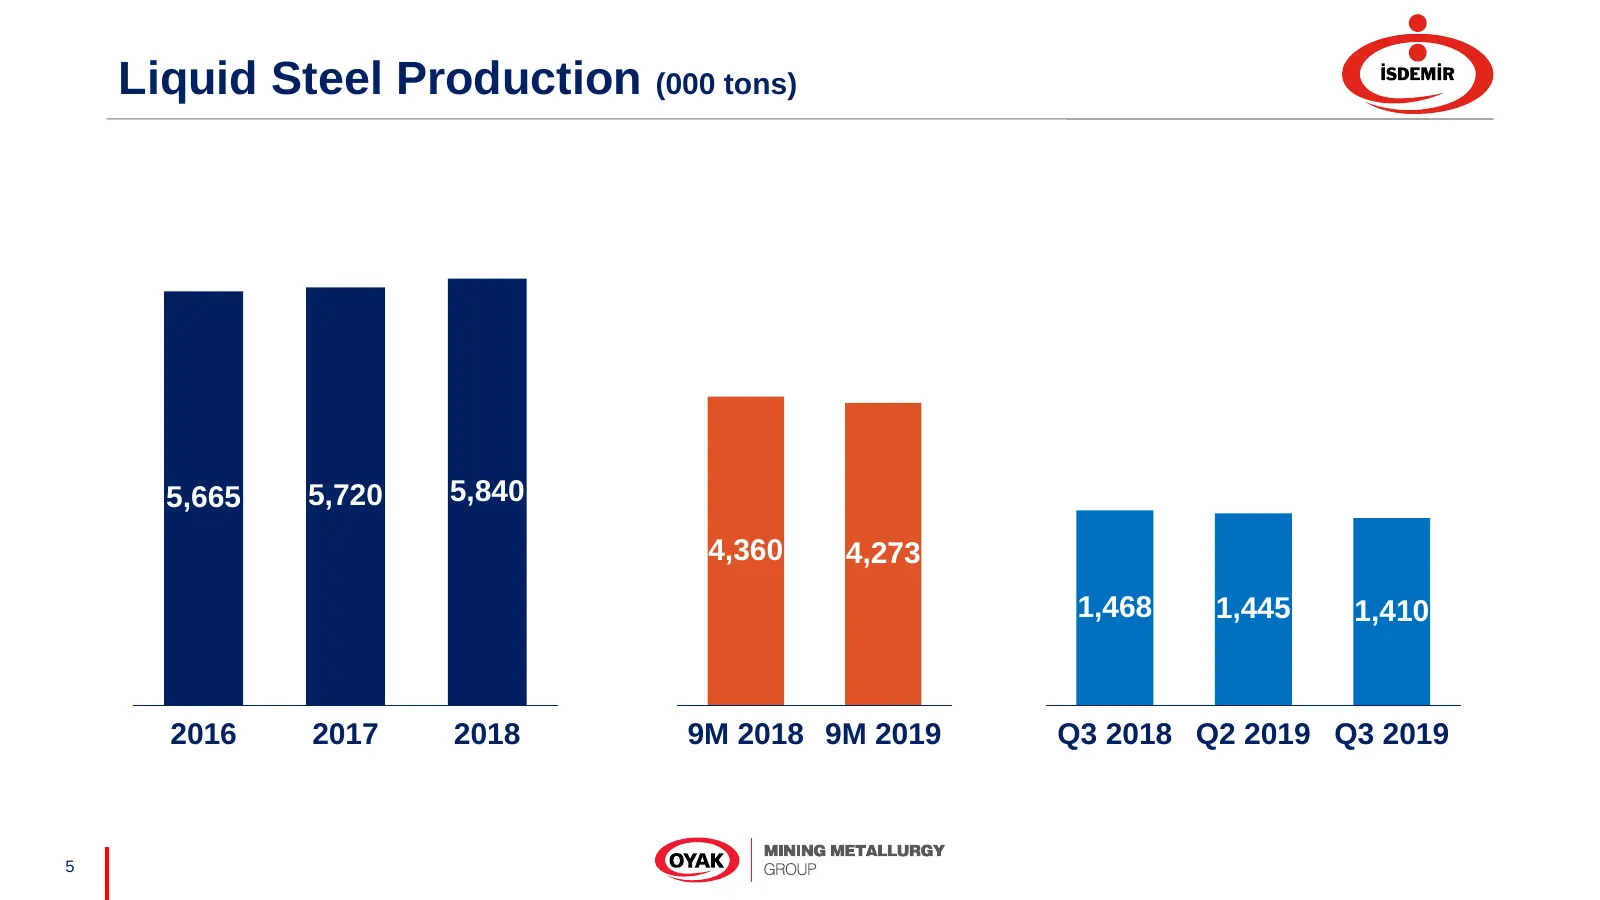
Liquid Steel Production (000 tons) 5,665 5,720 5,840 4,360 4,273 1,468 1,445 1,410 2016 2017 2018 9M 2018 9M 2019 Q3 2018 Q2 2019 Q3 2019 5
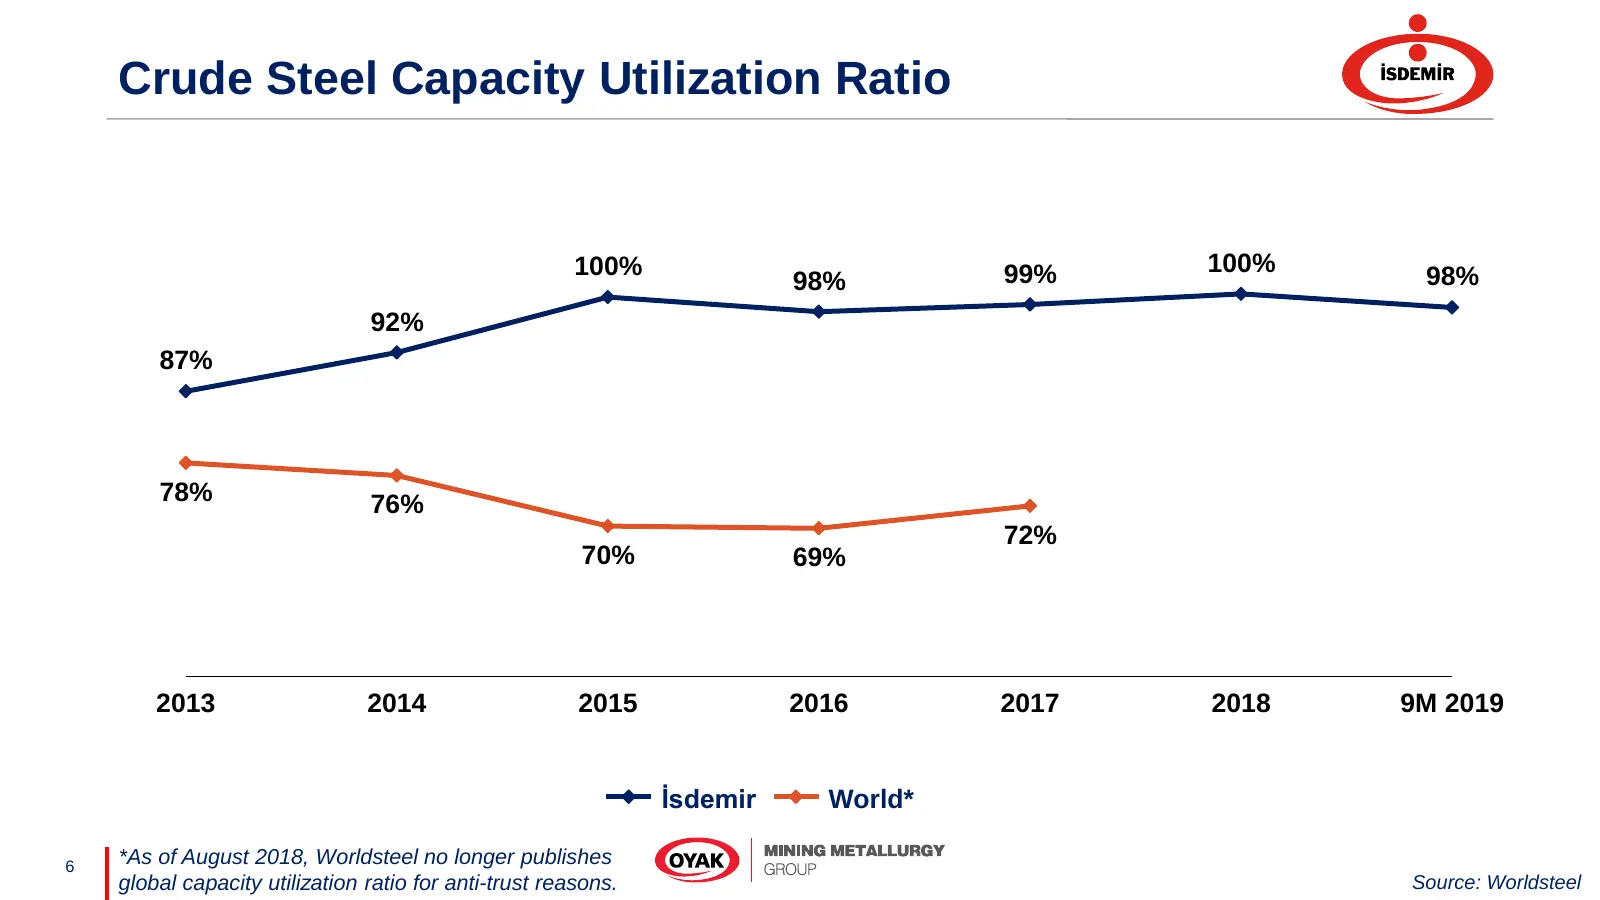
Slide 6: Crude Steel Capacity Utilization Ratio
Crude Steel Capacity Utilization Ratio 100% 99% 100% 98% 98% 92% 87% 78% 76% 72% 70% 69% 2013 2014 2015 2016 2017 2018 9M 2019 İsdemir World* 6 *As of August 2018, Worldsteel no longer publishes global capacity utilization ratio for anti-trust reasons. Source: Worldsteel
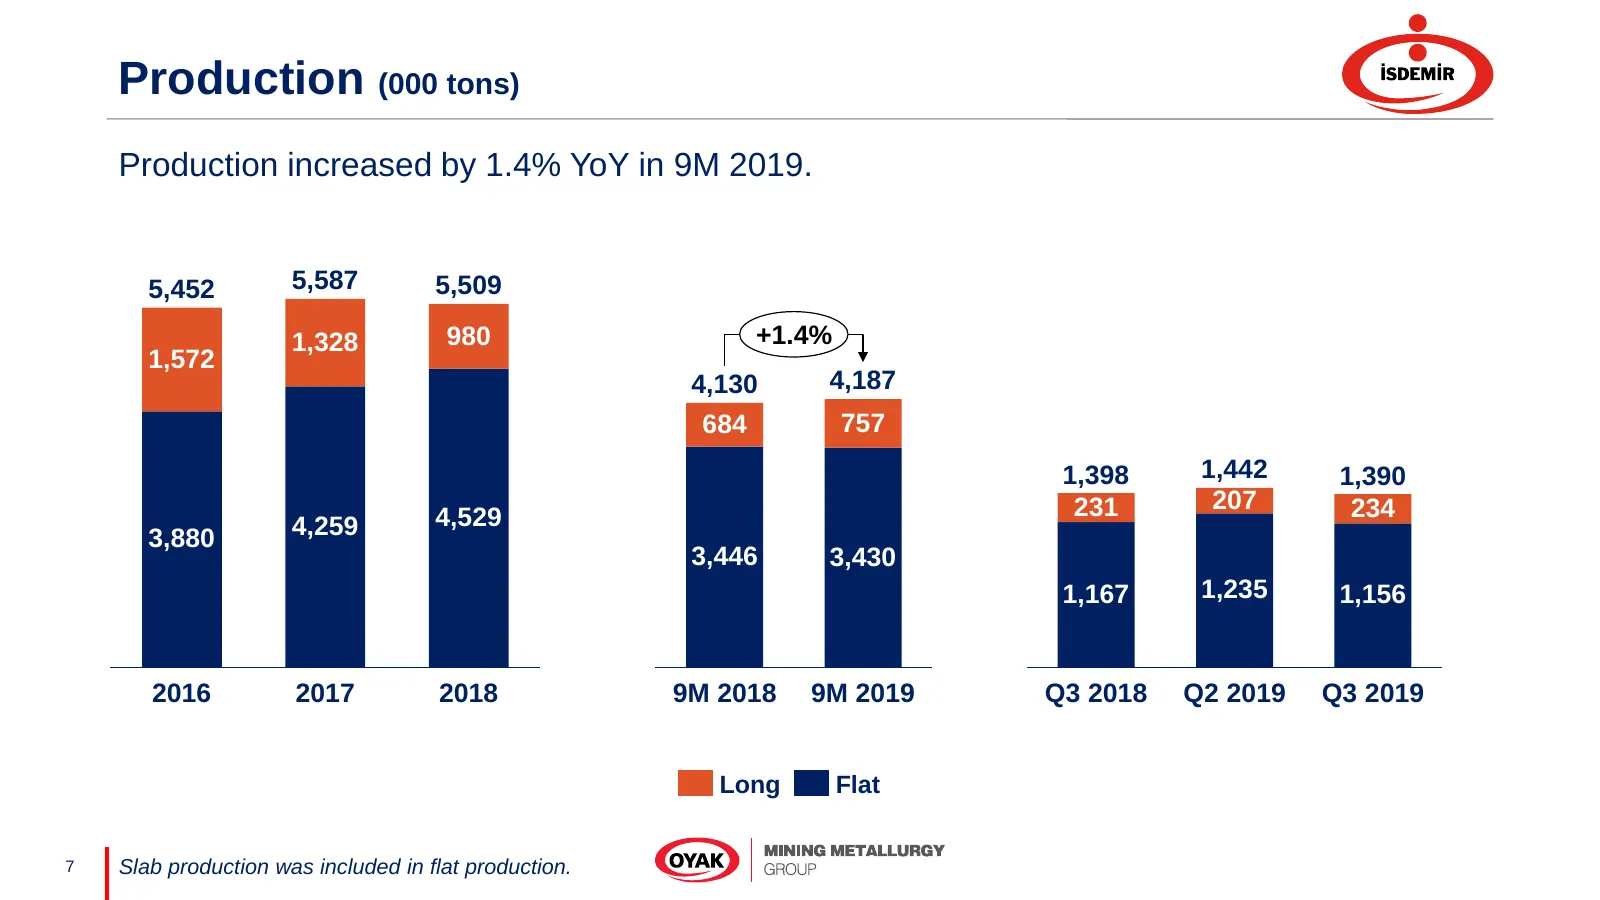
Slide 7: Production (000 tons)
Production (000 tons) Production increased by 1.4% YoY in 9M 2019. 5,452 5,587 5,509 1,328 980 +1.4% 1,572 4,130 4,187 684 757 1,398 1,442 1,390 231 207 234 4,259 4,529 3,880 3,446 3,430 1,167 1,235 1,156 2016 2017 2018 9M 2018 9M 2019 Q3 2018 Q2 2019 Q3 2019 Long Flat 7 Slab production was included
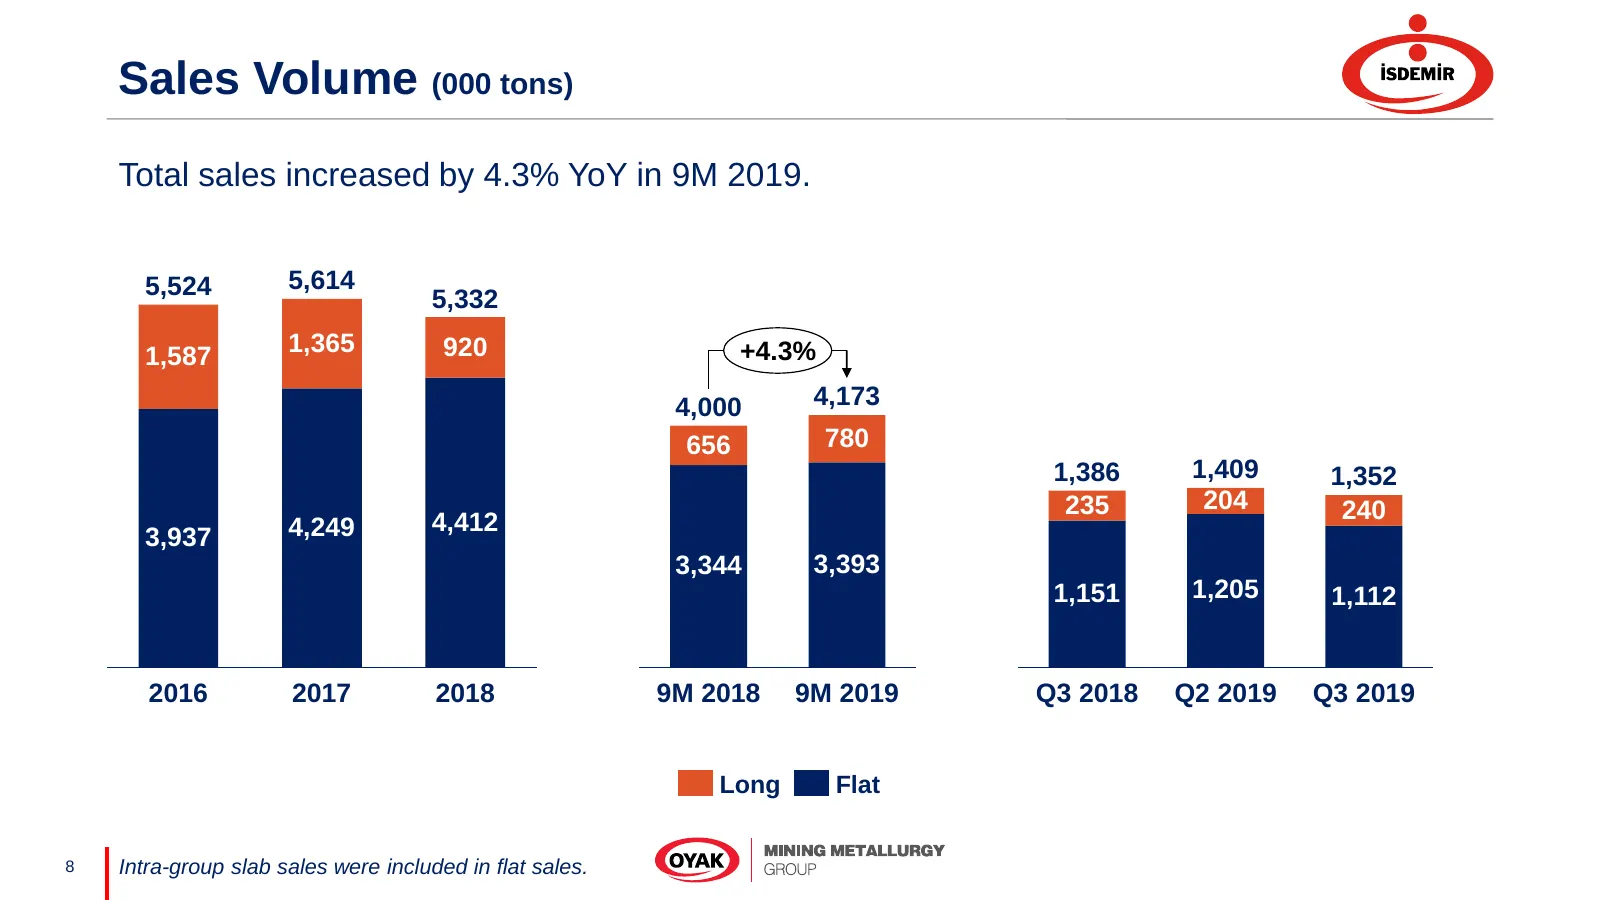
Slide 8: Sales Volume (000 tons)
Sales Volume (000 tons) Total sales increased by 4.3% YoY in 9M 2019. 5,524 5,614 5,332 1,587 1,365 920 +4.3% 4,000 4,173 656 780 1,386 1,409 1,352 235 204 240 4,249 4,412 3,937 3,344 3,393 1,151 1,205 1,112 2016 2017 2018 9M 2018 9M 2019 Q3 2018 Q2 2019 Q3 2019 Long Flat 8 Intra-group slab sales we
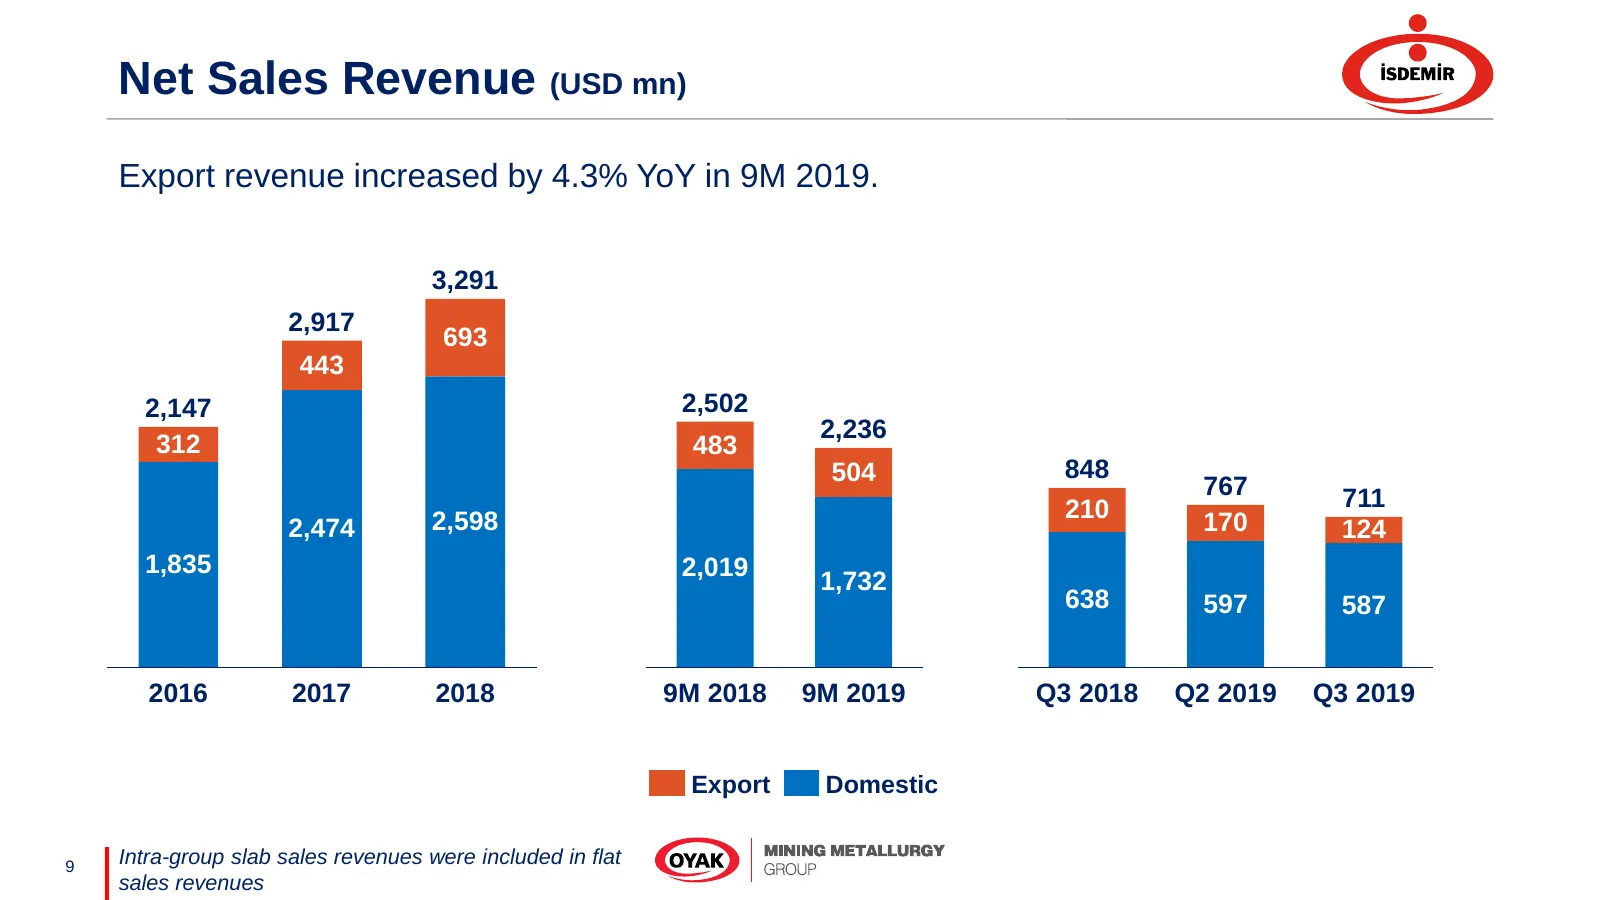
Slide 9: Net Sales Revenue (USD mn)
Net Sales Revenue (USD mn) Export revenue increased by 4.3% YoY in 9M 2019. 3,291 2,917 693 443 2,147 2,502 2,236 312 483 504 848 767 711 2,598 210 170 2,474 124 1,835 2,019 1,732 638 597 587 2016 2017 2018 9M 2018 9M 2019 Q3 2018 Q2 2019 Q3 2019 Export Domestic 9 Intra-group slab sales revenues wer
Slide 10: EBITDA & Net Profit
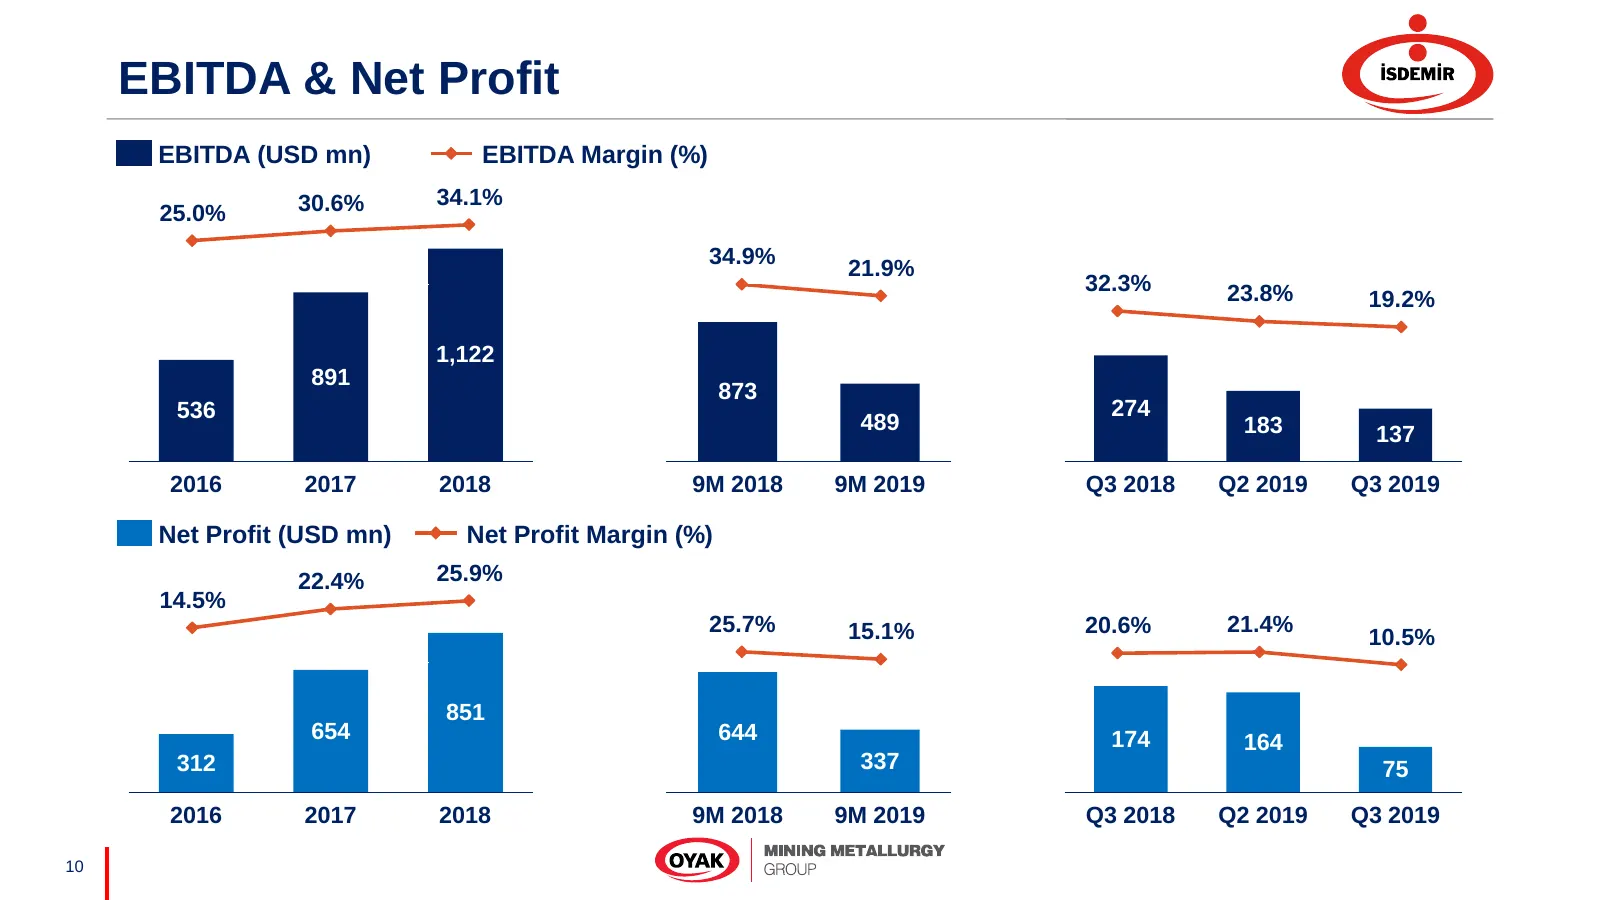
EBITDA & Net Profit EBITDA (USD mn) EBITDA Margin (%) 30.6% 34.1% 25.0% 34.9% 21.9% 32.3% 23.8% 19.2% 1,122 891 873 536 274 489 183 137 2016 2017 2018 9M 2018 9M 2019 Q3 2018 Q2 2019 Q3 2019 Net Profit (USD mn) Net Profit Margin (%) 22.4% 25.9% 14.5% 25.7% 15.1% 20.6% 21.4% 10.5% 851 654 644 174 164
Slide 11: EBITDA per Ton (USD/ton)
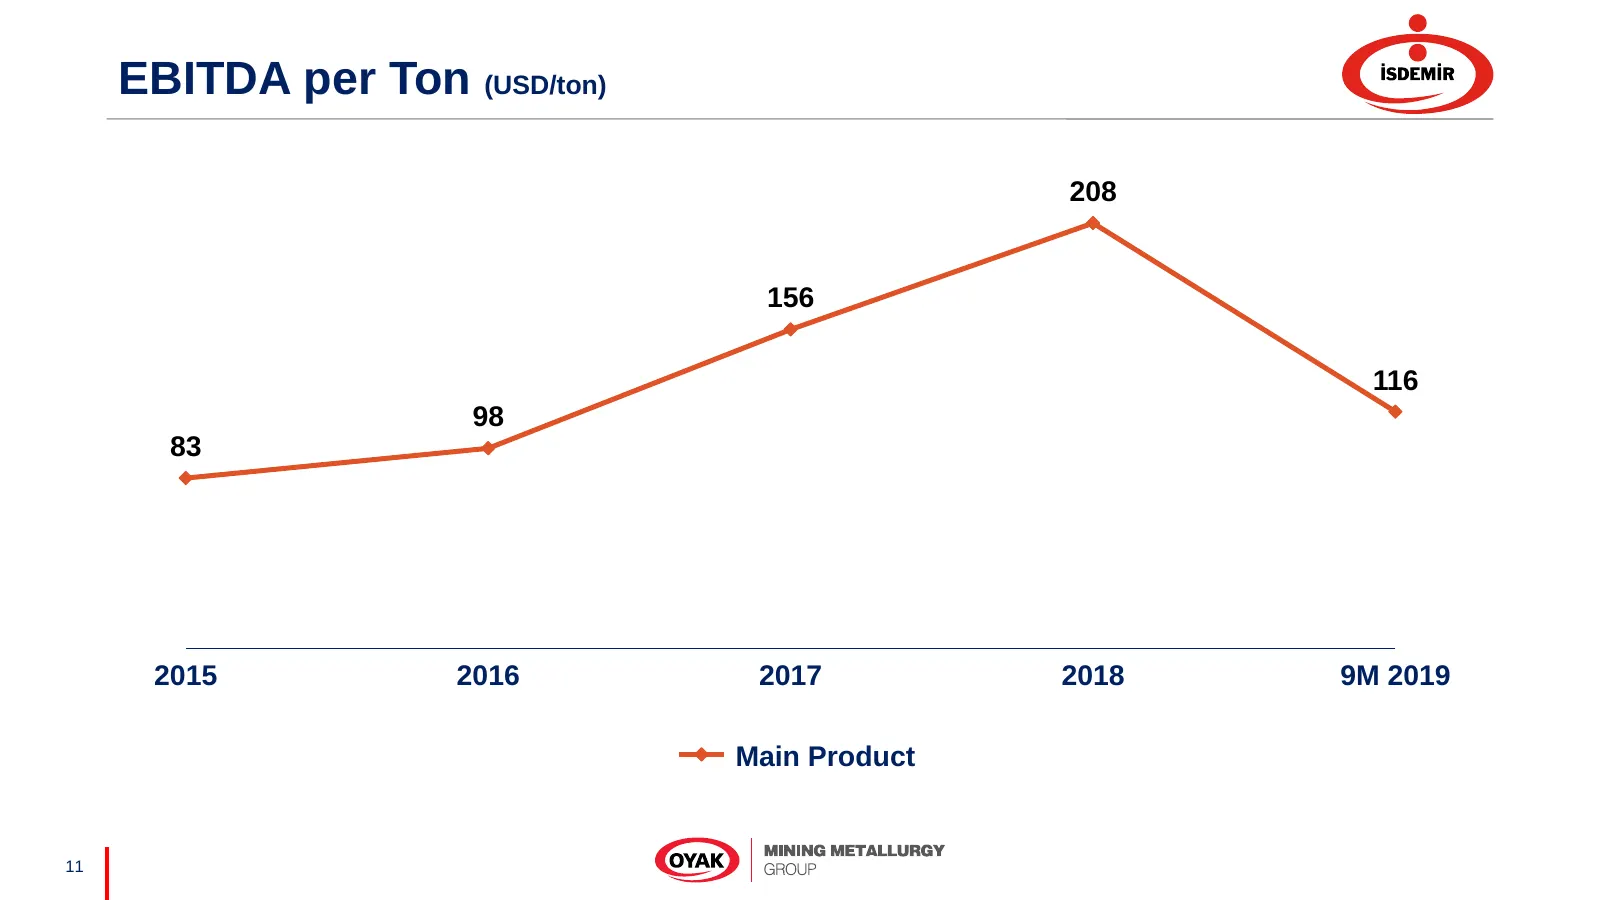
EBITDA per Ton (USD/ton) 208 156 116 98 83 2015 2016 2017 2018 9M 2019 Main Product 11
Slide 12: Cost of Sales Breakdown (%)
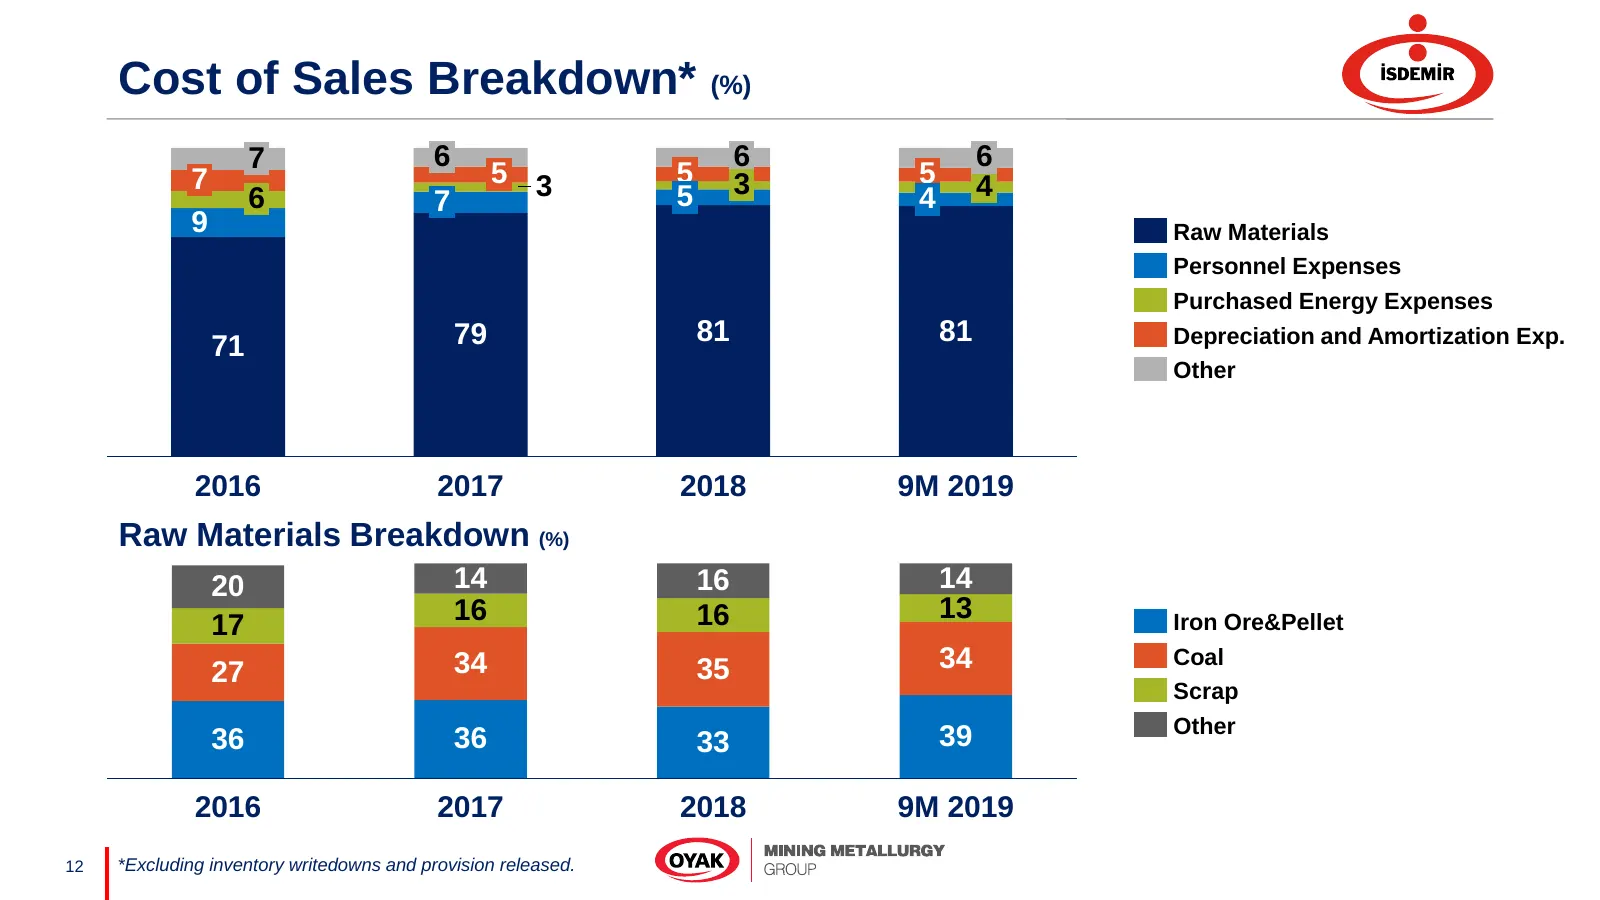
Cost of Sales Breakdown* (%) 7 6 6 6 7 5 3 5 3 5 4 6 7 5 4 9 Raw Materials Personnel Expenses Purchased Energy Expenses 79 81 81 Depreciation and Amortization Exp. 71 Other 2016 2017 2018 9M 2019 Raw Materials Breakdown (%) 20 14 16 14 16 16 13 Iron Ore&Pellet 17 27 34 35 34 Coal Scrap Other 36 36 3
Slide 13: Number of Employees
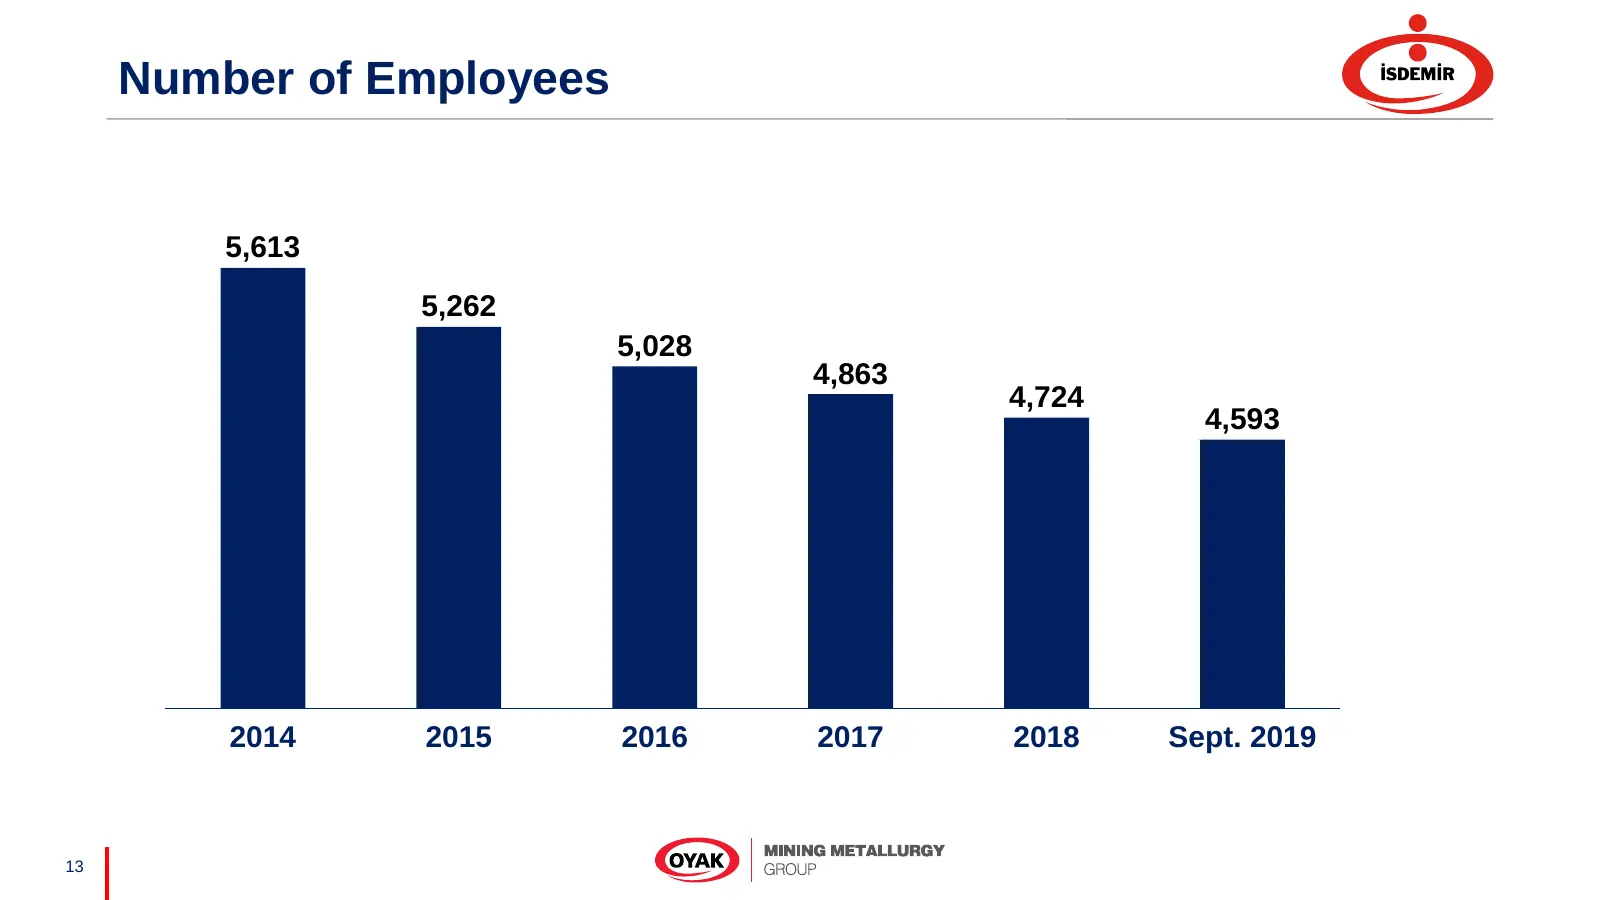
Number of Employees 5,613 5,262 5,028 4,863 4,724 4,593 2014 2015 2016 2017 2018 Sept. 2019 13
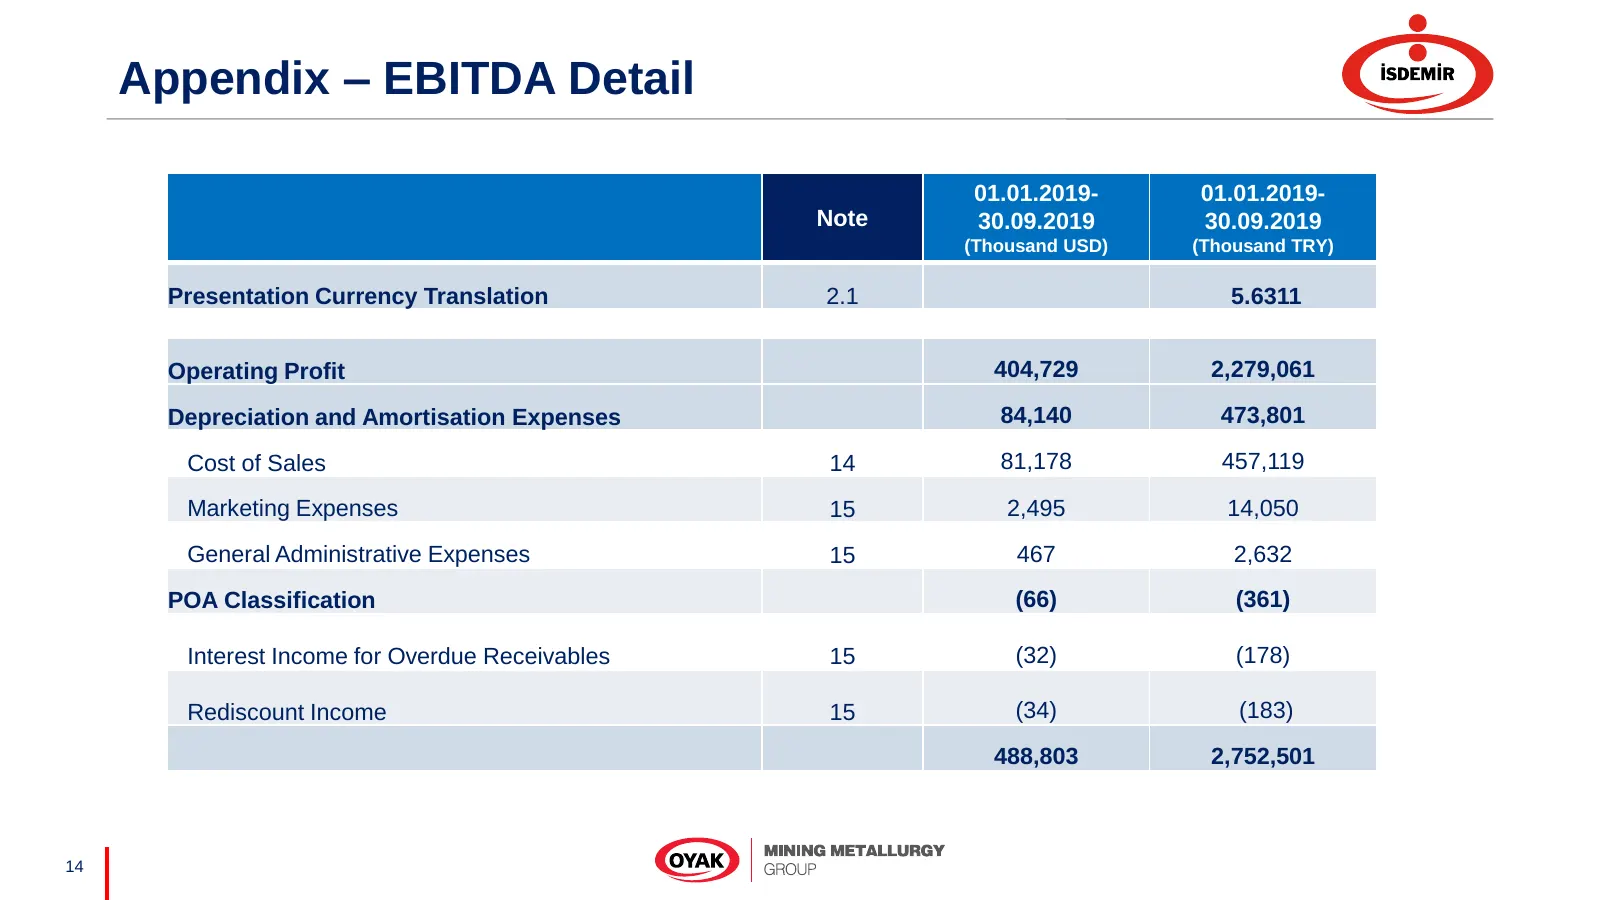
Slide 14: Appendix – EBITDA Detail
Appendix – EBITDA Detail 01.01.2019- 01.01.2019- Note 30.09.2019 30.09.2019 (Thousand USD) (Thousand TRY) Presentation Currency Translation 2.1 5.6311 Operating Profit 404,729 2,279,061 Depreciation and Amortisation Expenses 84,140 473,801 Cost of Sales 14 81,178 457,119 Marketing Expenses 15 2,495
Slide 15: İsdemir Investor Relations
İsdemir Investor Relations investorrelations@erdemir.com.tr www.isdemir.com.tr/yatirimcilar/ +90 216 578 80 61 15
Source: company website
More decks from Iskenderun Demir ve Celik AS
 H1 2026 Earnings Presentation12 slides · Aug 6, 2026
 Q1 2026 Earnings Presentation12 slides · Apr 28, 2026
 FY2025 Earnings Presentation12 slides · Feb 17, 2026
 9M 2025 Earnings Presentation12 slides · Oct 20, 2025
 H1 2025 Earnings Presentation12 slides · Aug 6, 2025
 Q1 2025 Earnings Presentation12 slides · Apr 29, 2025