Axelum Resources Corp. · PSE:AXLM
Axelum Resources — Q3 2019 Earnings Presentation
10 slides from Axelum Resources's earnings presentation, Nov 19, 2019
Slide 1: Analysts' Briefing: 3rd Quarter 2019 Earnings Results
Analysts’ Briefing 3rd Quarter 2019 Earnings Results November 19, 2019
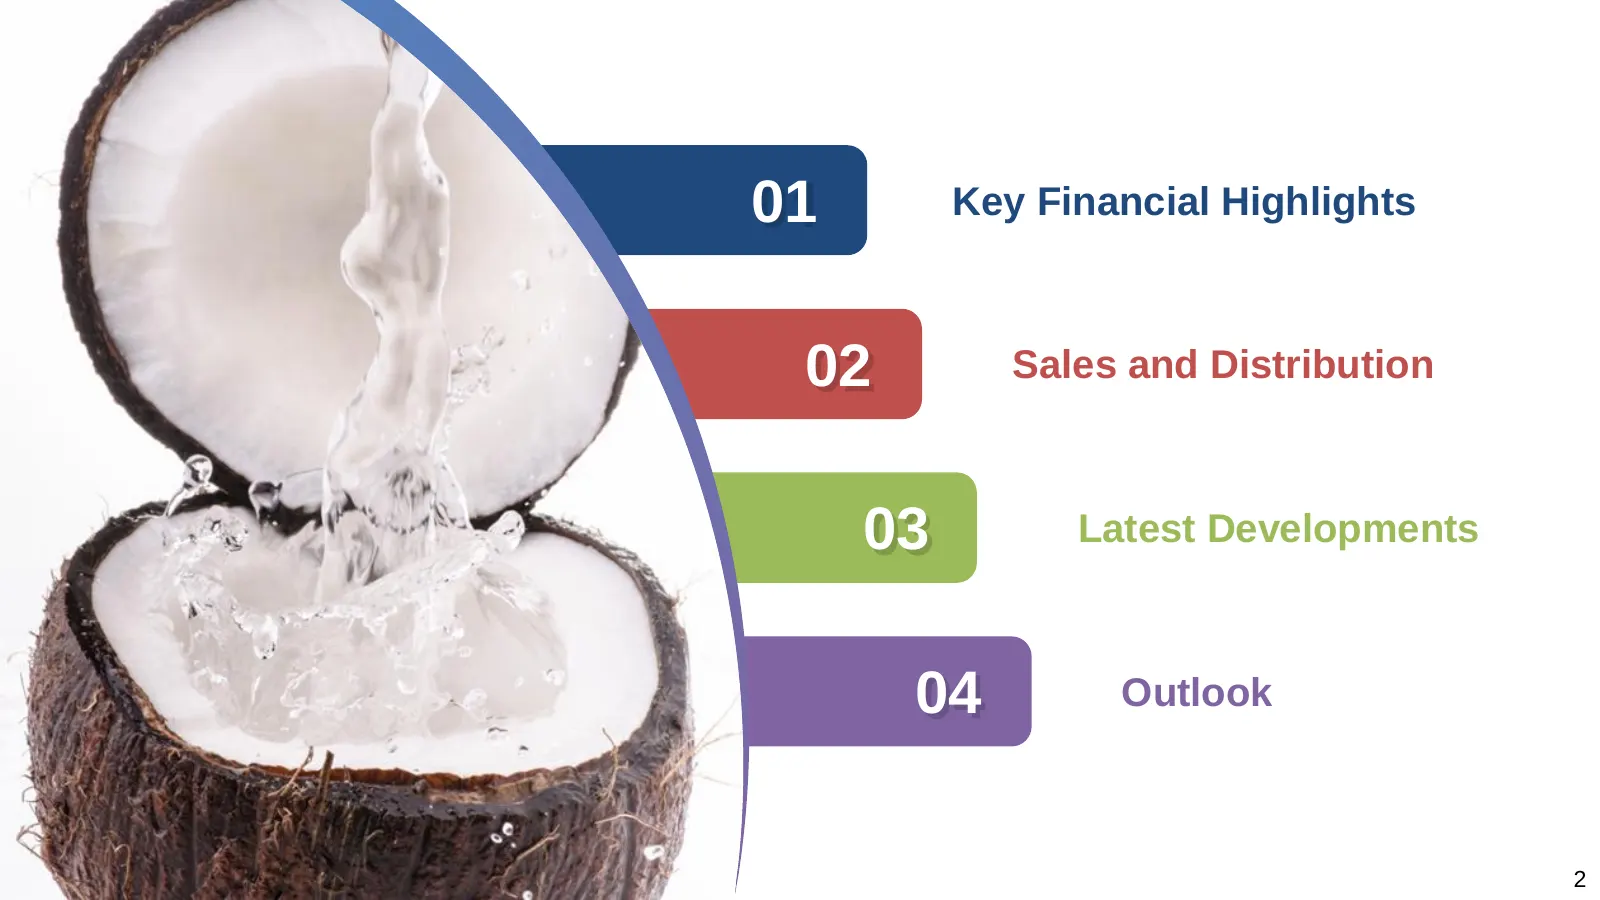
Slide 2: Agenda
01 Key Financial Highlights 02 Sales and Distribution 03 Latest Developments 04 Outlook 2
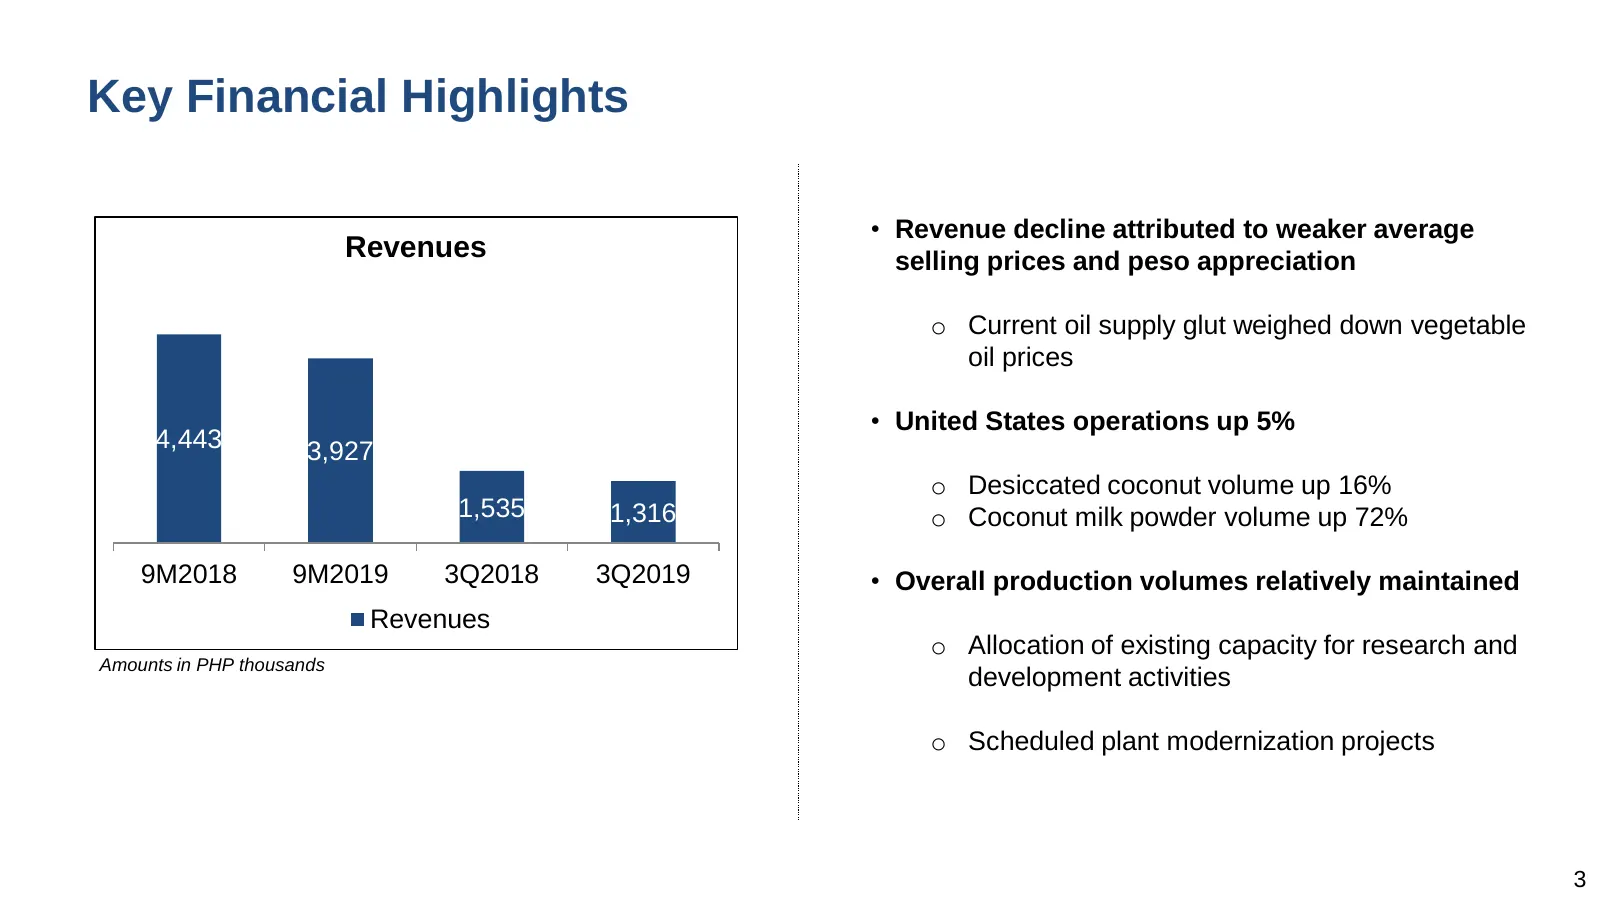
Slide 3: Key Financial Highlights
Key Financial Highlights • Revenue decline attributed to weaker average Revenues selling prices and peso appreciation o Current oil supply glut weighed down vegetable oil prices • United States operations up 5% 4,443 3,927 o Desiccated coconut volume up 16% 1,535 1,316 o Coconut milk powder volume u
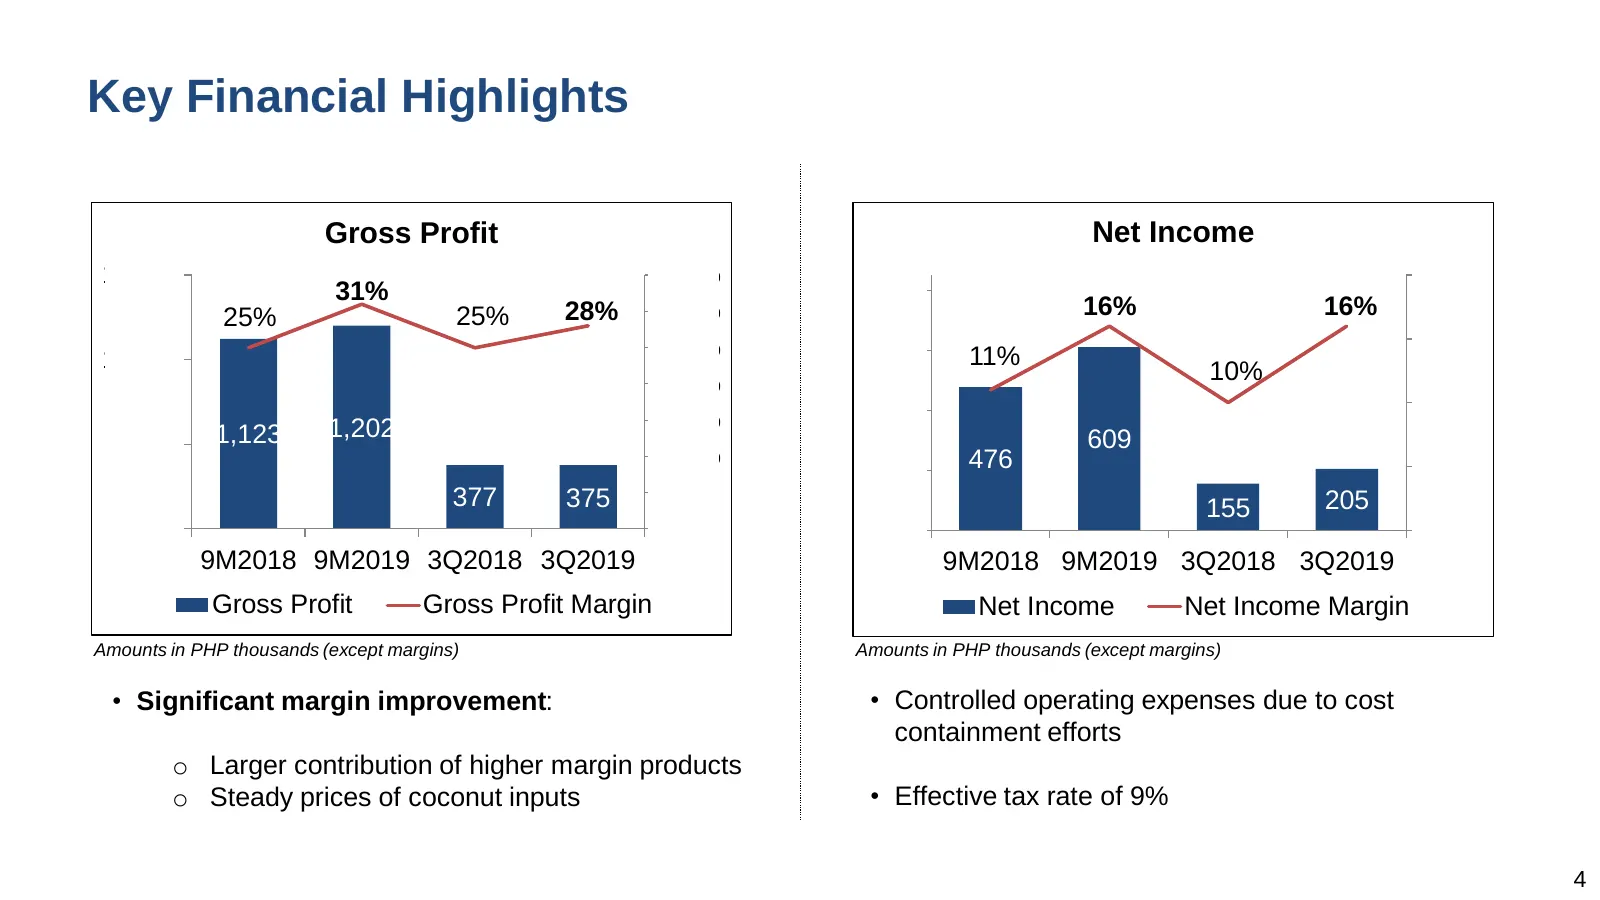
Slide 4: Key Financial Highlights
Key Financial Highlights Gross Profit Net Income 1,500 35% 20% 31% 800 25% 25% 28% 30% 16% 16% 25% 600 15% 1,000 11% 20% 10% 00 00 10% 00 15% 00 400 1,123 1,202 0 609 00 500 00 10% 00 476 200 5% 377 375 5% 205 155 0 0% 0 0% 9M2018 9M2019 3Q2018 3Q2019 9M2018 9M2019 3Q2018 3Q2019 Gross Profit Gross P
Slide 5: Balance Sheet
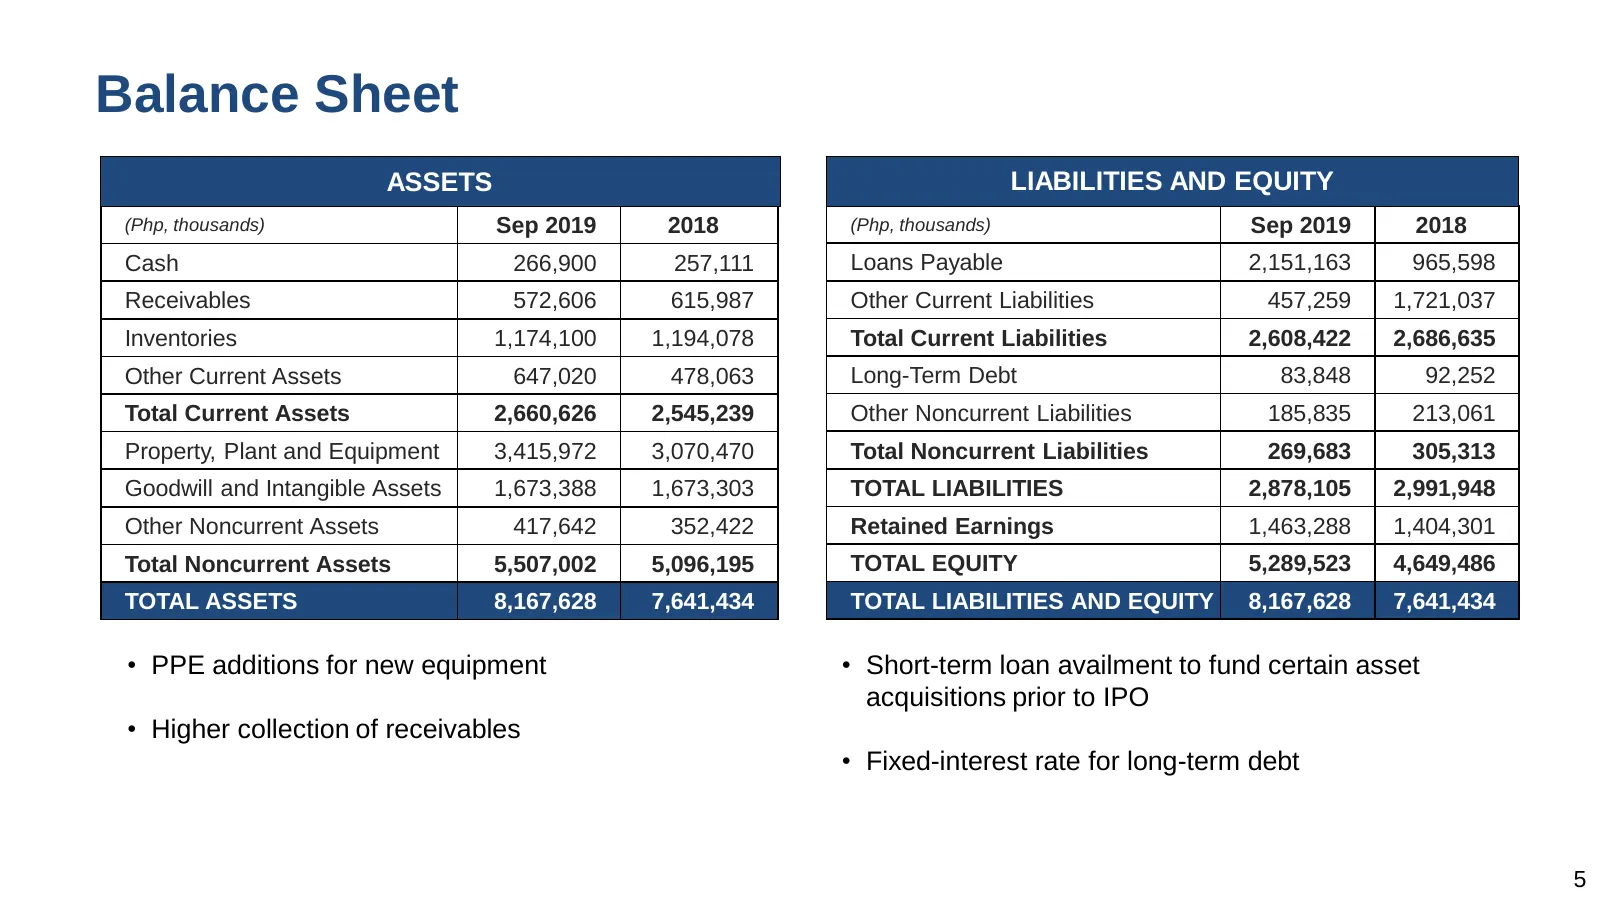
Balance Sheet ASSETS LIABILITIES AND EQUITY (Php, thousands) Sep 2019 2018 (Php, thousands) Sep 2019 2018 Cash 266,900 257,111 Loans Payable 2,151,163 965,598 Receivables 572,606 615,987 Other Current Liabilities 457,259 1,721,037 Inventories 1,174,100 1,194,078 Total Current Liabilities 2,608,422 2
Slide 6: Cashflow and Key Ratios
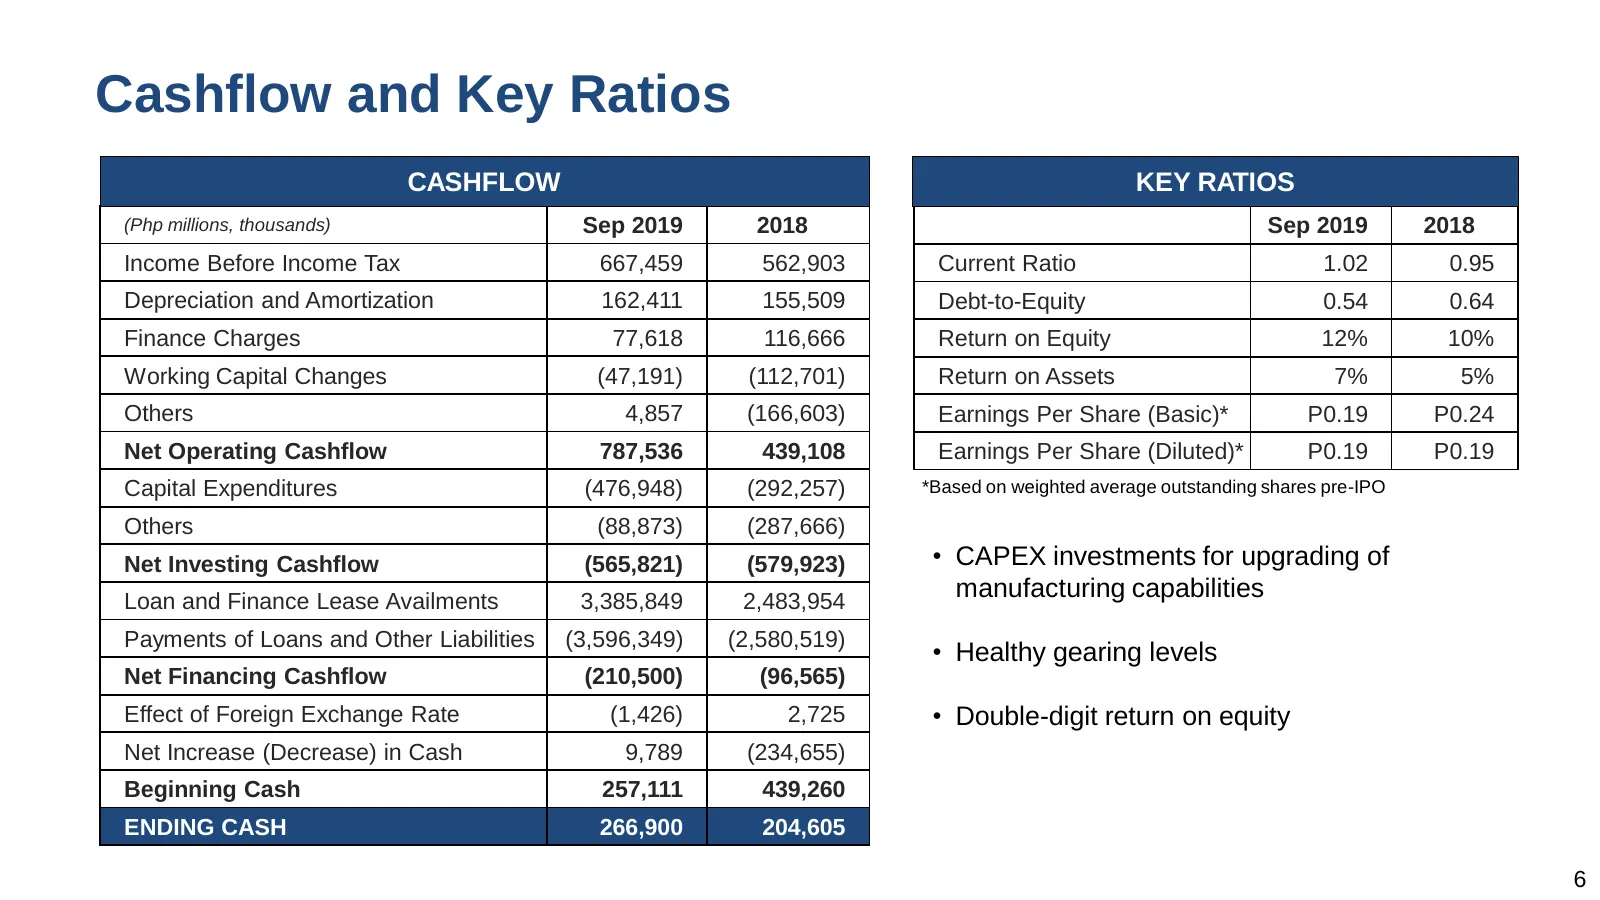
Cashflow and Key Ratios CASHFLOW KEY RATIOS (Php millions, thousands) Sep 2019 2018 Sep 2019 2018 Income Before Income Tax 667,459 562,903 Current Ratio 1.02 0.95 Depreciation and Amortization 162,411 155,509 Debt-to-Equity 0.54 0.64 Finance Charges 77,618 116,666 Return on Equity 12% 10% Working Ca
Slide 7: Product Contribution and Area Sales
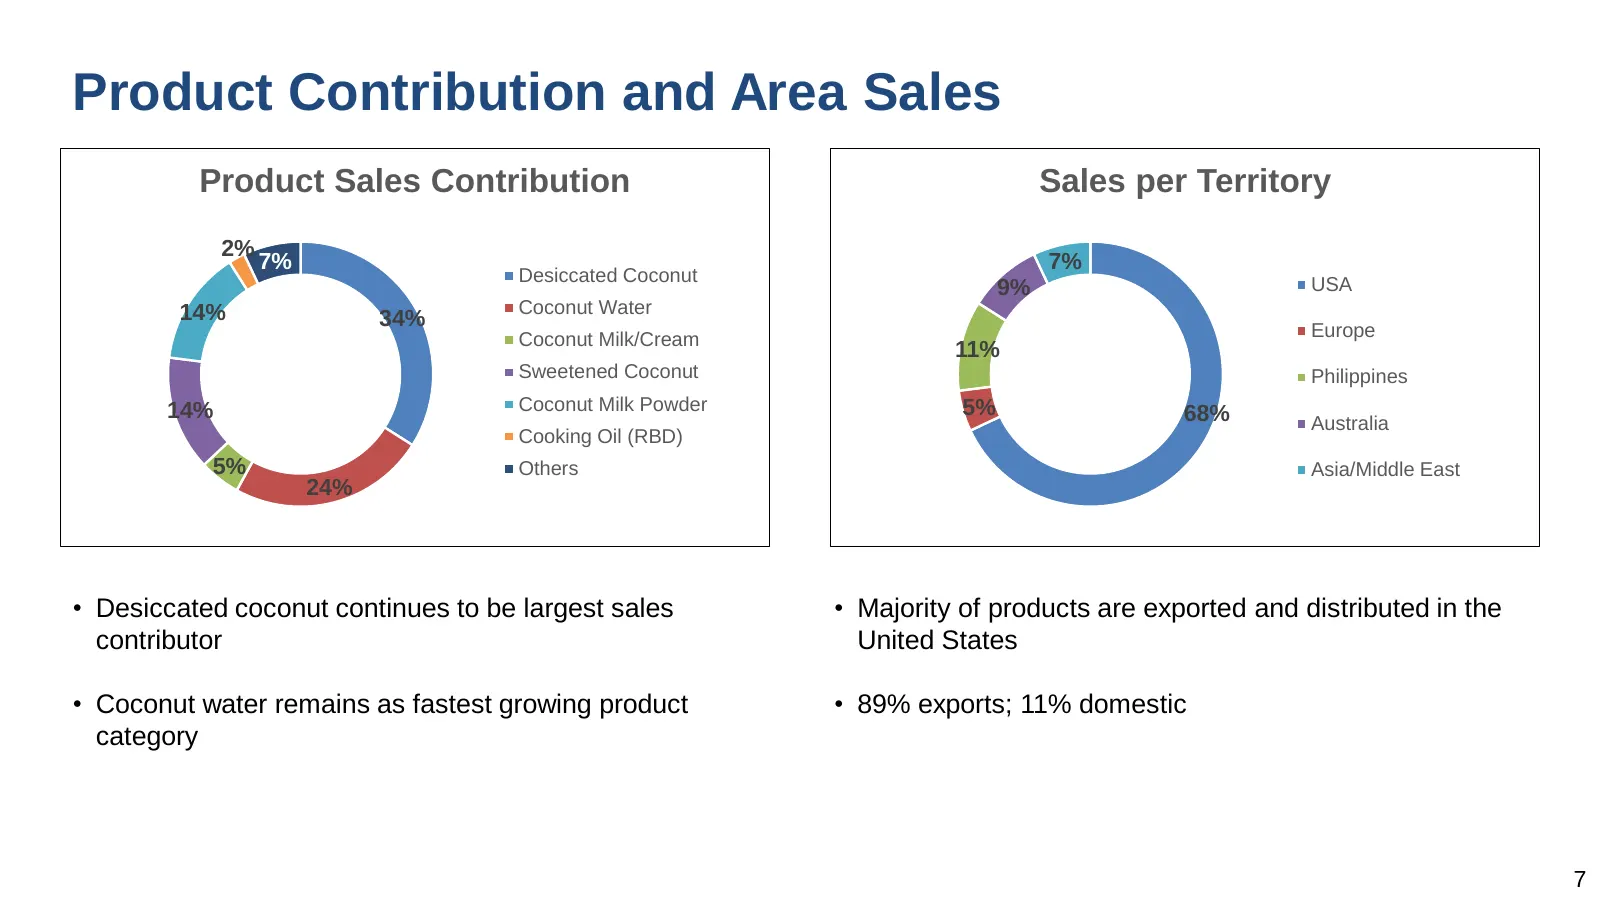
Product Contribution and Area Sales Product Sales Contribution Sales per Territory 2% 7% 7% Desiccated Coconut USA 9% 14% Coconut Water 34% Europe Coconut Milk/Cream 11% Sweetened Coconut Philippines 14% Coconut Milk Powder 5% 68% Australia Cooking Oil (RBD) 5% Others Asia/Middle East 24% • Desiccat
Slide 8: Distribution Network
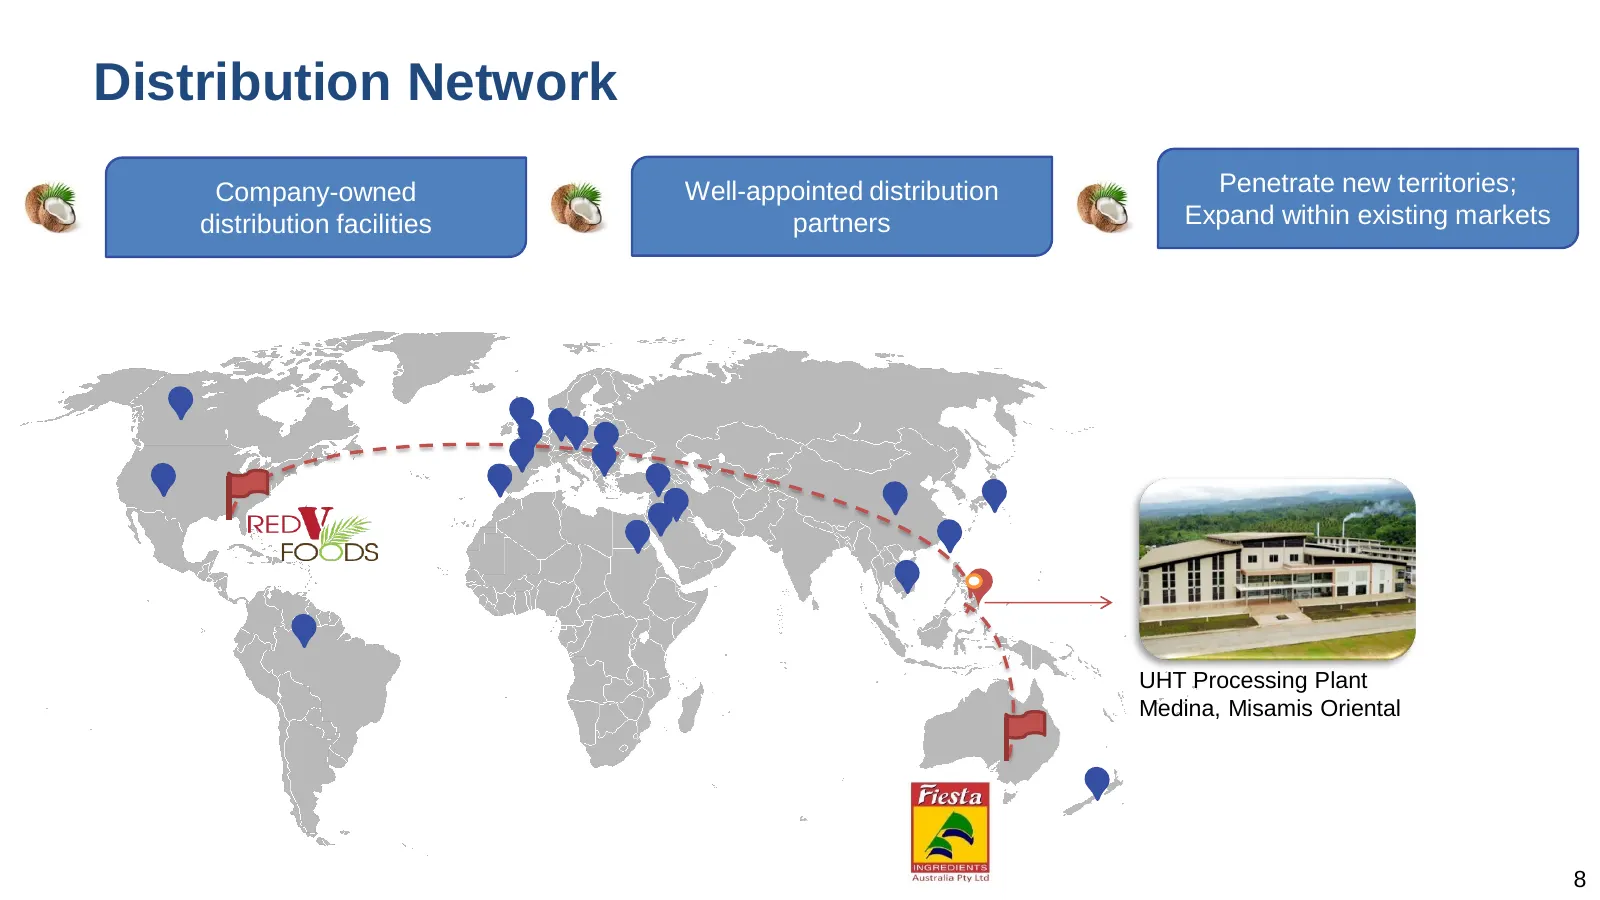
Distribution Network Company-owned Well-appointed distribution Penetrate new territories; distribution facilities partners Expand within existing markets UHT Processing Plant Medina, Misamis Oriental 8
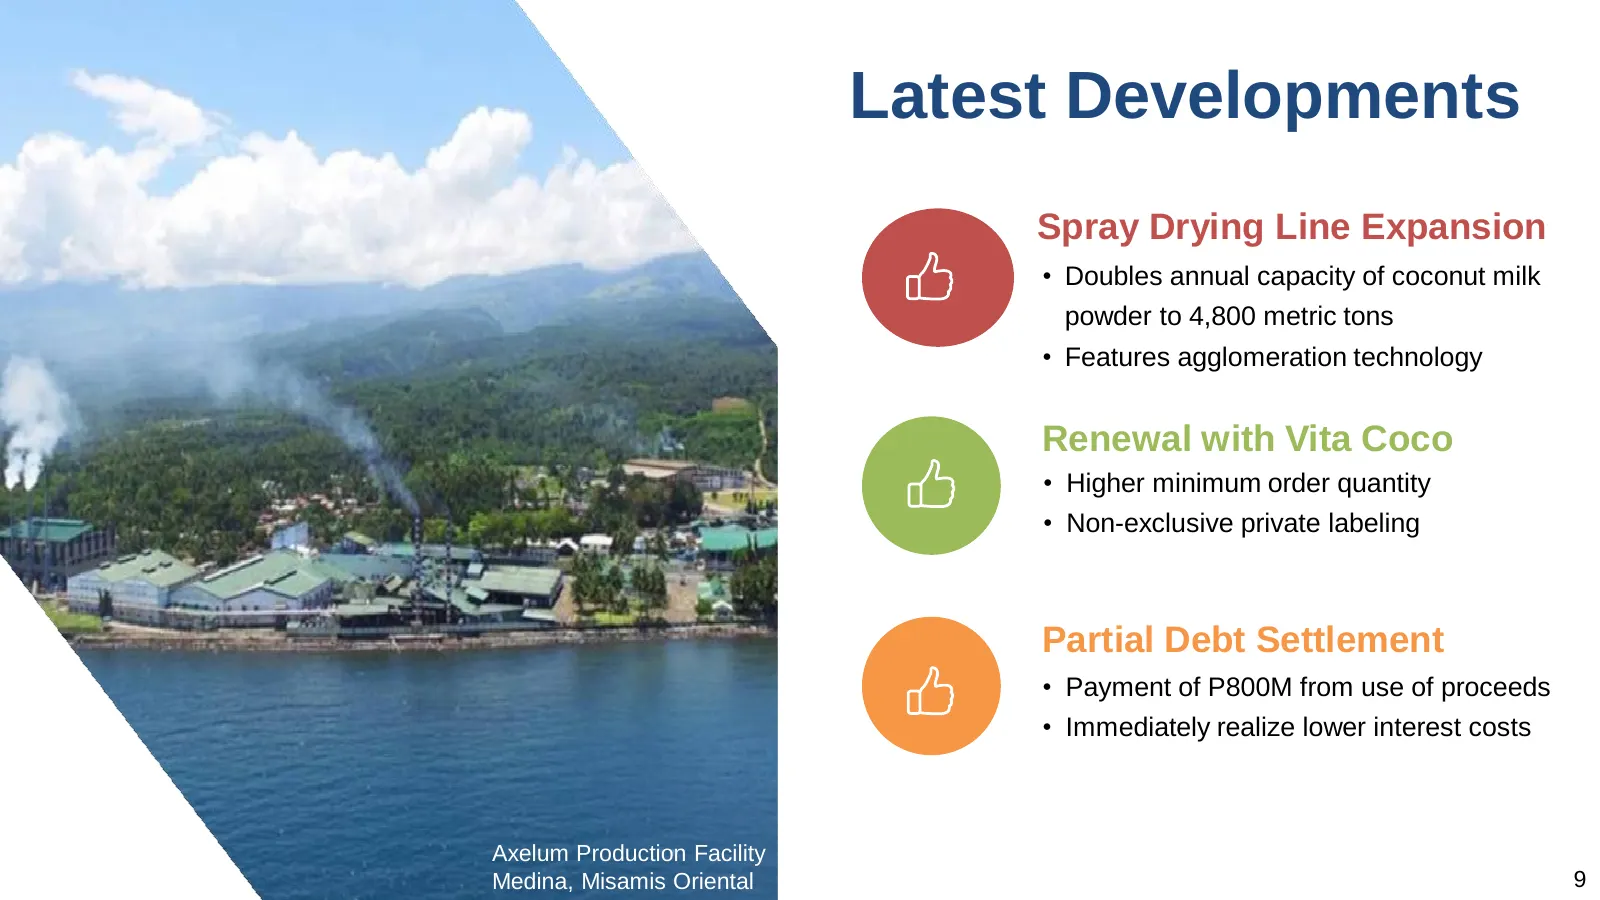
Slide 9: Latest Developments
Latest Developments Spray Drying Line Expansion • Doubles annual capacity of coconut milk powder to 4,800 metric tons • Features agglomeration technology Renewal with Vita Coco • Higher minimum order quantity • Non-exclusive private labeling Partial Debt Settlement • Payment of P800M from use of pro
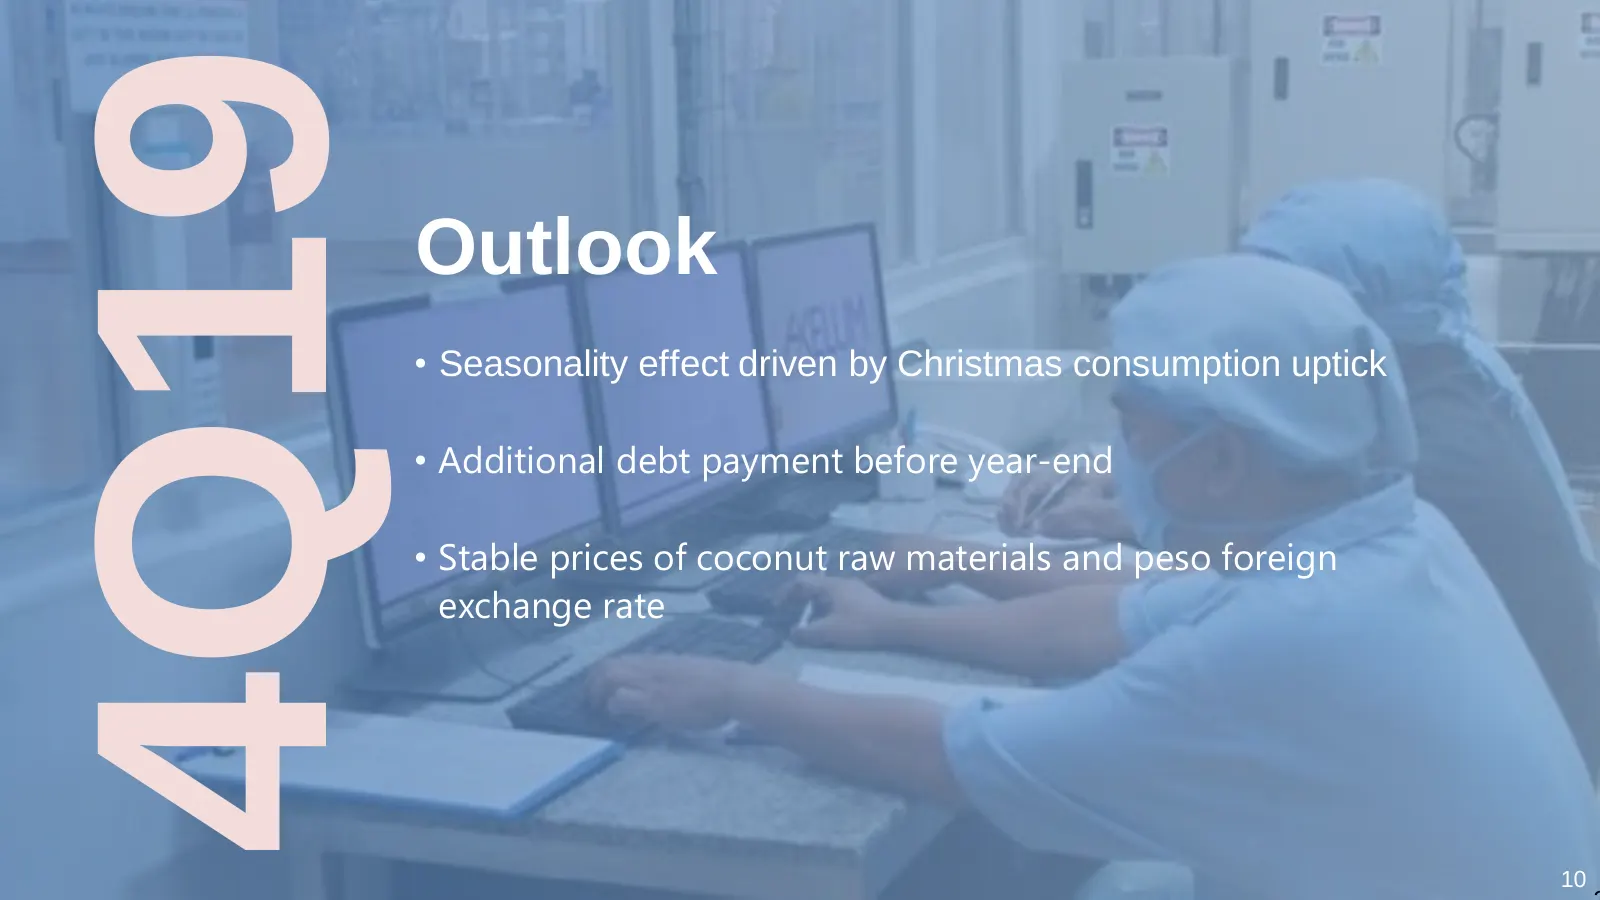
Slide 10: 4Q19 Outlook
4Q19 Outlook • Seasonality effect driven by Christmas consumption uptick • Additional debt payment before year-end • Stable prices of coconut raw materials and peso foreign exchange rate 10
Source: Internet Archive copy of axelum.ph
More decks from Axelum Resources Corp.
 Q1 2026 Earnings Presentation7 slides · Jun 1, 2026
 FY2025 Earnings Presentation7 slides · April 2026
 9M 2025 Earnings Presentation7 slides · November 2025
 H1 2025 Earnings Presentation7 slides · August 2025
 Q1 2025 Earnings Presentation7 slides · May 2025
 FY2024 Earnings Presentation7 slides · April 2025