Nickel Asia Corp. · PSE:NIKL
Nickel Asia — 9M2026 Earnings Presentation
30 slides from Nickel Asia's earnings presentation, Nov 19, 2026

Slide 1: 9M2026 Earnings Briefing
9M2026 EARNINGS BRIEFING November 19, 2026
Slide 2: Disclaimer
DISCLAIMER This presentation and the information contained herein as well as the materials distributed herewith ("Presentation") are the sole and exclusive property of Nickel Asia Corporation ("NAC") and shall only be used for the purpose intended herein. This Presentation is not intended to provide
Slide 3: NIKL and NAC Energy 9M26 Highlights
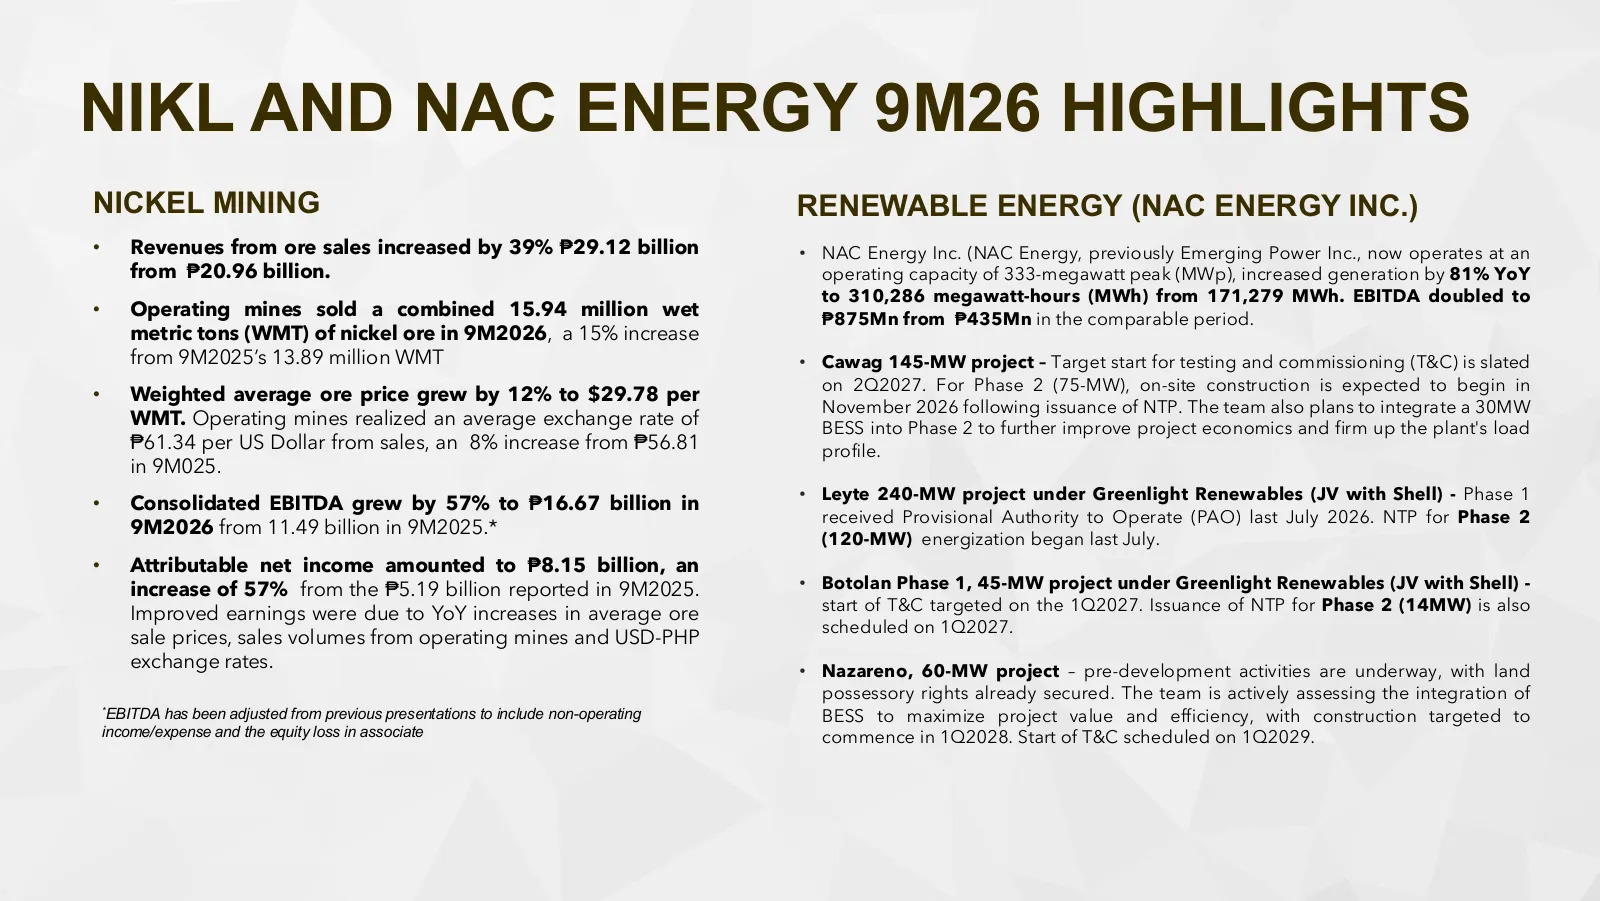
NIKL AND NAC ENERGY 9M26 HIGHLIGHTS NICKEL MINING RENEWABLE ENERGY (NAC ENERGY INC.) • Revenues from ore sales increased by 39% ₱29.12 billion • NAC Energy Inc. (NAC Energy, previously Emerging Power Inc., now operates at an from ₱20.96 billion. operating capacity of 333-megawatt peak (MWp), increas

Slide 4: Financial Highlights
FINANCIAL HIGHLIGHTS
Slide 5: Financial Highlights (9M26 vs 9M25)
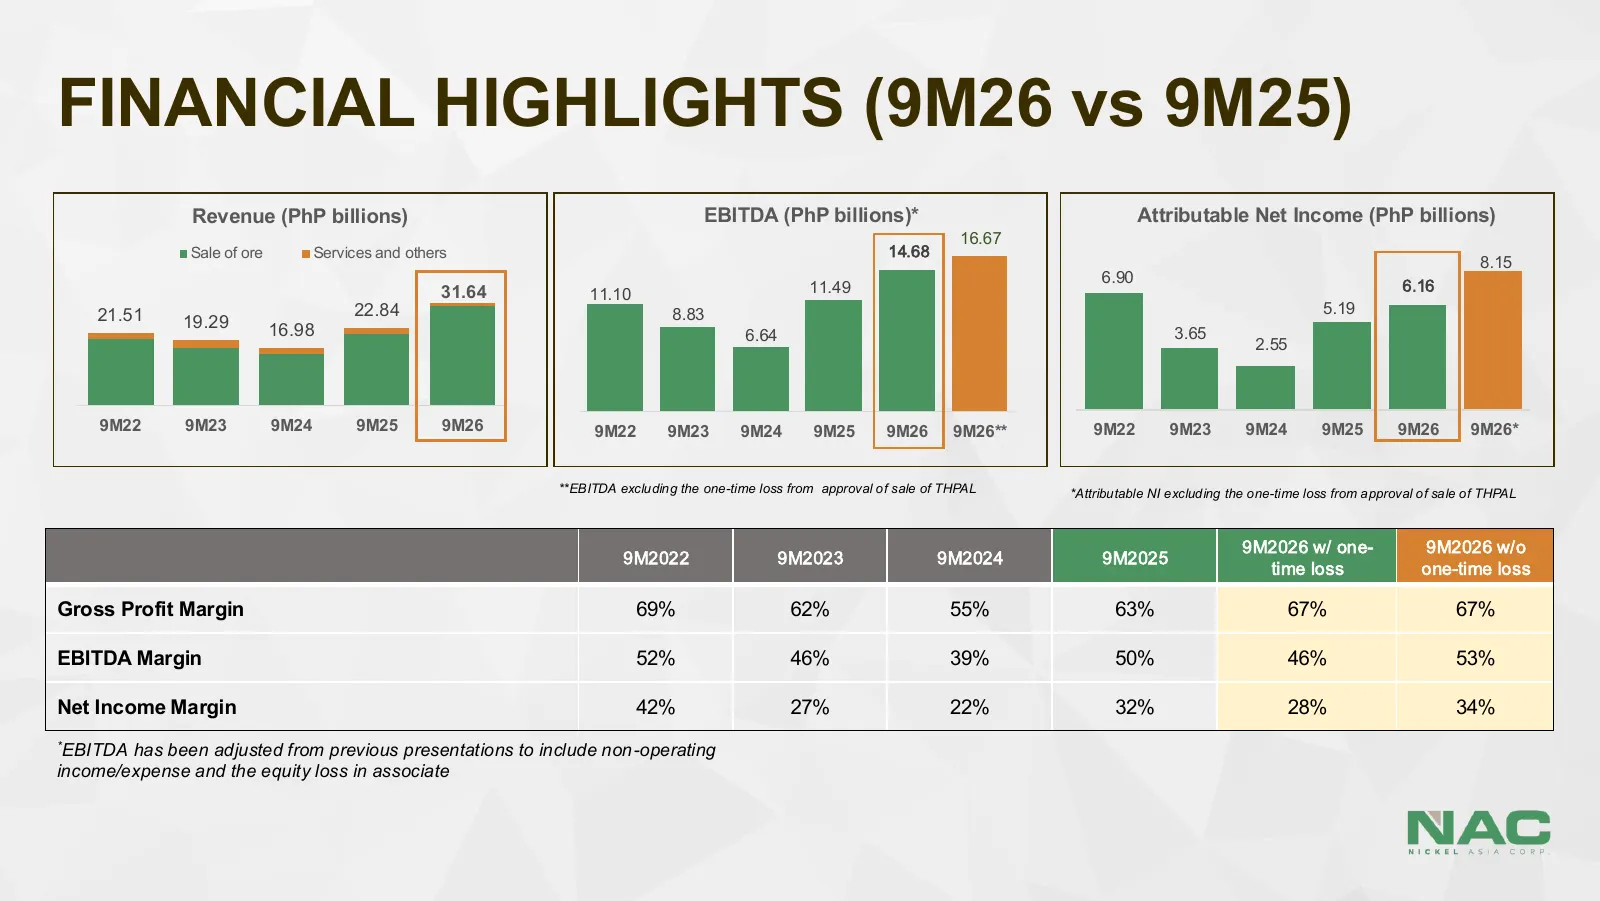
FINANCIAL HIGHLIGHTS (9M26 vs 9M25) Revenue (PhP billions) EBITDA (PhP billions)* Attributable Net Income (PhP billions) 16.67 Sale of ore Services and others 14.68 8.15 6.90 6.16 31.64 11.10 11.49 21.51 22.84 8.83 5.19 19.29 16.98 6.64 3.65 2.55 9M22 9M23 9M24 9M25 9M26 9M22 9M23 9M24 9M25 9M26 9M2

Slide 6: Nickel Mining Performance
NICKEL MINING PERFORMANCE NICKEL ASIA CORP
Slide 7: Mining Highlights (9M26 vs 9M25)
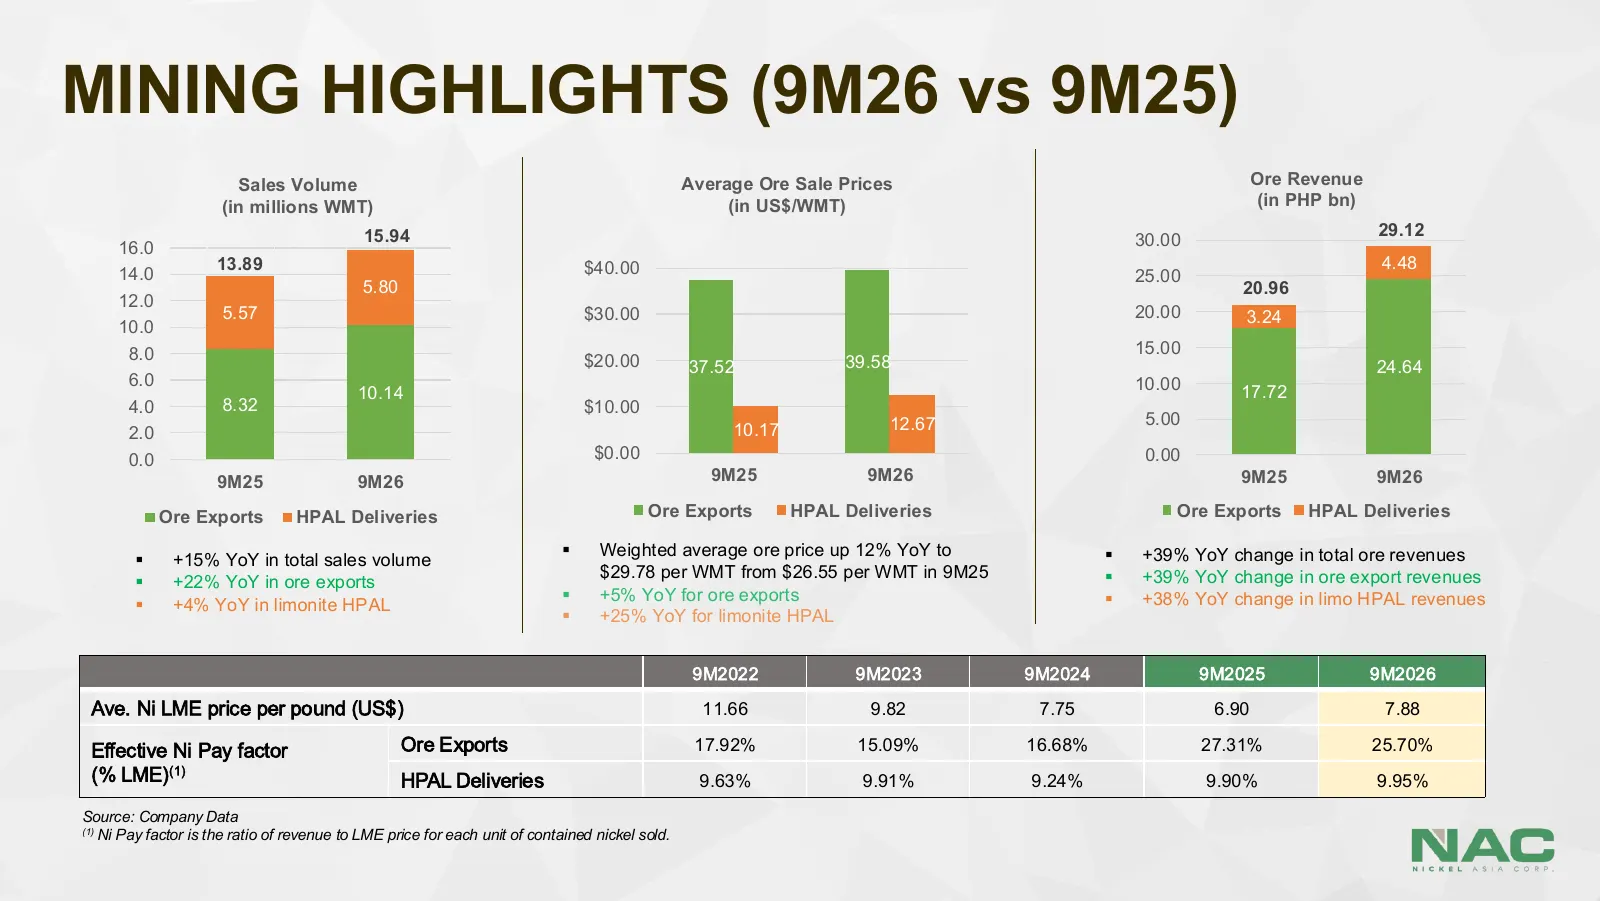
MINING HIGHLIGHTS (9M26 vs 9M25) Sales Volume Average Ore Sale Prices Ore Revenue (in millions WMT) (in US$/WMT) (in PHP bn) 15.94 29.12 16.0 30.00 13.89 $40.00 4.48 14.0 25.00 5.80 20.96 12.0 5.57 $30.00 20.00 3.24 10.0 8.0 15.00 $20.00 37.52 39.58 24.64 6.0 10.00 10.14 17.72 4.0 8.32 $10.00 12.67
Slide 8: Revenue – Variance Analysis
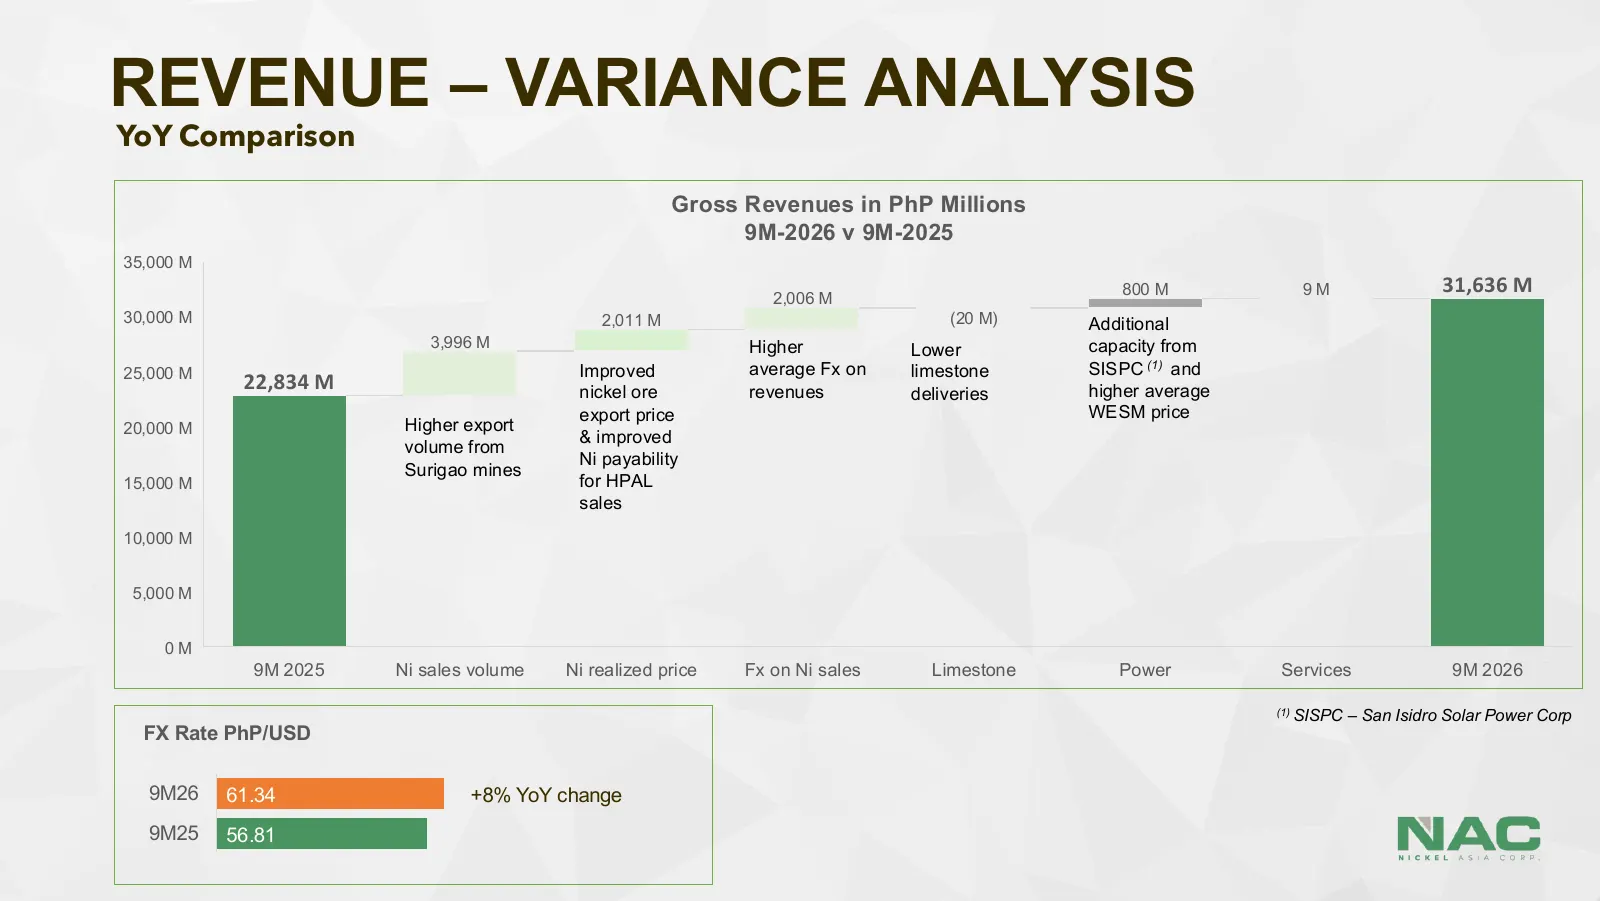
REVENUE – VARIANCE ANALYSIS YoY Comparison Gross Revenues in PhP Millions 9M-2026 v 9M-2025 35,000 M 800 M 9M 31,636 M 2,006 M 30,000 M 2,011 M (20 M) Additional 3,996 M Higher Lower capacity from 25,000 M Improved average Fx on limestone SISPC (1) and 22,834 M nickel ore revenues deliveries higher
Slide 9: Cost & Expenses – Variance Analysis
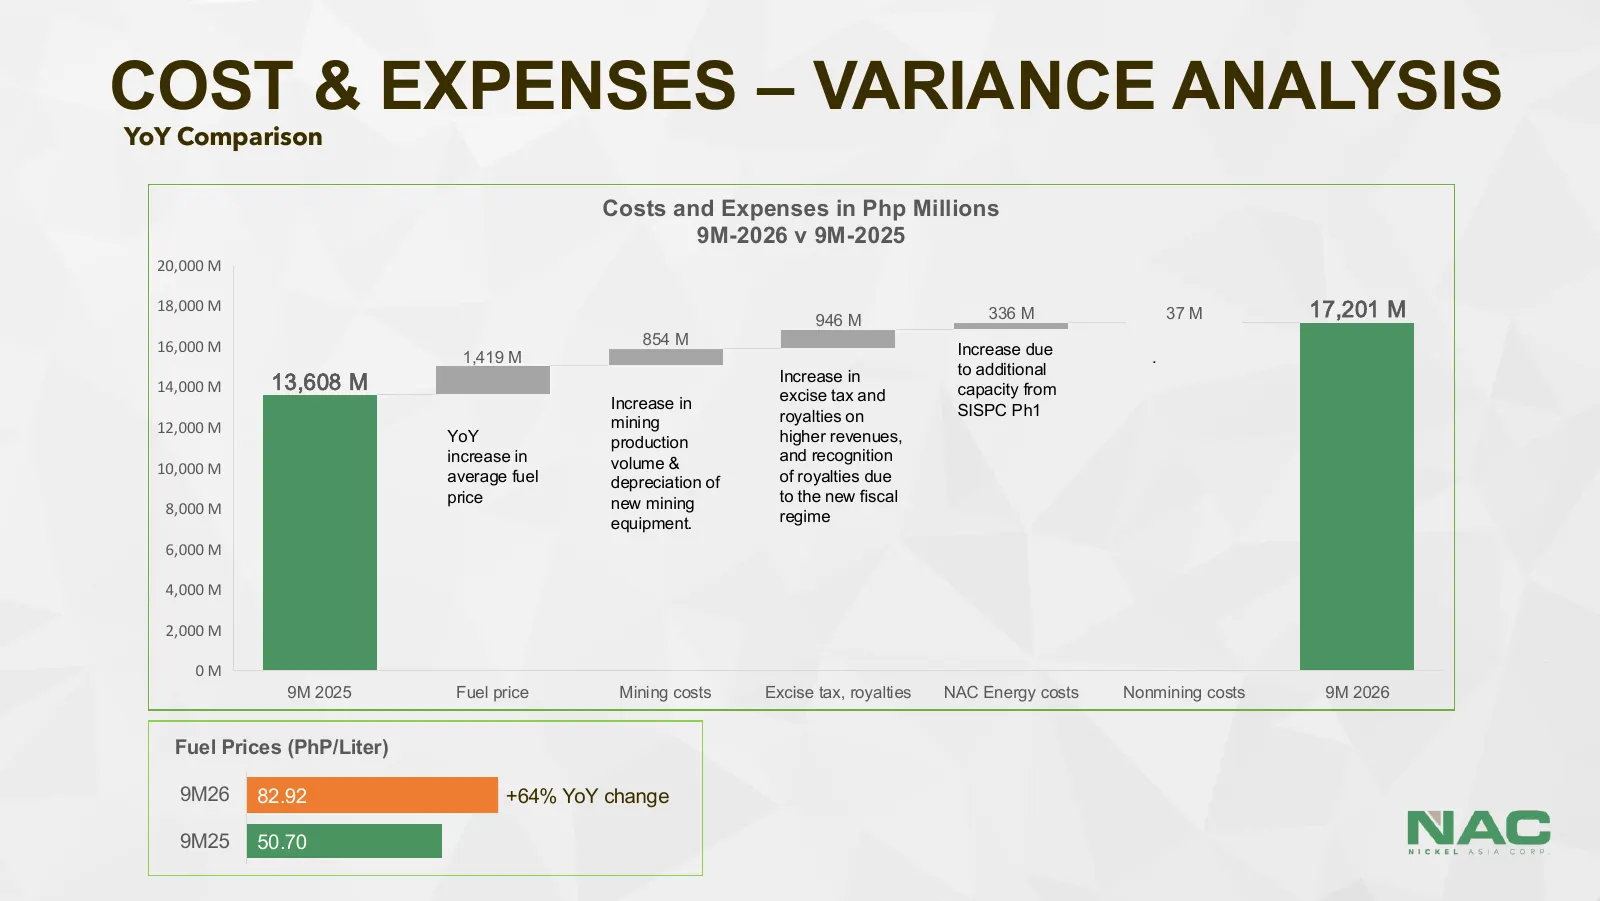
COST & EXPENSES – VARIANCE ANALYSIS YoY Comparison Costs and Expenses in Php Millions 9M-2026 v 9M-2025 20,000 M 18,000 M 946 M 336 M 37 M 17,201 M 16,000 M 854 M 1,419 M Increase due . Increase in to additional 14,000 M 13,608 M capacity from Increase in excise tax and royalties on SISPC Ph1 12,000
Slide 10: Balance Sheet Highlights
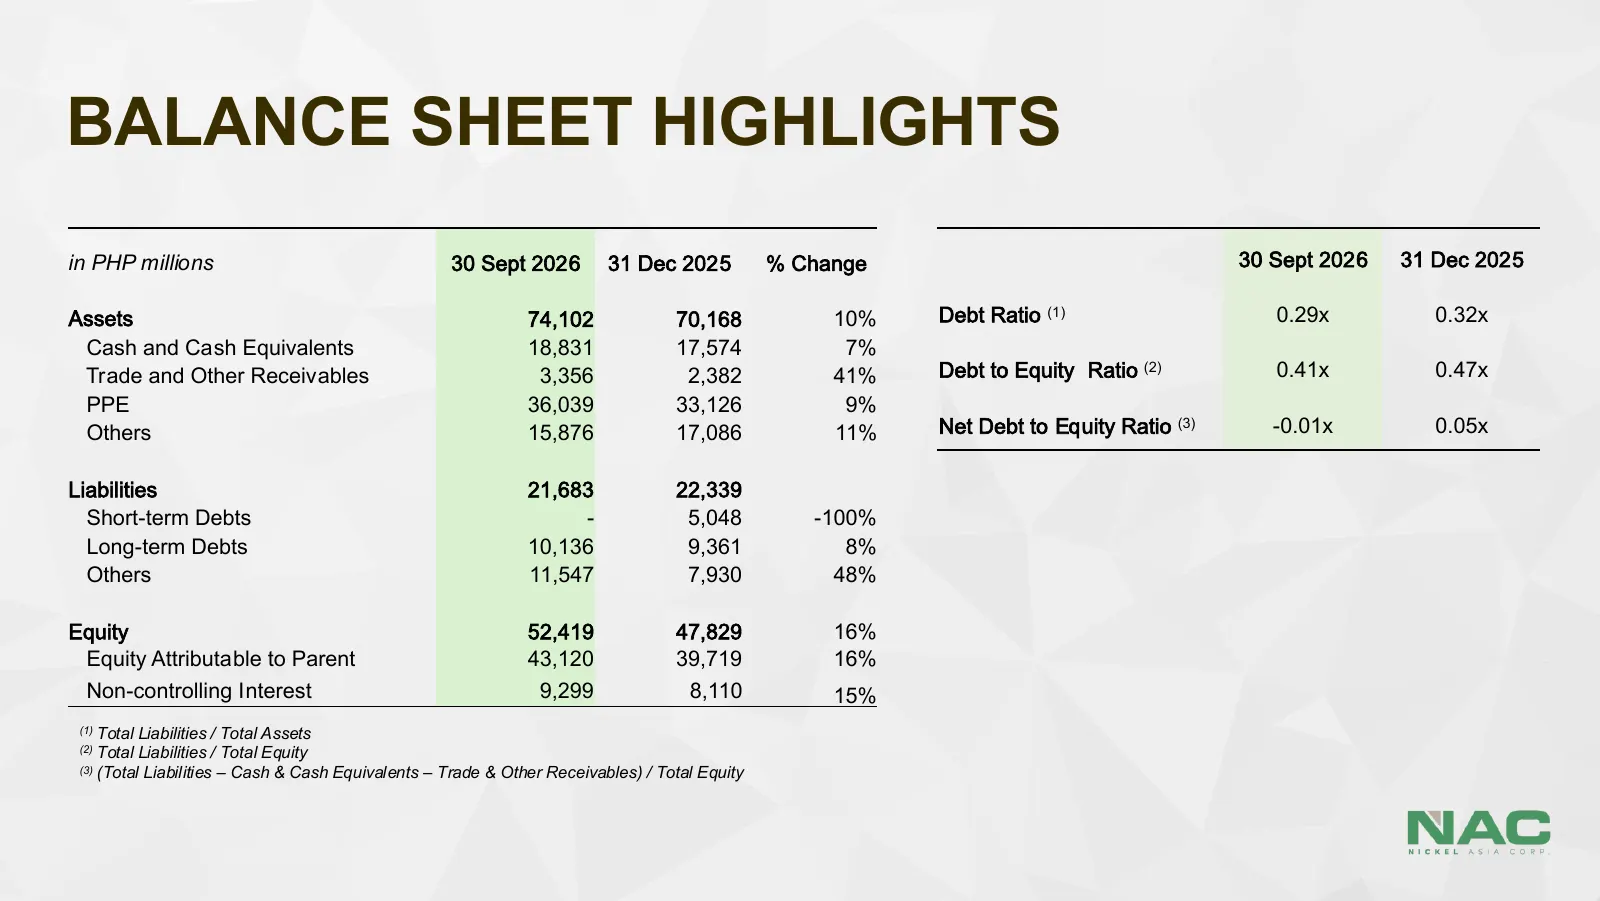
BALANCE SHEET HIGHLIGHTS in PHP millions 30 Sept 2026 31 Dec 2025 % Change 30 Sept 2026 31 Dec 2025 Assets 74,102 70,168 10% Debt Ratio (1) 0.29x 0.32x Cash and Cash Equivalents 18,831 17,574 7% Trade and Other Receivables 3,356 2,382 41% Debt to Equity Ratio (2) 0.41x 0.47x PPE 36,039 33,126 9% Oth
Slide 11: THPAL: From Equity Earnings to Losses
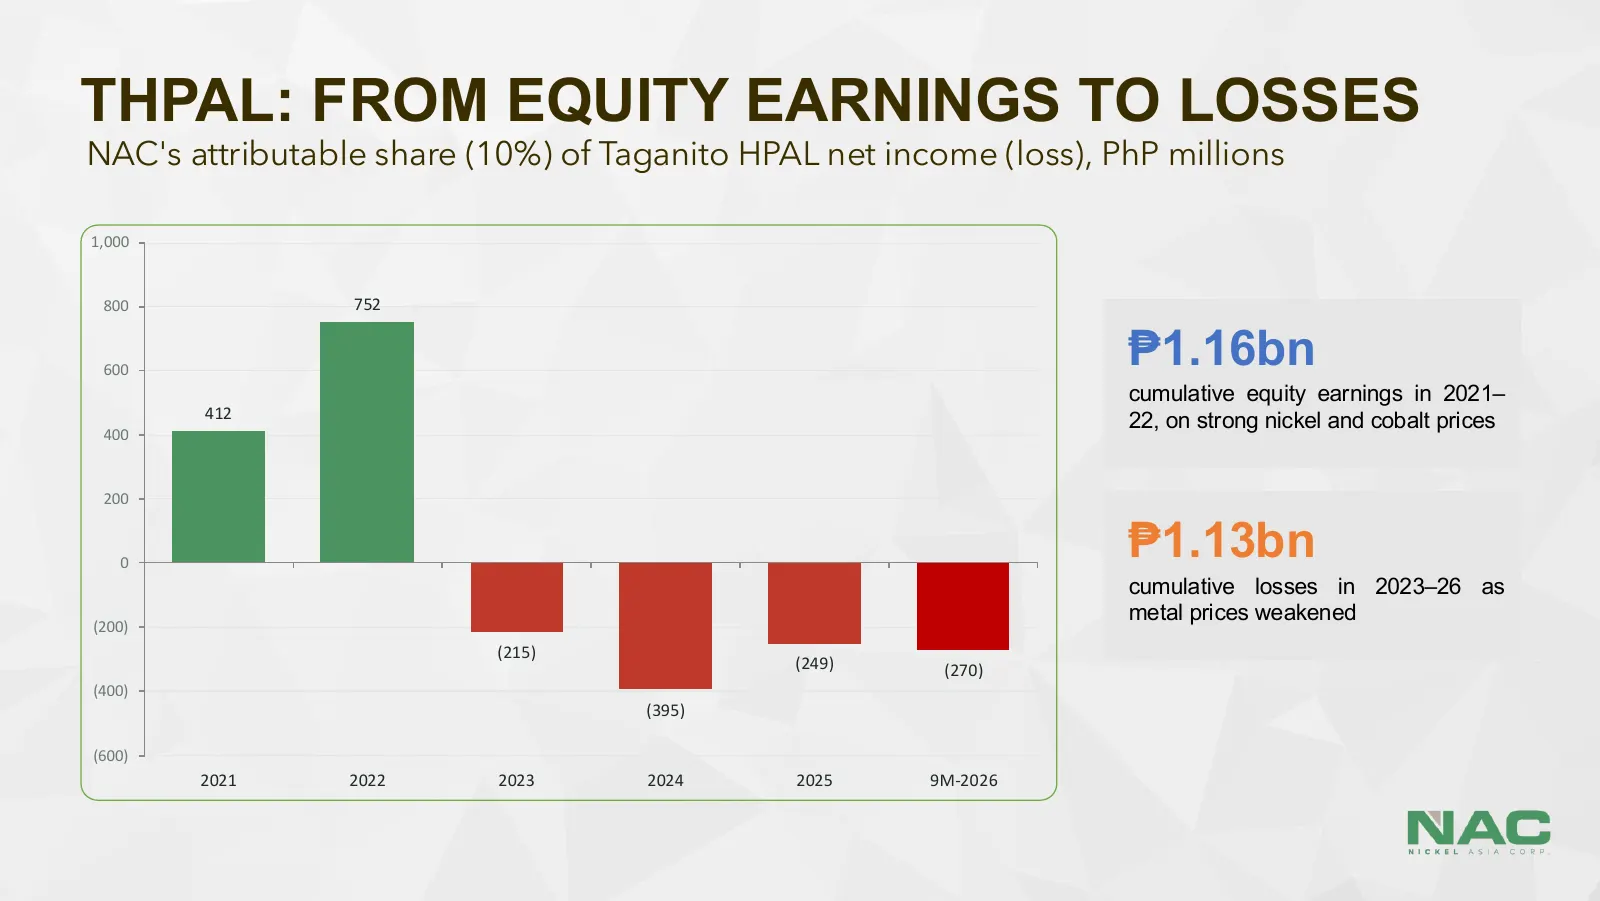
THPAL: FROM EQUITY EARNINGS TO LOSSES NAC's attributable share (10%) of Taganito HPAL net income (loss), PhP millions 1,000 800 752 600 ₱1.16bn cumulative equity earnings in 2021– 412 22, on strong nickel and cobalt prices 400 200 0 ₱1.13bn cumulative losses in 2023–26 as metal prices weakened (200)
Slide 12: THPAL: From Equity Earnings to Losses
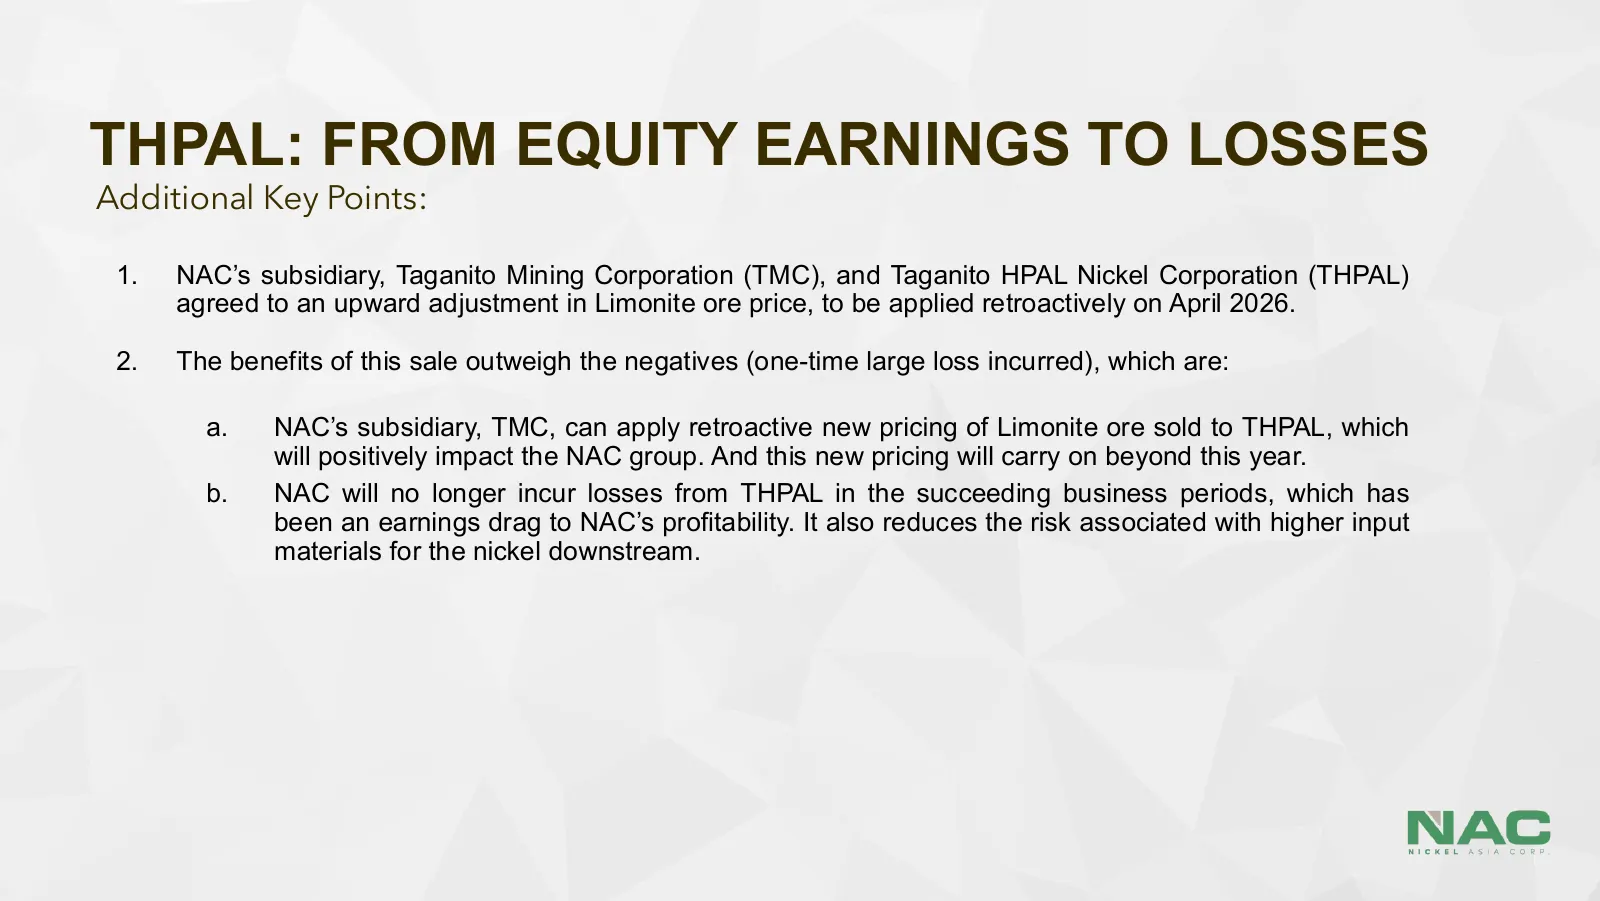
THPAL: FROM EQUITY EARNINGS TO LOSSES Additional Key Points: 1. NAC’s subsidiary, Taganito Mining Corporation (TMC), and Taganito HPAL Nickel Corporation (THPAL) agreed to an upward adjustment in Limonite ore price, to be applied retroactively on April 2026. 2. The benefits of this sale outweigh the
Slide 13: Cash Dividends Declared in 2026
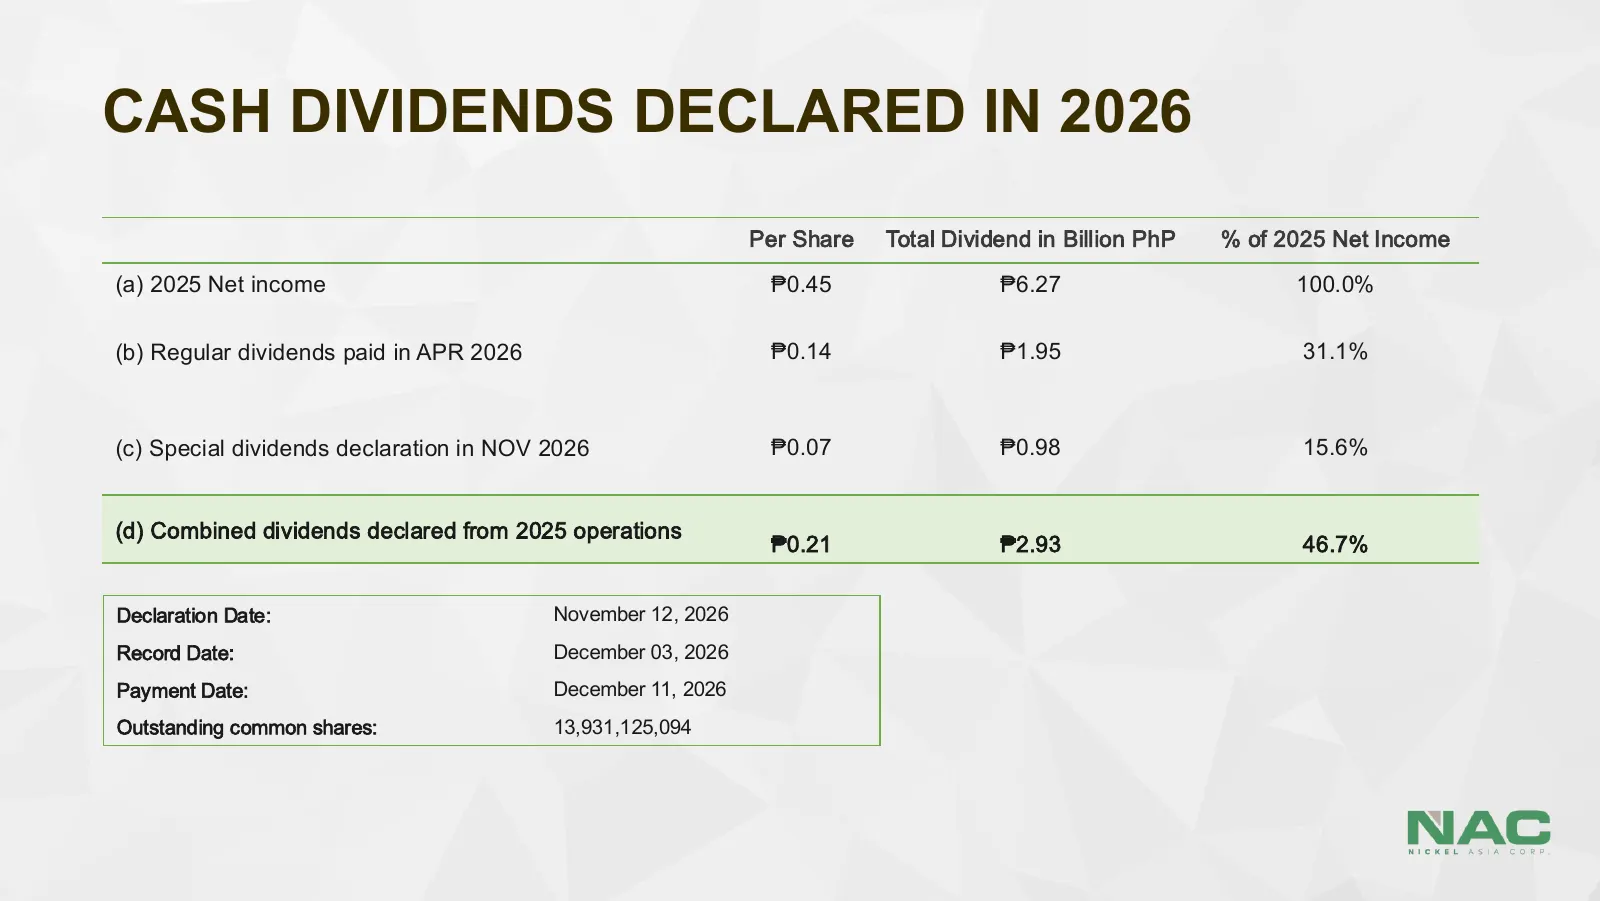
CASH DIVIDENDS DECLARED IN 2026 Per Share Total Dividend in Billion PhP % of 2025 Net Income (a) 2025 Net income ₱0.45 ₱6.27 100.0% (b) Regular dividends paid in APR 2026 ₱0.14 ₱1.95 31.1% (c) Special dividends declaration in NOV 2026 ₱0.07 ₱0.98 15.6% (d) Combined dividends declared from 2025 opera
Slide 14: Renewable Energy
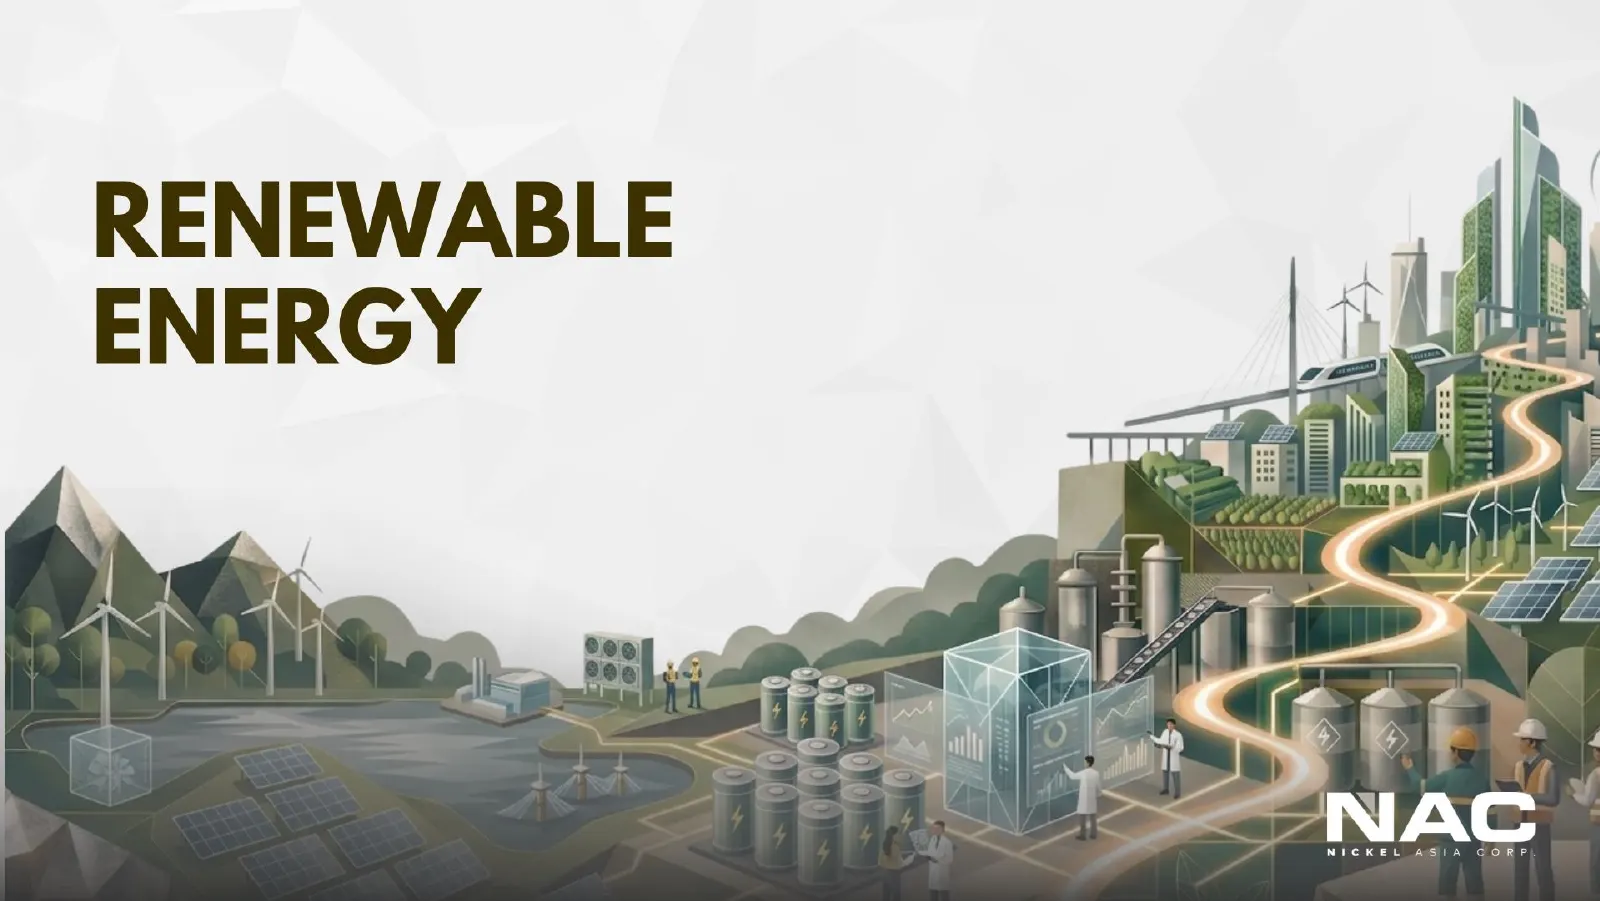
RENEWABLE ENERGY CE OES
Slide 15: JSI Project Overview
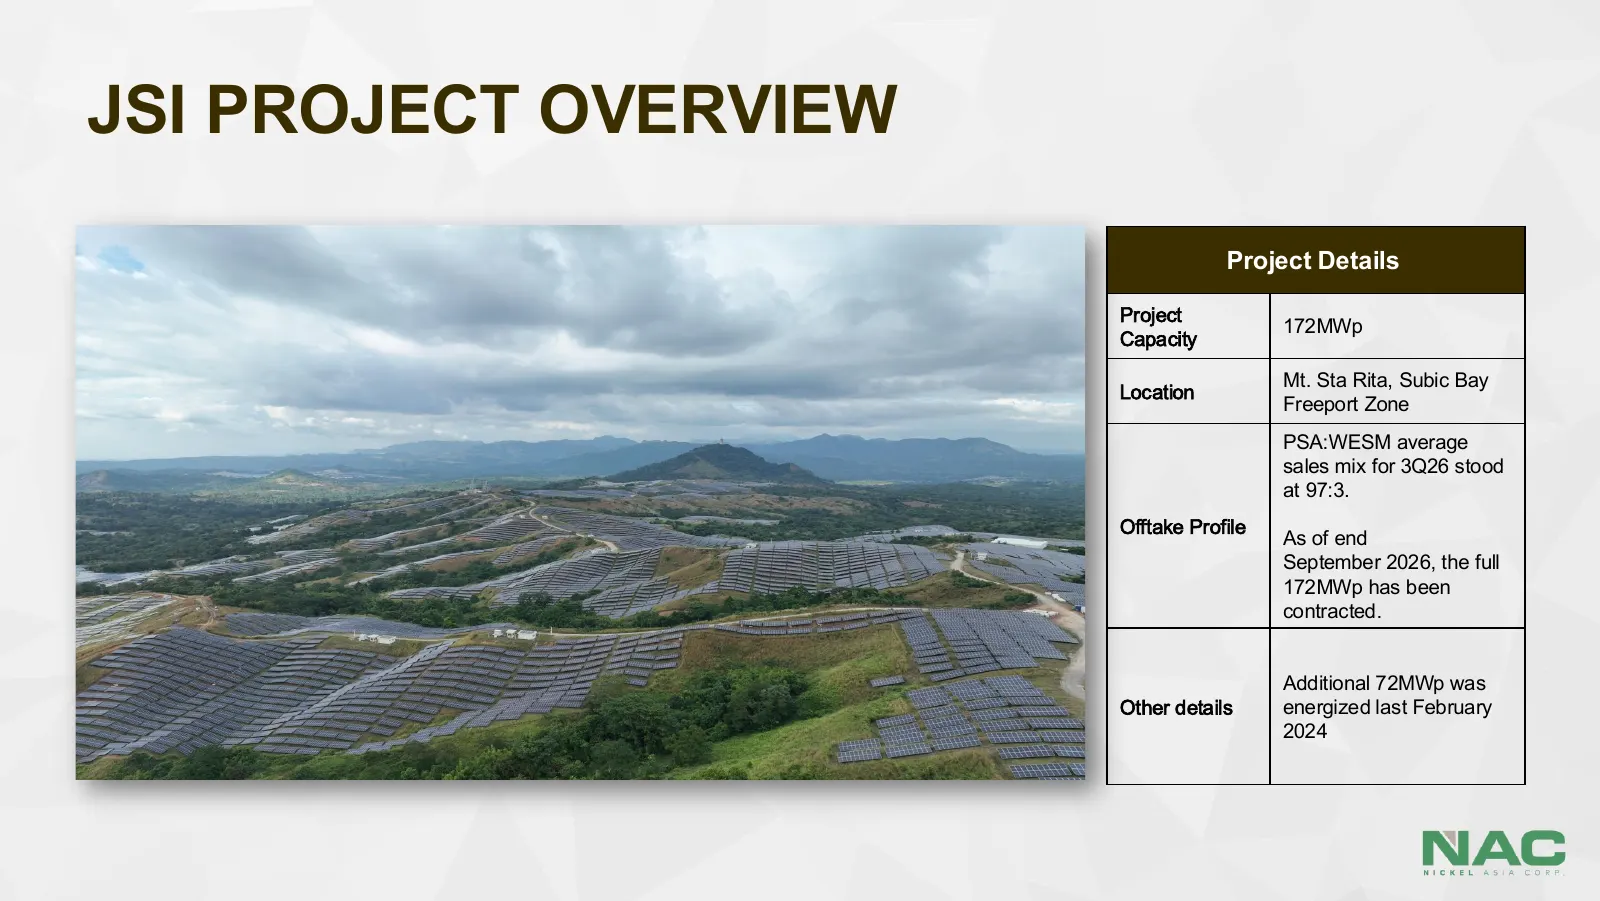
JSI PROJECT OVERVIEW Project Details Project 172MWp Capacity Mt. Sta Rita, Subic Bay Location Freeport Zone PSA:WESM average sales mix for 3Q26 stood at 97:3. Offtake Profile As of end September 2026, the full 172MWp has been contracted. Additional 72MWp was Other details energized last February 202
Slide 16: San Isidro, Leyte Overview
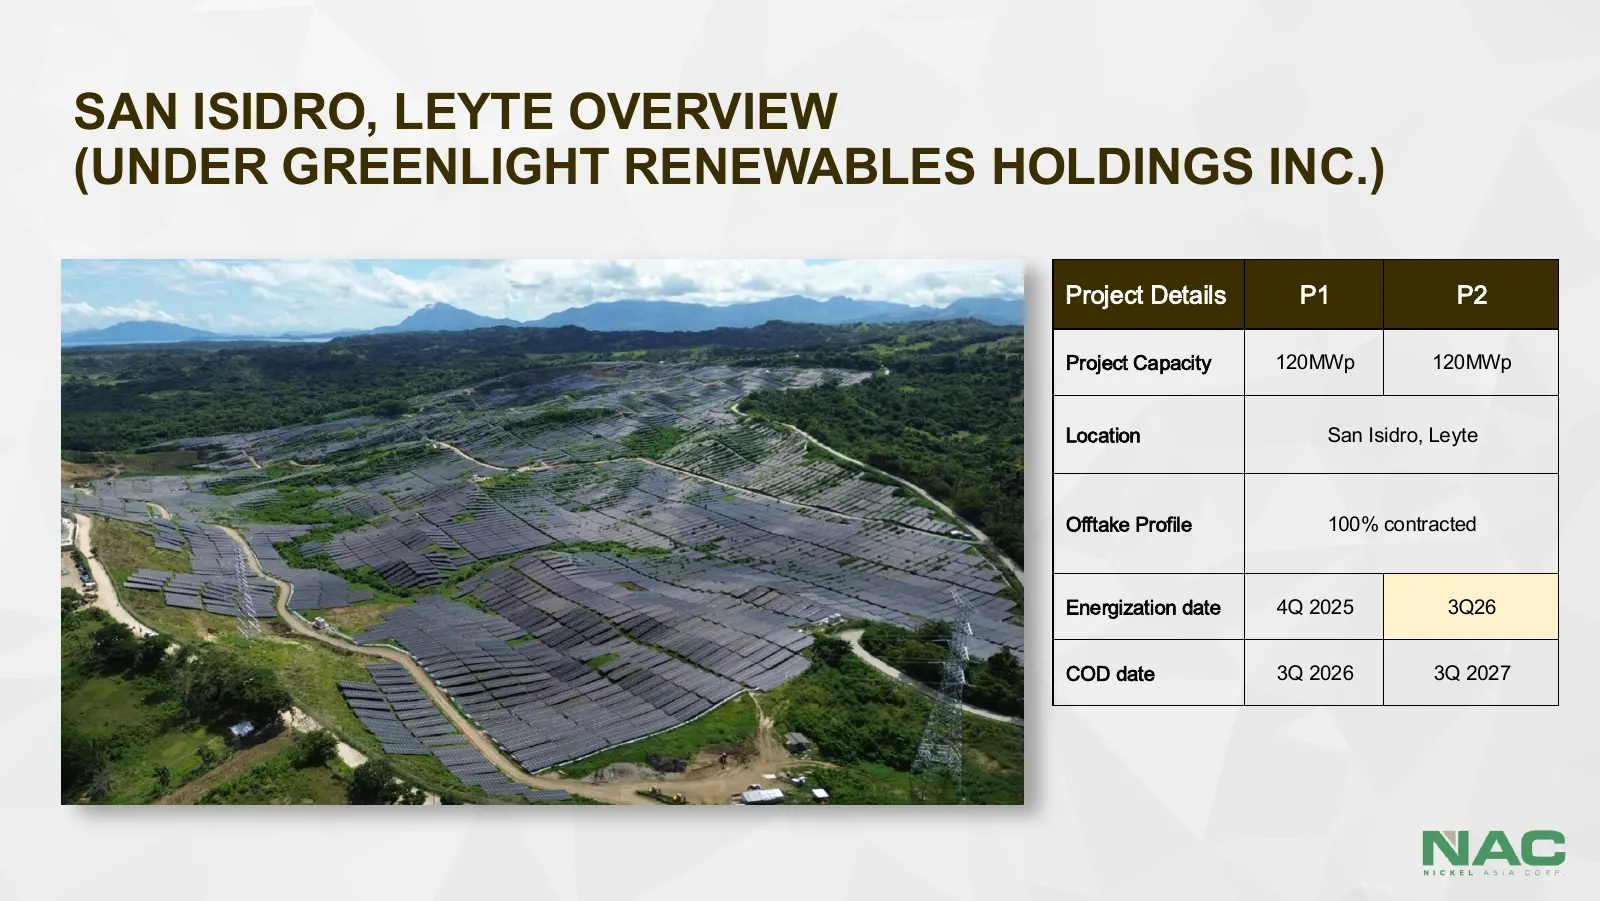
SAN ISIDRO, LEYTE OVERVIEW (UNDER GREENLIGHT RENEWABLES HOLDINGS INC.) Project Details P1 P2 Project Capacity 120MWp 120MWp Location San Isidro, Leyte Offtake Profile 100% contracted Energization date 4Q 2025 3Q26 COD date 3Q 2026 3Q 2027
Slide 17: NAC Energy Consolidated Financial Highlights (9M-26 vs 9M-25)
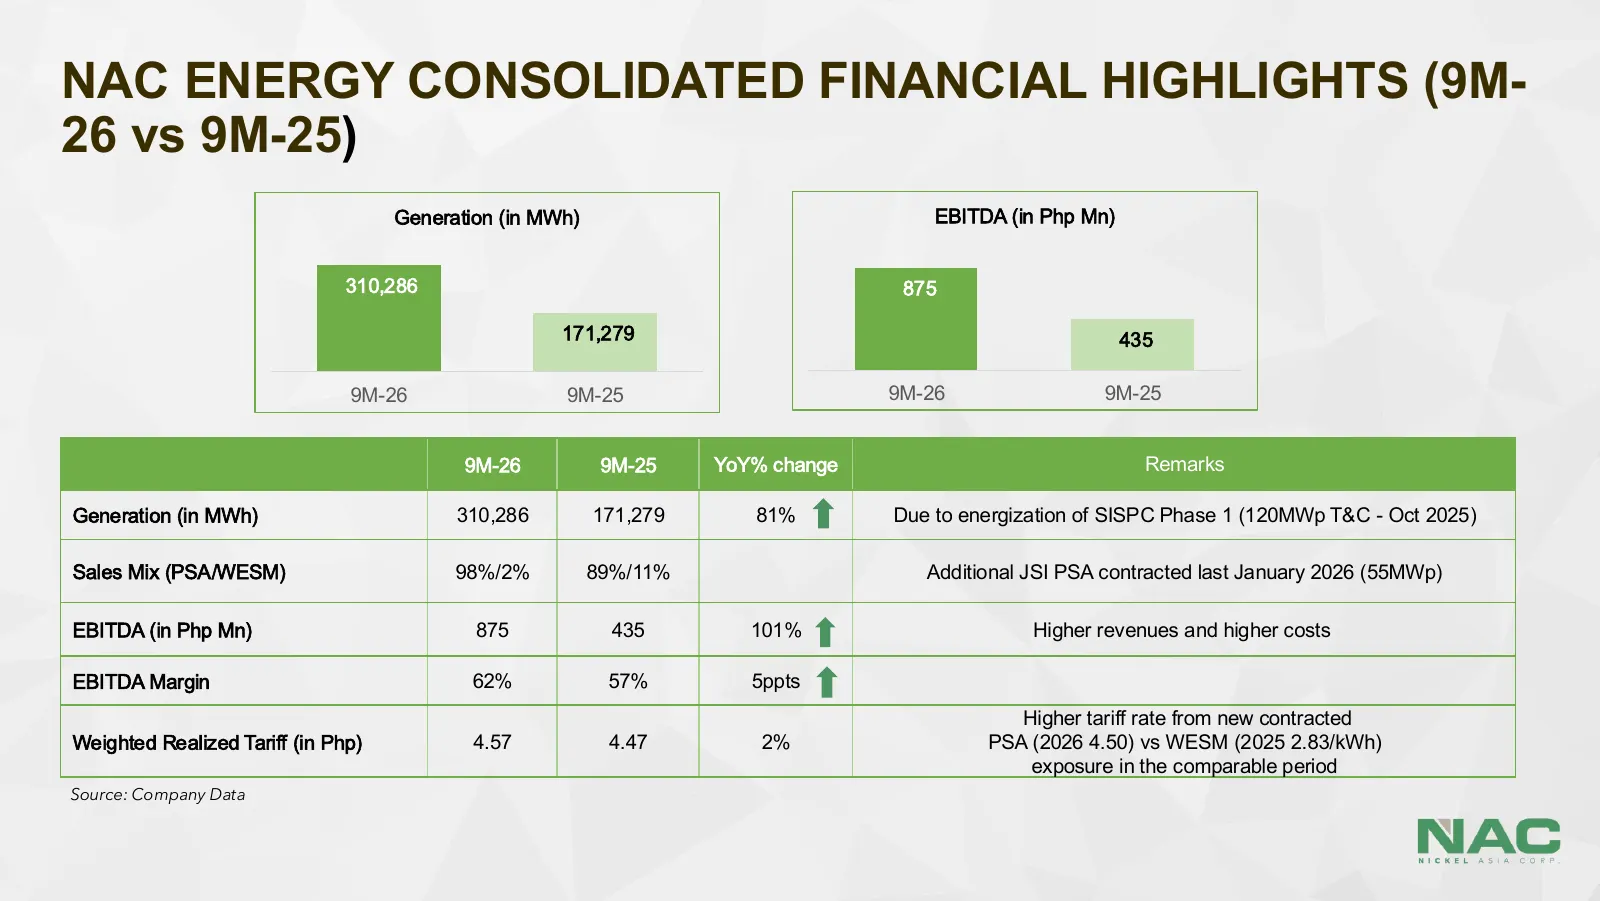
NAC ENERGY CONSOLIDATED FINANCIAL HIGHLIGHTS (9M- 26 vs 9M-25) Generation (in MWh) EBITDA (in Php Mn) 310,286 875 171,279 435 9M-26 9M-25 9M-26 9M-25 9M-26 9M-25 YoY% change Remarks Generation (in MWh) 310,286 171,279 81% Due to energization of SISPC Phase 1 (120MWp T&C - Oct 2025) Sales Mix (PSA/WE

Slide 18: Development Pipeline
DEVELOPMENT ill PIPELINE a a may at Speen
Slide 19: San Juan, Botolan, Zambales Overview
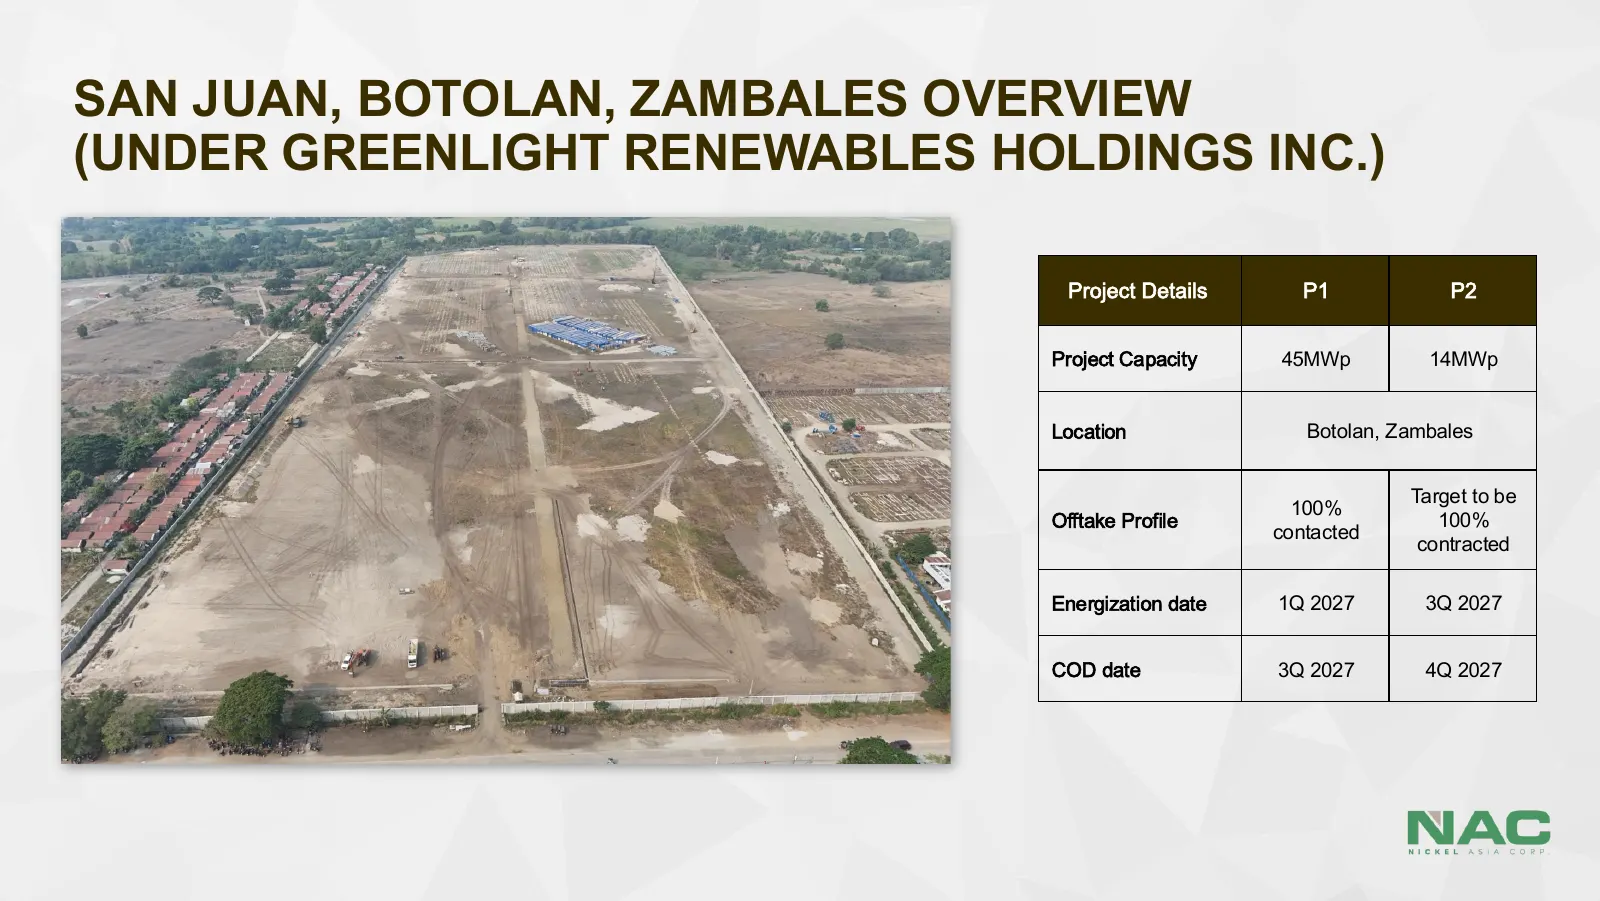
SAN JUAN, BOTOLAN, ZAMBALES OVERVIEW (UNDER GREENLIGHT RENEWABLES HOLDINGS INC.) Project Details P1 P2 Project Capacity 45MWp 14MWp Location Botolan, Zambales Target to be 100% Offtake Profile 100% contacted contracted Energization date 1Q 2027 3Q 2027 COD date 3Q 2027 4Q 2027
Slide 20: Subic, Cawag Overview
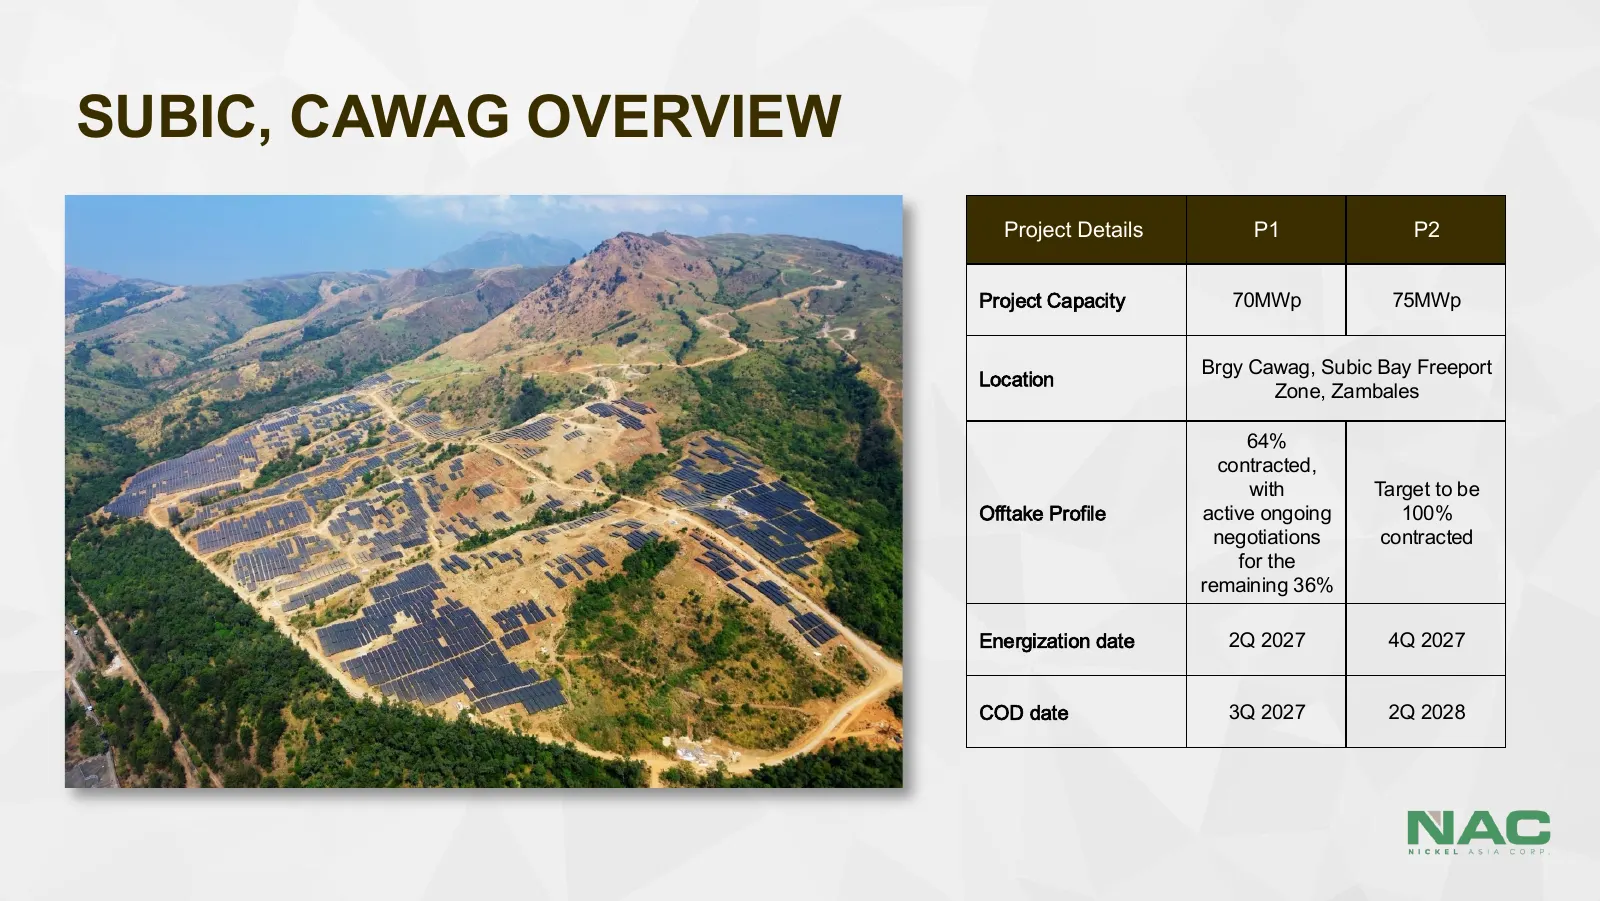
SUBIC, CAWAG OVERVIEW Project Details P1 P2 Project Capacity 70MWp 75MWp Brgy Cawag, Subic Bay Freeport Location Zone, Zambales 64% contracted, with Target to be Offtake Profile active ongoing 100% negotiations contracted for the remaining 36% Energization date 2Q 2027 4Q 2027 COD date 3Q 2027 2Q 20
Slide 21: Nazareno, Bataan Overview
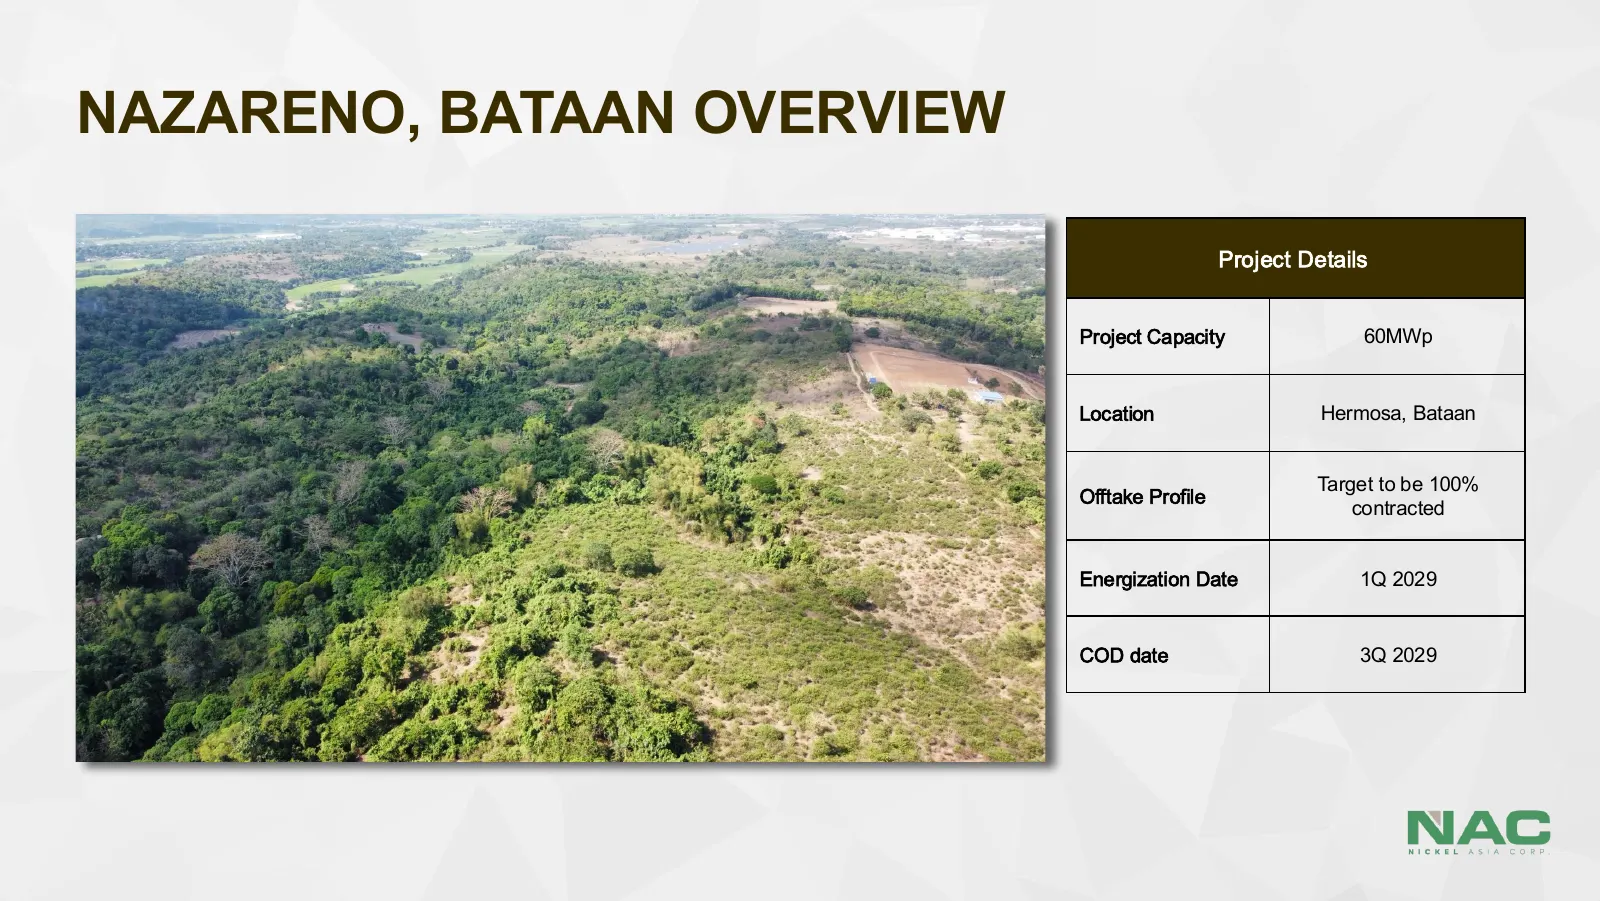
NAZARENO, BATAAN OVERVIEW Project Details Project Capacity 60MWp Location Hermosa, Bataan Target to be 100% Offtake Profile contracted Energization Date 1Q 2029 COD date 3Q 2029
Slide 22: NAC Energy's Projected Capacity Buildup of Generation Assets
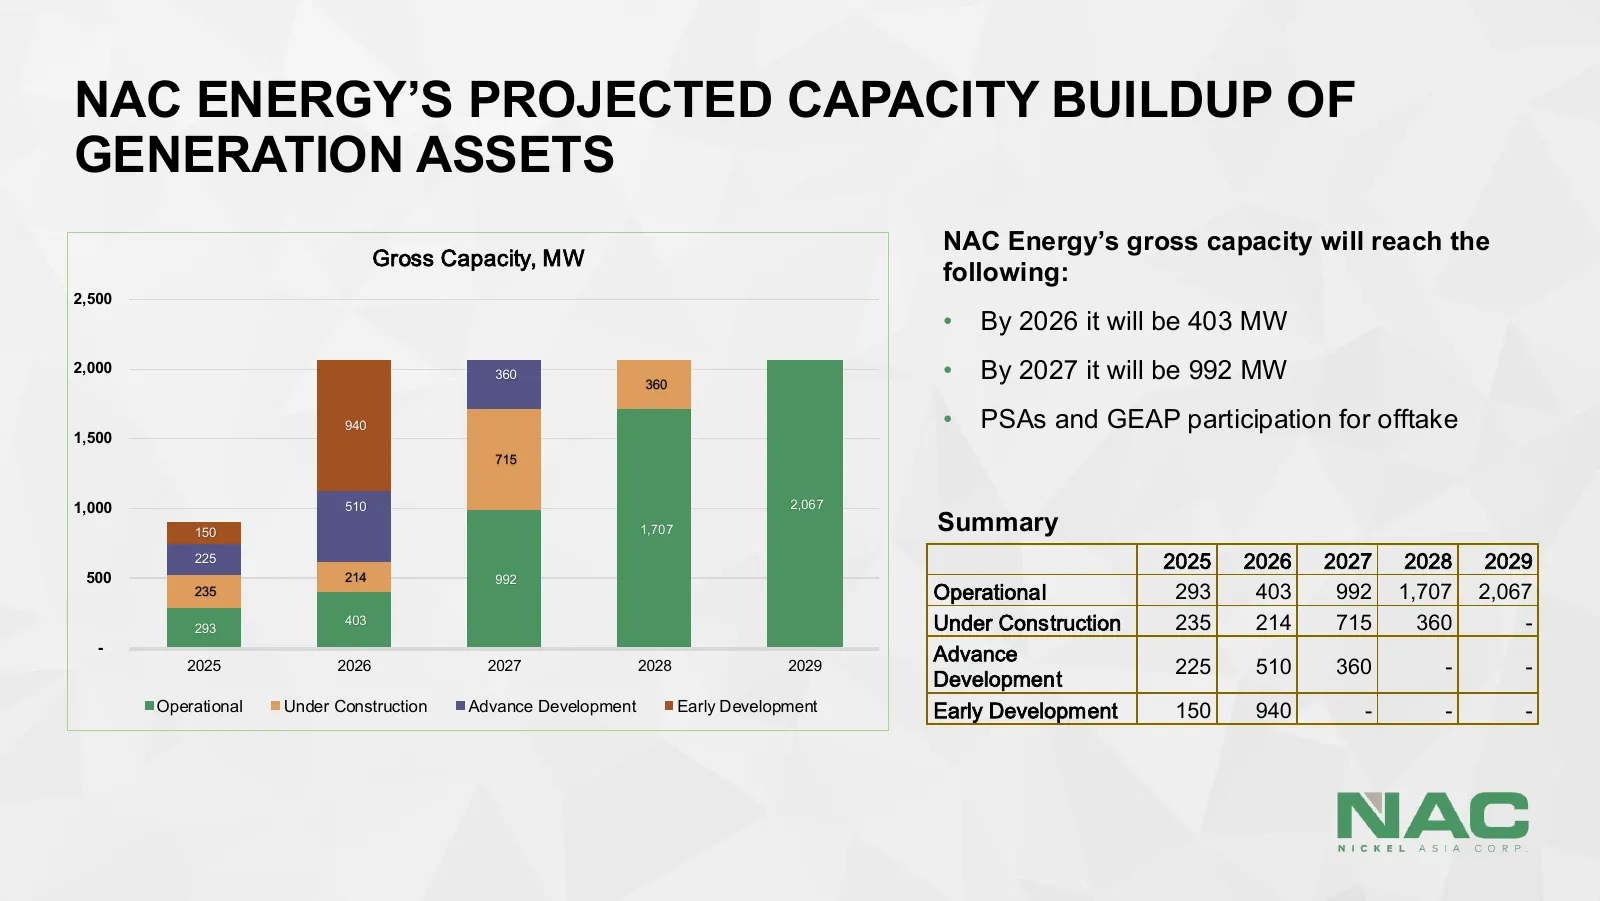
NAC ENERGY’S PROJECTED CAPACITY BUILDUP OF GENERATION ASSETS NAC Energy’s gross capacity will reach the Gross Capacity, MW following: 2,500 • By 2026 it will be 403 MW 2,000 360 360 • By 2027 it will be 992 MW 940 • PSAs and GEAP participation for offtake 1,500 715 1,000 510 2,067 150 1,707 Summary

Slide 23: East Copper Production LLP
EAST COPPER PRODUCTION LLP. hs.
Slide 24: Strategic Asset: Karchiga Copper Mine
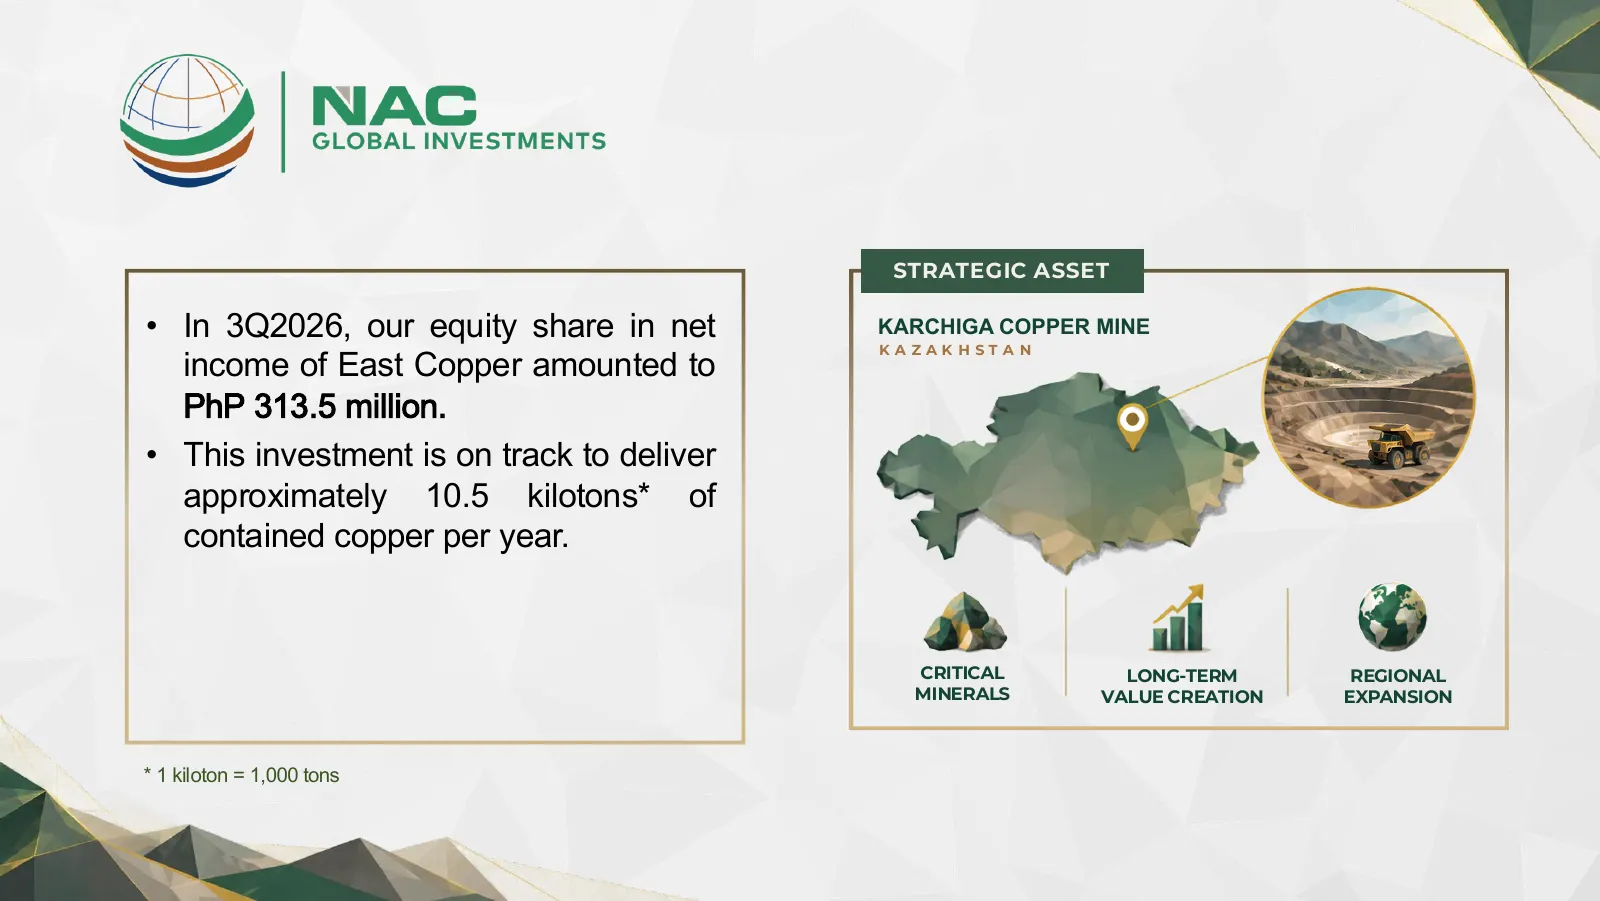
STRATEGIC ASSET • In 3Q2026, our equity share in net KARCHIGA COPPER MINE KA ZAK HST A N income of East Copper amounted to PhP 313.5 million. • This investment is on track to deliver approximately 10.5 kilotons* of contained copper per year. CRITICAL LONG-TERM REGIONAL MINERALS VALUE CREATION EXPANS

Slide 25
Slide 26: Project Cordon Updates
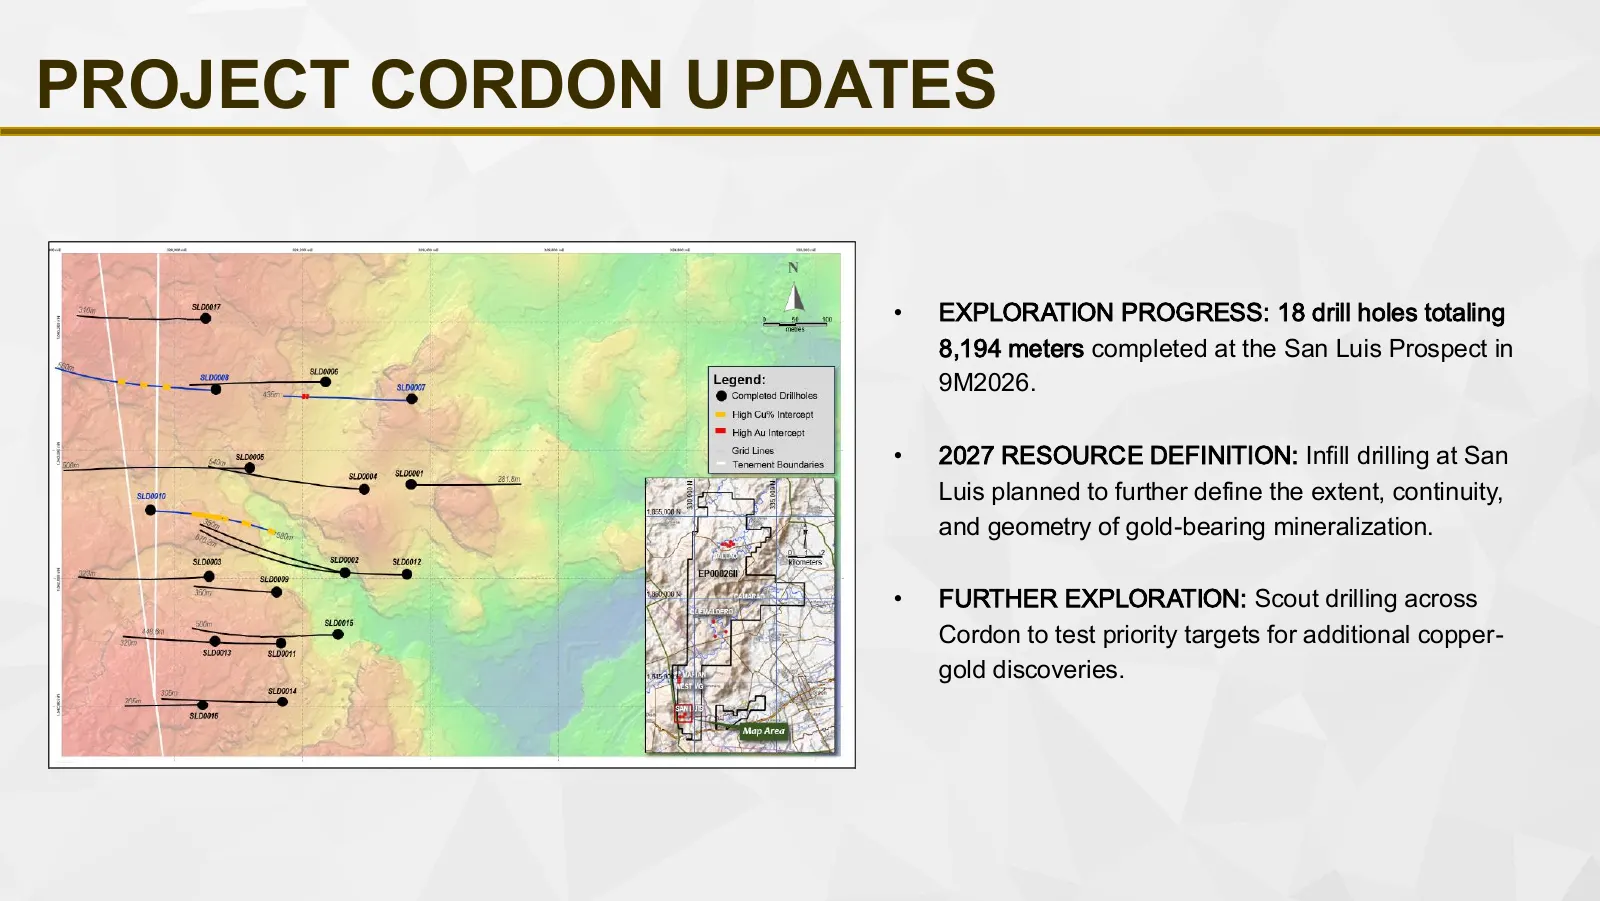
PROJECT CORDON UPDATES • EXPLORATION PROGRESS: 18 drill holes totaling 8,194 meters completed at the San Luis Prospect in 9M2026. • 2027 RESOURCE DEFINITION: Infill drilling at San Luis planned to further define the extent, continuity, and geometry of gold-bearing mineralization. • FURTHER EXPLORATI
Slide 27: Capex Updates
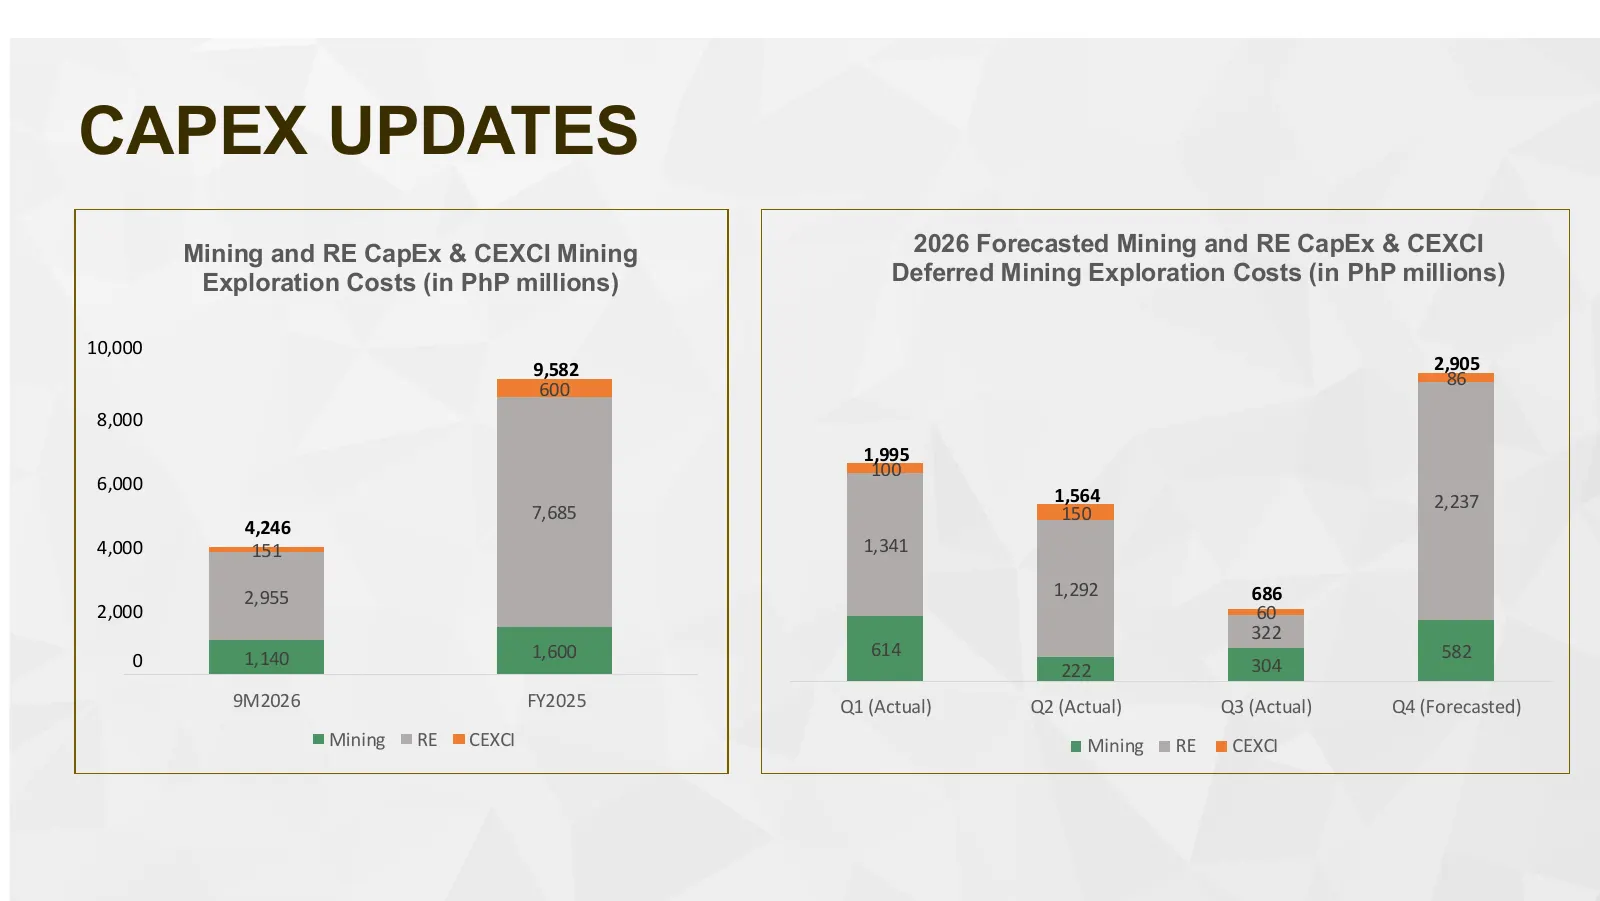
CAPEX UPDATES Mining and RE CapEx & CEXCI Mining 2026 Forecasted Mining and RE CapEx & CEXCI Exploration Costs (in PhP millions) Deferred Mining Exploration Costs (in PhP millions) 10,000 9,582 2,905 86 600 8,000 1,995 100 6,000 1,564 2,237 7,685 150 4,246 4,000 151 1,341 2,955 1,292 686 2,000 60 32

Slide 28: Appendix
Slide 29: Regulatory Updates
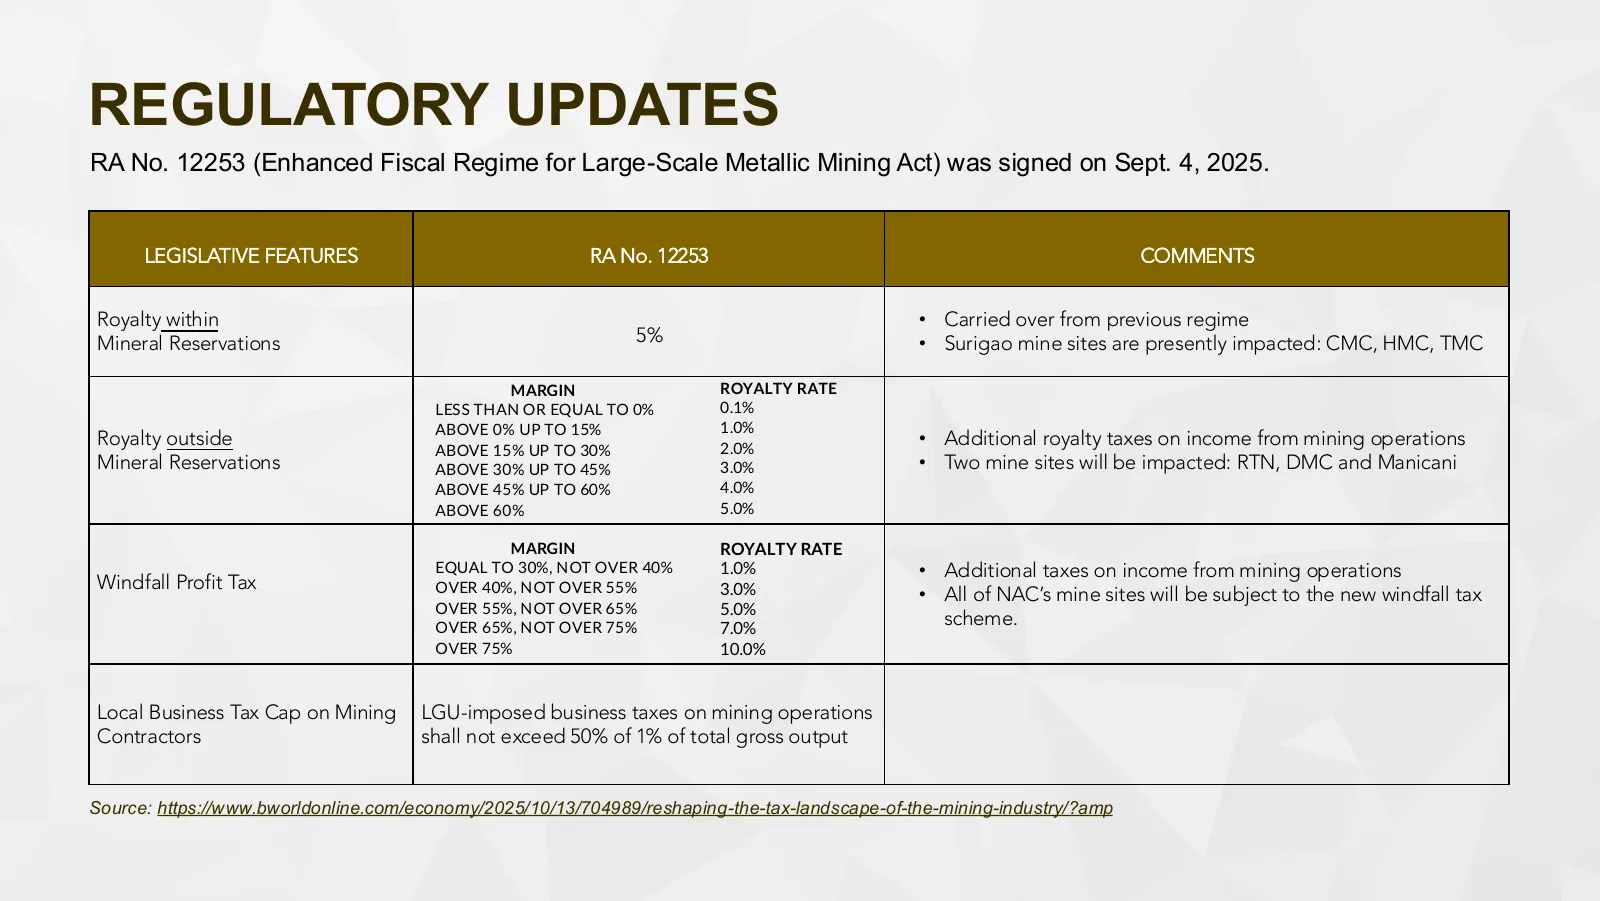
REGULATORY UPDATES RA No. 12253 (Enhanced Fiscal Regime for Large-Scale Metallic Mining Act) was signed on Sept. 4, 2025. LEGISLATIVE FEATURES RA No. 12253 COMMENTS Royalty within • Carried over from previous regime Mineral Reservations 5% • Surigao mine sites are presently impacted: CMC, HMC, TMC M
Slide 30: Disclaimer
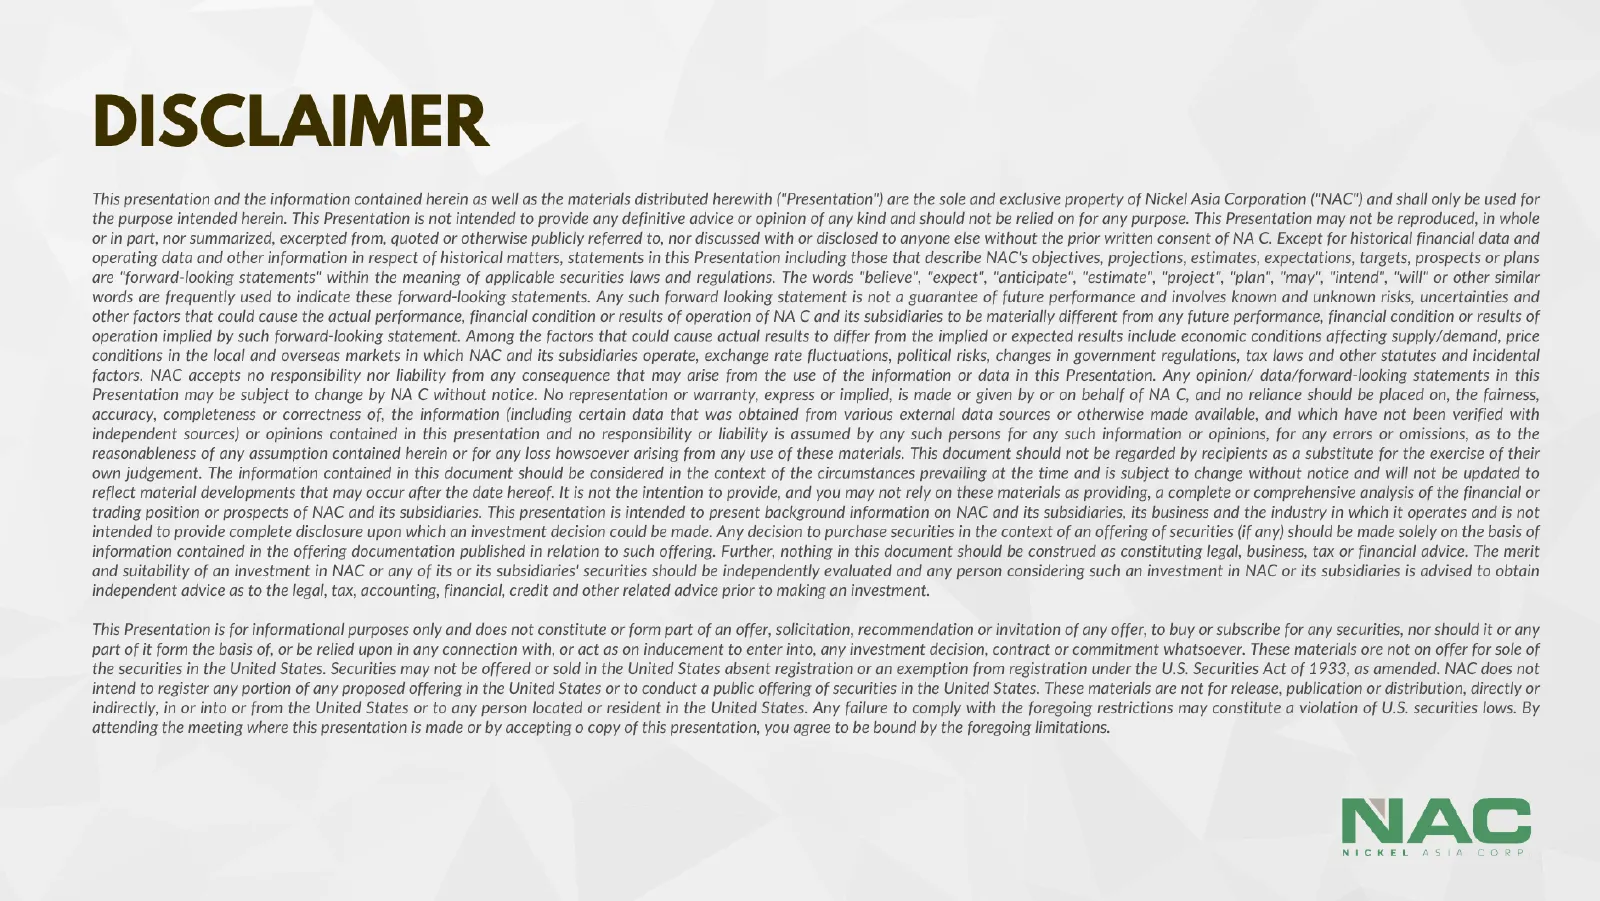
DISCLAIMER This presentation and the information contained herein as well as the materials distributed herewith ("Presentation") are the sole and exclusive property of Nickel Asia Corporation ("NAC") and shall only be used for the purpose intended herein. This Presentation is not intended to provide
Source: company website
More decks from Nickel Asia Corp.
 H1 2026 Earnings Presentation29 slides · Aug 7, 2026
 Q1 2026 Earnings Presentation28 slides · May 11, 2026
 Investor Presentation (March 2026)19 slides · March 2026
 FY2025 Earnings Presentation27 slides · Feb 26, 2026
 Q3 2025 Earnings Presentation28 slides · Nov 14, 2025
 H1 2025 Earnings Presentation22 slides · Aug 14, 2025