Waters Corporation · NYSE:WAT
Waters — Technical Presentation (2013)
79 slides from Waters's technical presentation, 2013
Slide 1: Peptide Mapping 101: Essential Tools for Effective Development and Characterization
Thank you for joining us! The Webinar will begin shortly… Peptide Mapping 101: Essential Tools for Effective Development and Characterization Part 1:Introduction to Peptide Mapping Stephan M. Koza, Ph. D. Principal Applications Chemist Waters Technologies Corporation ©2013 Waters Corporation 1
Slide 2: Friendly Reminders
Friendly Reminders… We will have LIVE Technical Support available to address your questions. Please use text chat functionality to submit questions during the Webinar. Upon conclusion, follow up information will be available: http://www.waters.com/Aug20 Recorded version of today’s presentation Copie
Slide 3: Agenda
Agenda What is Peptide Mapping and Why Do It? Protein Digestion Peptide Separations ©2013 Waters Corporation 3
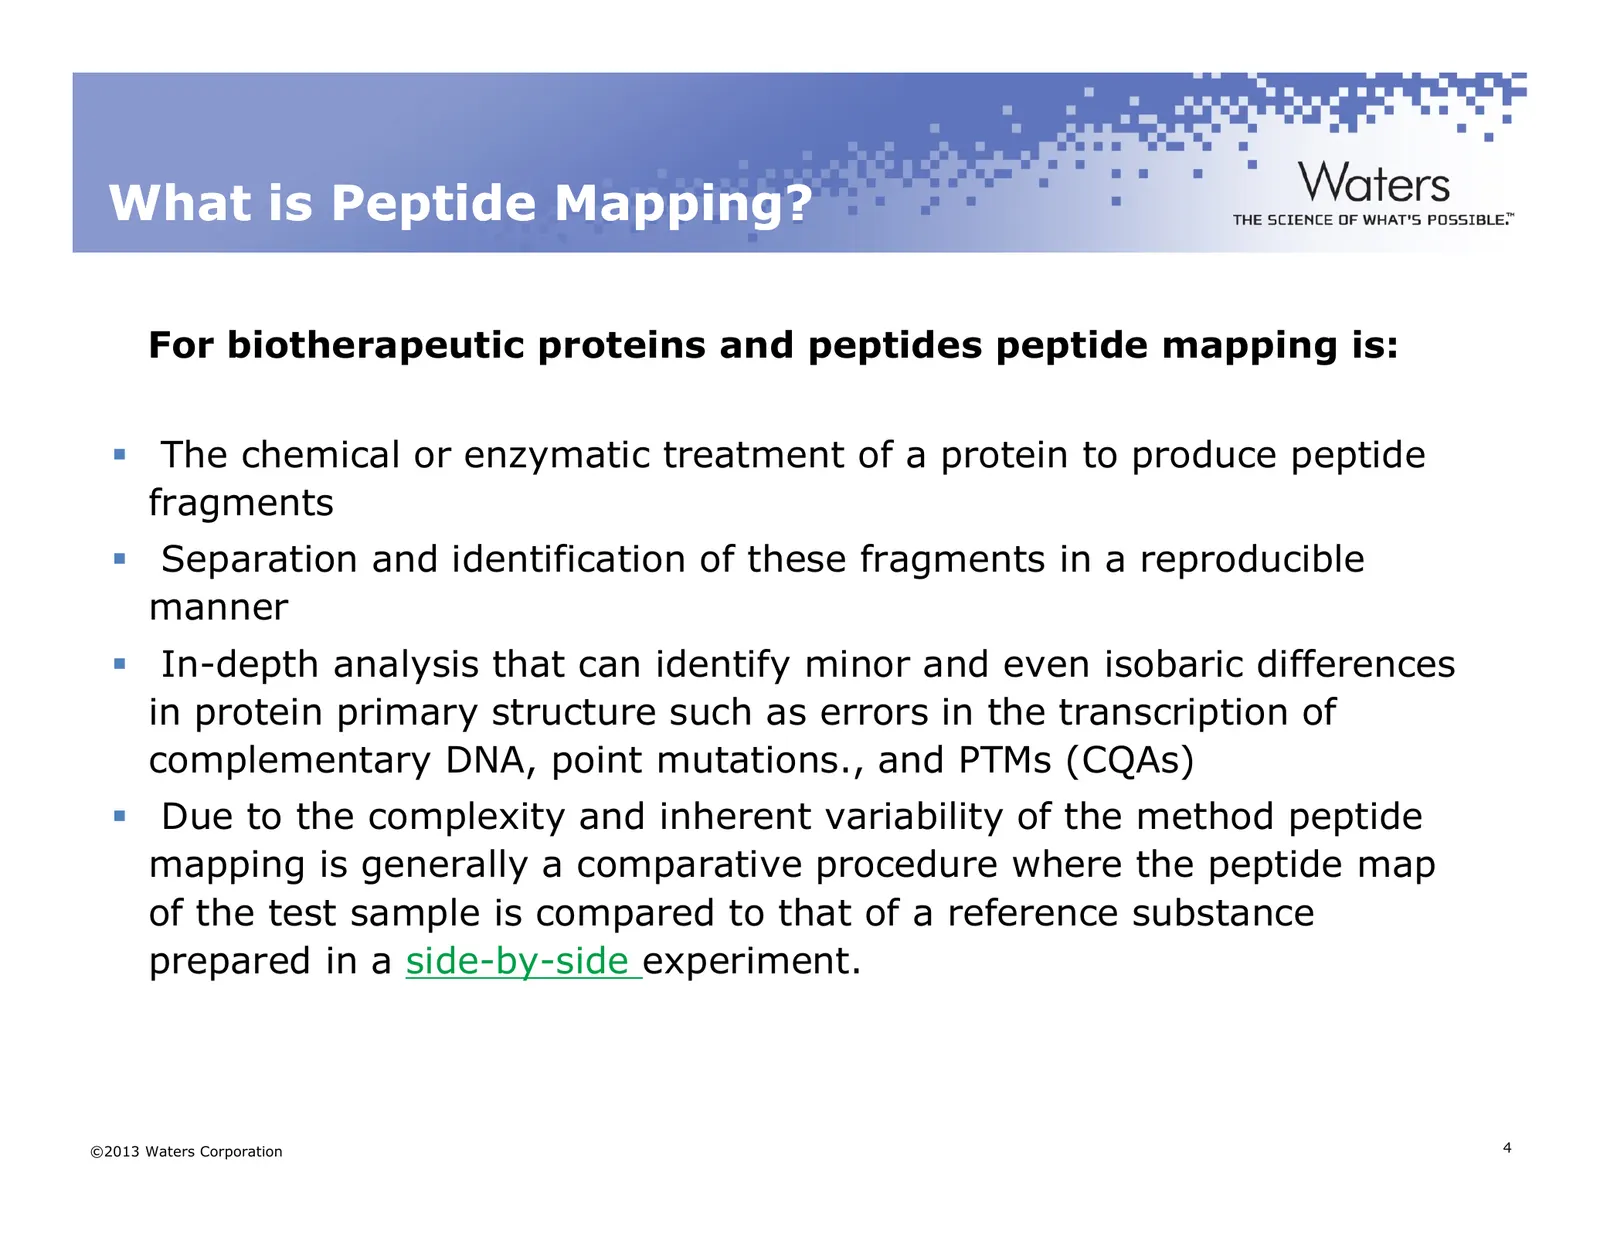
Slide 4: What is Peptide Mapping?
What is Peptide Mapping? For biotherapeutic proteins and peptides peptide mapping is: The chemical or enzymatic treatment of a protein to produce peptide fragments Separation and identification of these fragments in a reproducible manner In-depth analysis that can identify minor and even isobaric di
Slide 5: Uses of Peptide Mapping
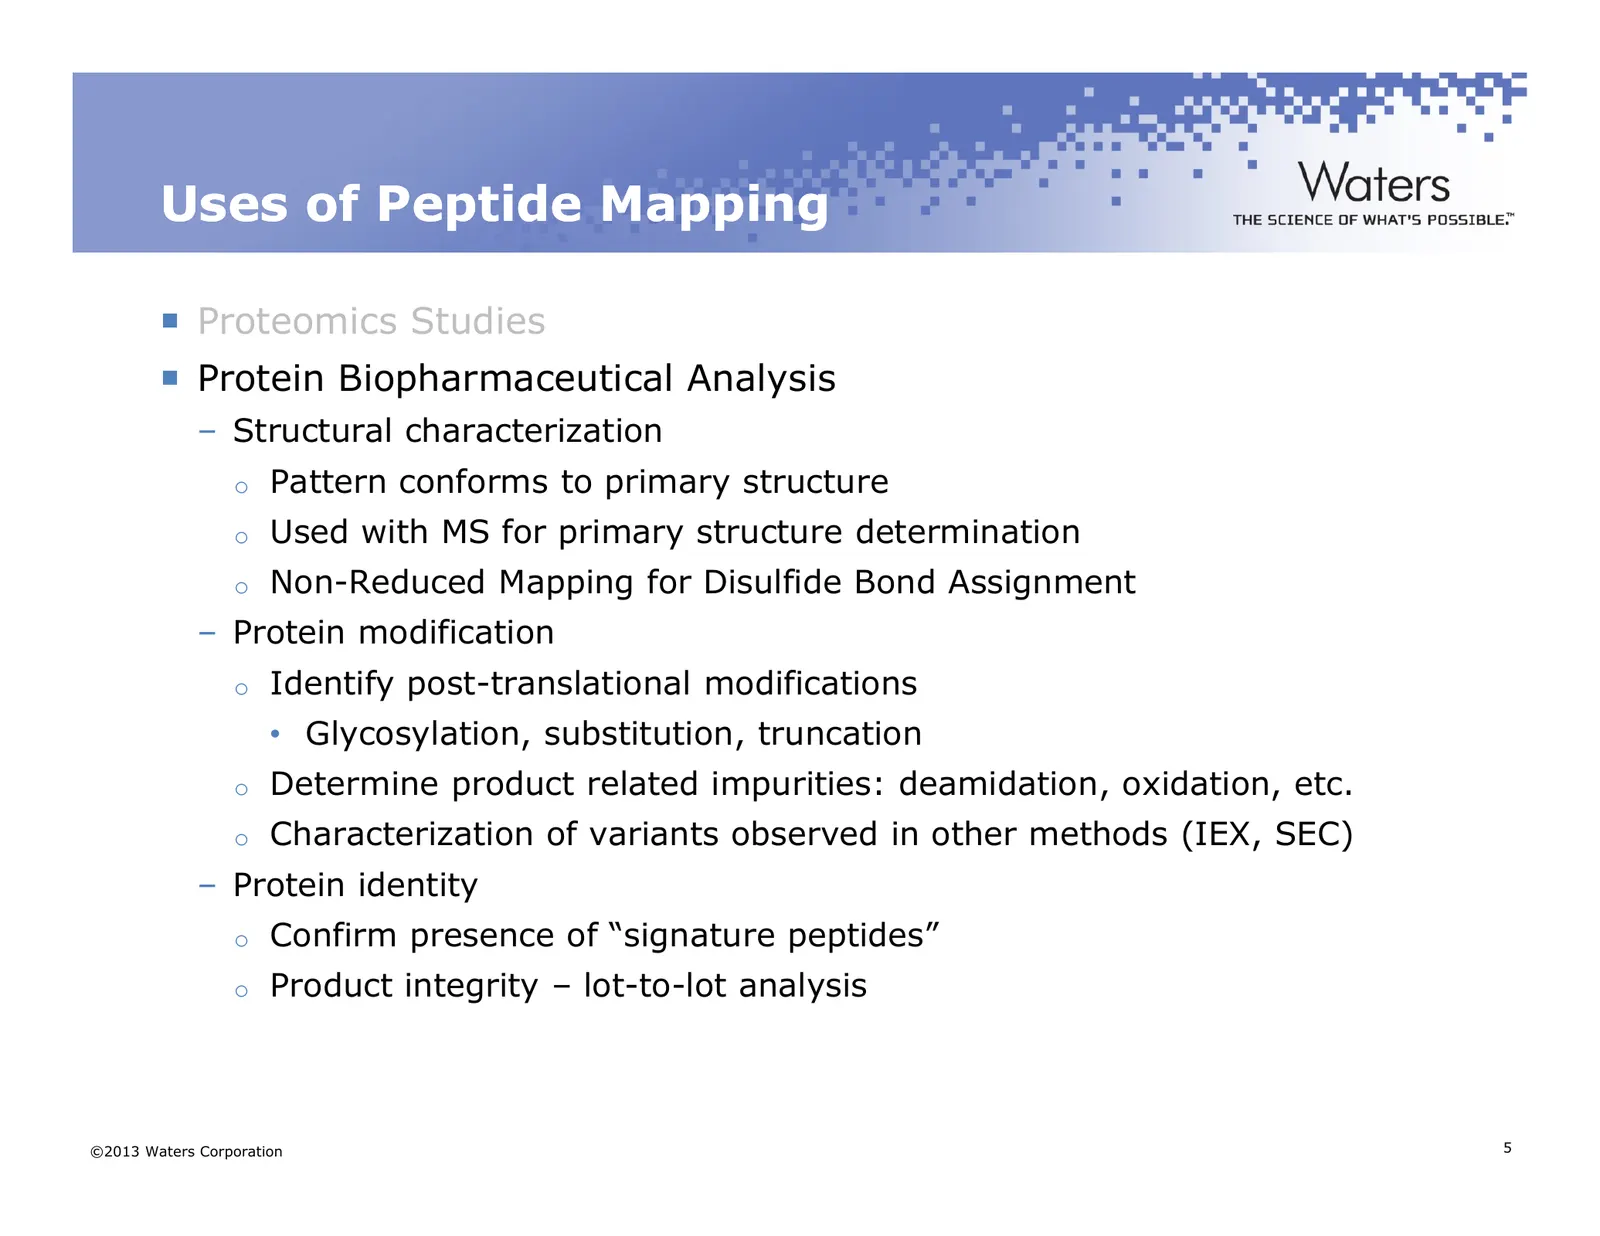
Uses of Peptide Mapping Proteomics Studies Protein Biopharmaceutical Analysis – Structural characterization o Pattern conforms to primary structure o Used with MS for primary structure determination o Non-Reduced Mapping for Disulfide Bond Assignment – Protein modification o Identify post-translatio
Slide 6: Biopharmaceutical Classes That Use Peptide Mapping Methods
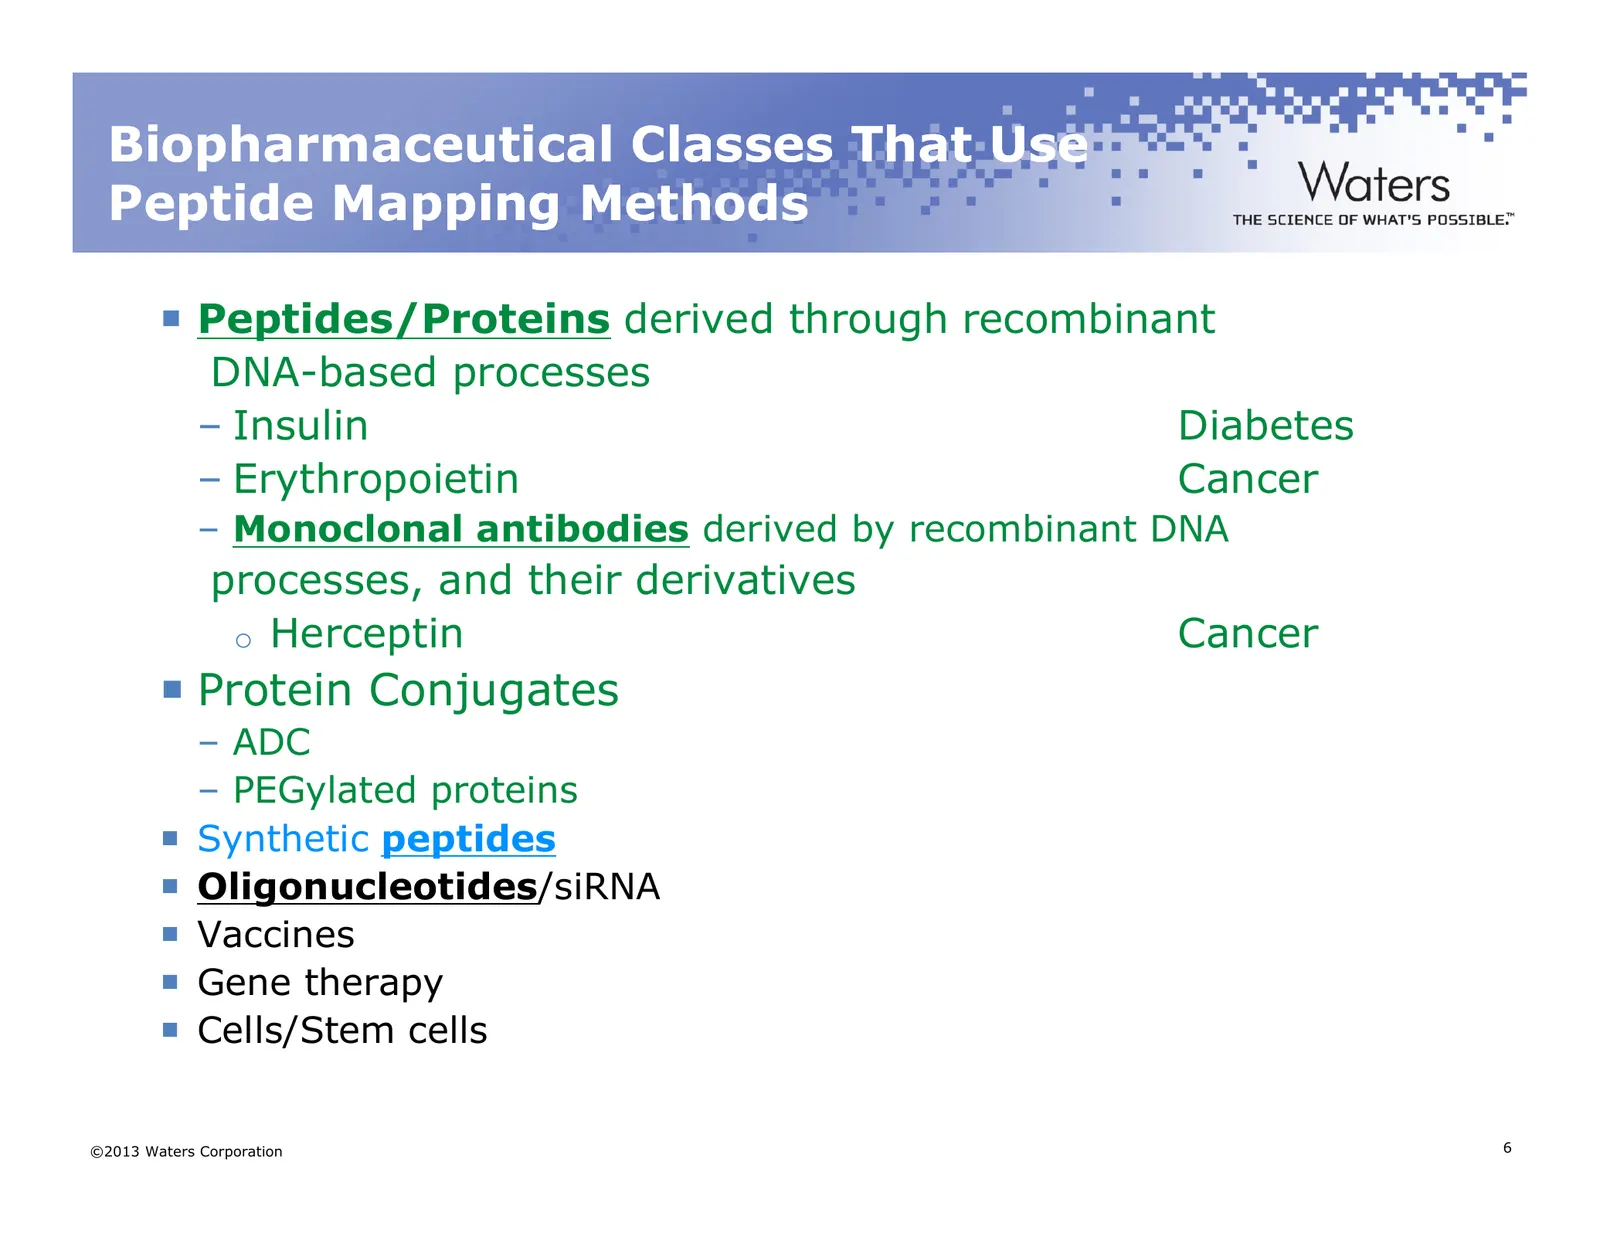
Biopharmaceutical Classes That Use Peptide Mapping Methods Peptides/Proteins derived through recombinant DNA-based processes – Insulin Diabetes – Erythropoietin Cancer – Monoclonal antibodies derived by recombinant DNA processes, and their derivatives o Herceptin Cancer Protein Conjugates – ADC – PE
Slide 7: Why Do We Develop Peptide Maps for Biotherapeutic Proteins?
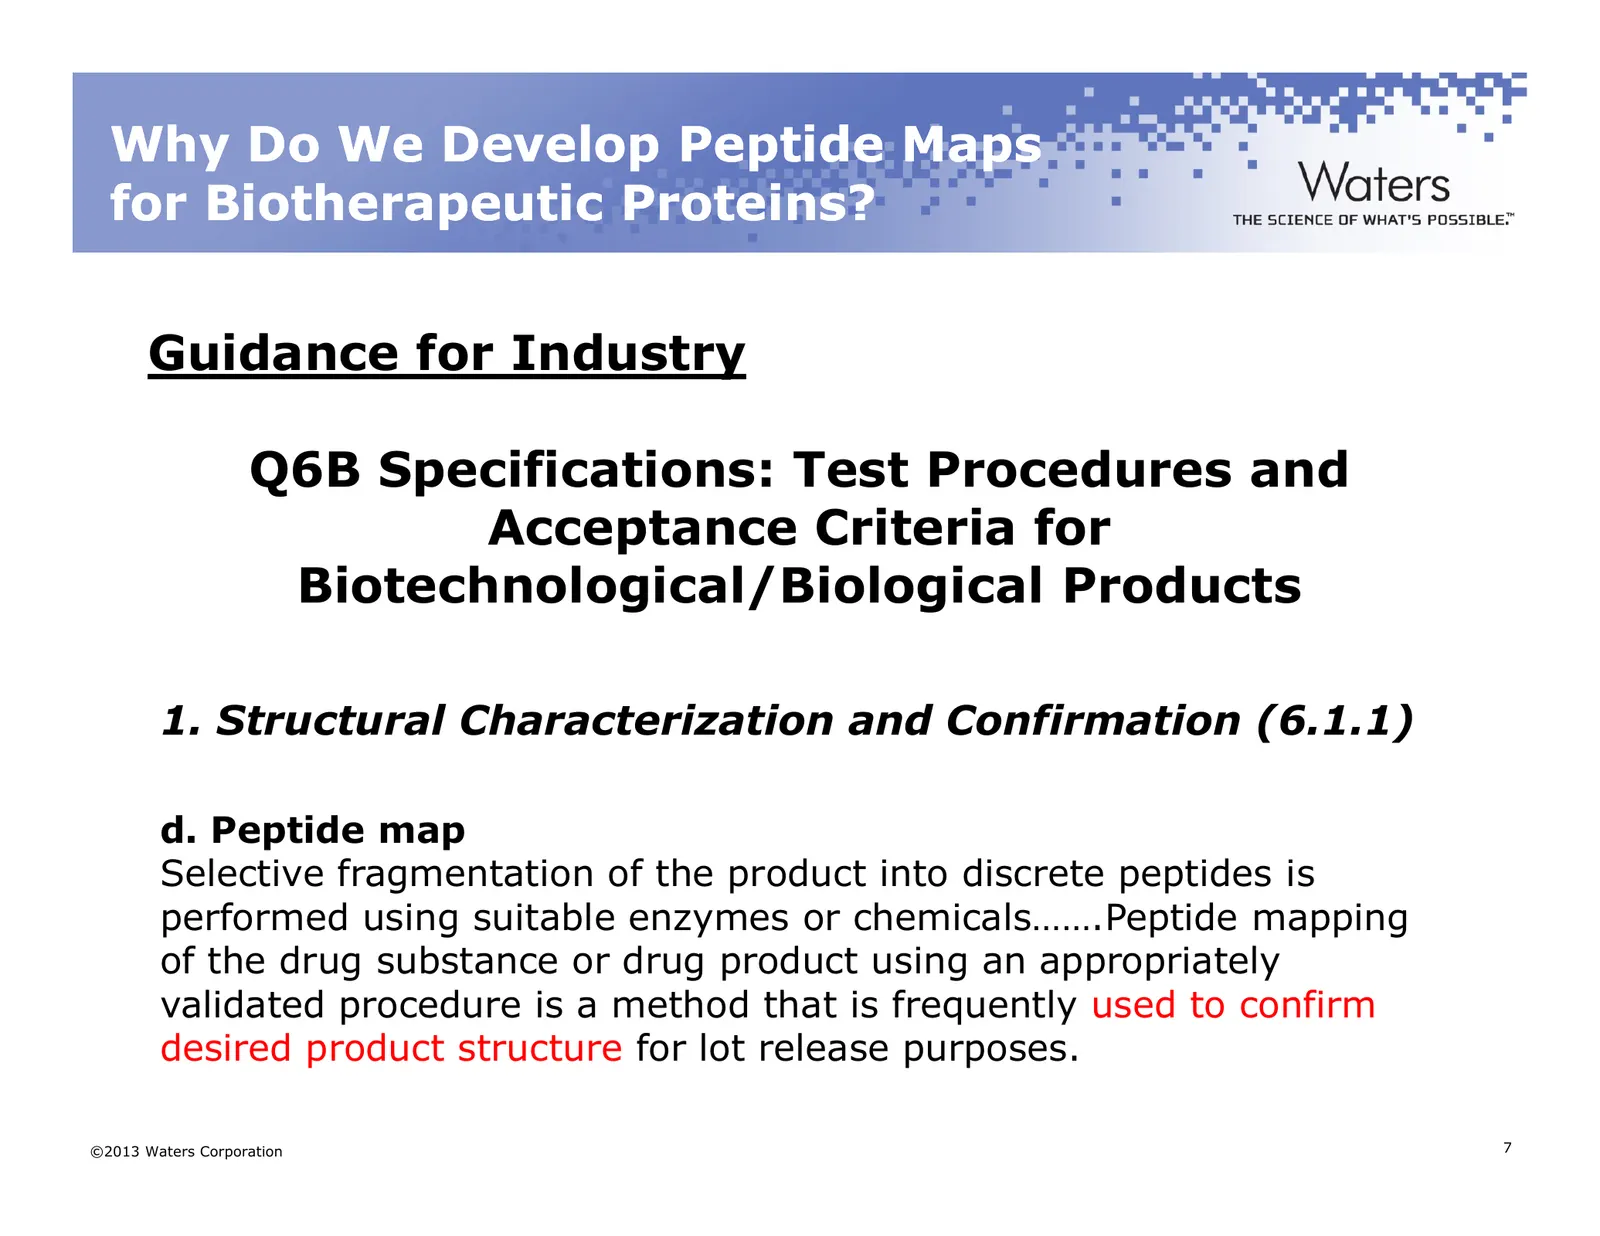
Why Do We Develop Peptide Maps for Biotherapeutic Proteins? Guidance for Industry Q6B Specifications: Test Procedures and Acceptance Criteria for Biotechnological/Biological Products 1. Structural Characterization and Confirmation (6.1.1) d. Peptide map Selective fragmentation of the product into di
Slide 8: Agenda
Agenda What is Peptide Mapping and Why Do It? Protein Digestion Peptide Separations On to Part II ©2013 Waters Corporation 8
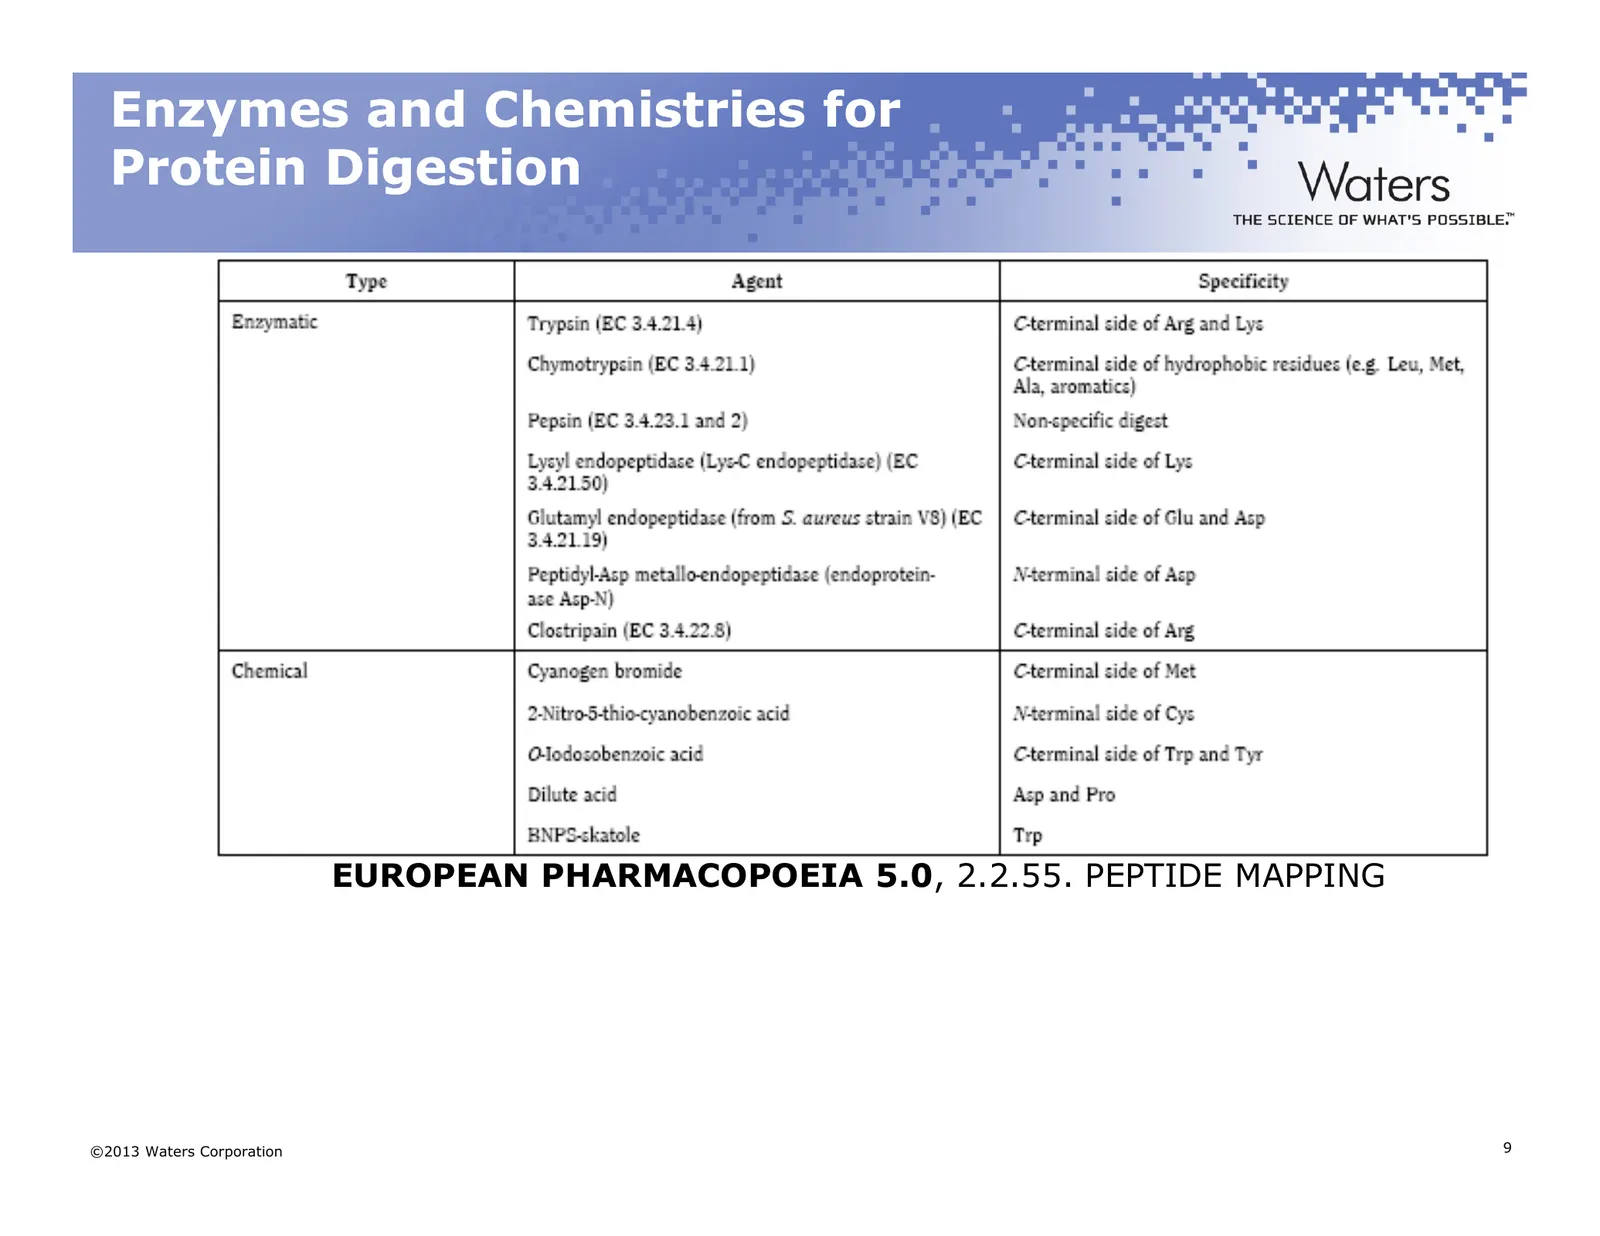
Slide 9: Enzymes and Chemistries for Protein Digestion
Enzymes and Chemistries for Protein Digestion EUROPEAN PHARMACOPOEIA 5.0, 2.2.55. PEPTIDE MAPPING ©2013 Waters Corporation 9
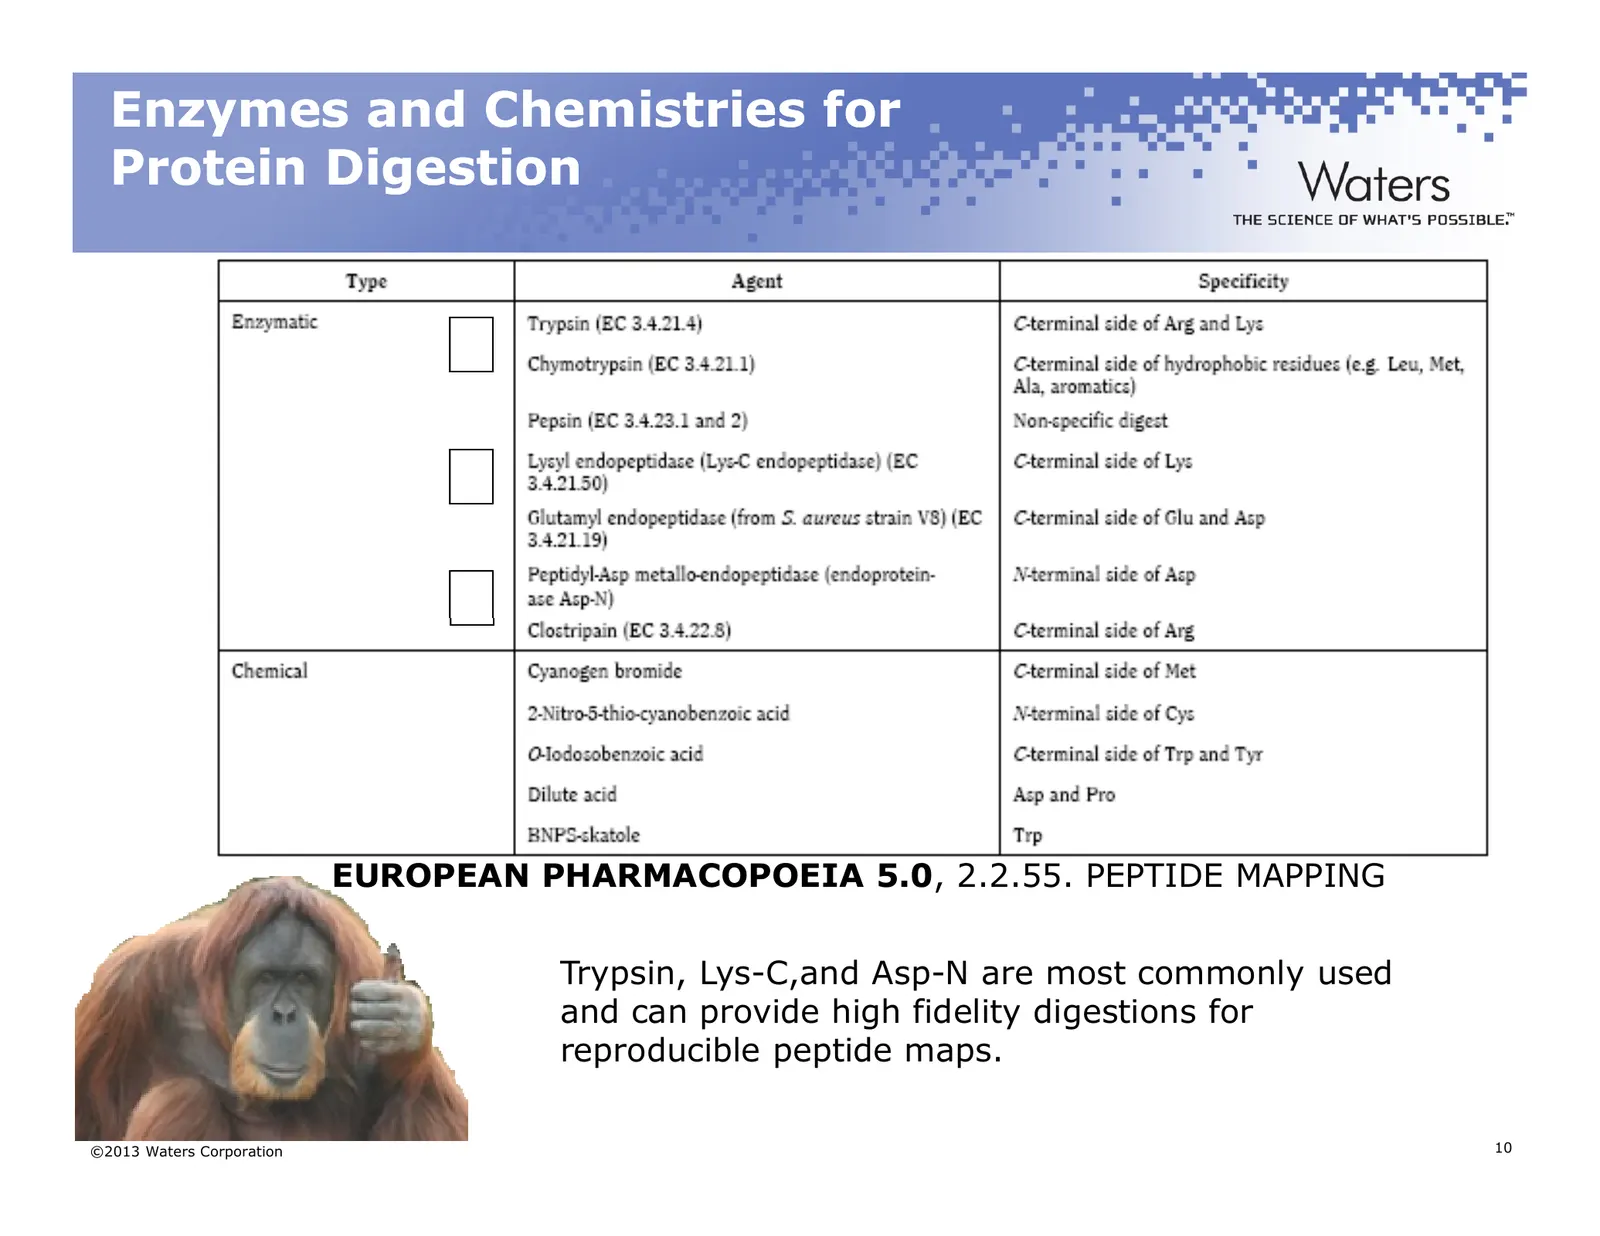
Slide 10: Enzymes and Chemistries for Protein Digestion
Enzymes and Chemistries for Protein Digestion EUROPEAN PHARMACOPOEIA 5.0, 2.2.55. PEPTIDE MAPPING Trypsin, Lys-C,and Asp-N are most commonly used and can provide high fidelity digestions for reproducible peptide maps. ©2013 Waters Corporation 10
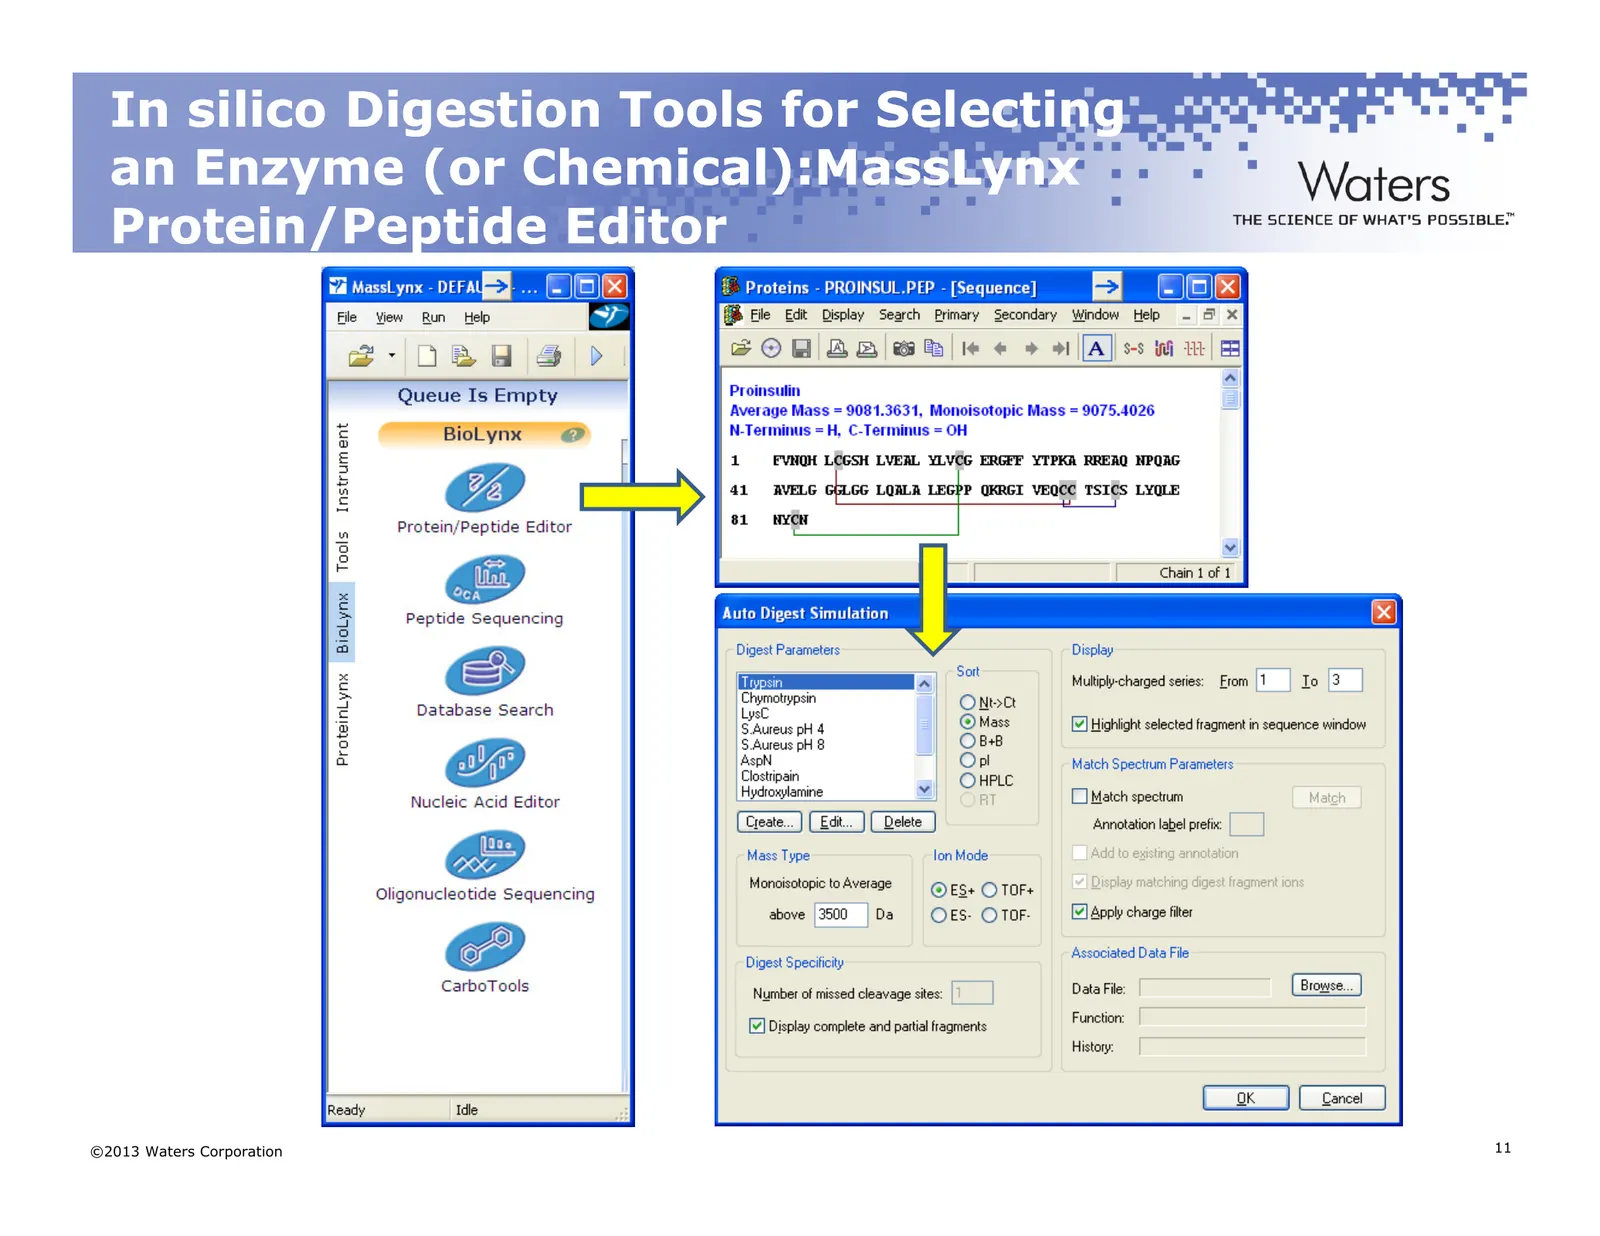
Slide 11: In silico Digestion Tools for Selecting an Enzyme: MassLynx
In silico Digestion Tools for Selecting an Enzyme (or Chemical):MassLynx Chemical):MassLynx Protein/Peptide Editor ©2013 Waters Corporation 11
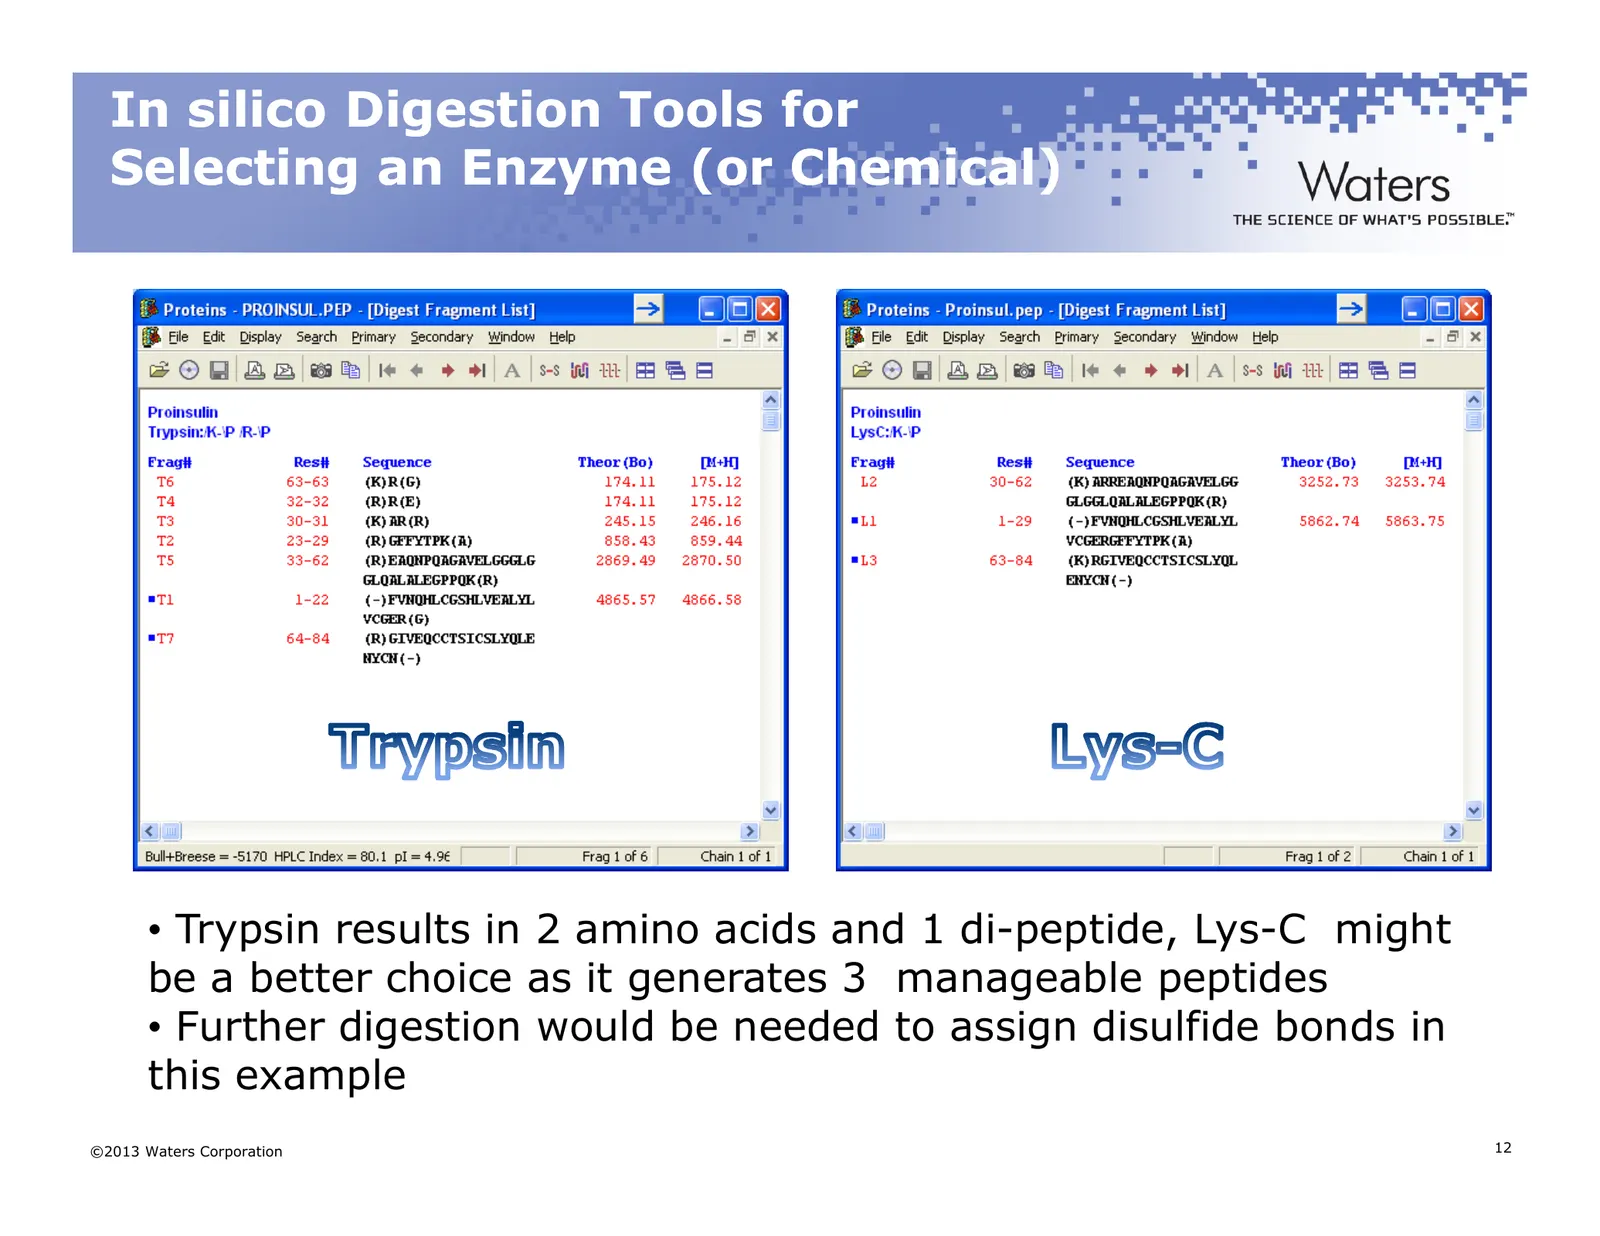
Slide 12: In silico Digestion Tools for Selecting an Enzyme
In silico Digestion Tools for Selecting an Enzyme (or Chemical) • Trypsin results in 2 amino acids and 1 di-peptide, Lys-C might be a better choice as it generates 3 manageable peptides • Further digestion would be needed to assign disulfide bonds in this example ©2013 Waters Corporation 12
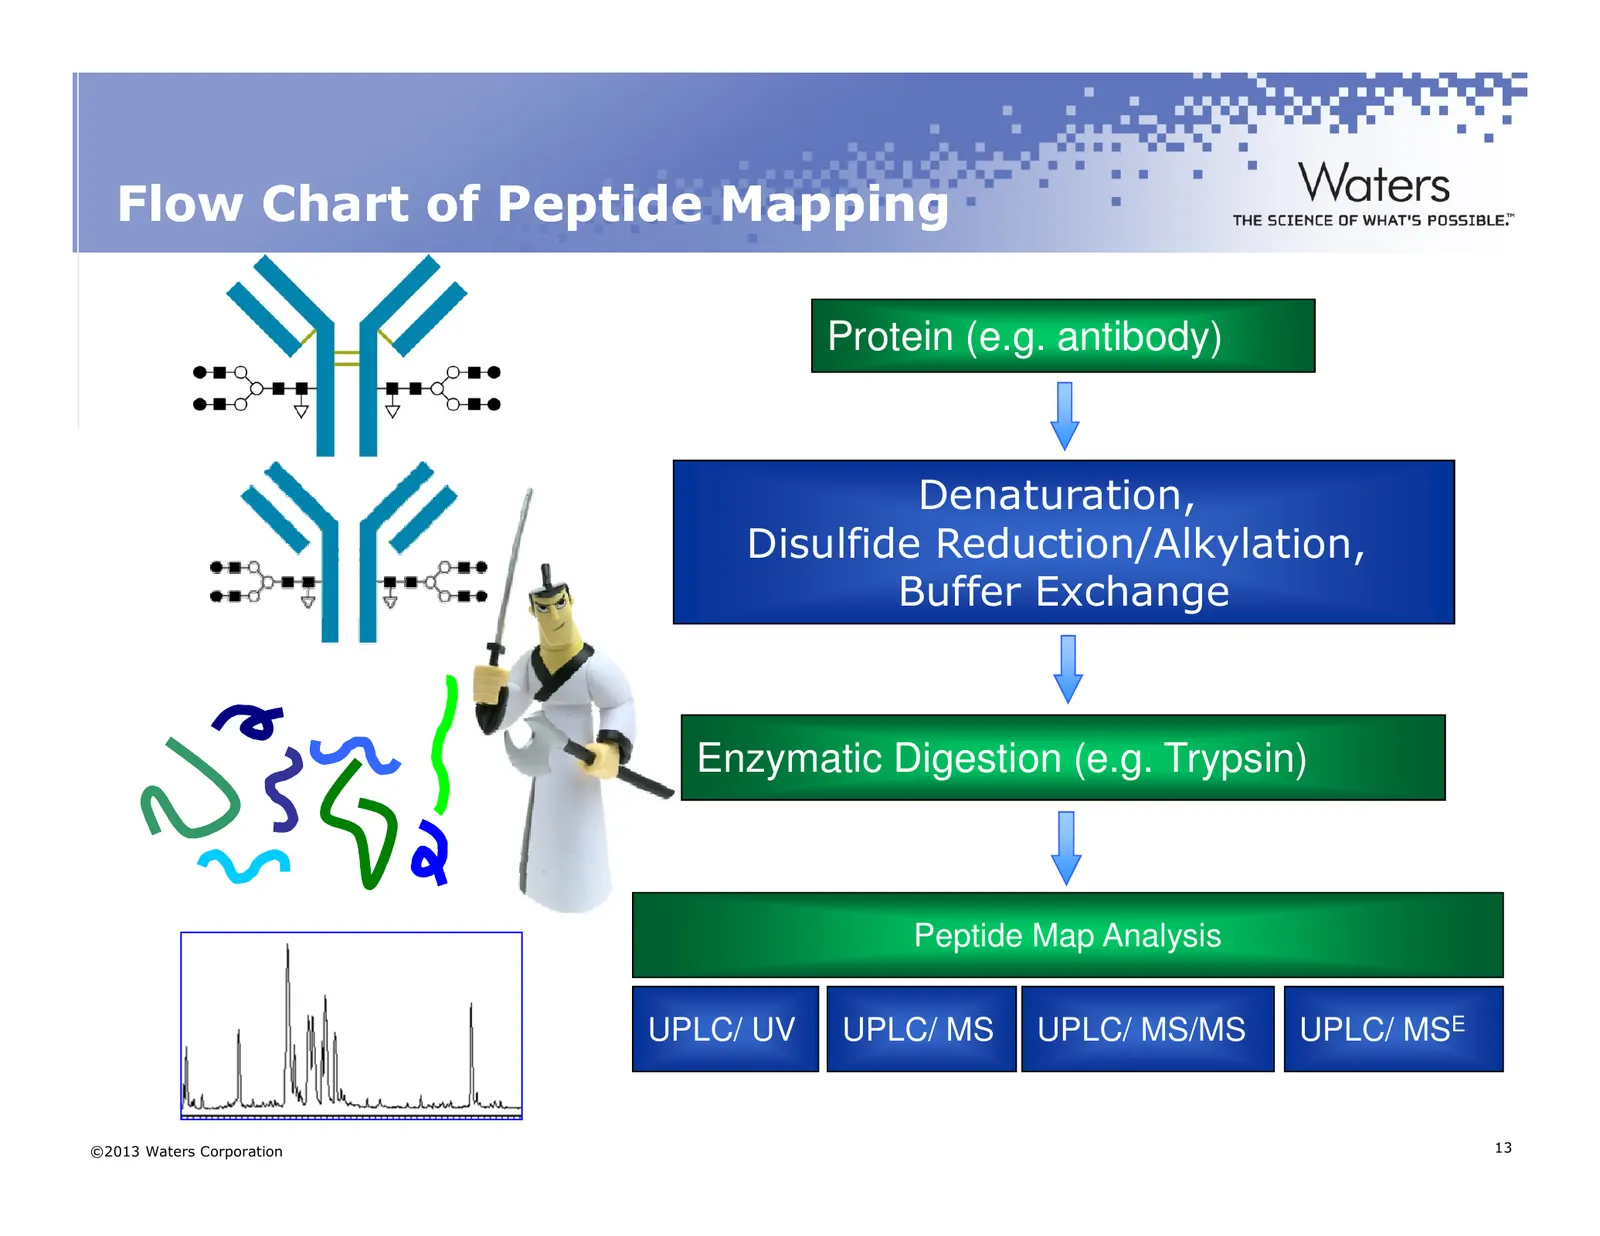
Slide 13: Flow Chart of Peptide Mapping
Flow Chart of Peptide Mapping Protein (e.g. antibody) Denaturation, Disulfide Reduction/Alkylation, Buffer Exchange Enzymatic Digestion (e.g. Trypsin) Peptide Map Analysis UPLC/ UV UPLC/ MS UPLC/ MS/MS UPLC/ MSE ©2013 Waters Corporation 13
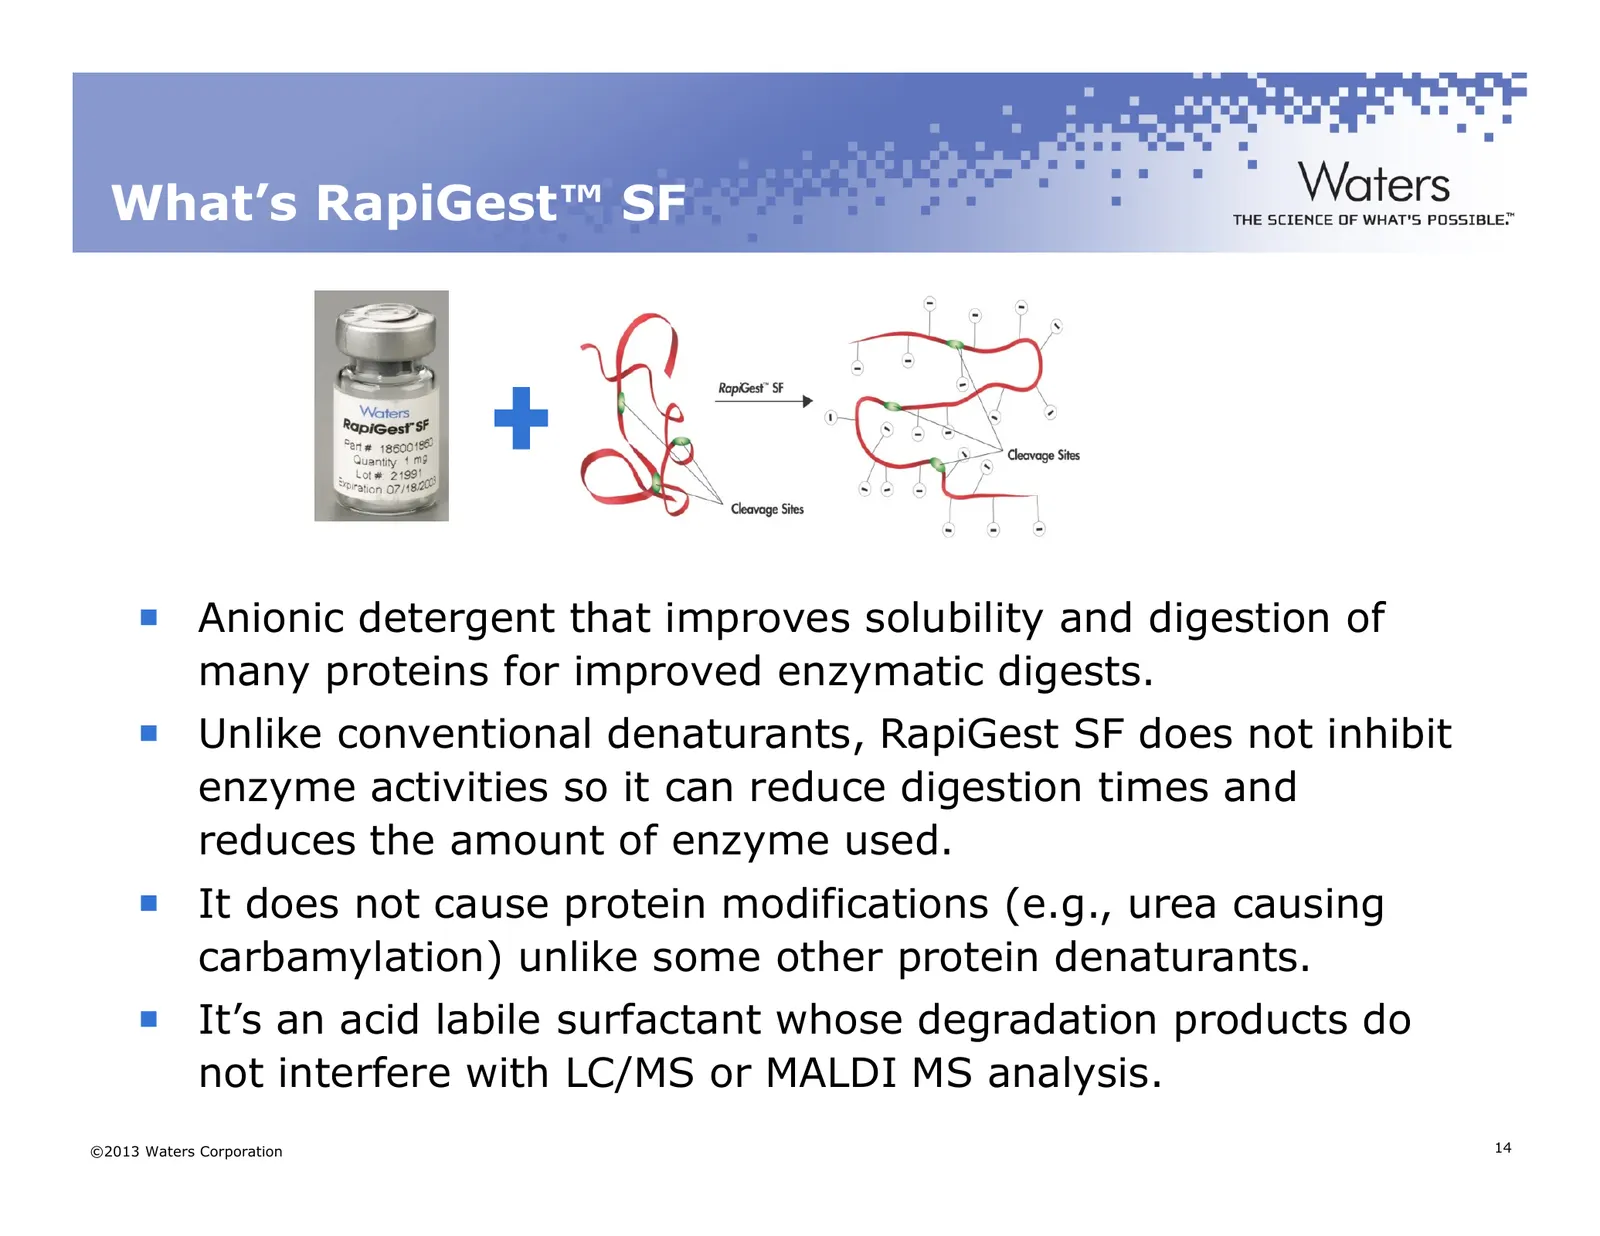
Slide 14: What's RapiGest SF
What’s RapiGest™ SF Anionic detergent that improves solubility and digestion of many proteins for improved enzymatic digests. Unlike conventional denaturants, RapiGest SF does not inhibit enzyme activities so it can reduce digestion times and reduces the amount of enzyme used. It does not cause prot
Slide 15: Reproducible Peptide Mapping
Reproducible Peptide Mapping Pitfalls of Peptide Mapping – that can affect robustness, reproducibility and accuracy: – Sample preparation o Incomplete digestion o Non-reproducible digestion conditions o Non-specific cleavages (over-digestion) o Enzyme lot-to-lot variability (activity units or mass?)
Slide 16: Agenda
Agenda What is Peptide Mapping and Why Do It? Protein Digestion Peptide Separations On to Part II ©2013 Waters Corporation 16
Slide 17: Peptide Separations
Peptide Separations Column Selection – Ethylene Bridged Hybrid (BEH) Particle Technology – UPLC vs HPLC – Charged Surface Hybrid Technology Fine Tuning Your Separation ©2013 Waters Corporation 17
Slide 18: Ethylene Bridged Hybrid - BEH Technology
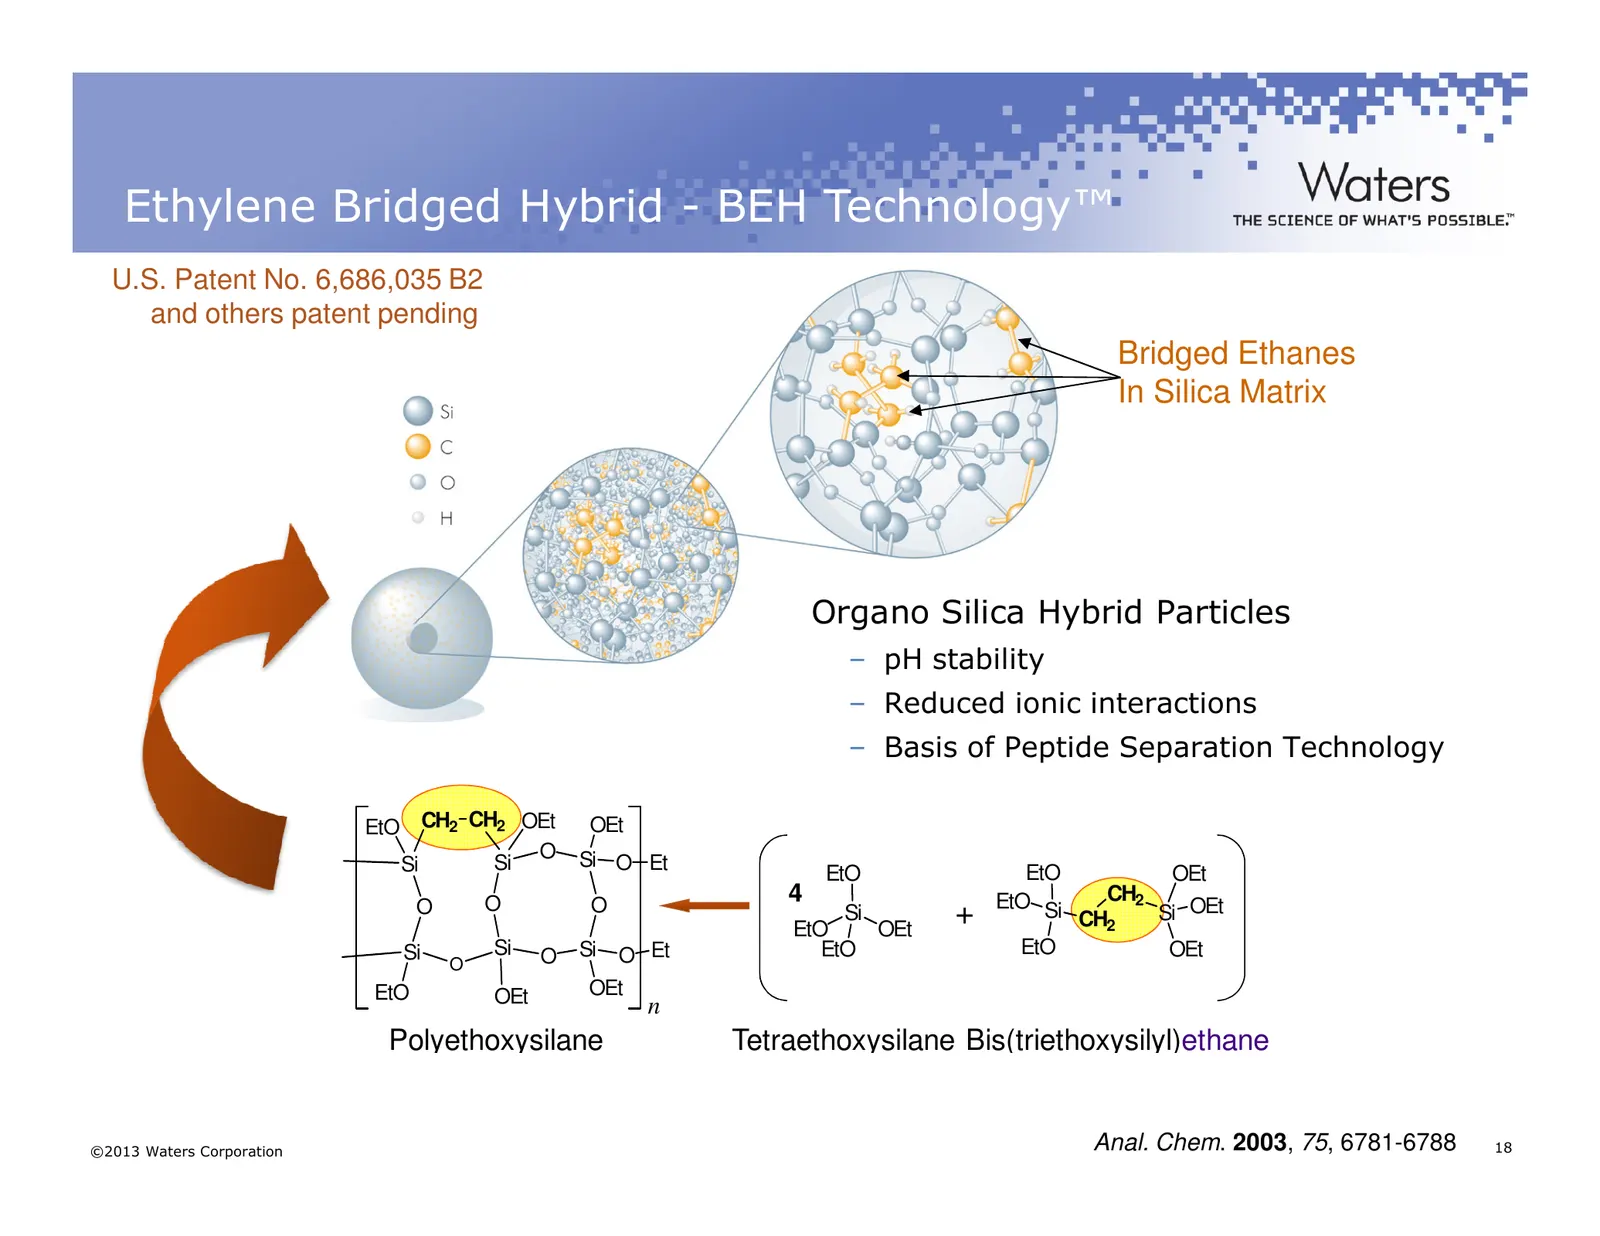
Ethylene Bridged Hybrid - BEH Technology™ U.S. Patent No. 6,686,035 B2 and others patent pending Bridged Ethanes In Silica Matrix Organo Silica Hybrid Particles – pH stability – Reduced ionic interactions – Basis of Peptide Separation Technology EtO CH2 CH2 OEt OEt O Si O Et Si Si EtO OEt EtO O O 4
Slide 19: Small Particle Size
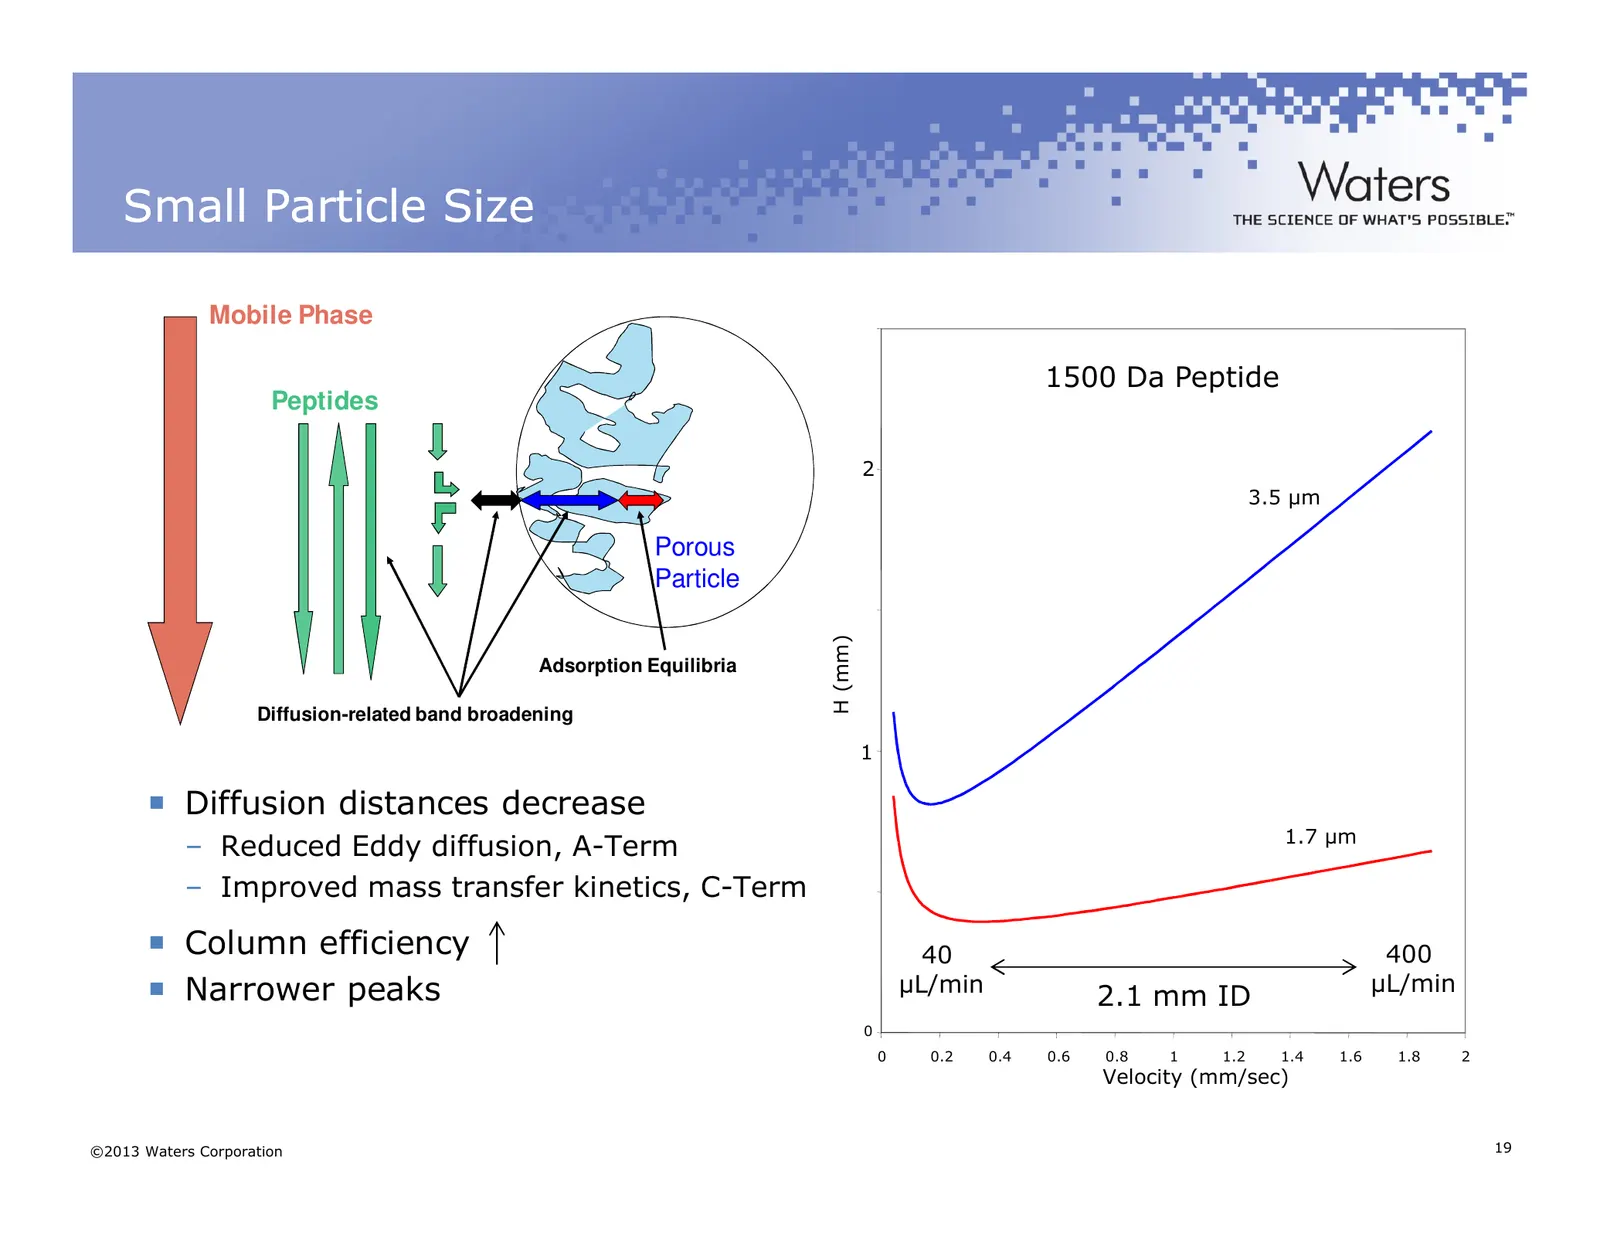
Small Particle Size Mobile Phase 1500 Da Peptide Peptides 2 3.5 µm Porous Particle H (mm) Adsorption Equilibria Diffusion-related band broadening 1 Diffusion distances decrease 1.7 µm – Reduced Eddy diffusion, A-Term – Improved mass transfer kinetics, C-Term Column efficiency 40 400 Narrower peaks µ
Slide 20: Why UPLC for peptide mapping
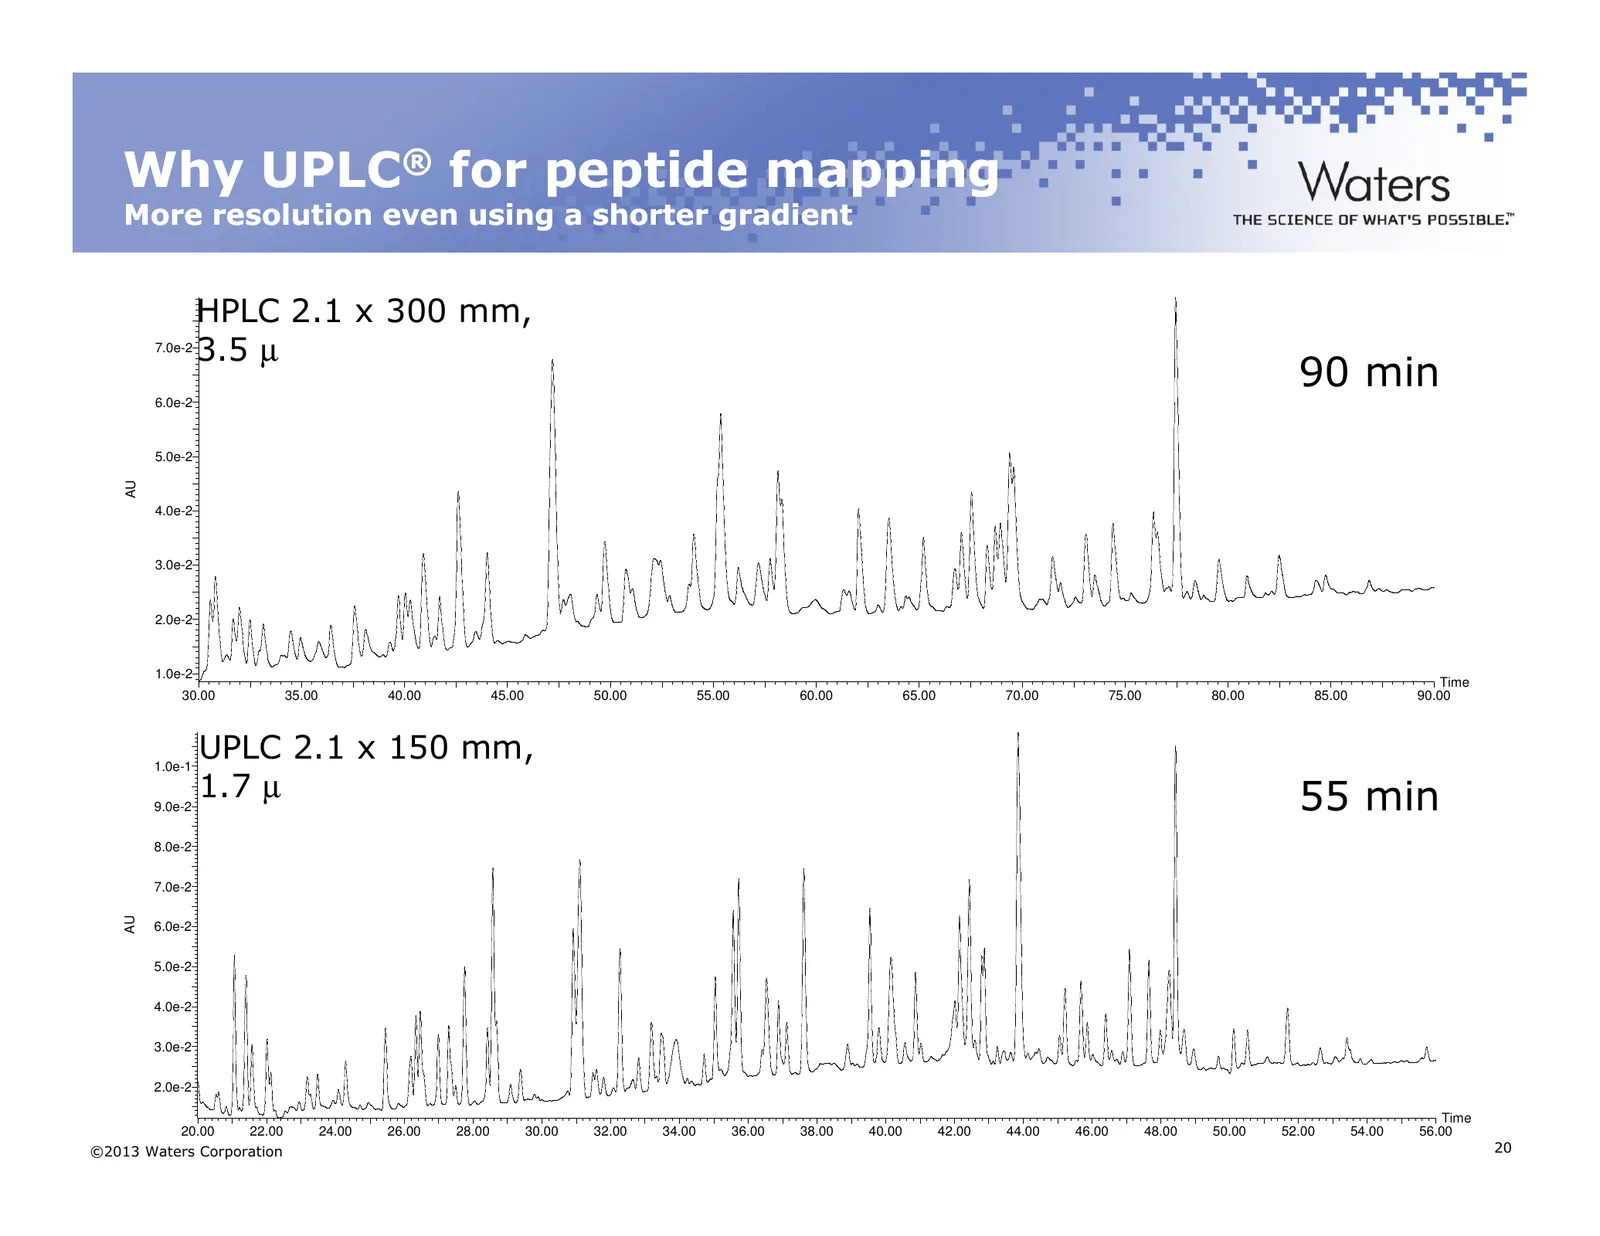
Why UPLC® for peptide mapping More resolution even using a shorter gradient HPLC 2.1 x 300 mm, 7.0e-2 3.5 µ 90 min 6.0e-2 5.0e-2 AU 4.0e-2 3.0e-2 2.0e-2 1.0e-2 Time 30.00 35.00 40.00 45.00 50.00 55.00 60.00 65.00 70.00 75.00 80.00 85.00 90.00 1.0e-1 UPLC 2.1 x 150 mm, 9.0e-2 1.7 µ 55 min 8.0e-2 7.0e
Slide 21: Charged Surface Hybrid (CSH) Technology
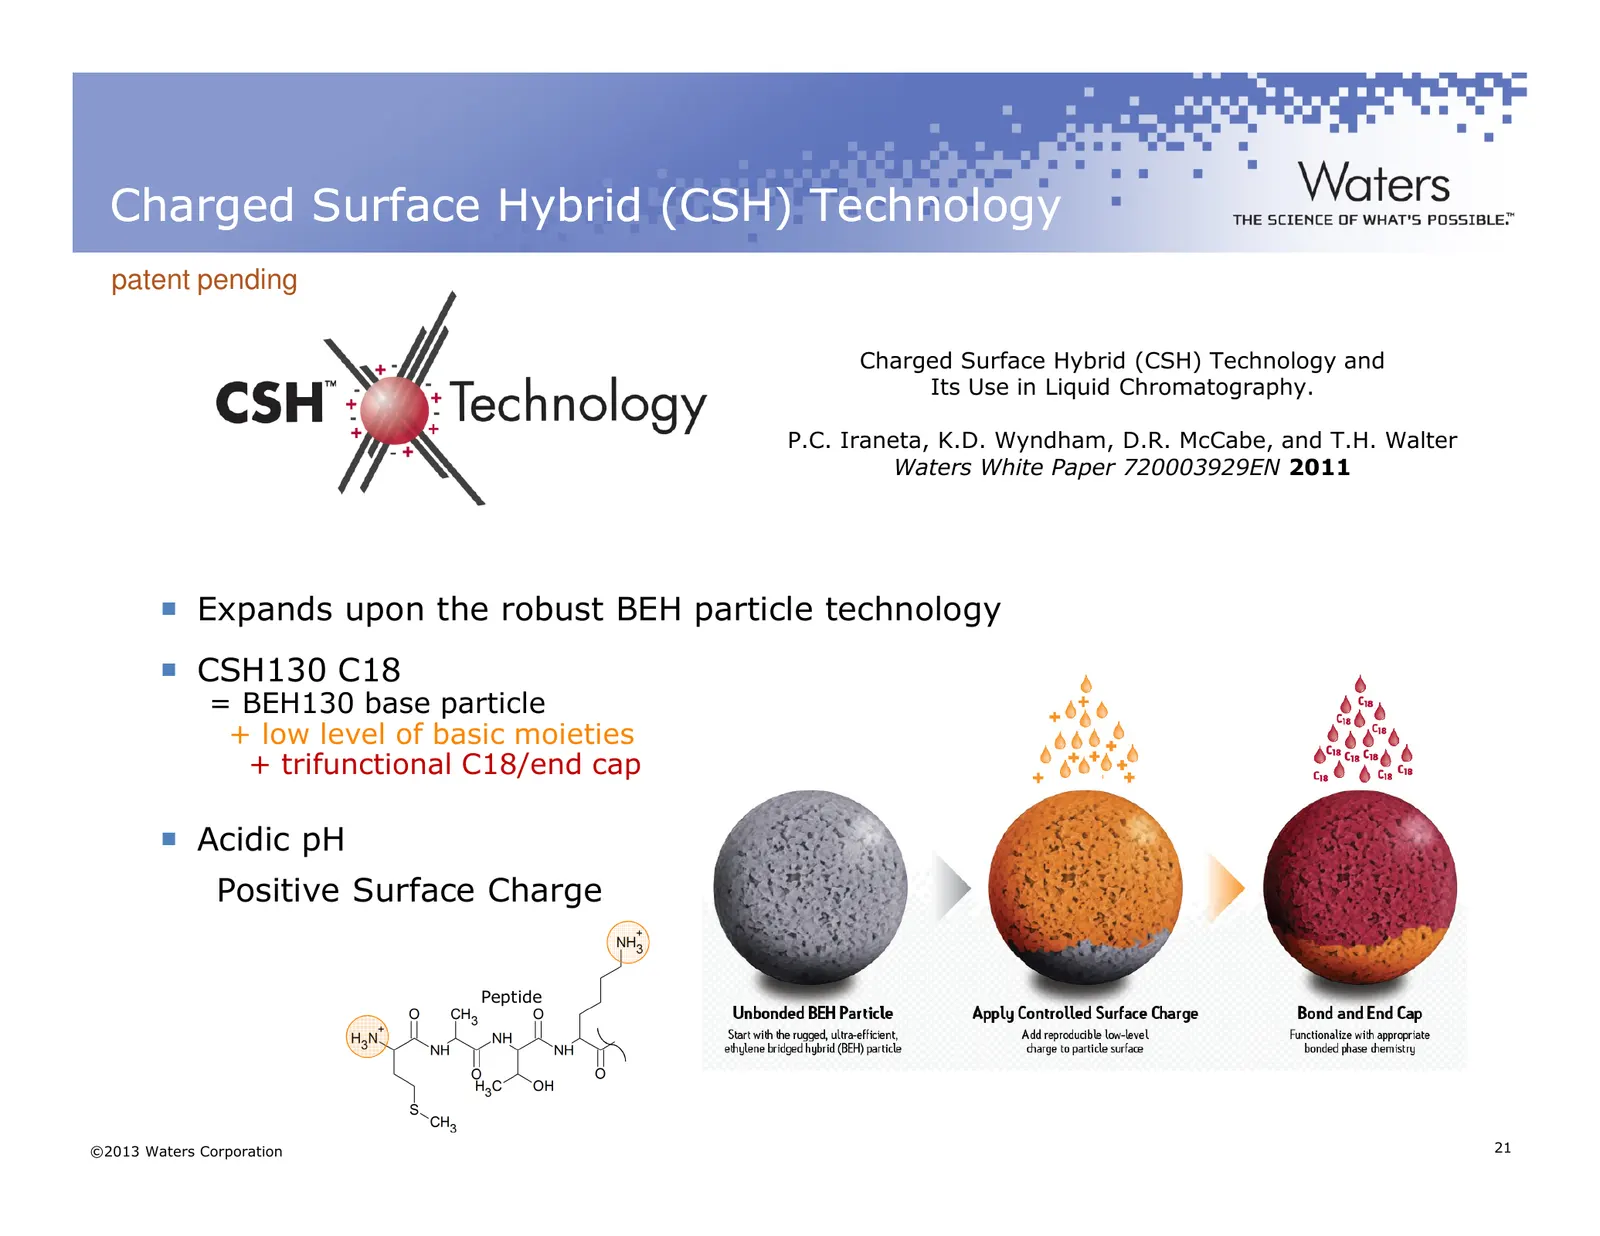
Charged Surface Hybrid (CSH) Technology patent pending Charged Surface Hybrid (CSH) Technology and Its Use in Liquid Chromatography. P.C. Iraneta, K.D. Wyndham, D.R. McCabe, and T.H. Walter Waters White Paper 720003929EN 2011 Expands upon the robust BEH particle technology CSH130 C18 = BEH130 base p
Slide 22: Peak Capacity
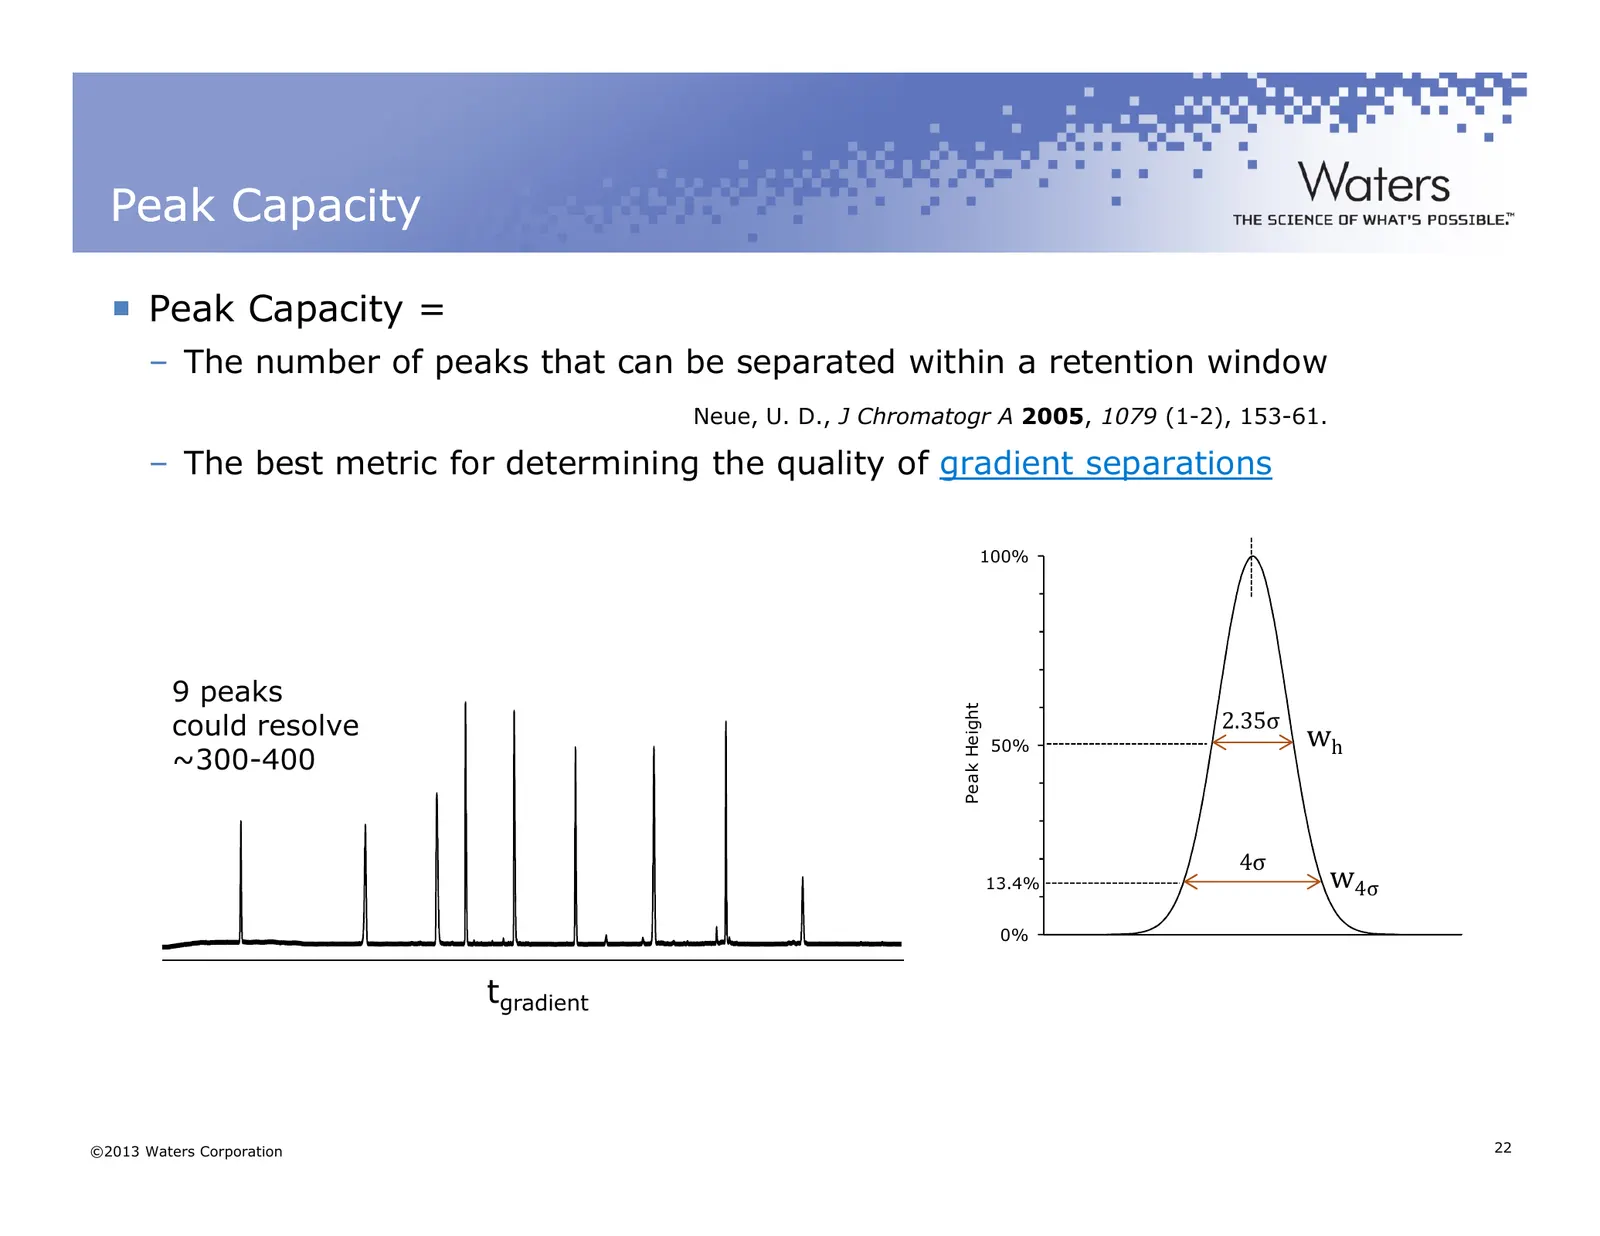
Peak Capacity Peak Capacity = – The number of peaks that can be separated within a retention window Neue, U. D., J Chromatogr A 2005, 1079 (1-2), 153-61. – The best metric for determining the quality of gradient separations 100% 9 peaks Peak Height could resolve 2.35σ wh 50% ~300-400 4σ 13.4% w4σ 0%
Slide 23: A Novel Column Chemistry: CSH130 C18
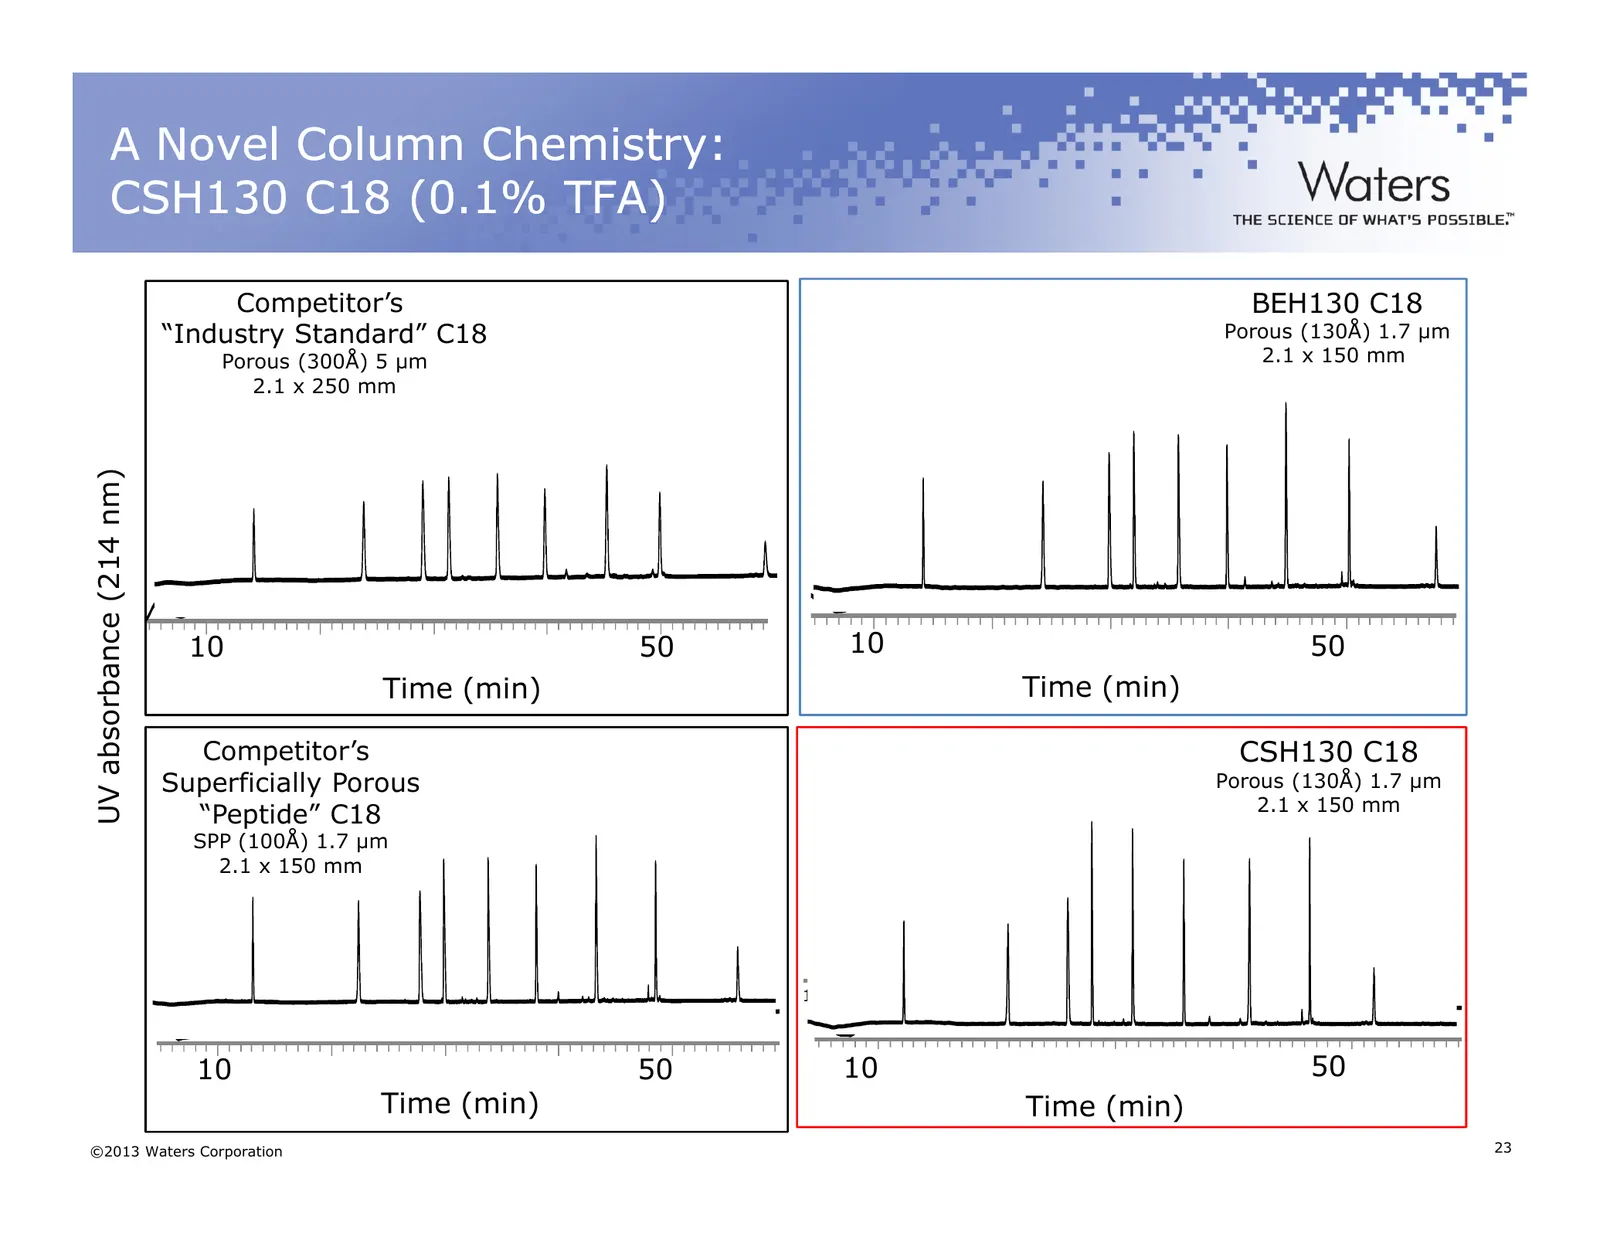
A Novel Column Chemistry: CSH130 C18 (0.1% TFA) Competitor’s BEH130 C18 “Industry Standard” C18 Porous (130Å) 1.7 µm Porous (300Å) 5 µm 2.1 x 150 mm 2.1 x 250 mm UV absorbance (214 nm) 10 50 10 50 Time (min) 10 20 Time (min) 30 40 50 Competitor’s CSH130 C18 Superficially Porous Porous (130Å) 1.7 µm
Slide 24: Peak Capacity - FA vs TFA
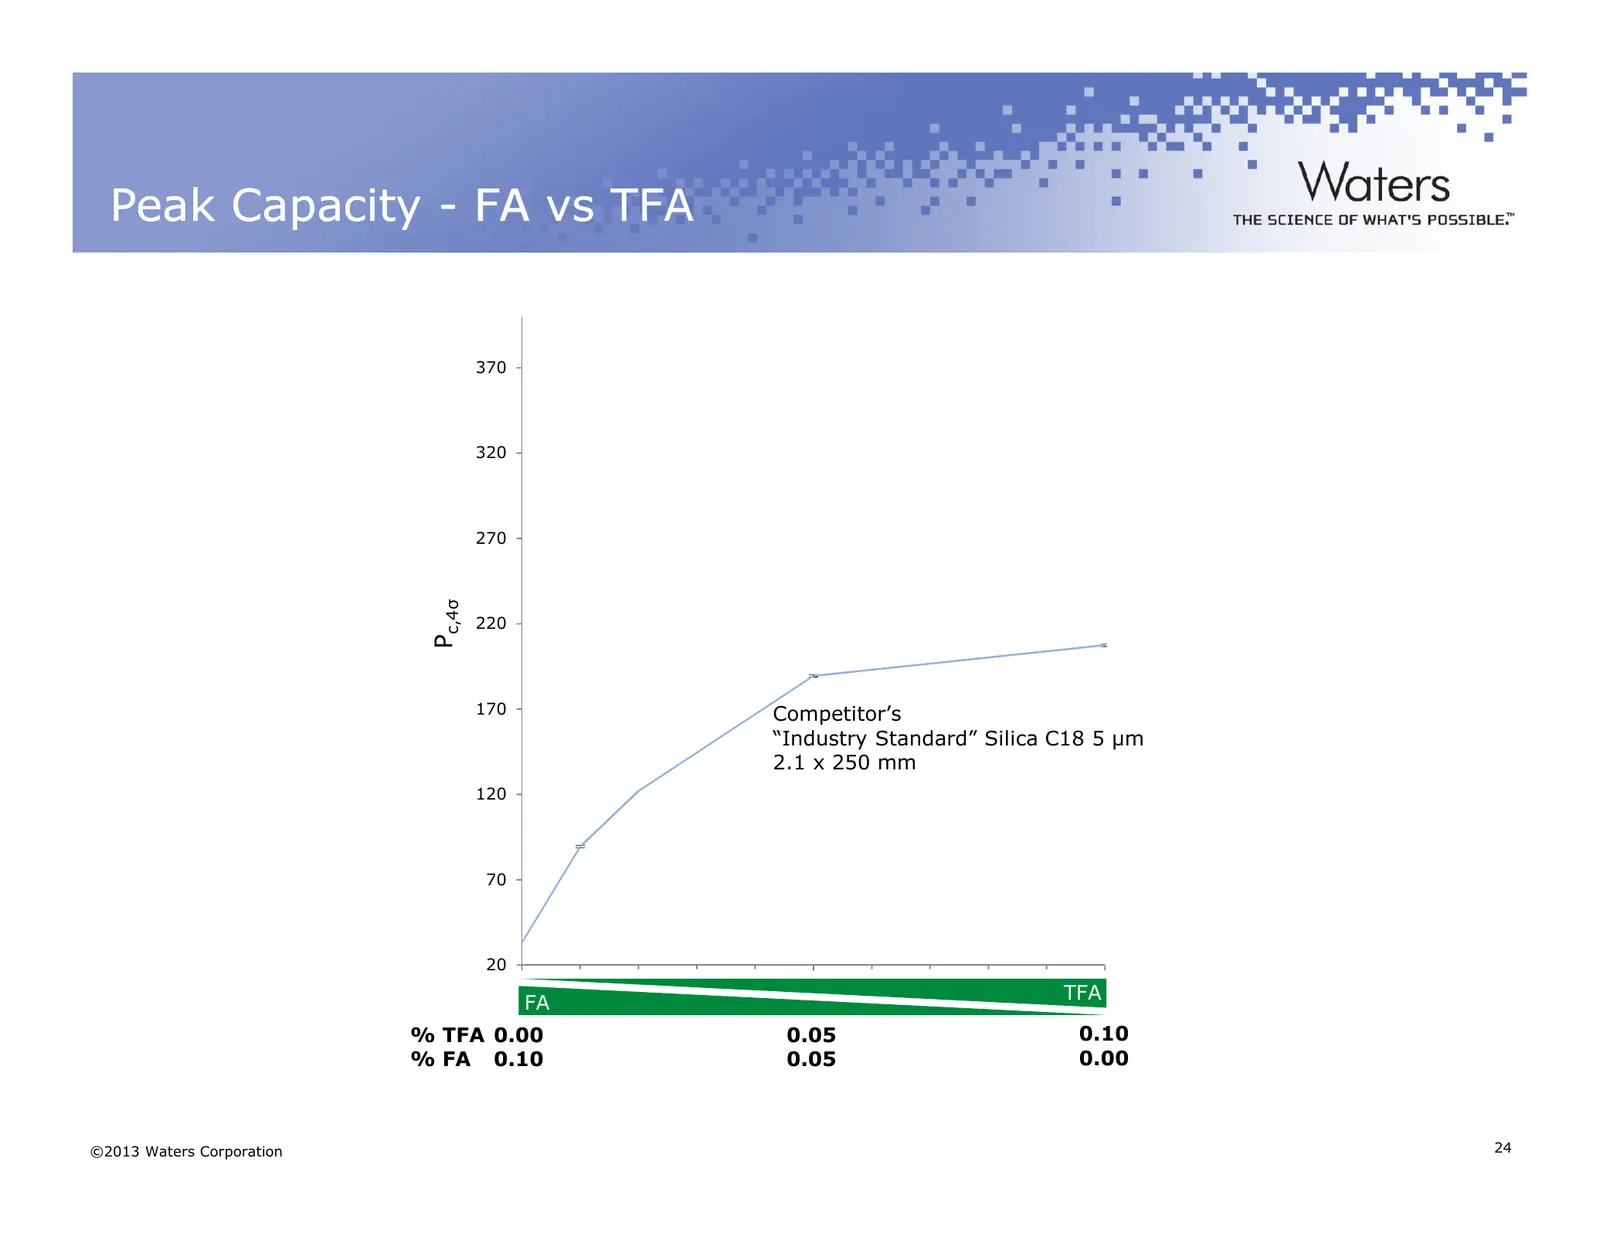
Peak Capacity - FA vs TFA 370 320 270 c,4σ Pc,4 220 170 Competitor’s “Industry Standard” Silica C18 5 µm 2.1 x 250 mm 120 70 20 0.00 0.05 0.10 TFA FA Percent TFA % TFA 0.00 0.05 0.10 % FA 0.10 0.05 0.00 ©2013 Waters Corporation 24
Slide 25: Peak Capacity - FA vs TFA
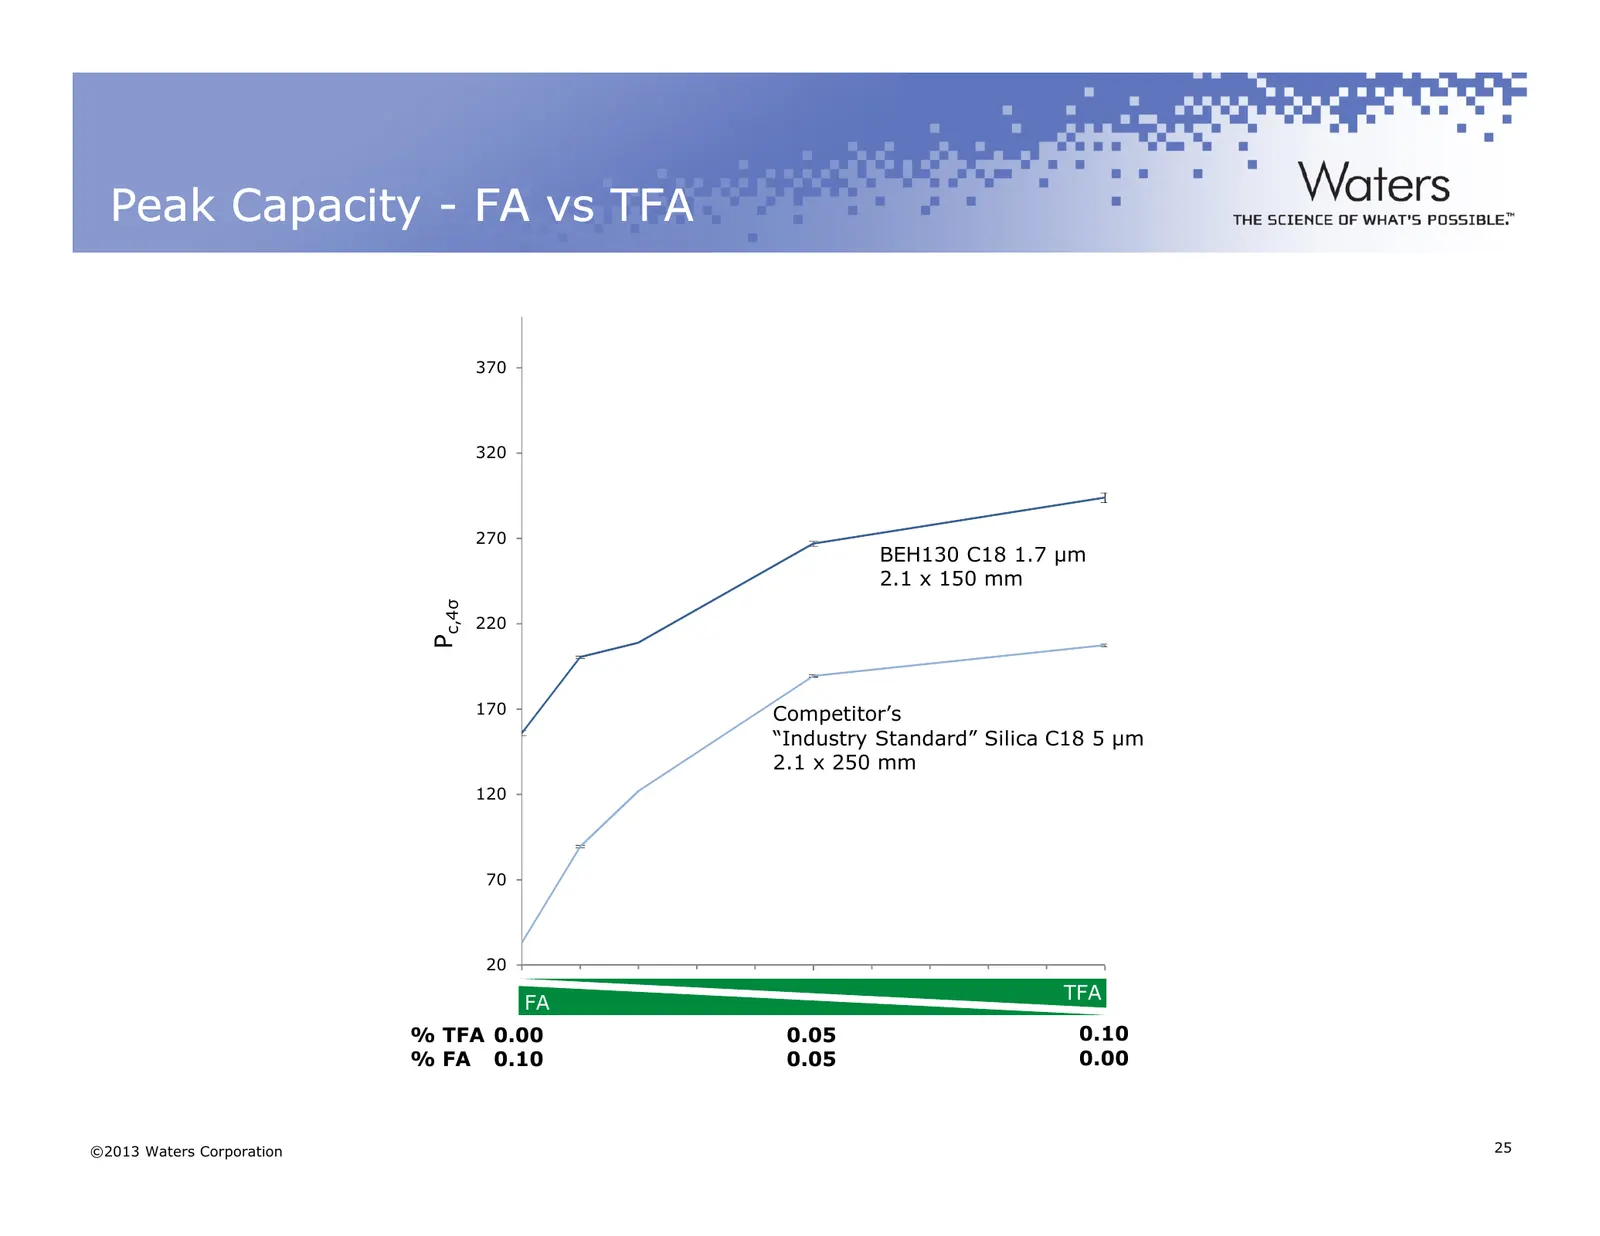
Peak Capacity - FA vs TFA 370 320 270 BEH130 C18 1.7 µm 2.1 x 150 mm c,4σ Pc,4 220 170 Competitor’s “Industry Standard” Silica C18 5 µm 2.1 x 250 mm 120 70 20 0.00 0.05 0.10 TFA FA Percent TFA % TFA 0.00 0.05 0.10 % FA 0.10 0.05 0.00 ©2013 Waters Corporation 25
Slide 26: Peak Capacity - FA vs TFA
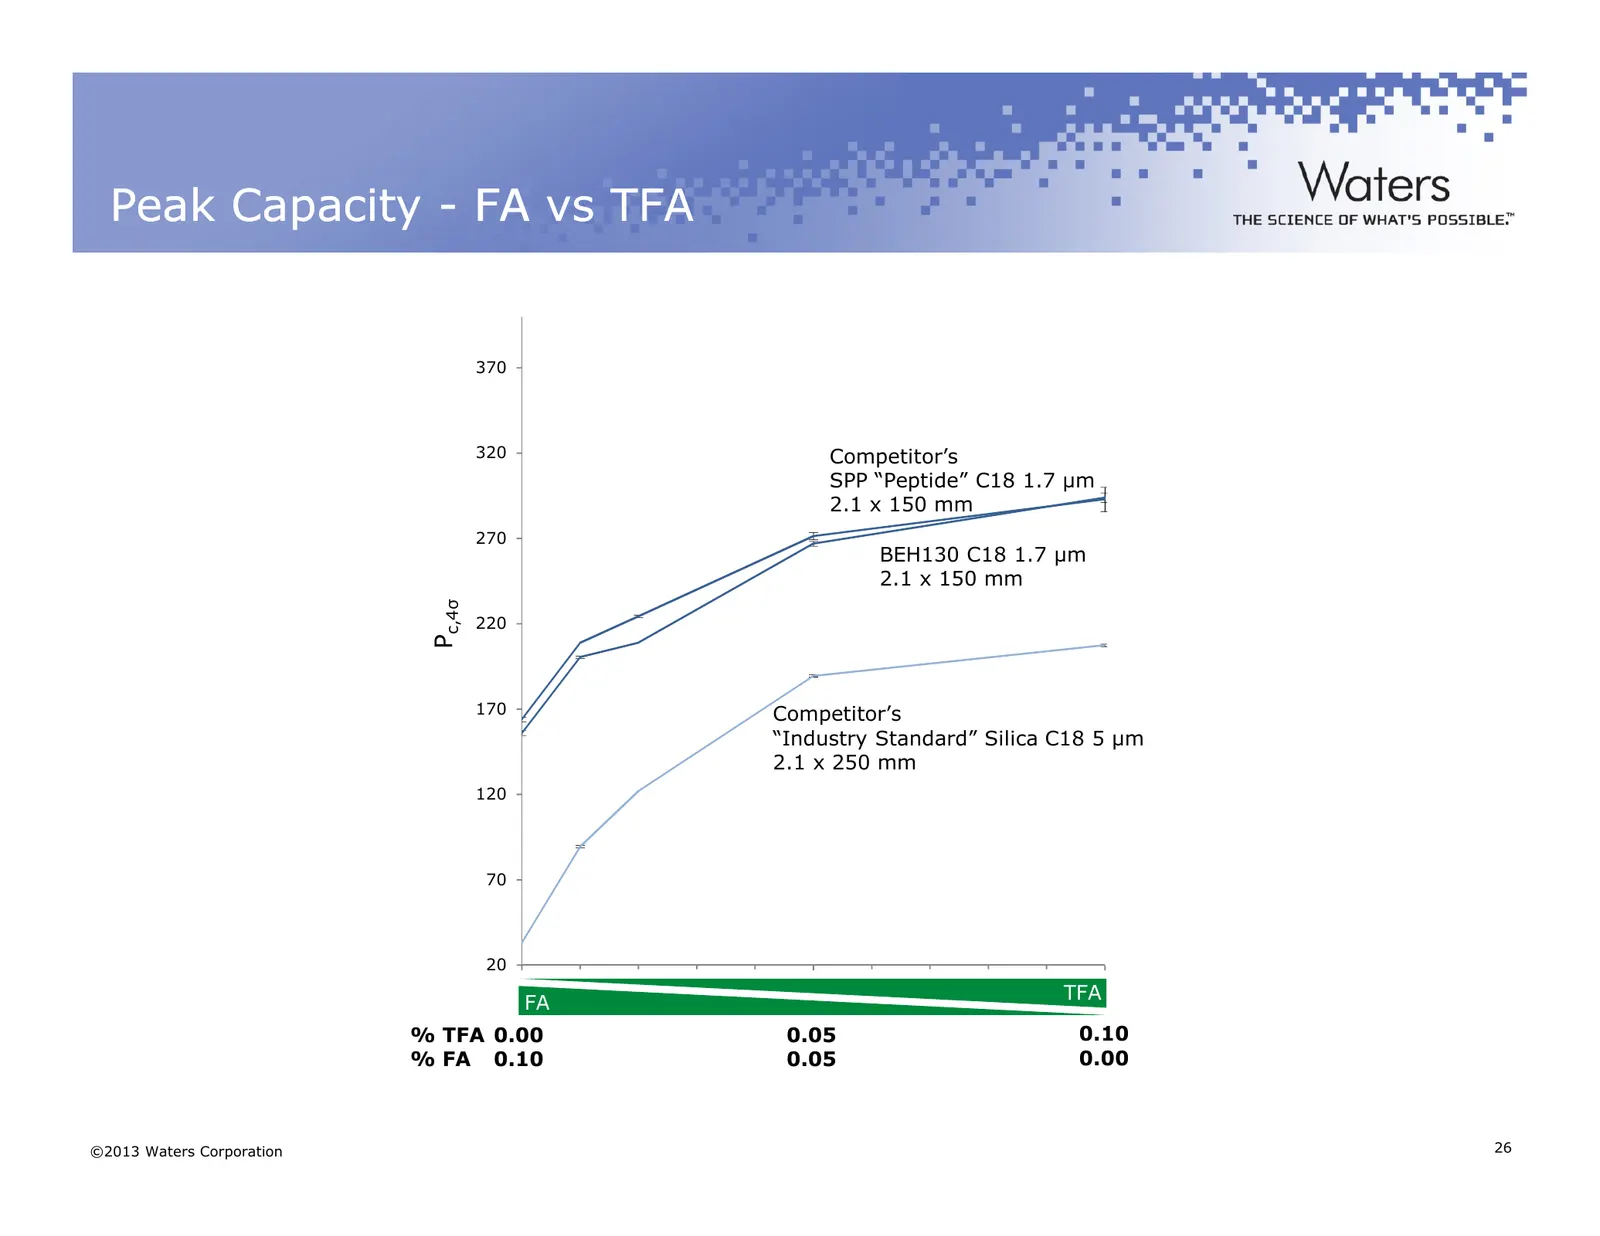
Peak Capacity - FA vs TFA 370 320 Competitor’s SPP “Peptide” C18 1.7 µm 2.1 x 150 mm 270 BEH130 C18 1.7 µm 2.1 x 150 mm c,4σ Pc,4 220 170 Competitor’s “Industry Standard” Silica C18 5 µm 2.1 x 250 mm 120 70 20 0.00 0.05 0.10 TFA FA Percent TFA % TFA 0.00 0.05 0.10 % FA 0.10 0.05 0.00 ©2013 Waters Co
Slide 27: Peak Capacity - FA vs TFA
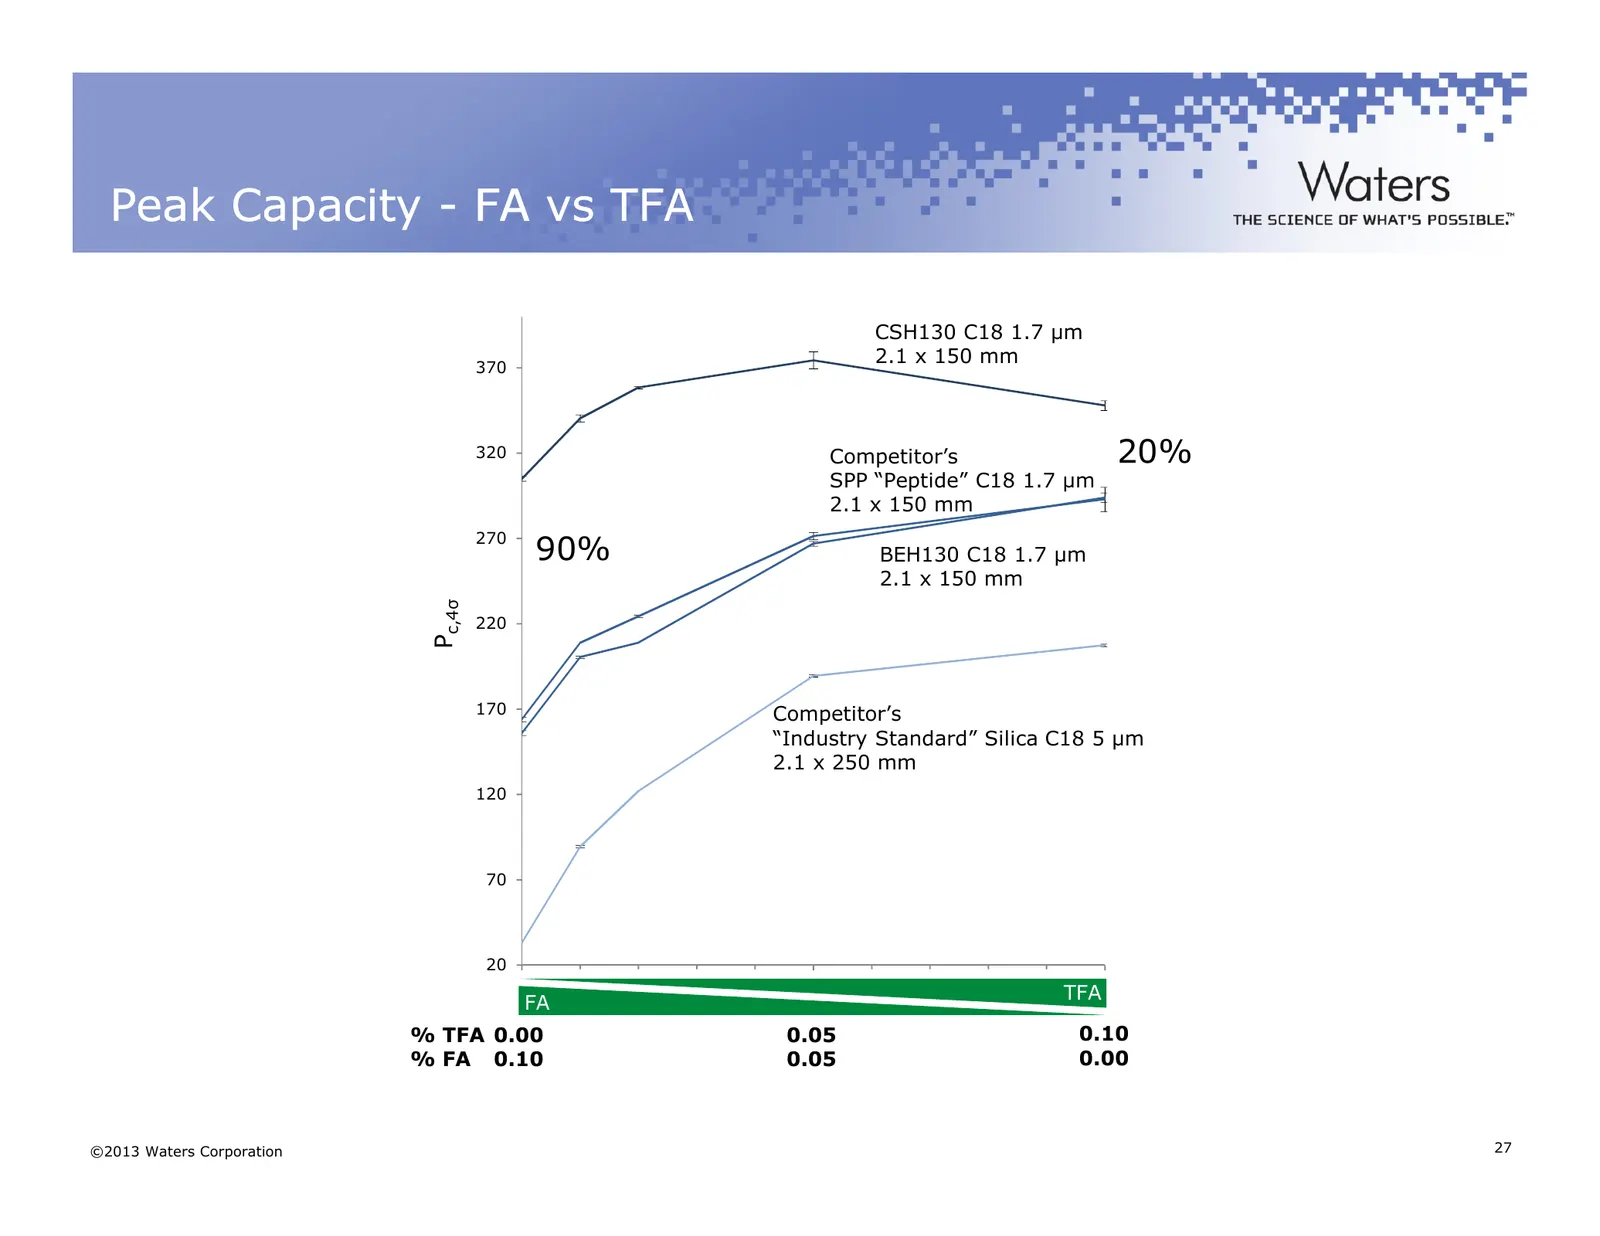
Peak Capacity - FA vs TFA CSH130 C18 1.7 µm 370 2.1 x 150 mm 320 Competitor’s 20% SPP “Peptide” C18 1.7 µm 2.1 x 150 mm 270 90% BEH130 C18 1.7 µm 2.1 x 150 mm c,4σ Pc,4 220 170 Competitor’s “Industry Standard” Silica C18 5 µm 2.1 x 250 mm 120 70 20 0.00 0.05 0.10 TFA FA Percent TFA % TFA 0.00 0.05 0
Slide 28: Loadability
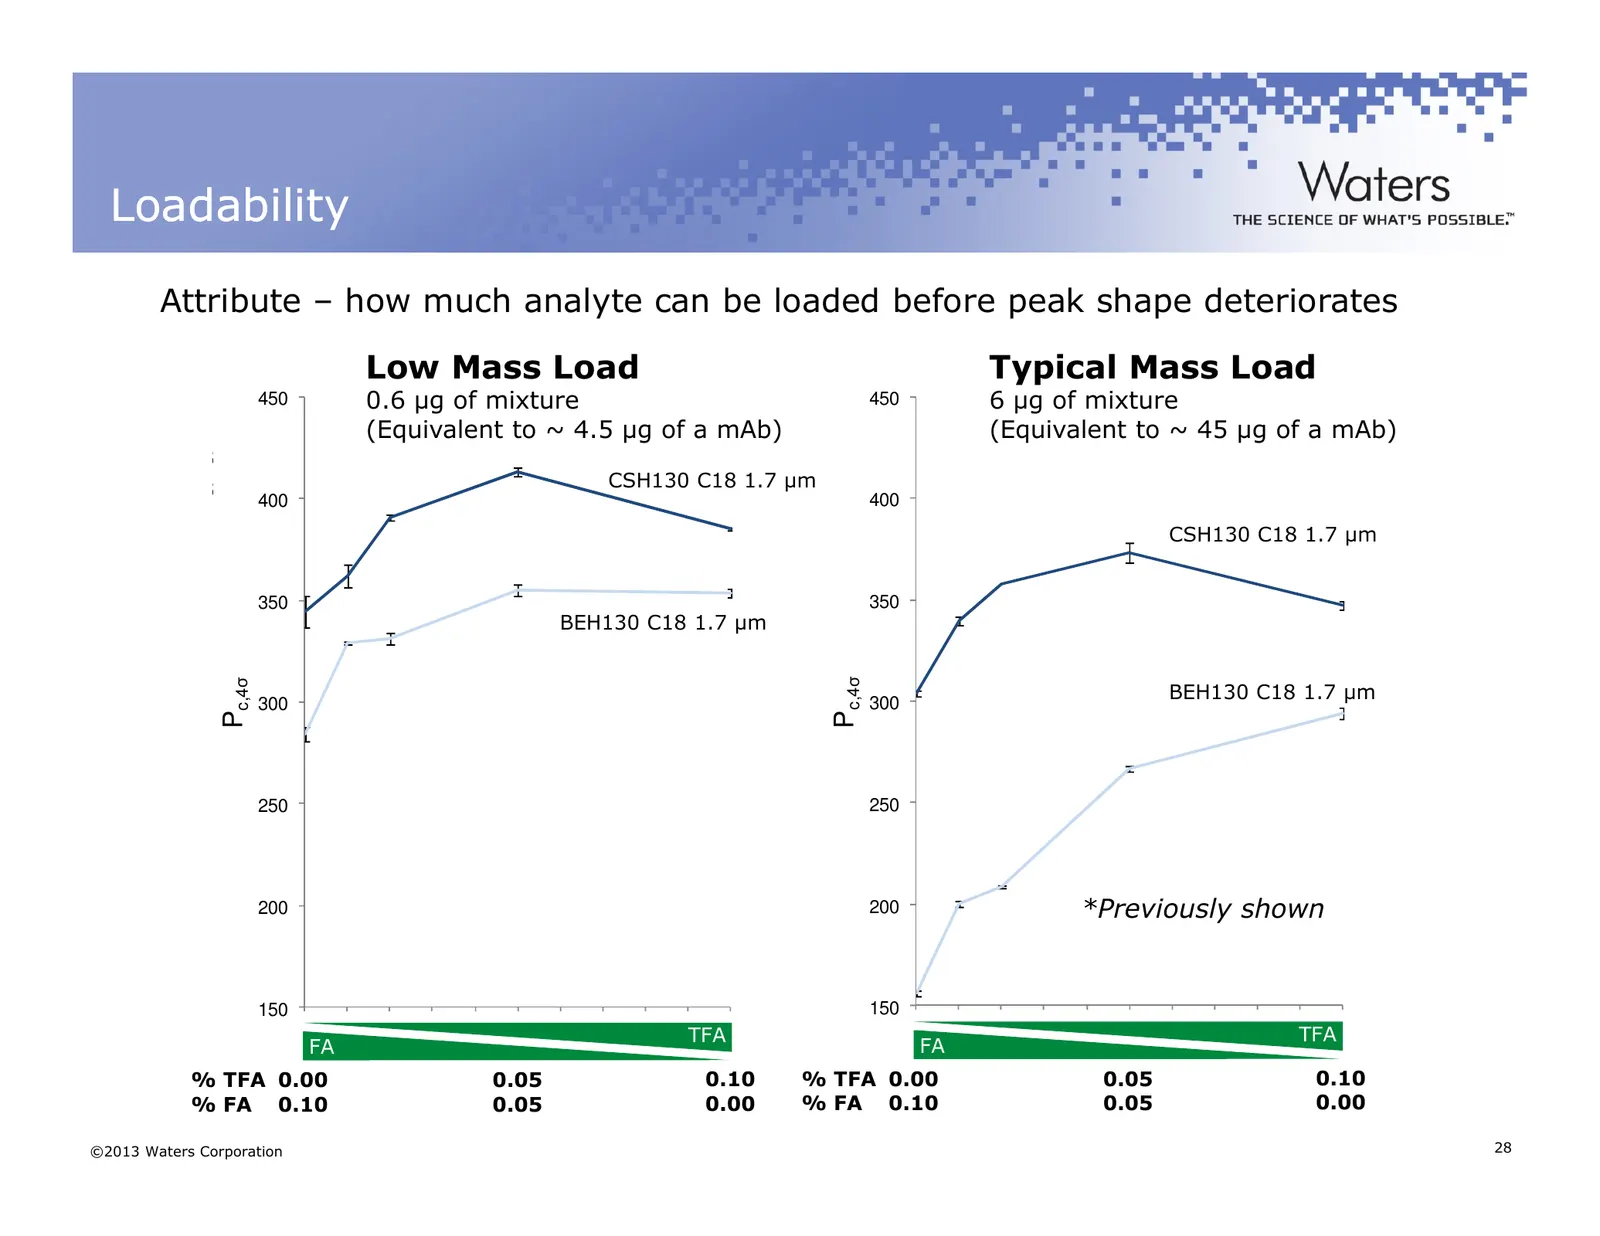
Loadability Attribute – how much analyte can be loaded before peak shape deteriorates Low Mass Load Typical Mass Load 0.6 µg of mixture 0.6 6 µg of mixture 6 µg ofMass mixture Lowµg ofLoad mixture 450 450 CSH C18 B Mass (Equivalent to ~ 4.5 µg of a mAb) CSH C18 A High Load (Equivalent to ~ 45 µg of
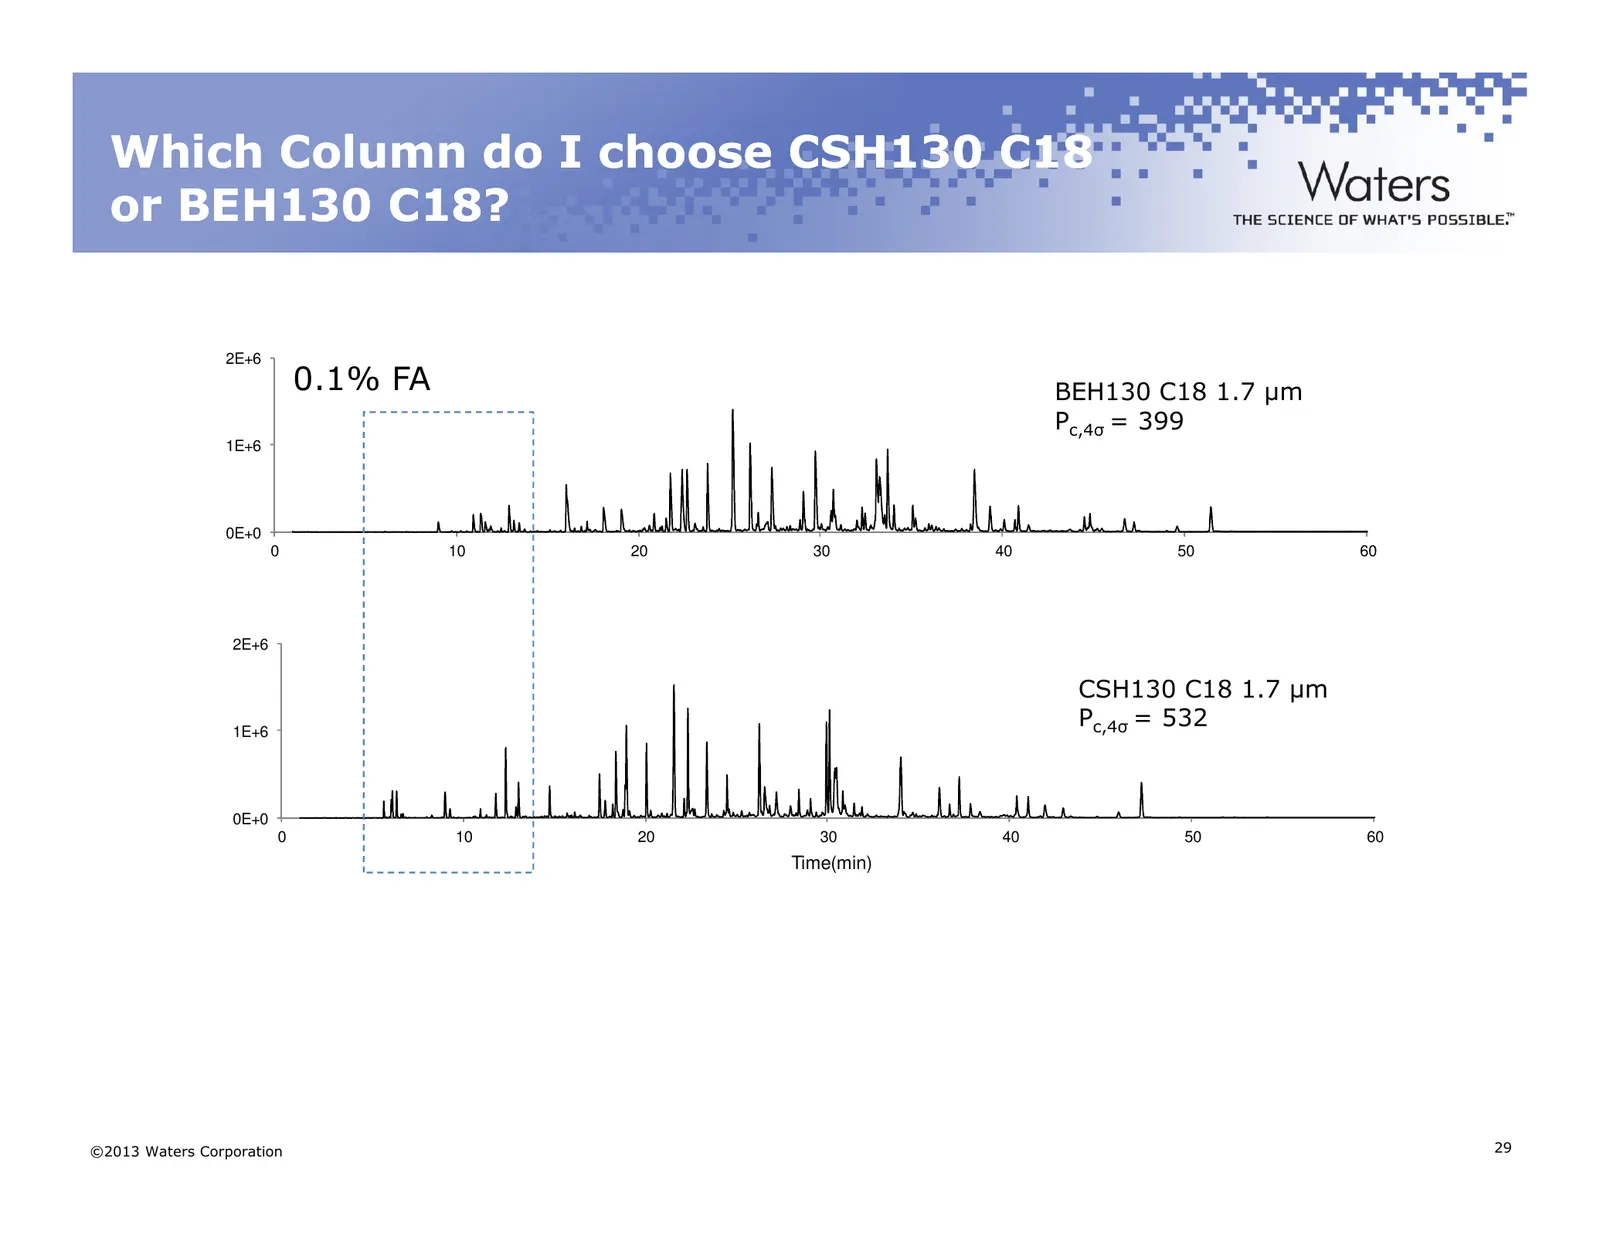
Slide 29: Which Column do I choose CSH130 C18 or BEH130 C18?
Which Column do I choose CSH130 C18 or BEH130 C18? 2E+6 0.1% FA BEH130 BEH C18 C18 1.7 1.7 µmµm Pc,4σ = 399 Pc,4σ = 399 Intensity 1E+6 0E+0 0 10 20 30 40 50 60 0 10 20 30 40 50 60 2E+6 Time(min) CSH130 CSH C18C18 1.71.7 µmµm Intensity 1E+6 Pc,4σP= 532 c,4σ = 532 0E+0 0 10 20 30 40 50 60 Time(min) ©2
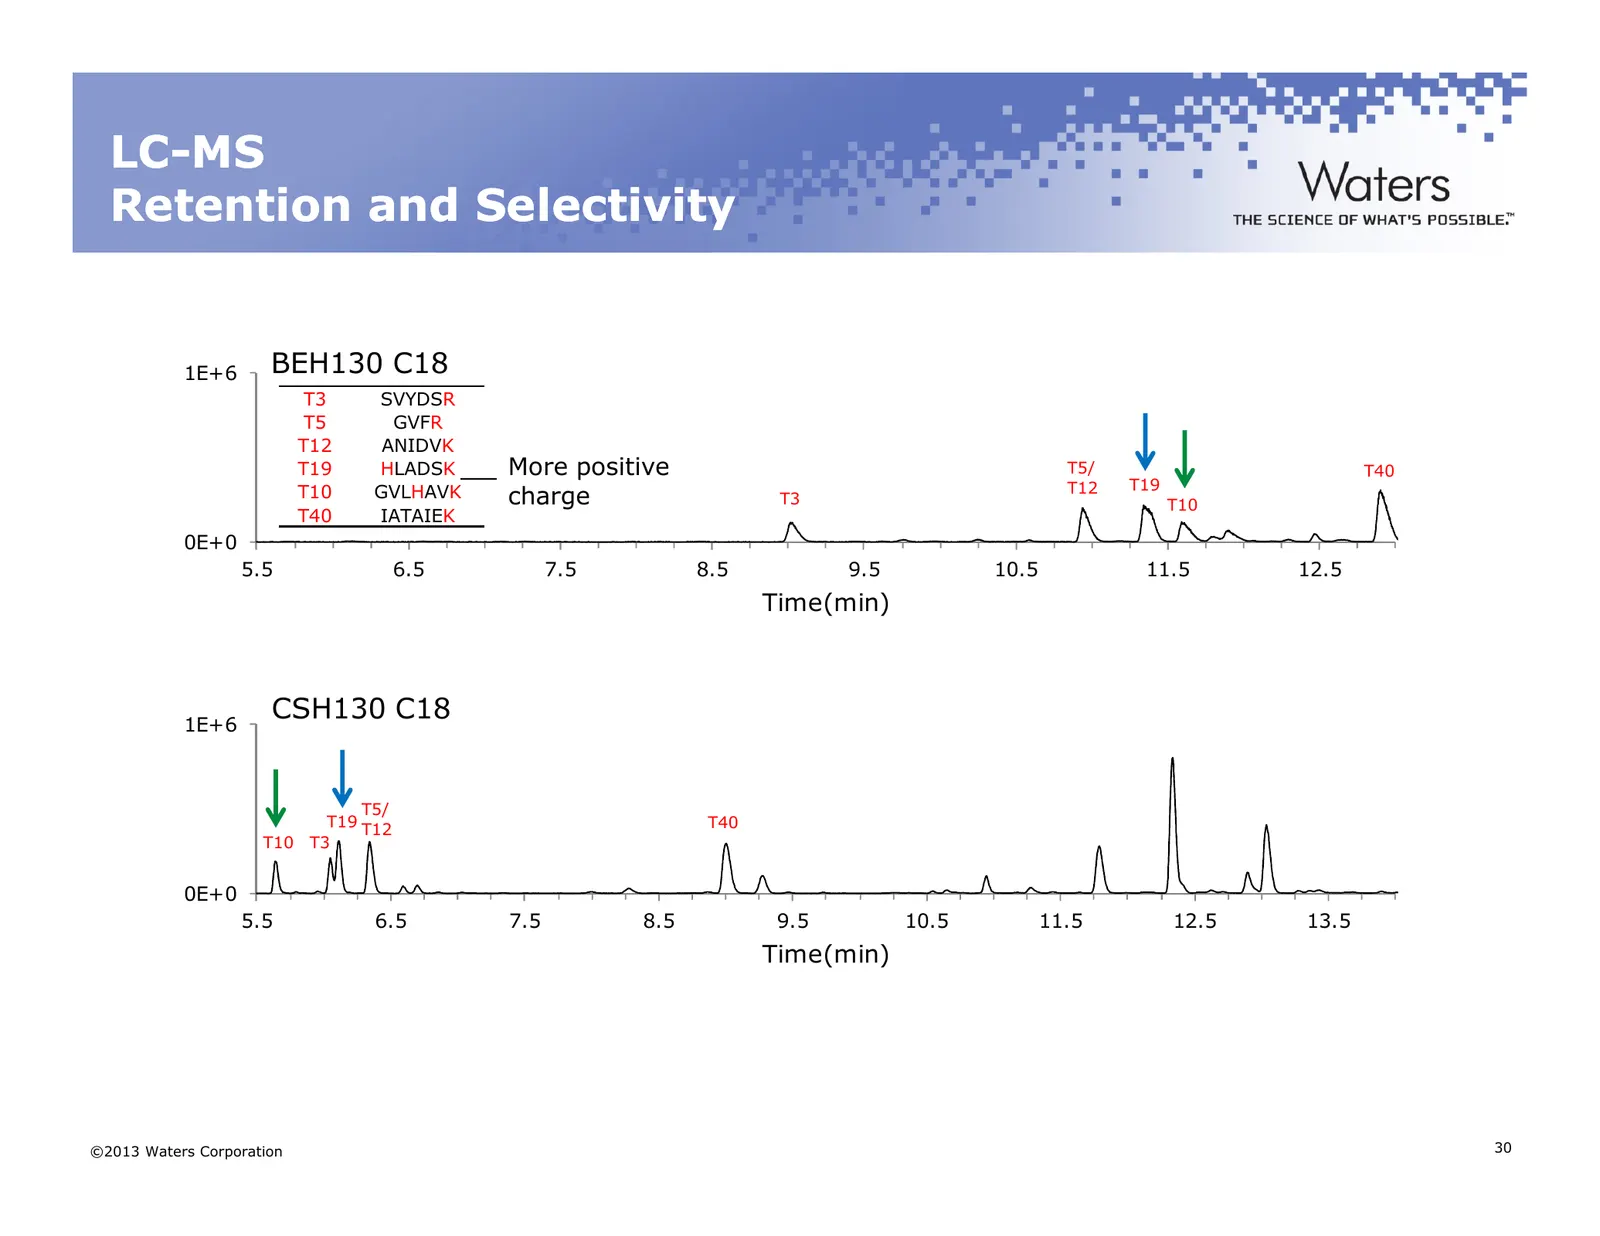
Slide 30: LC-MS Retention and Selectivity
LC LC--MS Retention and Selectivity 1E+6 BEH130 C18 T3 SVYDSR T5 GVFR T12 ANIDVK T19 HLADSK More positive T5/ T40 T12 T19 T10 GVLHAVK charge T3 T10 T40 IATAIEK 0E+0 5.5 6.5 7.5 8.5 9.5 10.5 11.5 12.5 Time(min) 1E+6 CSH130 C18 T5/ T19 T12 T40 T10 T3 0E+0 5.5 6.5 7.5 8.5 9.5 10.5 11.5 12.5 13.5 Time(m
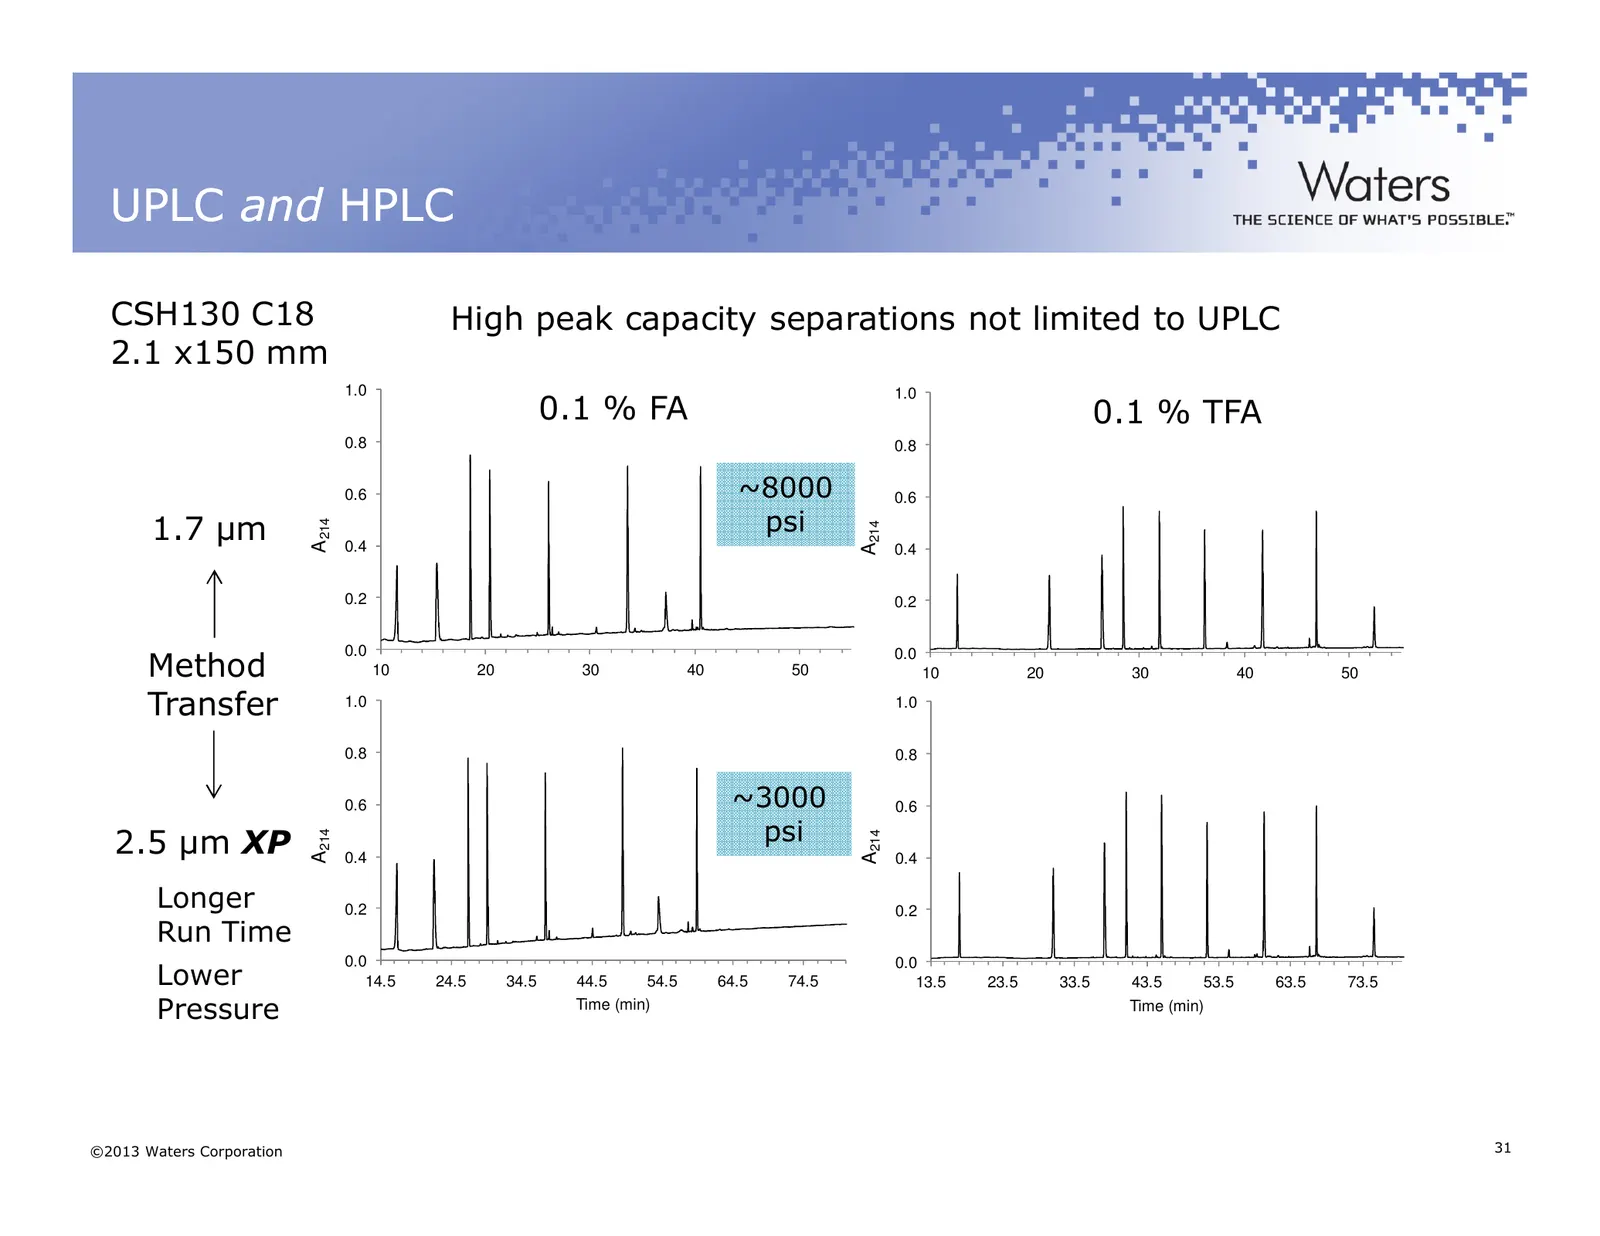
Slide 31: UPLC and HPLC
UPLC and HPLC CSH130 C18 High peak capacity separations not limited to UPLC 2.1 x150 mm 1.0 1.0 0.1 % FA 0.1 % TFA 0.8 0.8 0.6 ~8000 0.6 1.7 µm psi A214 A214 0.4 0.4 0.2 0.2 0.0 Method 0.0 10 20 30 40 50 10 20 30 40 50 Transfer 1.0 Time (min) Time (min) 1.0 0.8 0.8 0.6 ~3000 0.6 2.5 µm XP psi A214 A
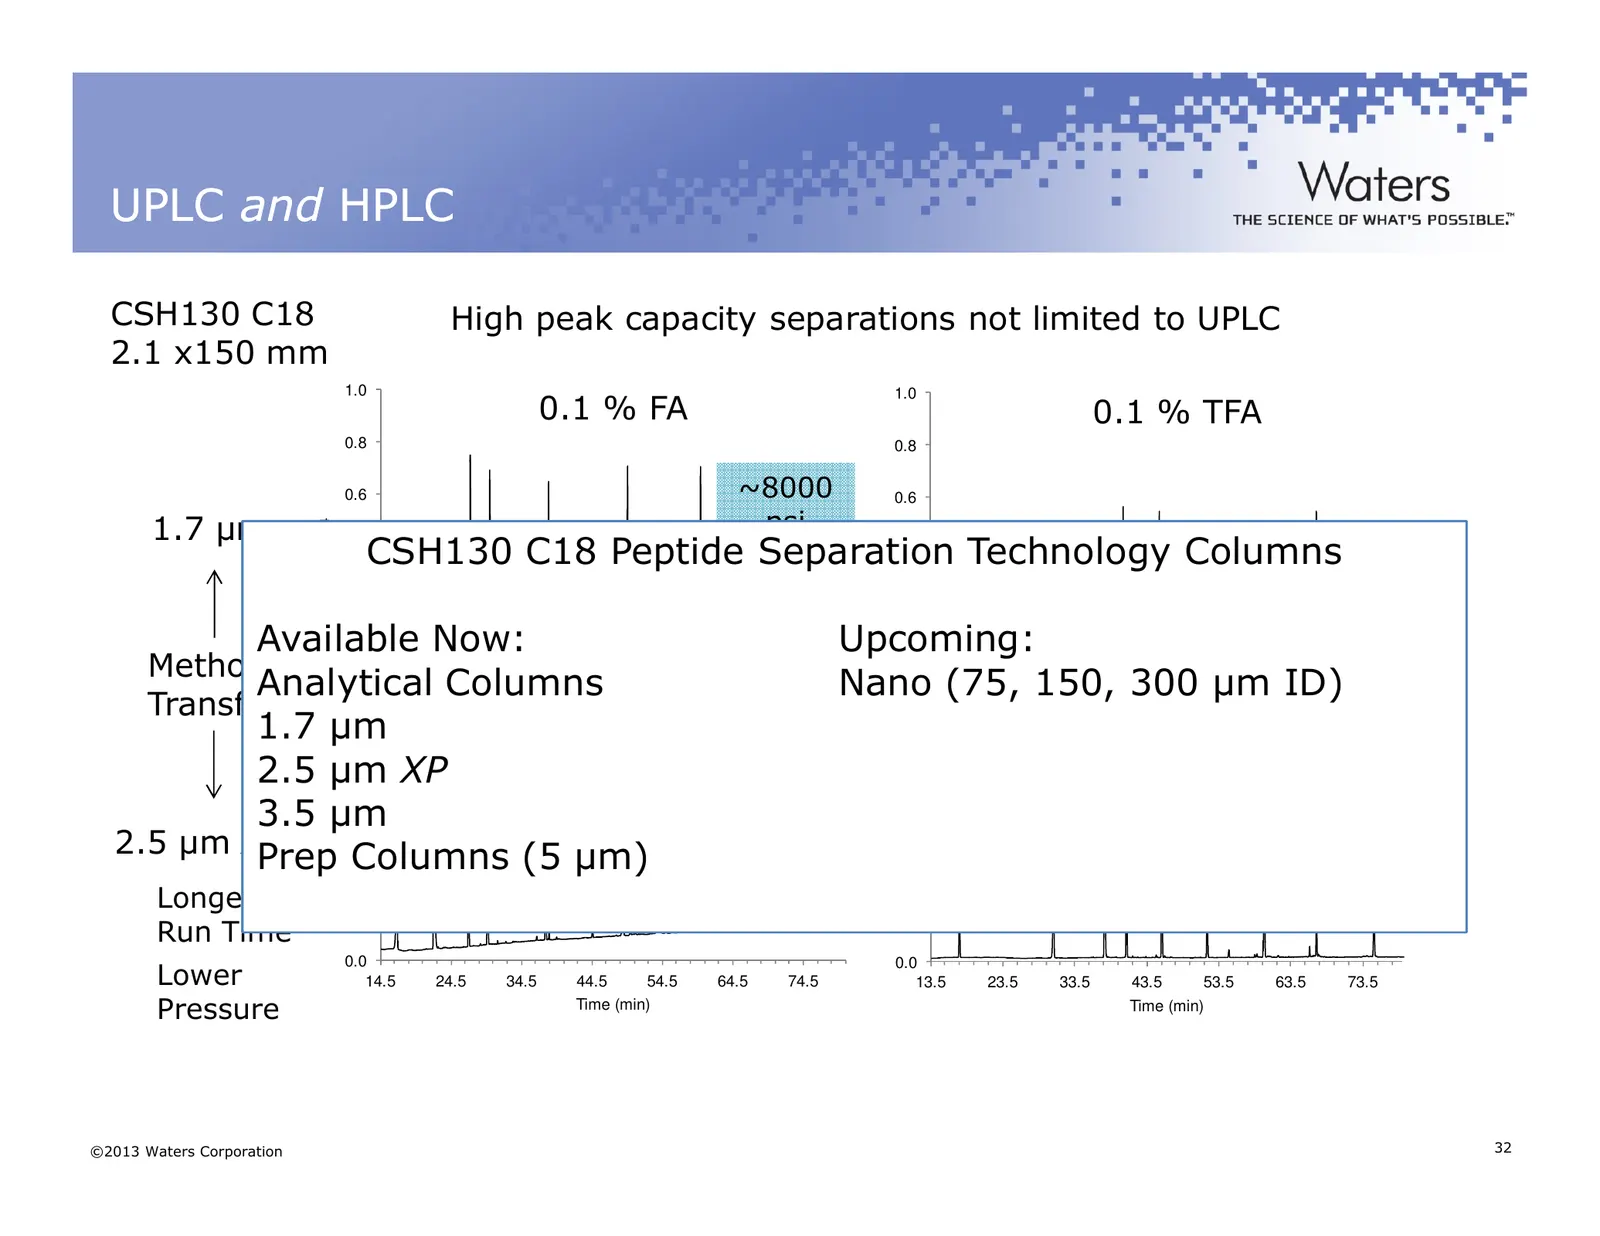
Slide 32: UPLC and HPLC
UPLC and HPLC CSH130 C18 High peak capacity separations not limited to UPLC 2.1 x150 mm 1.0 1.0 0.1 % FA 0.1 % TFA 0.8 0.8 0.6 ~8000 0.6 1.7 µm psi A214 A214 CSH130 C18 Peptide Separation 0.4 0.4 Technology Columns 0.2 0.2 Available 0.0 Now: Upcoming: Method 0.0 Analytical Columns Nano (75, 20150, T
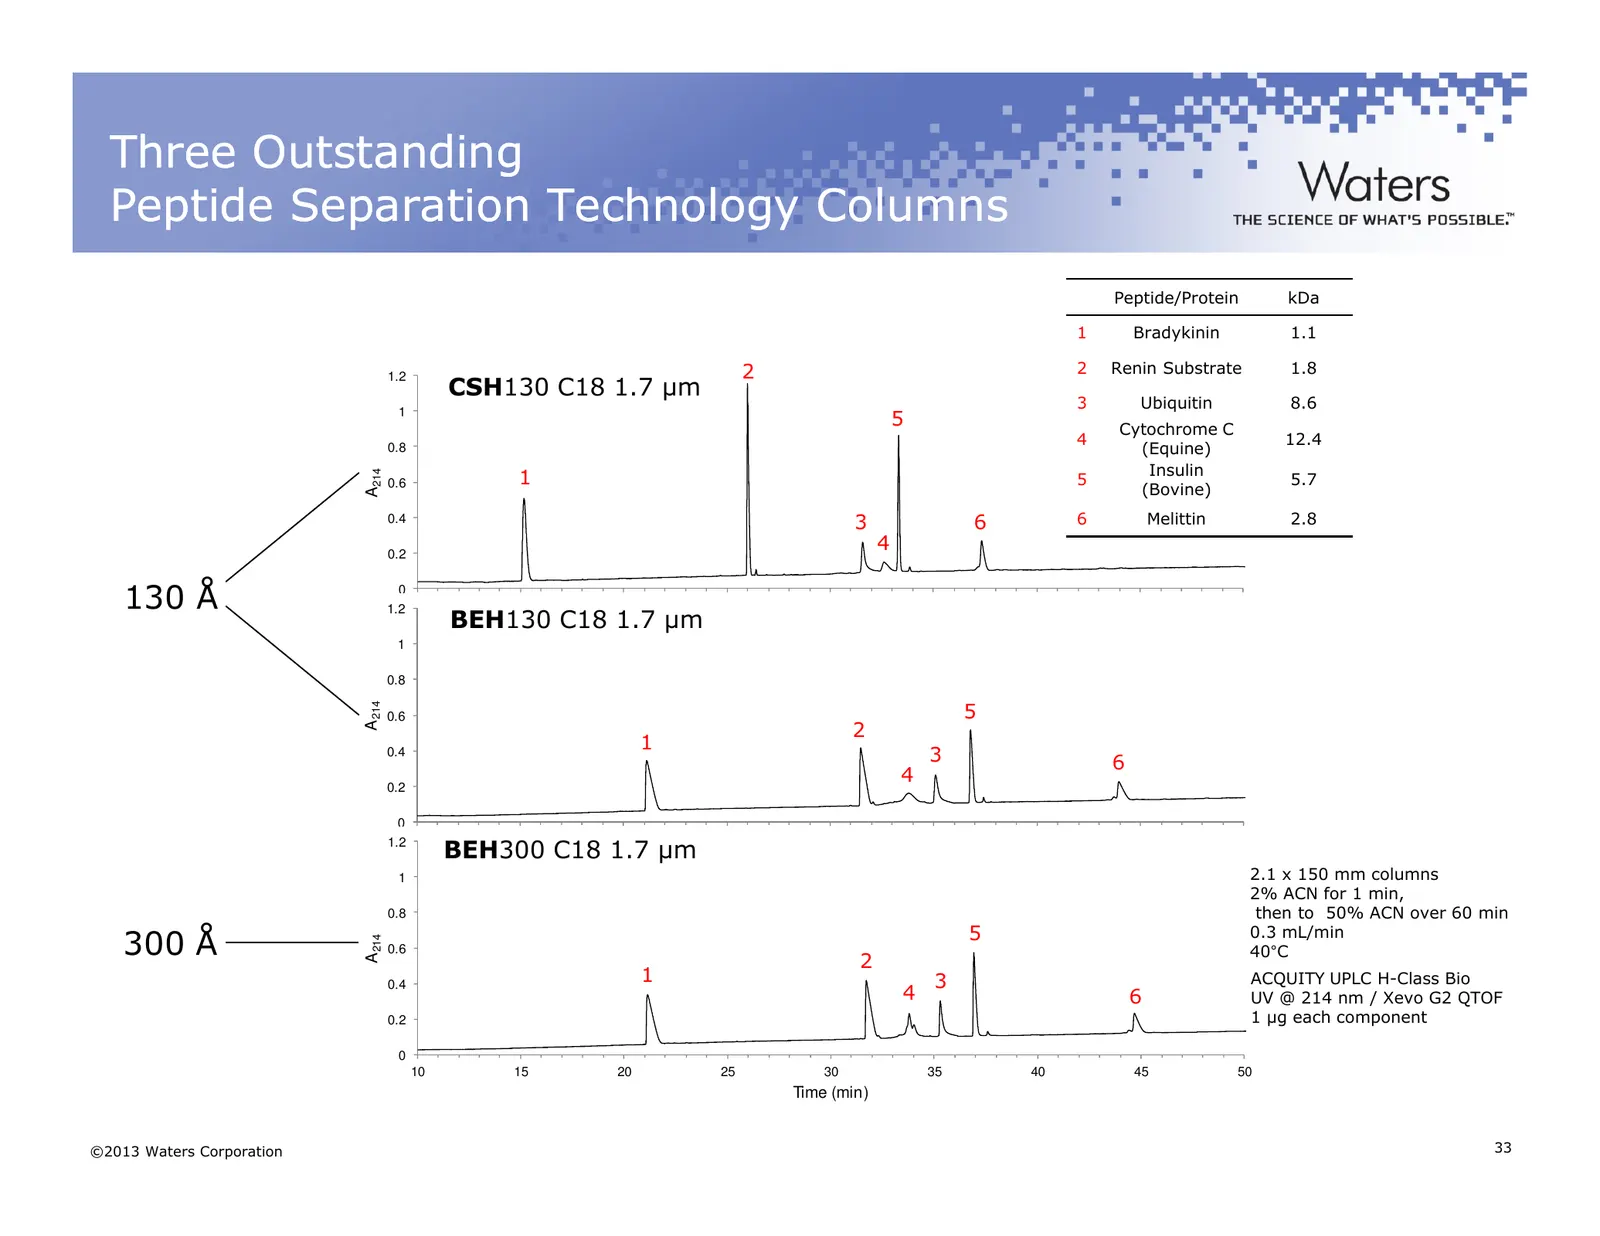
Slide 33: Three Outstanding Peptide Separation Technology Columns
Three Outstanding Peptide Separation Technology Columns Peptide/Protein kDa 1 Bradykinin 1.1 1.2 2 2 Renin Substrate 1.8 CSH130 C18 1.7 µm 3 Ubiquitin 8.6 1 5 Cytochrome C 4 12.4 0.8 (Equine) Insulin 1 A214 0.6 5 5.7 (Bovine) 0.4 3 6 6 Melittin 2.8 0.2 4 130 Å 0 1.2 10 15 20 25 30 35 40 45 50 BEH130
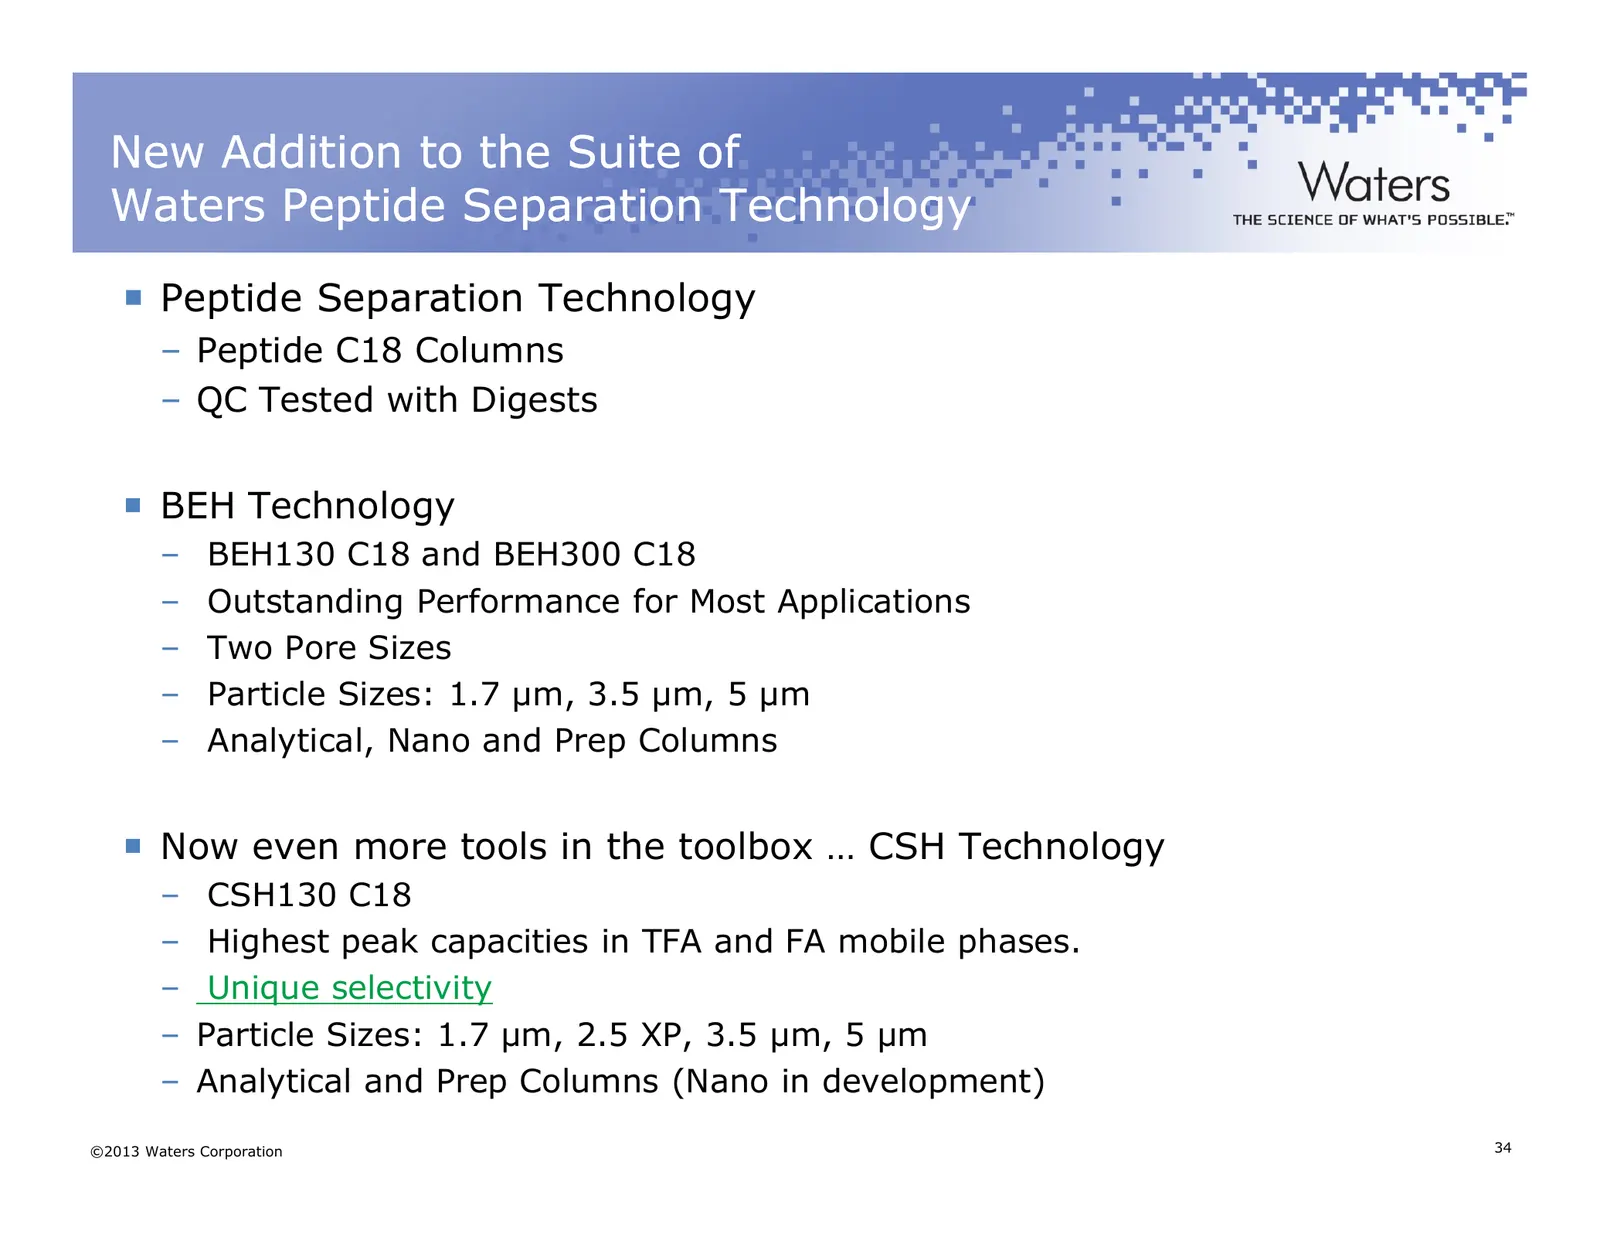
Slide 34: New Addition to the Suite of Waters Peptide Separation Technology
New Addition to the Suite of Waters Peptide Separation Technology Peptide Separation Technology – Peptide C18 Columns – QC Tested with Digests BEH Technology – BEH130 C18 and BEH300 C18 – Outstanding Performance for Most Applications – Two Pore Sizes – Particle Sizes: 1.7 µm, 3.5 µm, 5 µm – Analytic
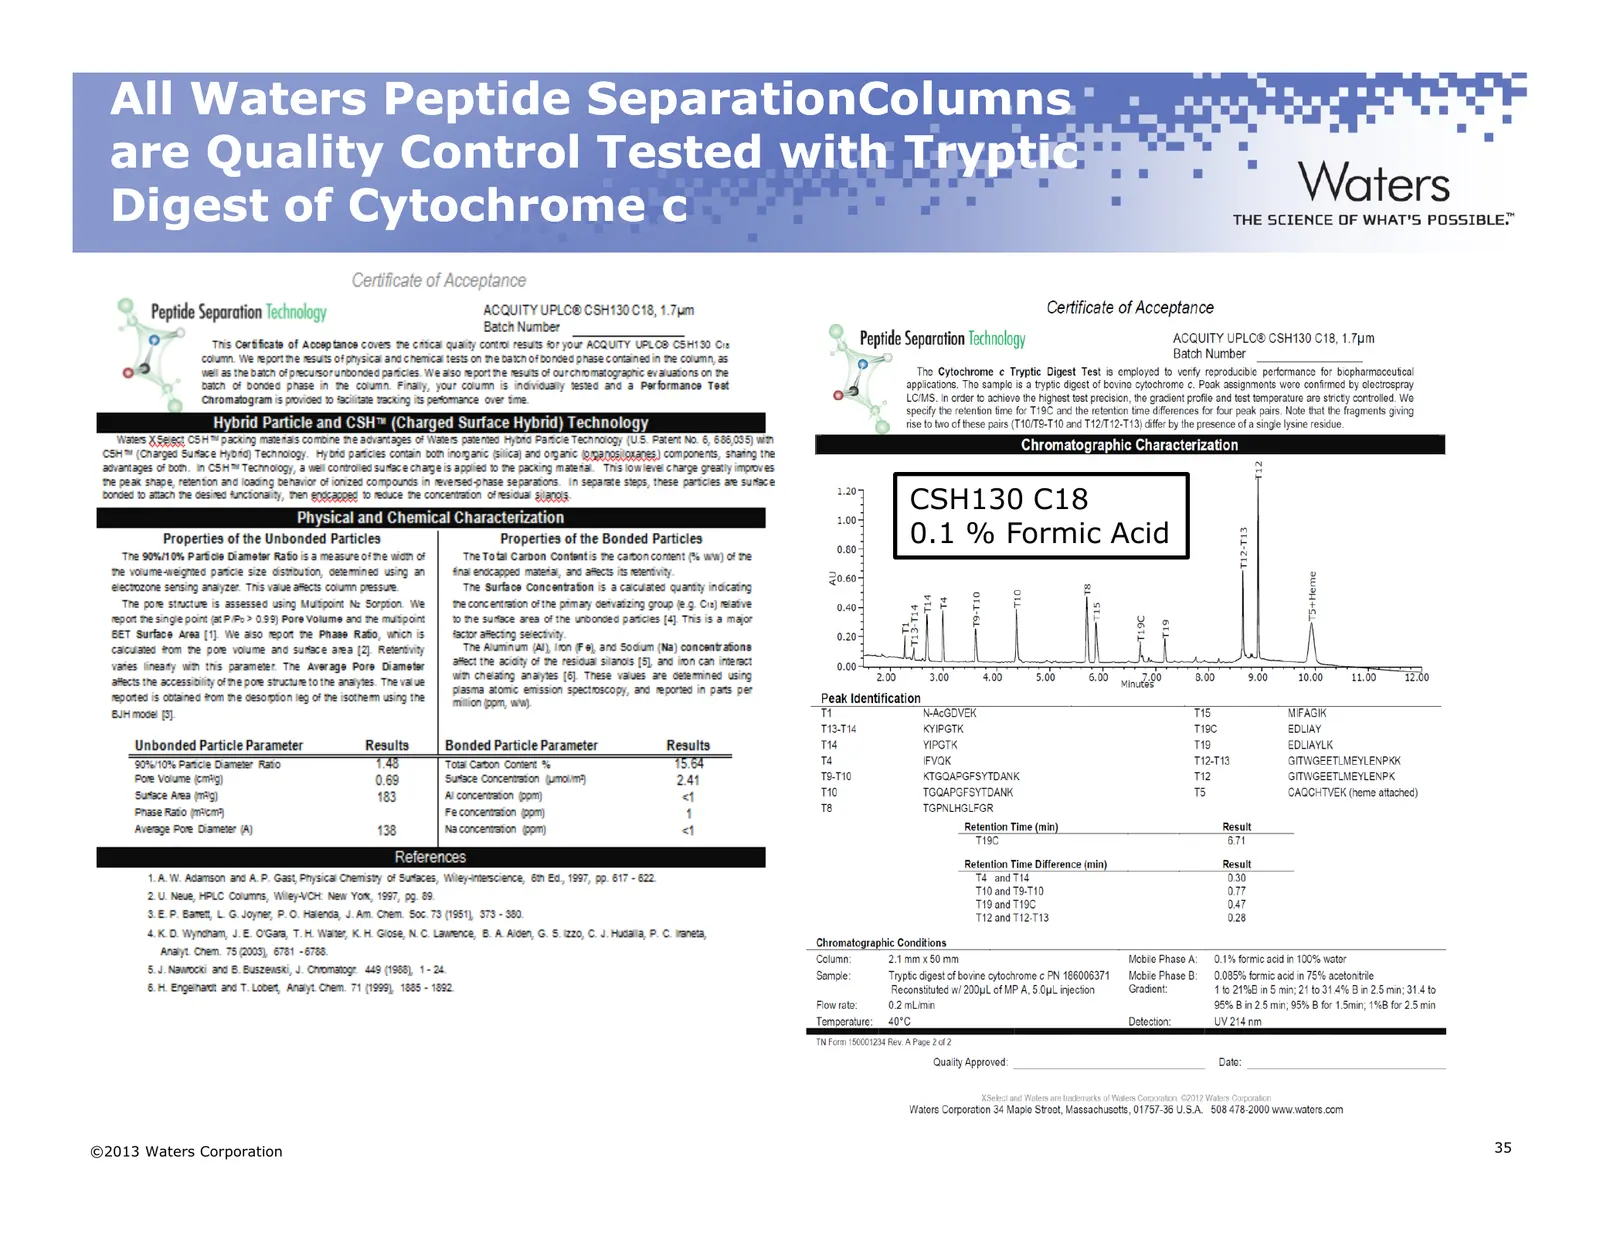
Slide 35: All Waters Peptide Separation Columns are Quality Control Tested
All Waters Peptide SeparationColumns are Quality Control Tested with Tryptic Digest of Cytochrome c CSH130 C18 0.1 % Formic Acid ©2013 Waters Corporation 35
Slide 36: Fine Tuning Your Separation
Fine Tuning Your Separation Parameters that Influence Selectivity – Ion Pairing Reagent (TFA, HFBA, etc.) and Concentration – Organic Eluent (MeCN, MeOH, IPA) – Column Temperature – Gradient Slope/Column Length Peak Tracking – Ideally using LC-MS can expedite separation optimization – Make several i
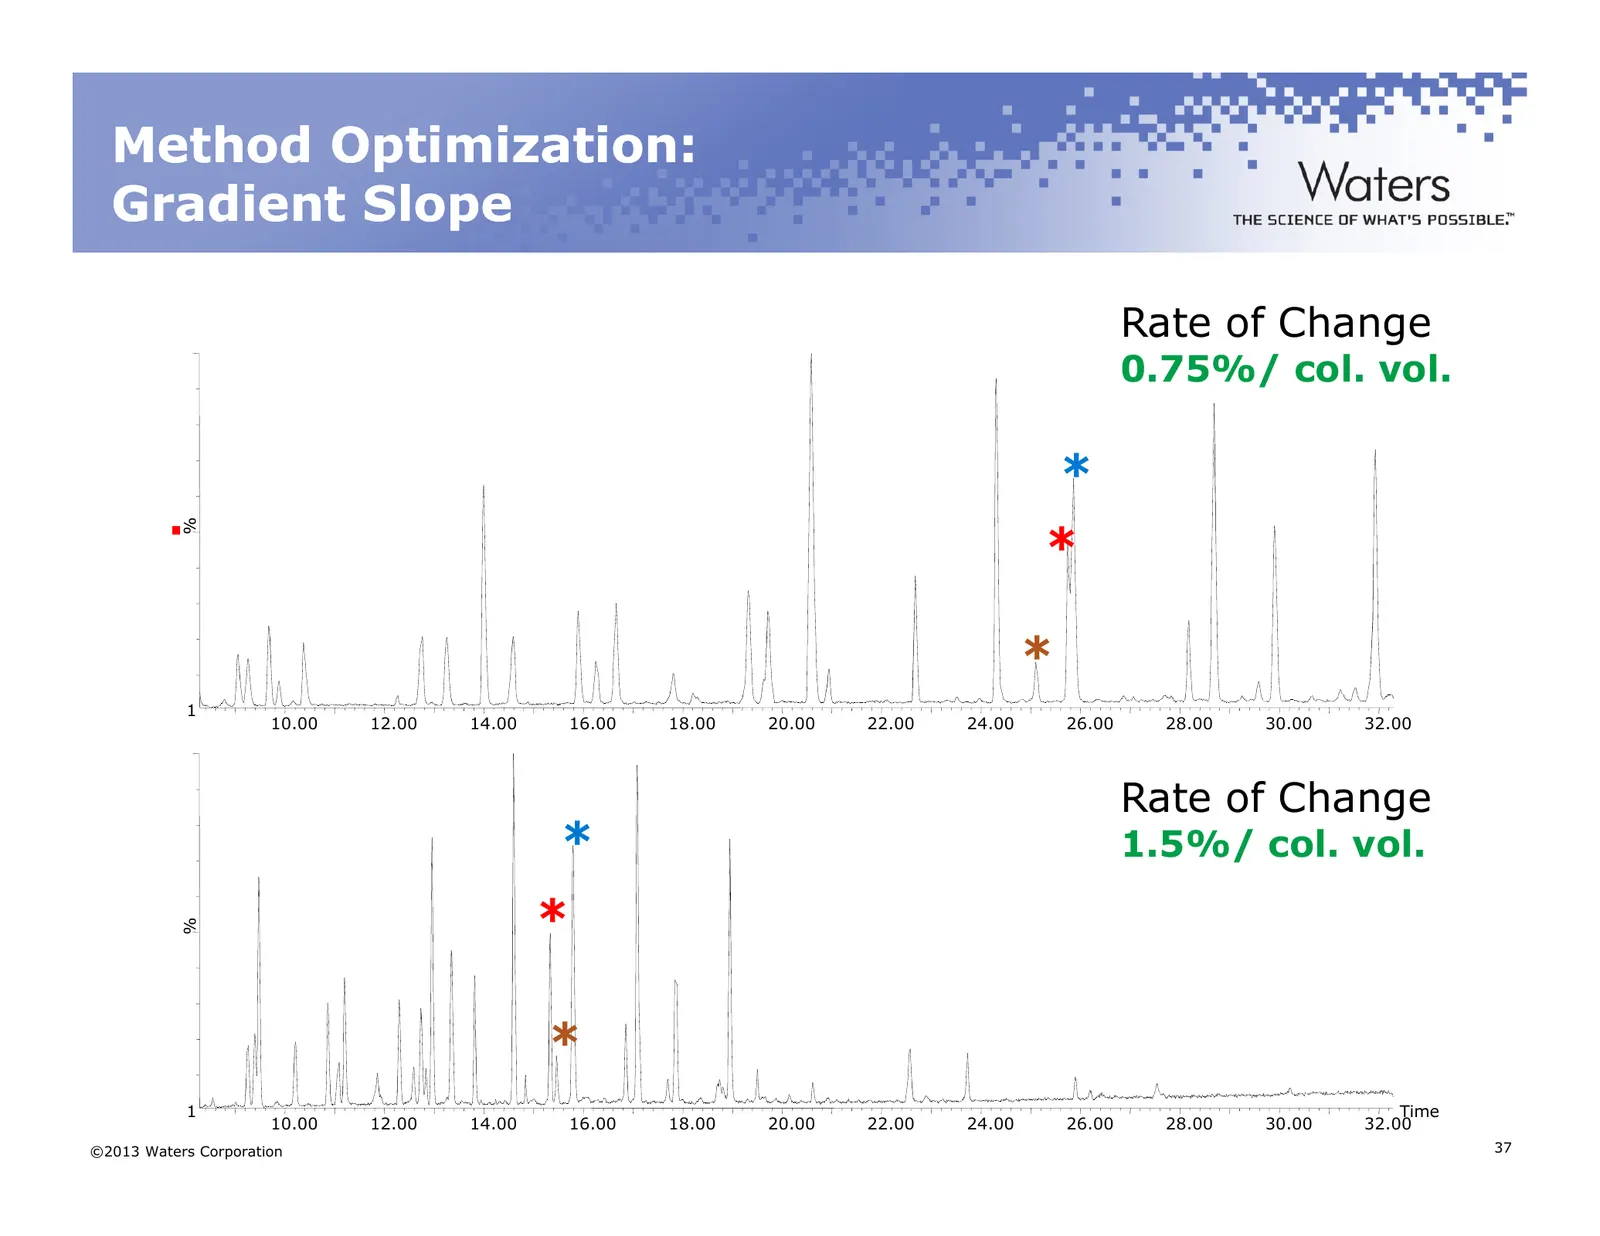
Slide 37: Method Optimization: Gradient Slope
Method Optimization: Gradient Slope Rate of Change 0.75%/ col. vol. * % * * 1 10.00 12.00 14.00 16.00 18.00 20.00 22.00 24.00 26.00 28.00 30.00 32.00 Rate of Change * 1.5%/ col. vol. * % * 1 Time 10.00 12.00 14.00 16.00 18.00 20.00 22.00 24.00 26.00 28.00 30.00 32.00 ©2013 Waters Corporation 37
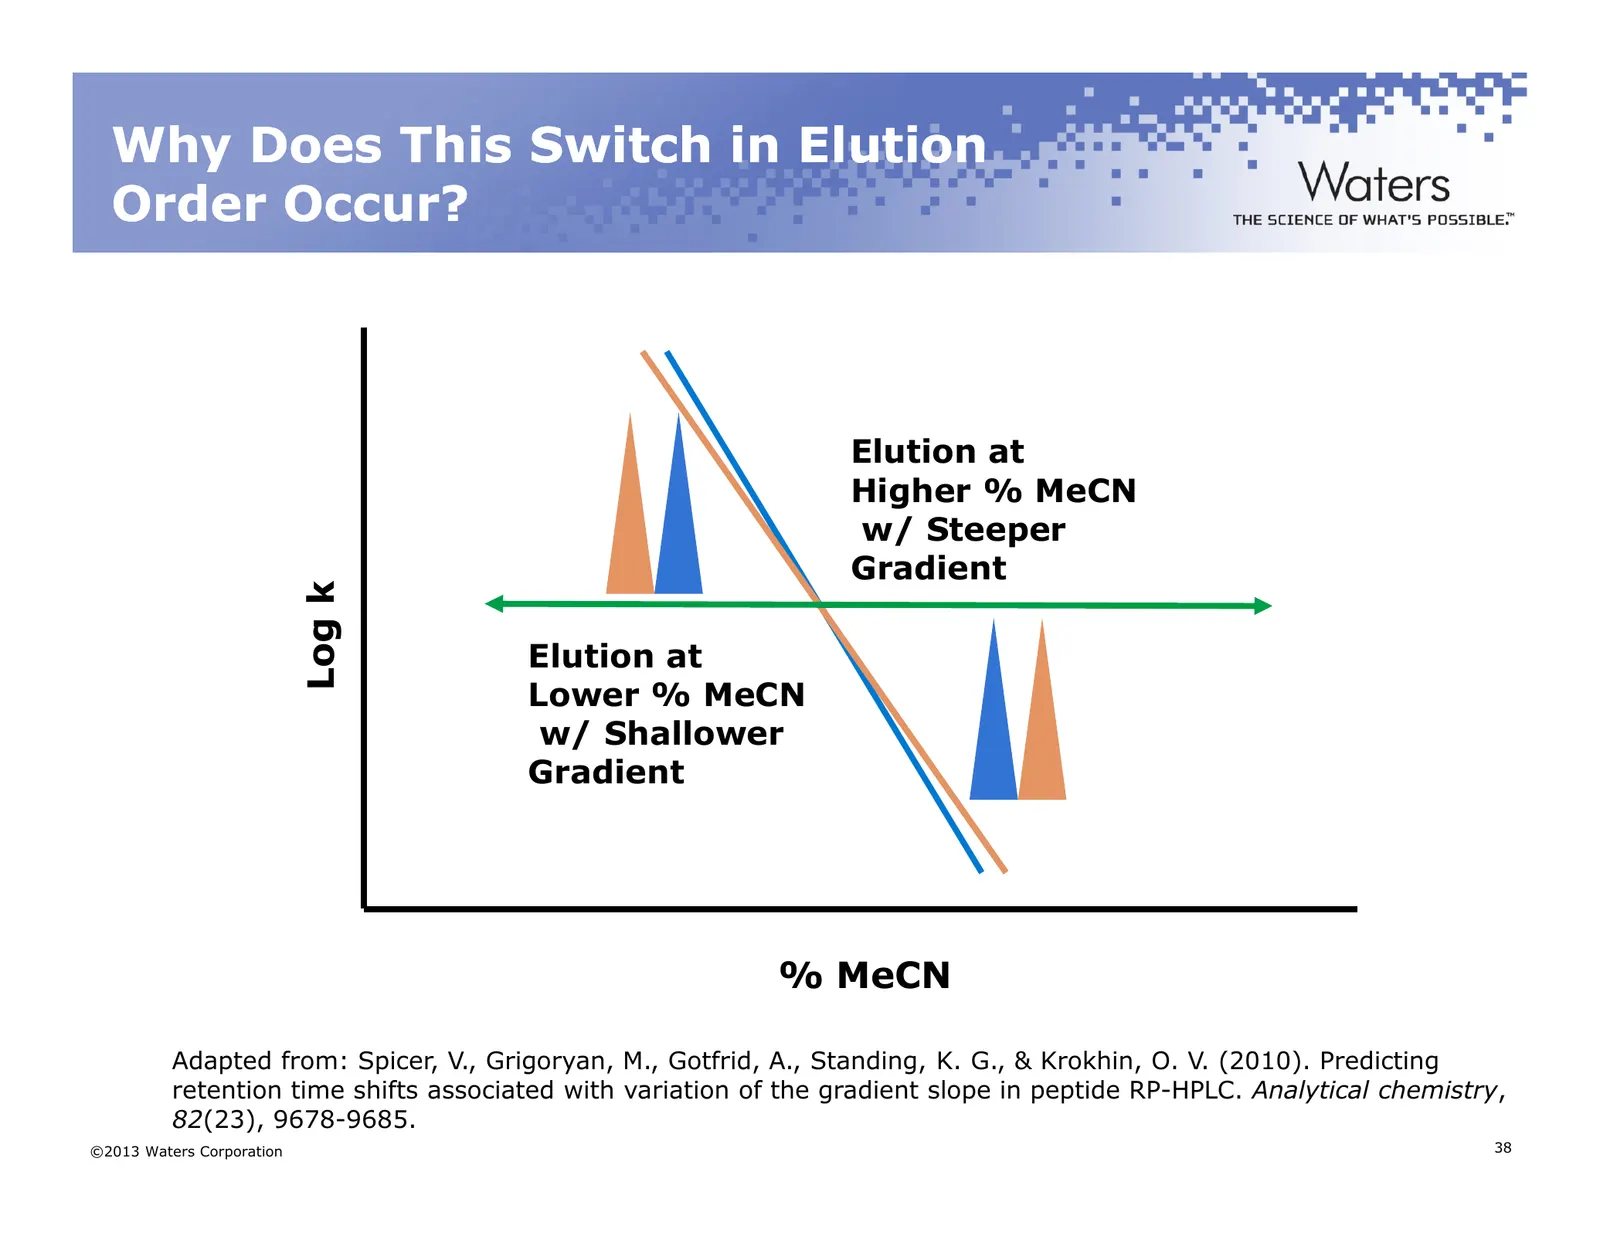
Slide 38: Why Does This Switch in Elution Order Occur?
Why Does This Switch in Elution Order Occur? Elution at Higher % MeCN w/ Steeper Gradient Log k Elution at Lower % MeCN w/ Shallower Gradient % MeCN Adapted from: Spicer, V., Grigoryan, M., Gotfrid, A., Standing, K. G., & Krokhin, O. V. (2010). Predicting retention time shifts associated with variat
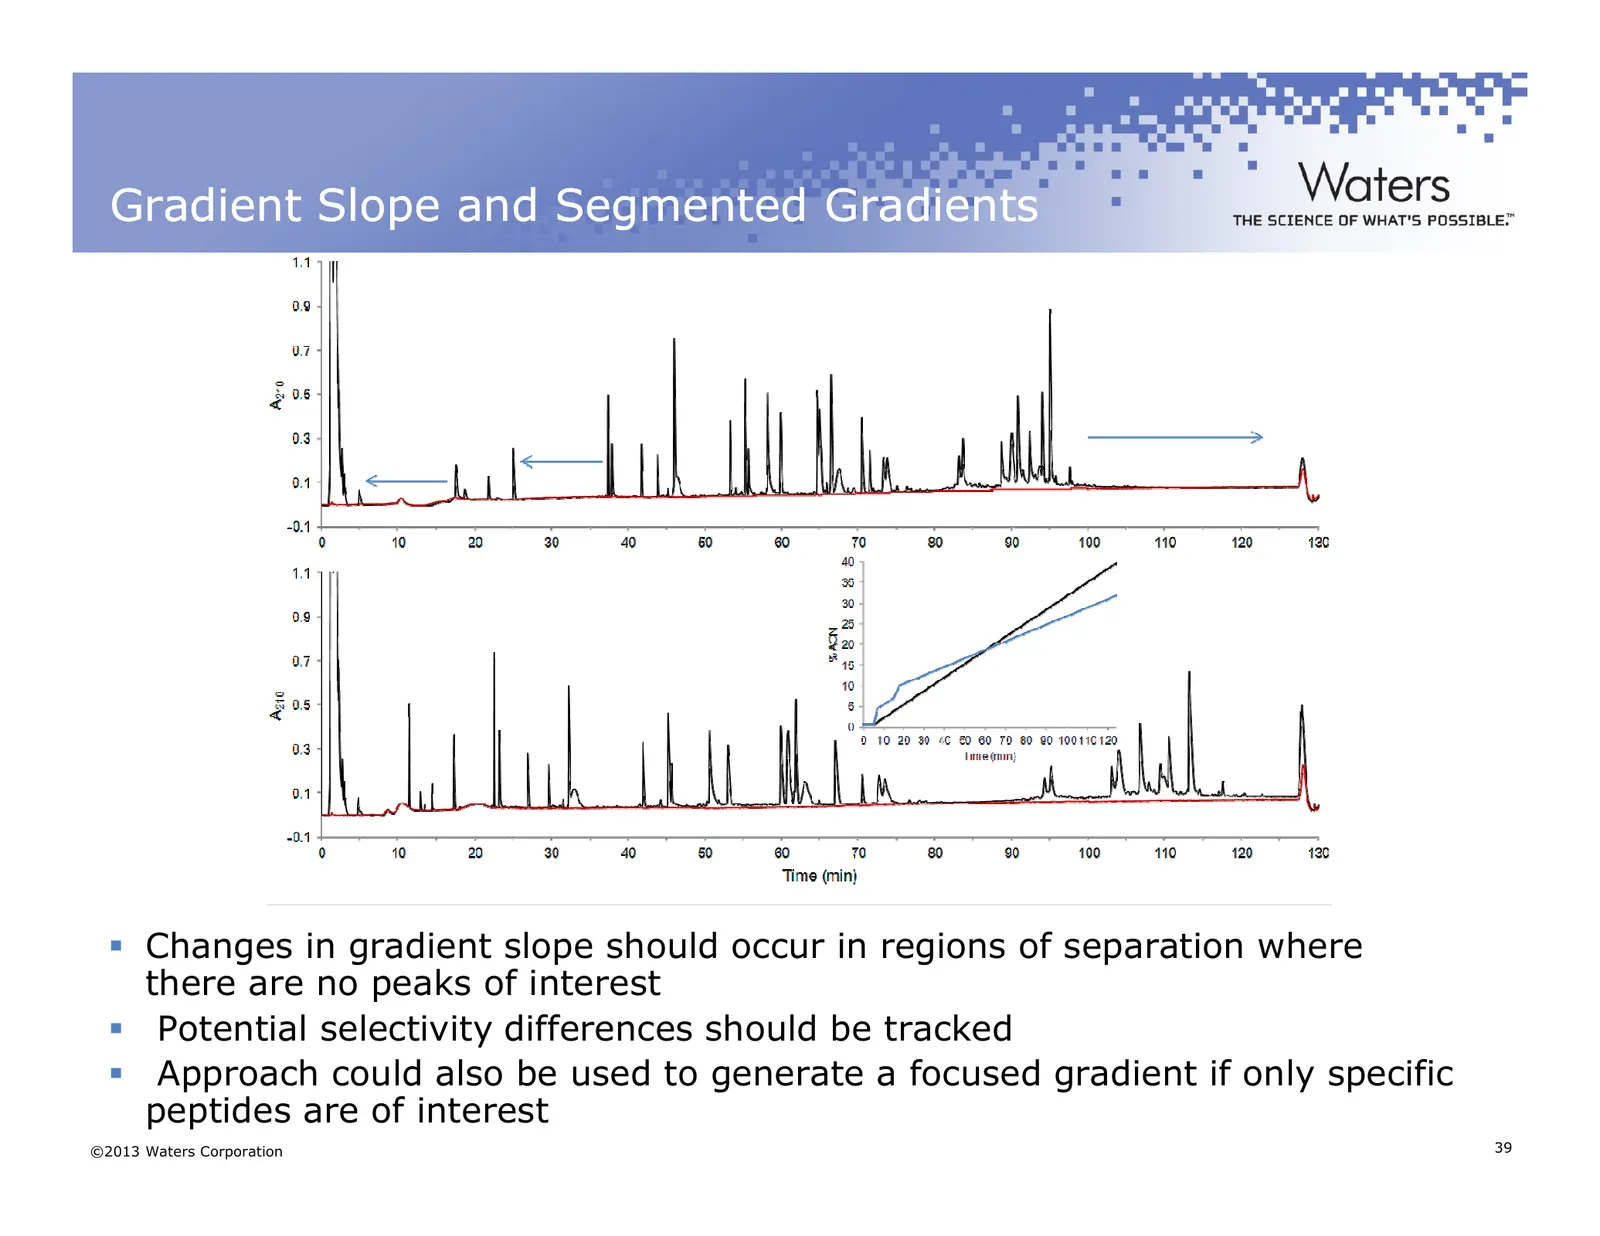
Slide 39: Gradient Slope and Segmented Gradients
Gradient Slope and Segmented Gradients Changes in gradient slope should occur in regions of separation where there are no peaks of interest Potential selectivity differences should be tracked Approach could also be used to generate a focused gradient if only specific peptides are of interest ©2013 W
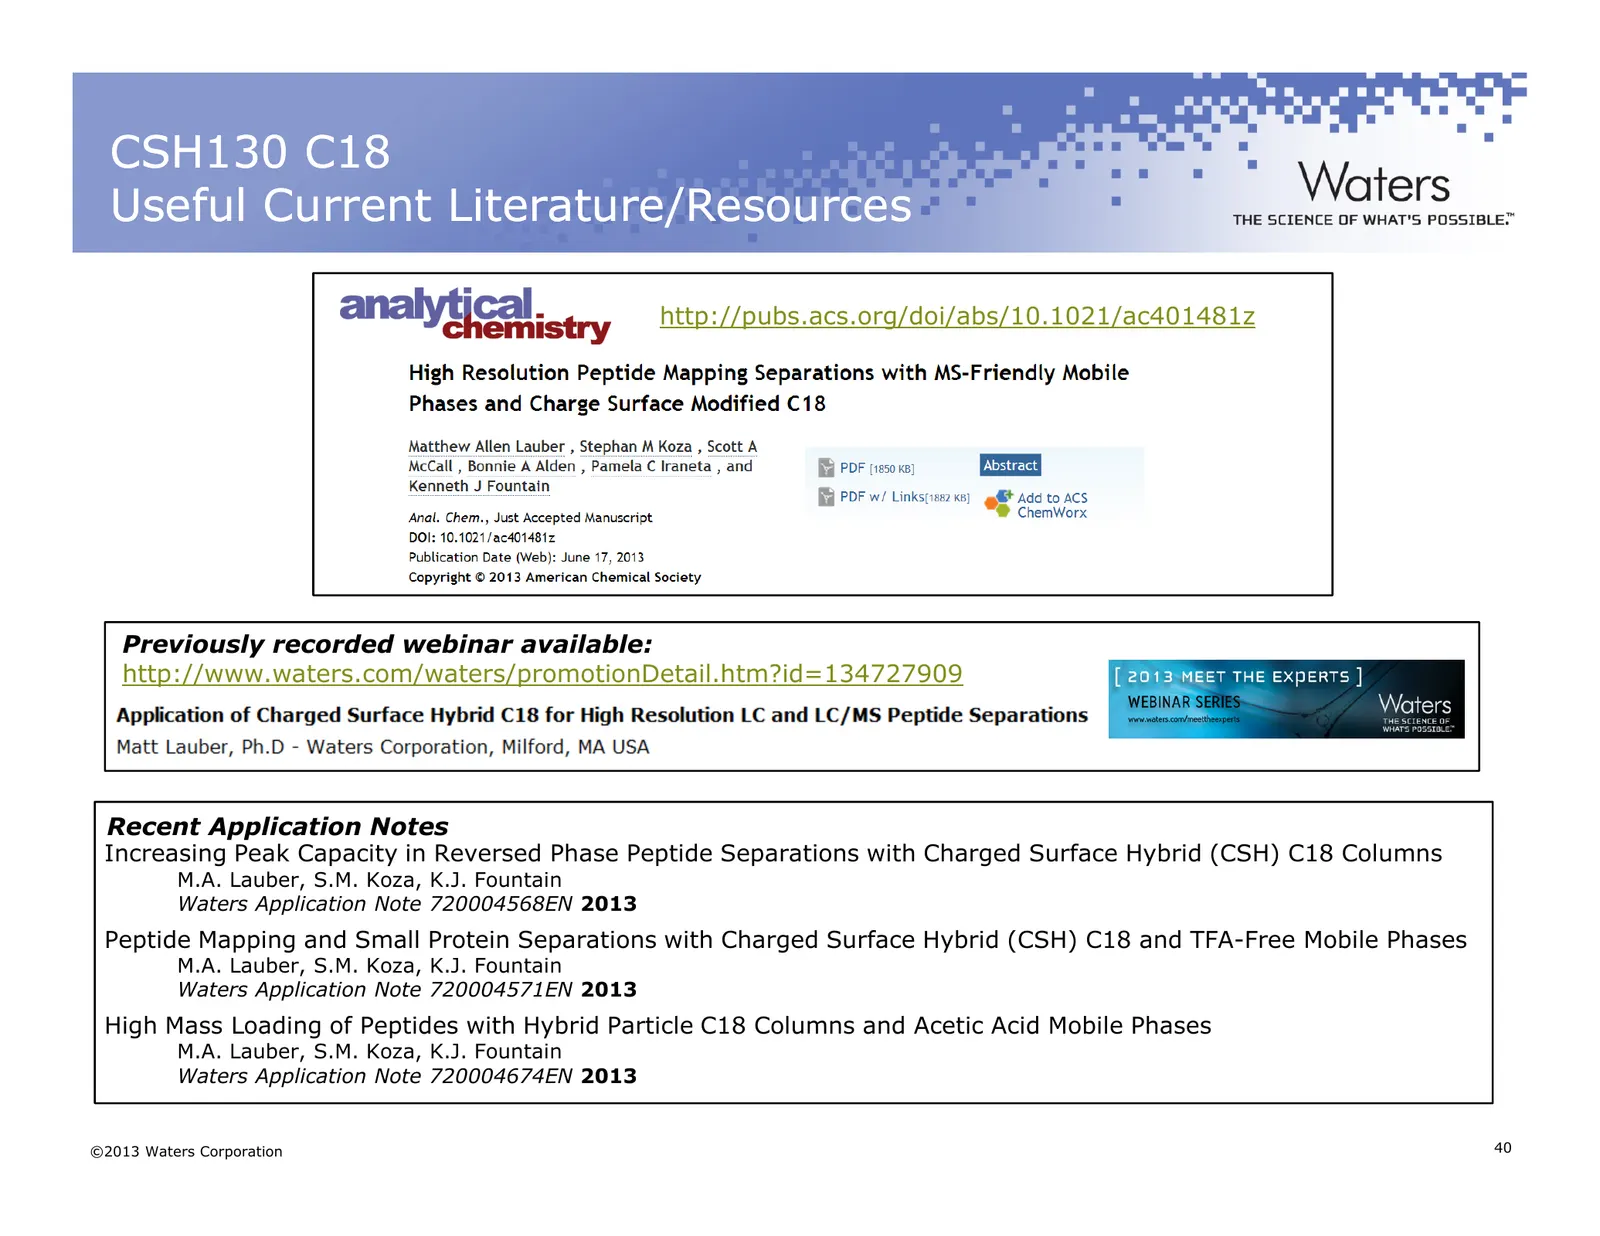
Slide 40: CSH130 C18 Useful Current Literature/Resources
CSH130 C18 Useful Current Literature/Resources http://pubs.acs.org/doi/abs/10.1021/ac401481z Previously recorded webinar available: http://www.waters.com/waters/promotionDetail.htm?id=134727909 Recent Application Notes Increasing Peak Capacity in Reversed Phase Peptide Separations with Charged Surfa
Slide 41: End of Part 1
End of Part 1 ©2013 Waters Corporation 41
Slide 42: Part 2 - Gaining Efficiency: Instrumentation and Informatics Platforms
Part 2 - Gaining Efficiency: Instrumentation and Informatics Platforms for Peptide Mapping Asish Chakraborty, Ph.D Asish_Chakraborty@waters.com ©2013 Waters Corporation 42
Slide 43: A History of Relieving the Pressure on Analysts
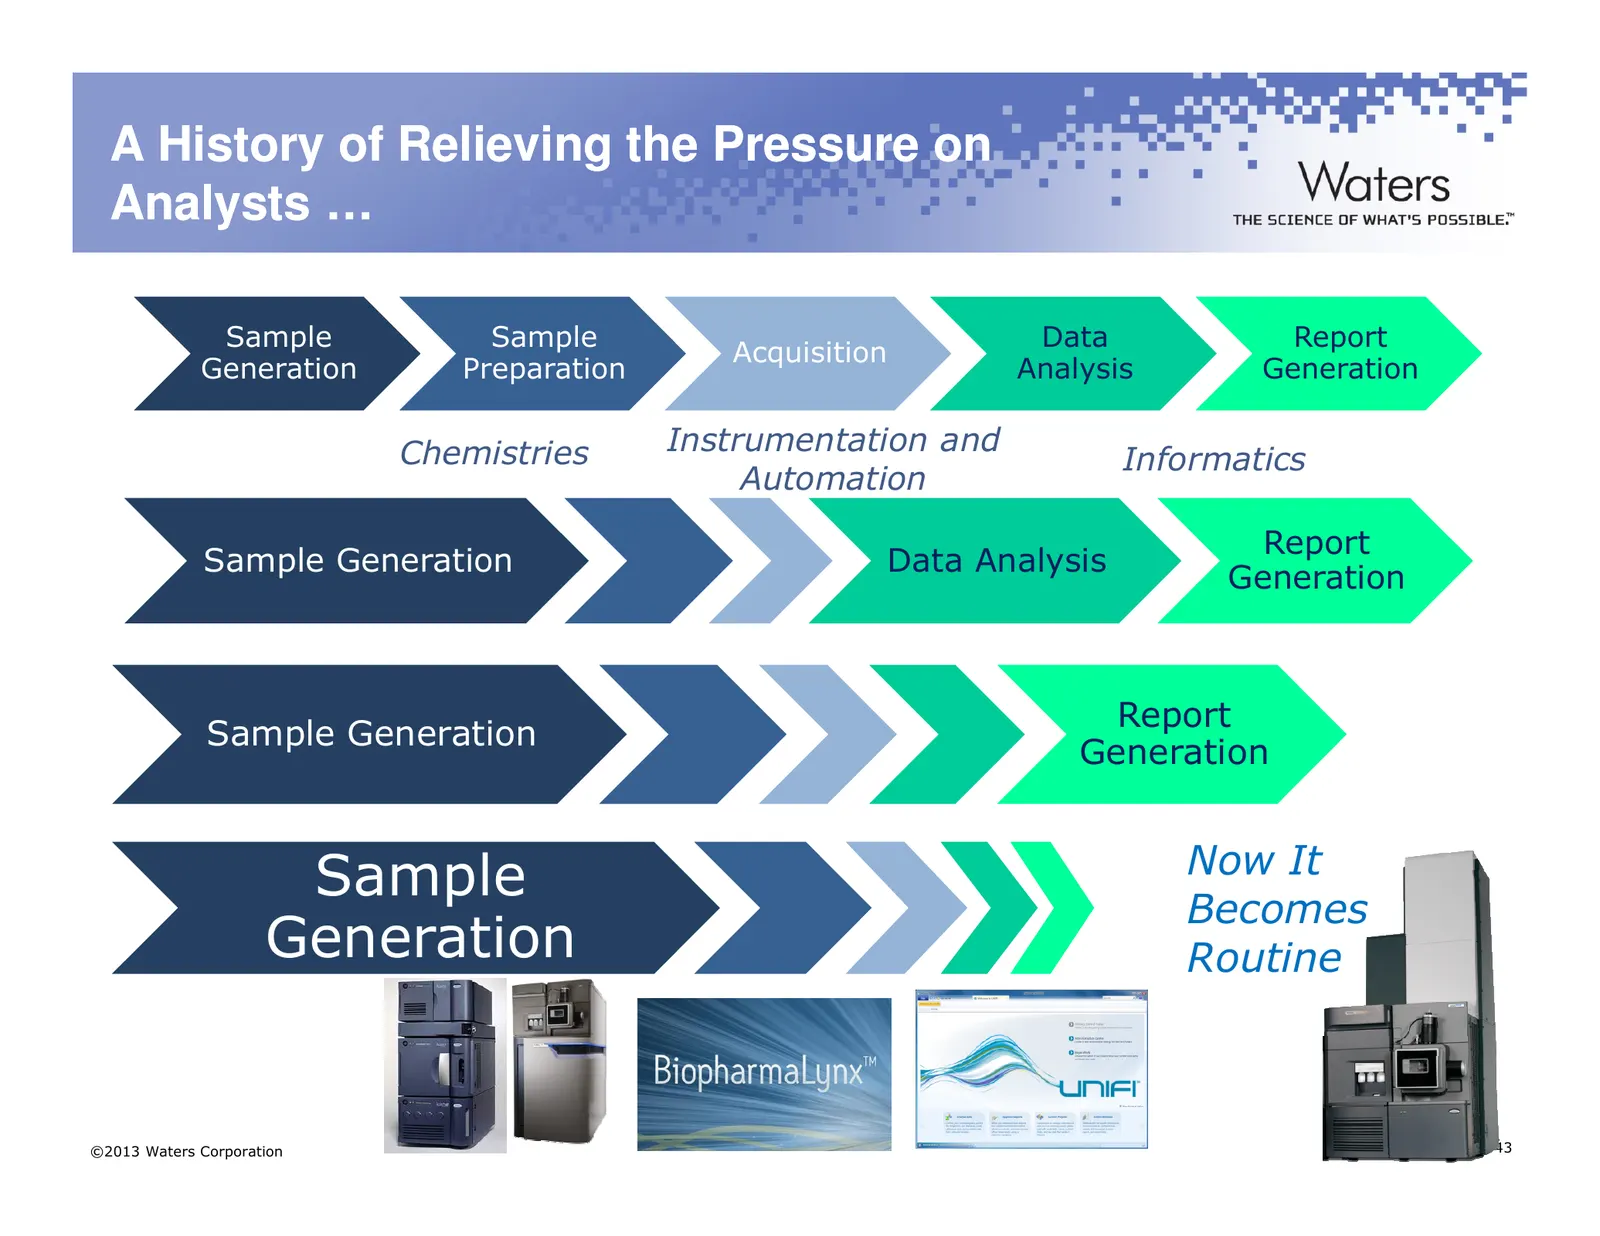
A History of Relieving the Pressure on Analysts … Sample Sample Data Report Acquisition Generation Preparation Analysis Generation Chemistries Instrumentation and Informatics Automation Report Sample Generation Data Analysis Generation Report Sample Generation Generation Sample Now It Becomes Genera
Slide 44: Performance and Usability through Engineered Simplicity
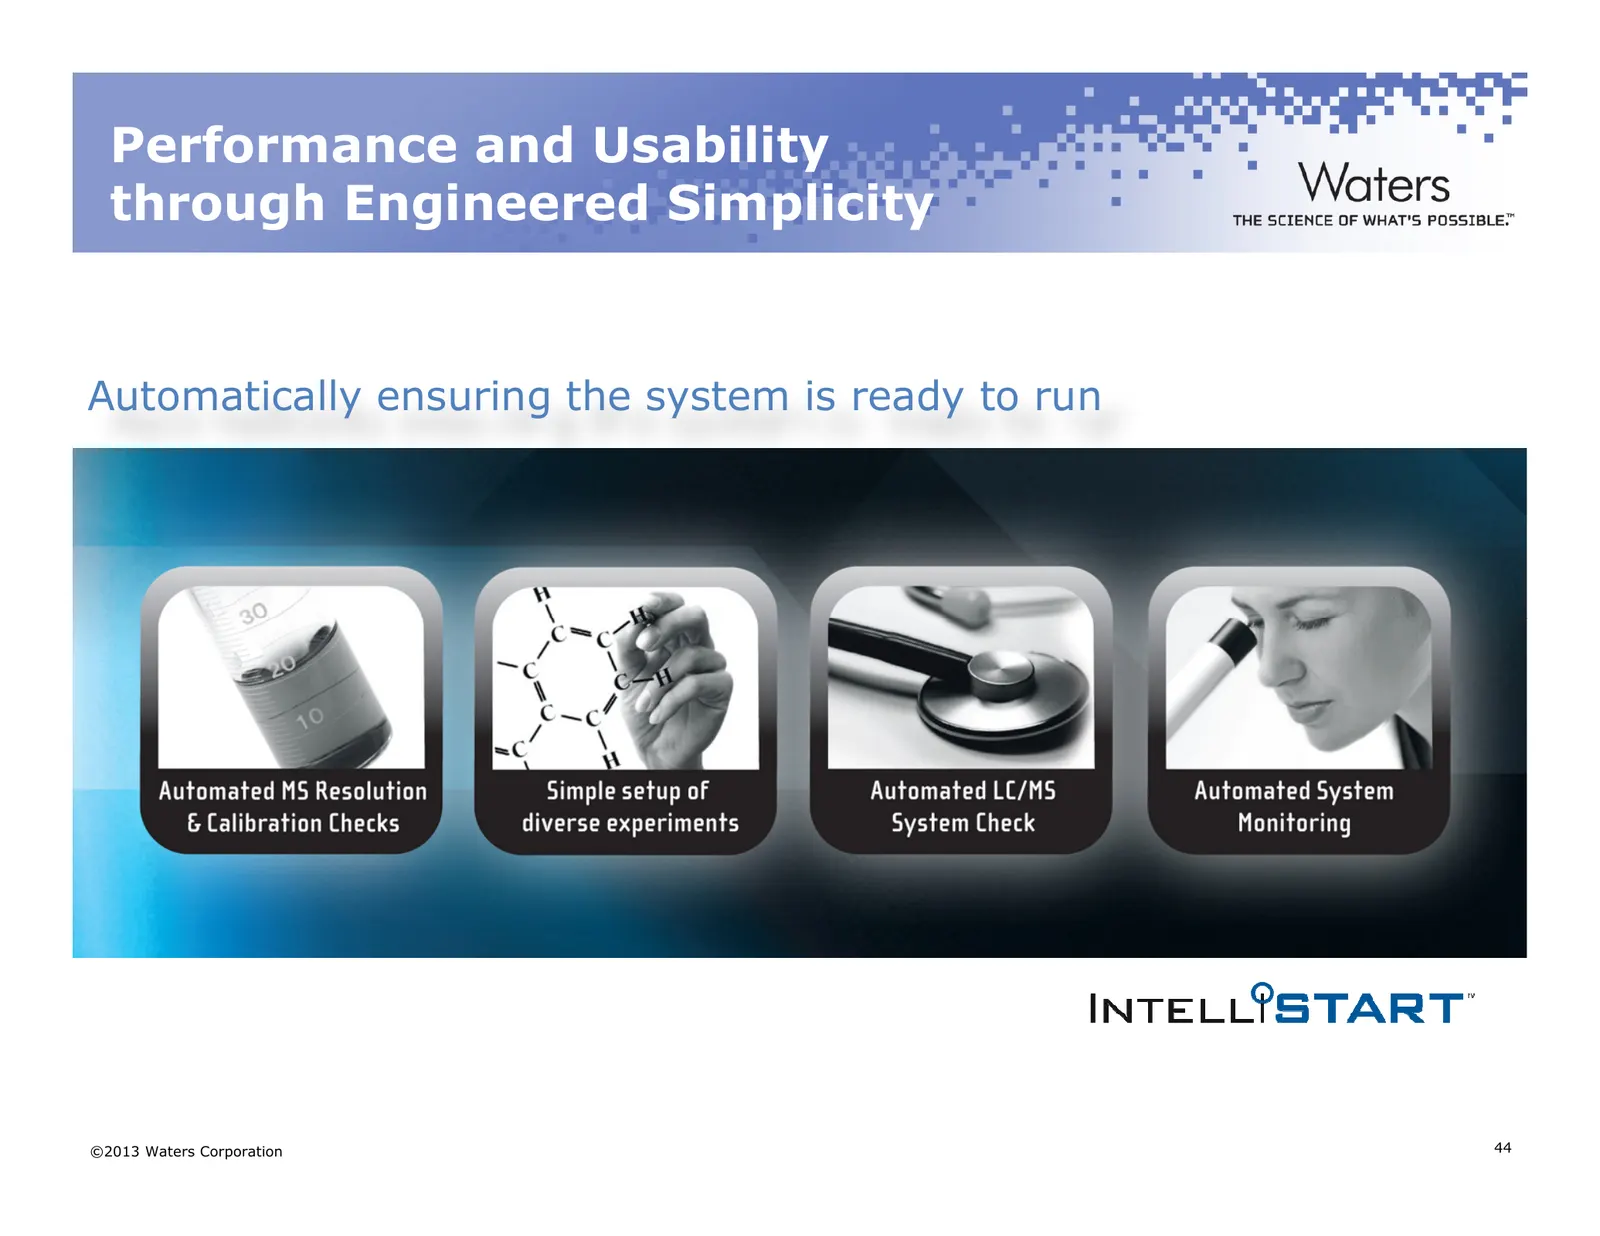
Performance and Usability through Engineered Simplicity Automatically ensuring the system is ready to run ©2013 Waters Corporation 44
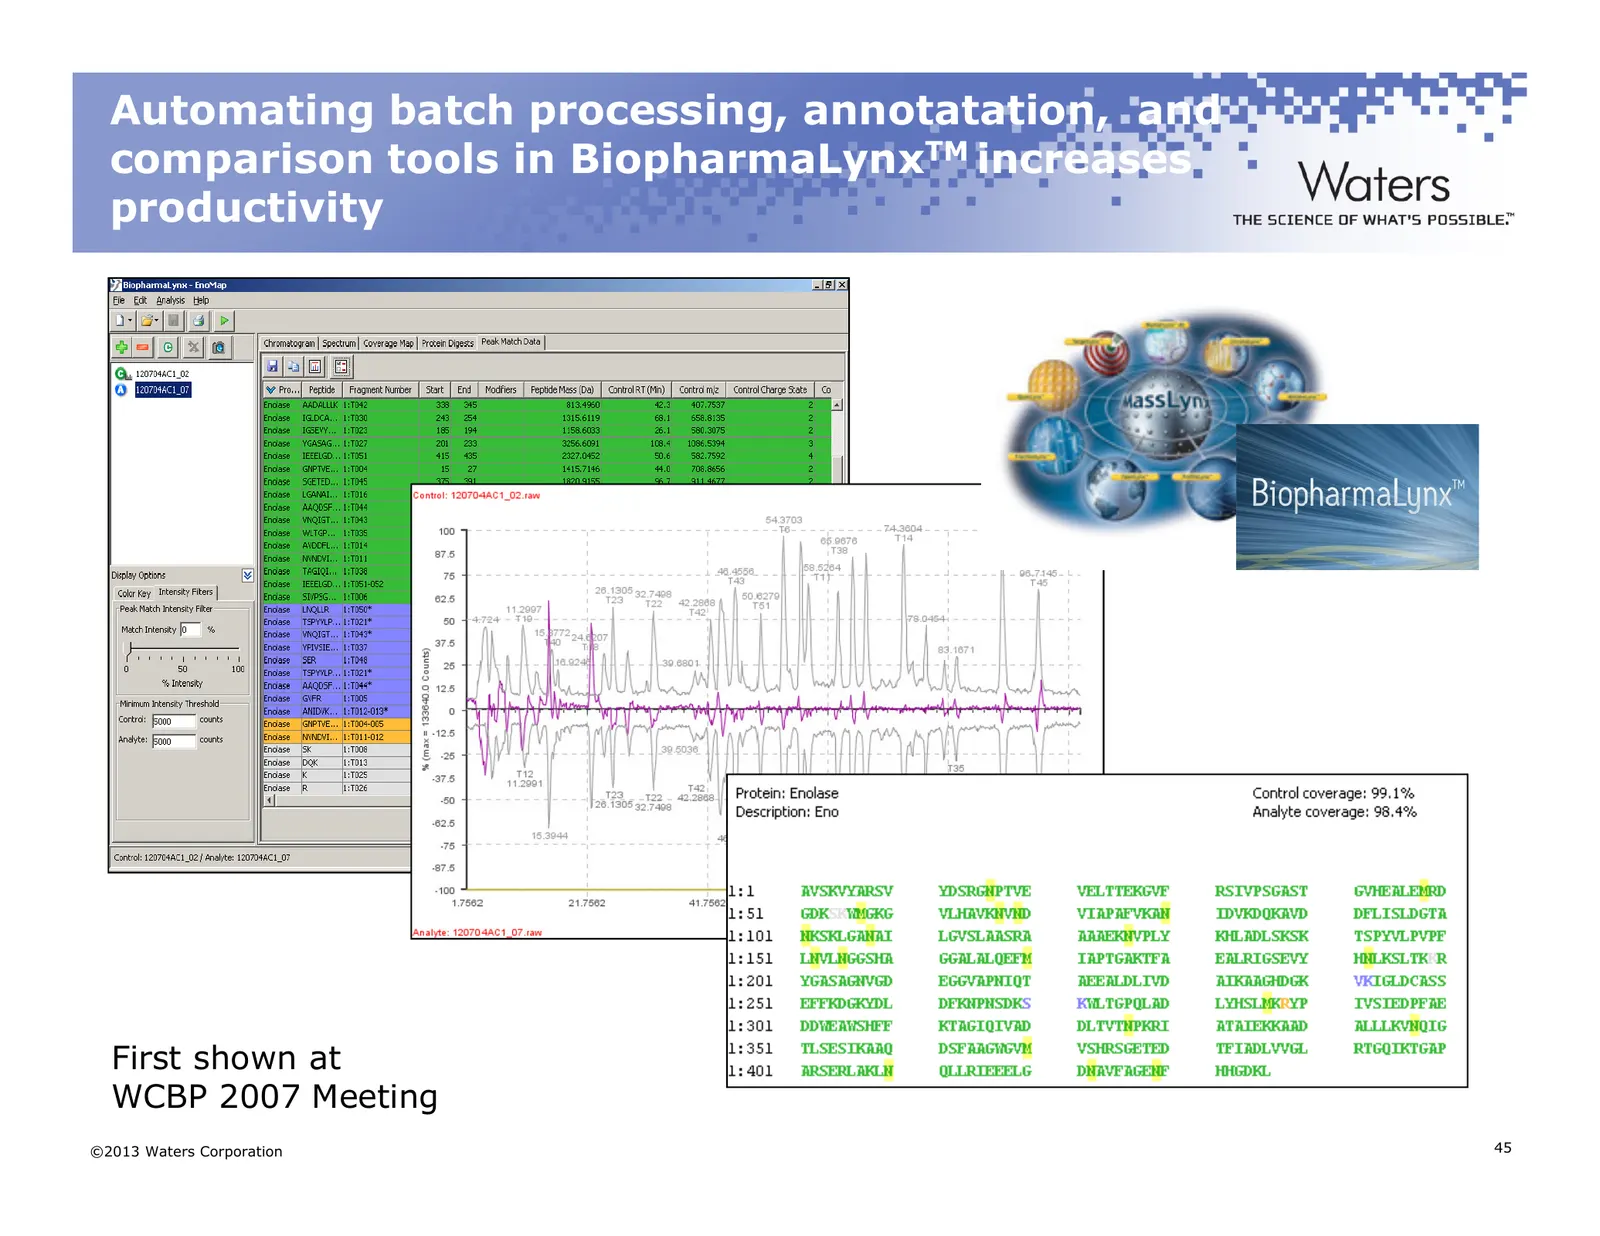
Slide 45: Automating batch processing, annotation, and comparison tools in BiopharmaLynx
Automating batch processing, annotatation, and comparison tools in BiopharmaLynxTM increases productivity First shown at WCBP 2007 Meeting ©2013 Waters Corporation 45
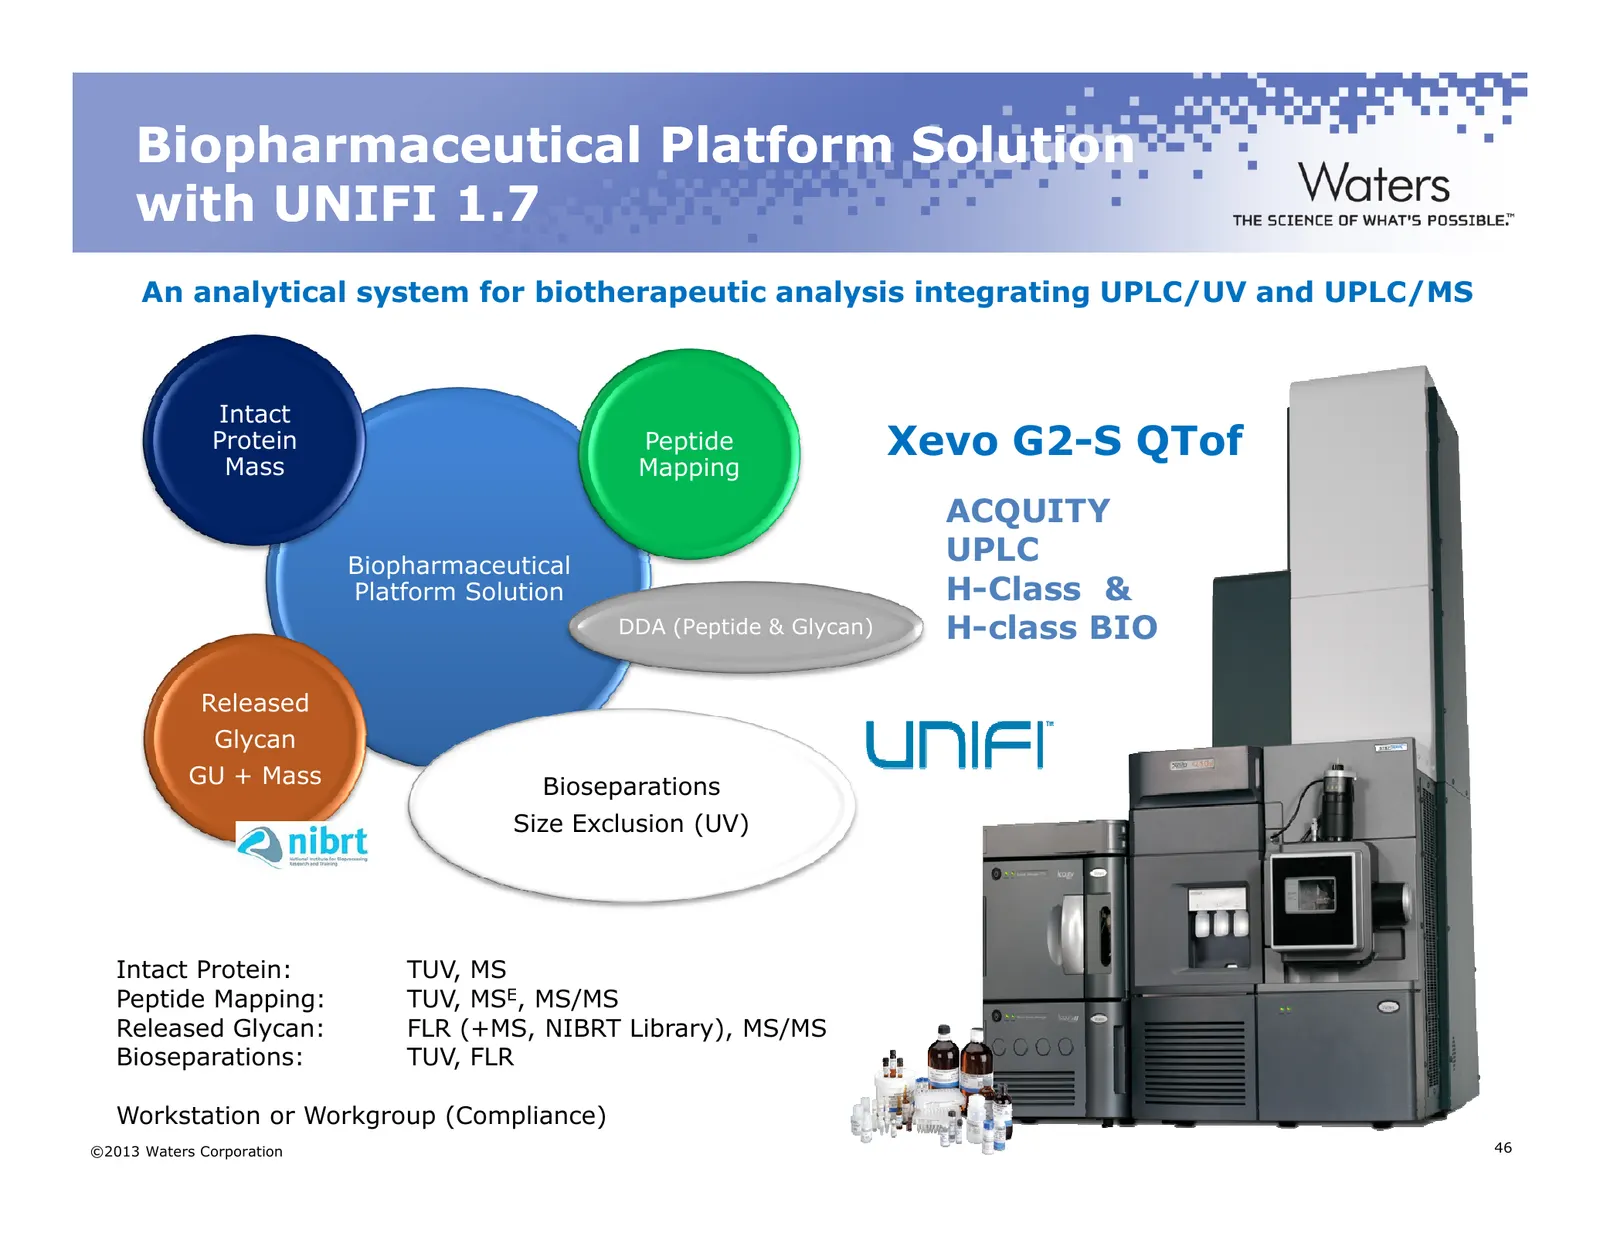
Slide 46: Biopharmaceutical Platform Solution with UNIFI 1.7
Biopharmaceutical Platform Solution with UNIFI 1.7 An analytical system for biotherapeutic analysis integrating UPLC/UV and UPLC/MS Intact Protein Mass Peptide Xevo G2-S QTof Mapping ACQUITY Biopharmaceutical UPLC Platform Solution H-Class & DDA (Peptide & Glycan) H-class BIO Released Glycan GU + Ma
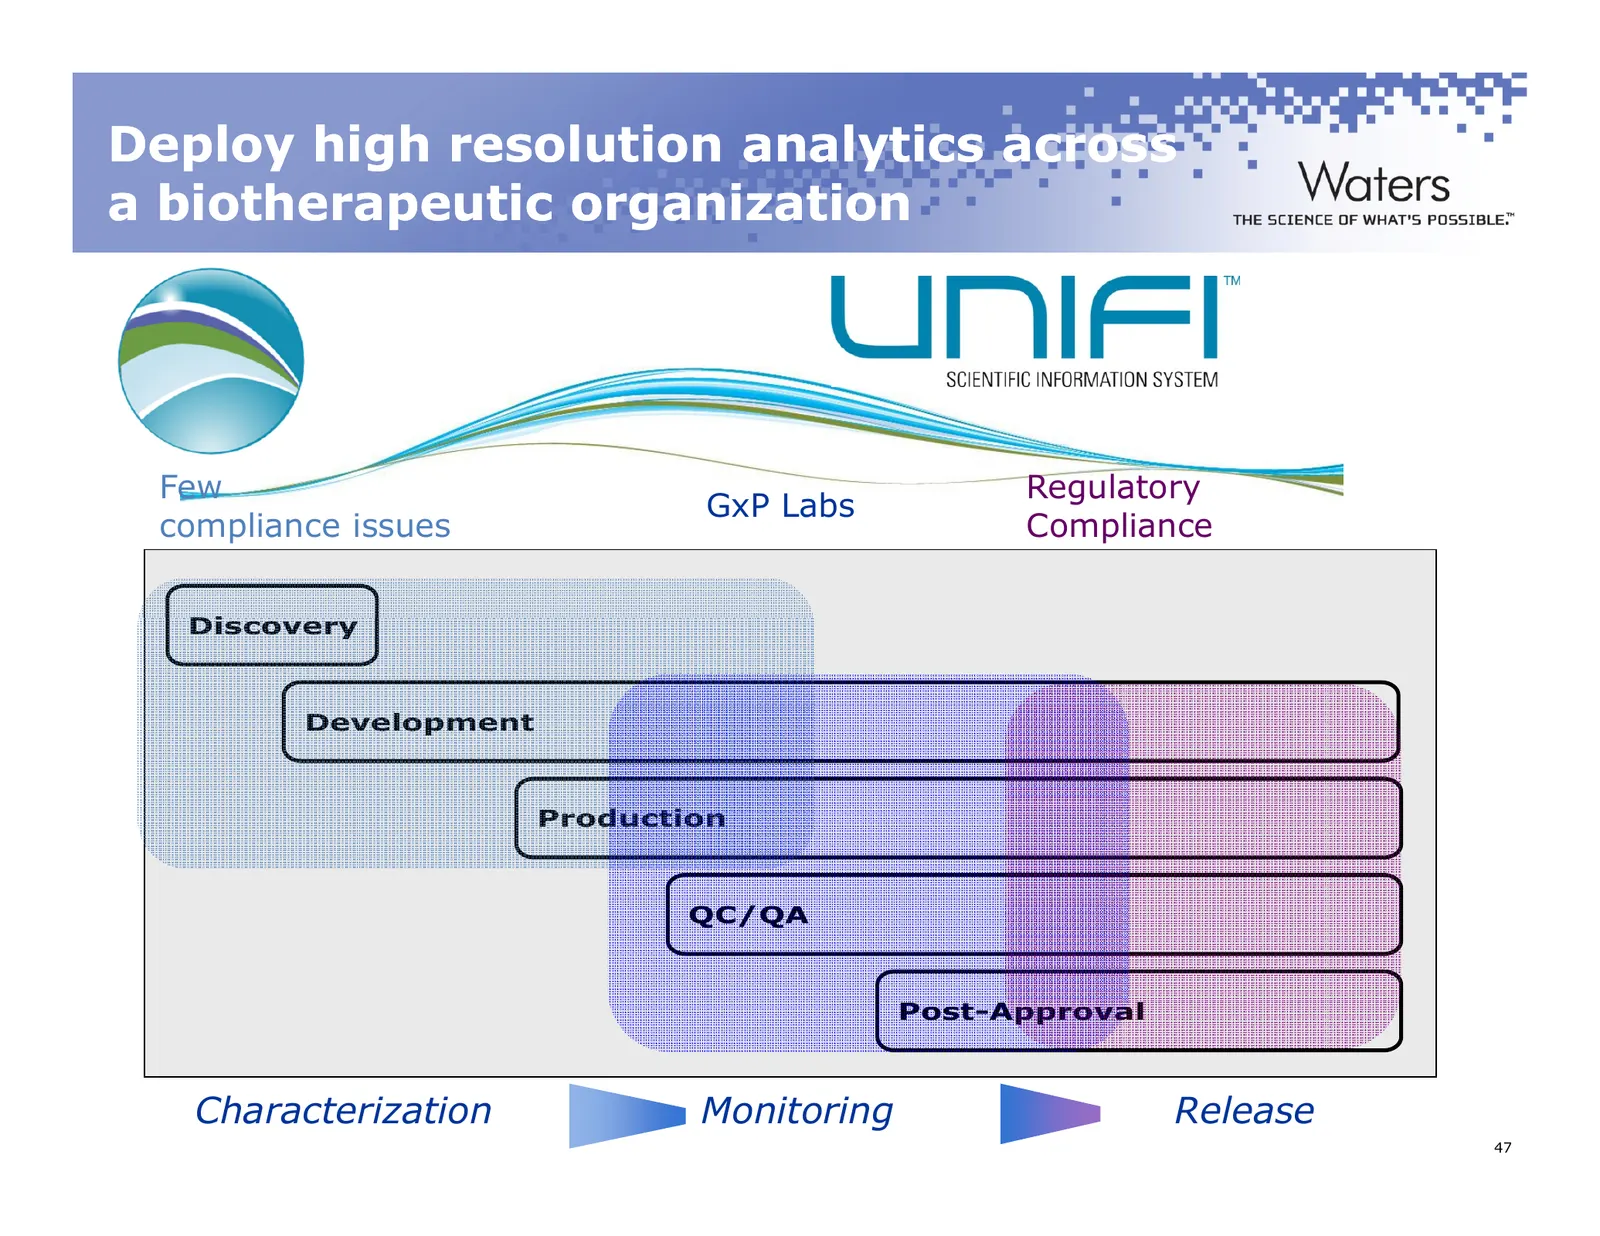
Slide 47: Deploy high resolution analytics across a biotherapeutic organization
Deploy high resolution analytics across a biotherapeutic organization Few Regulatory GxP Labs compliance issues Compliance Discovery Development Production QC/QA Post-Approval Characterization Monitoring Release ©2011 Waters Corporation 47
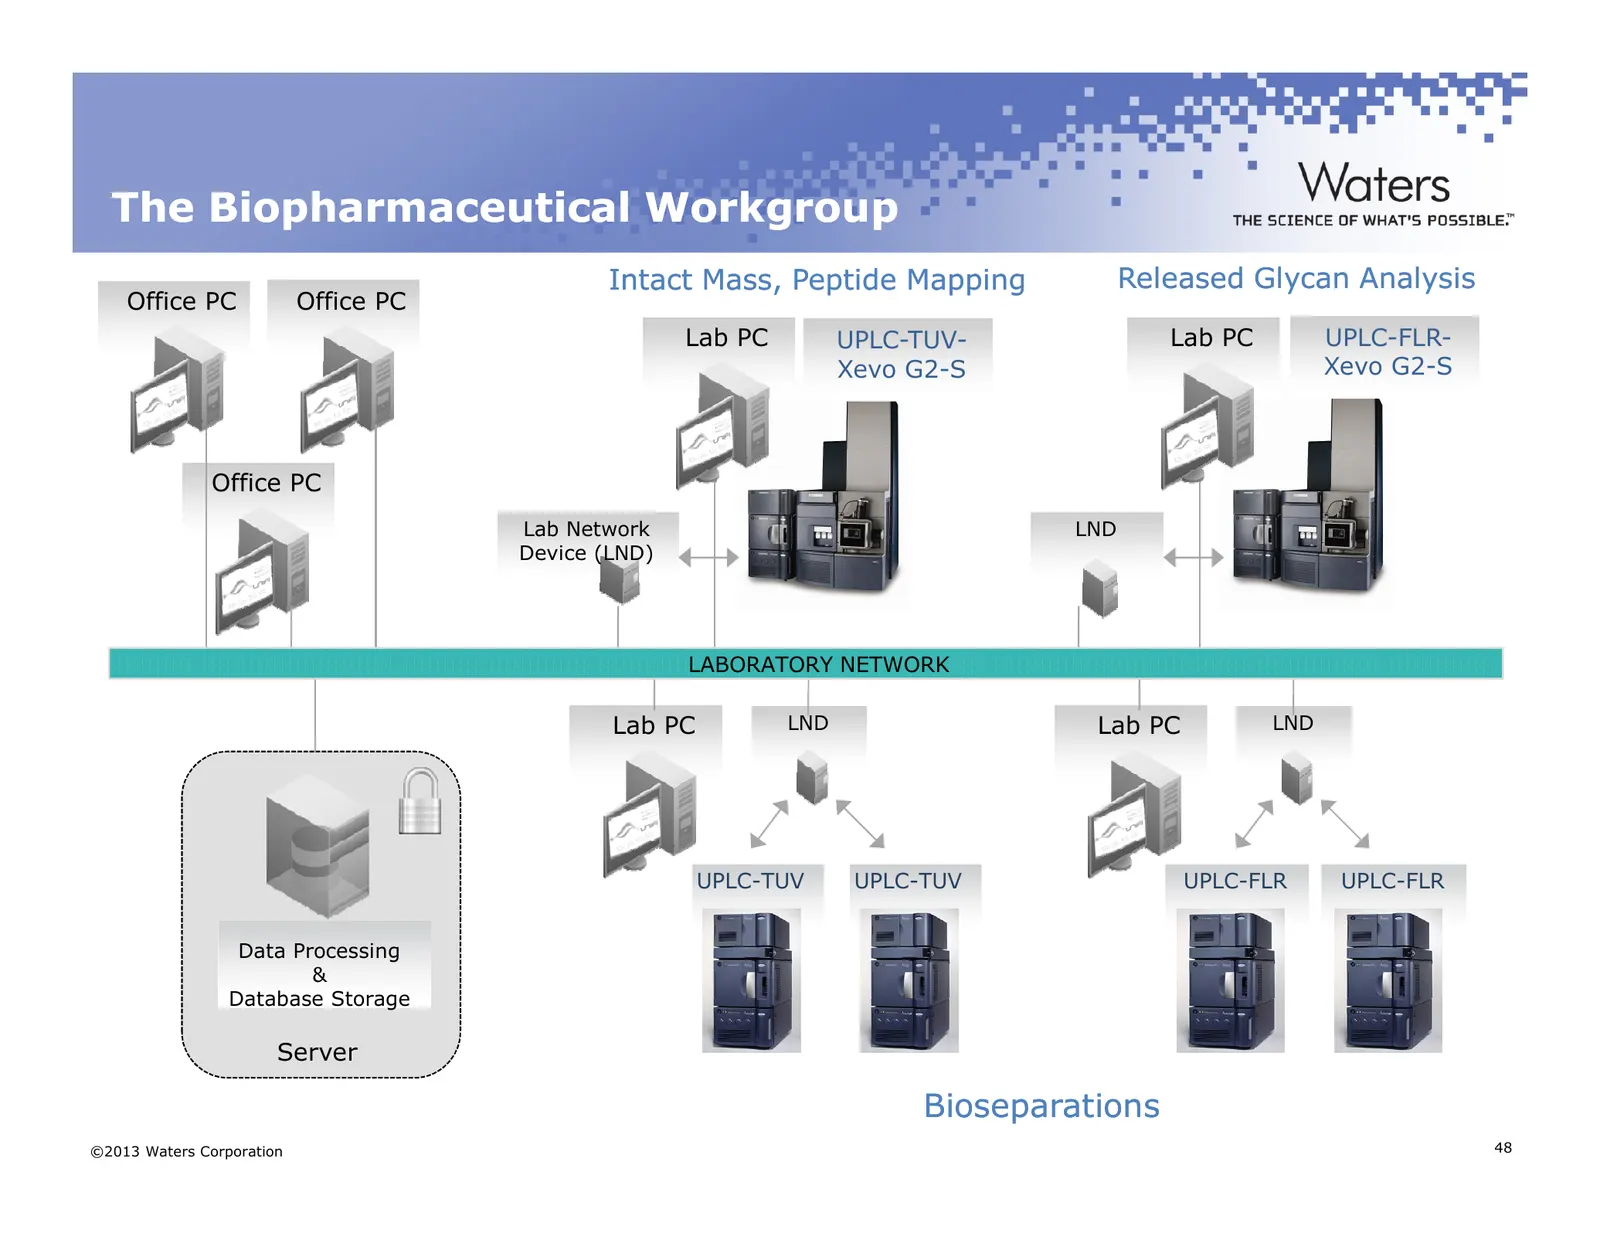
Slide 48: The Biopharmaceutical Workgroup
The Biopharmaceutical Workgroup Intact Mass, Peptide Mapping Released Glycan Analysis Office PC Office PC Lab PC UPLC-TUV- Lab PC UPLC-FLR- Xevo G2-S Xevo G2-S Office PC Lab Network LND Device (LND) LABORATORY NETWORK Lab PC LND Lab PC LND UPLC-TUV UPLC-TUV UPLC-FLR UPLC-FLR Data Processing & Databa
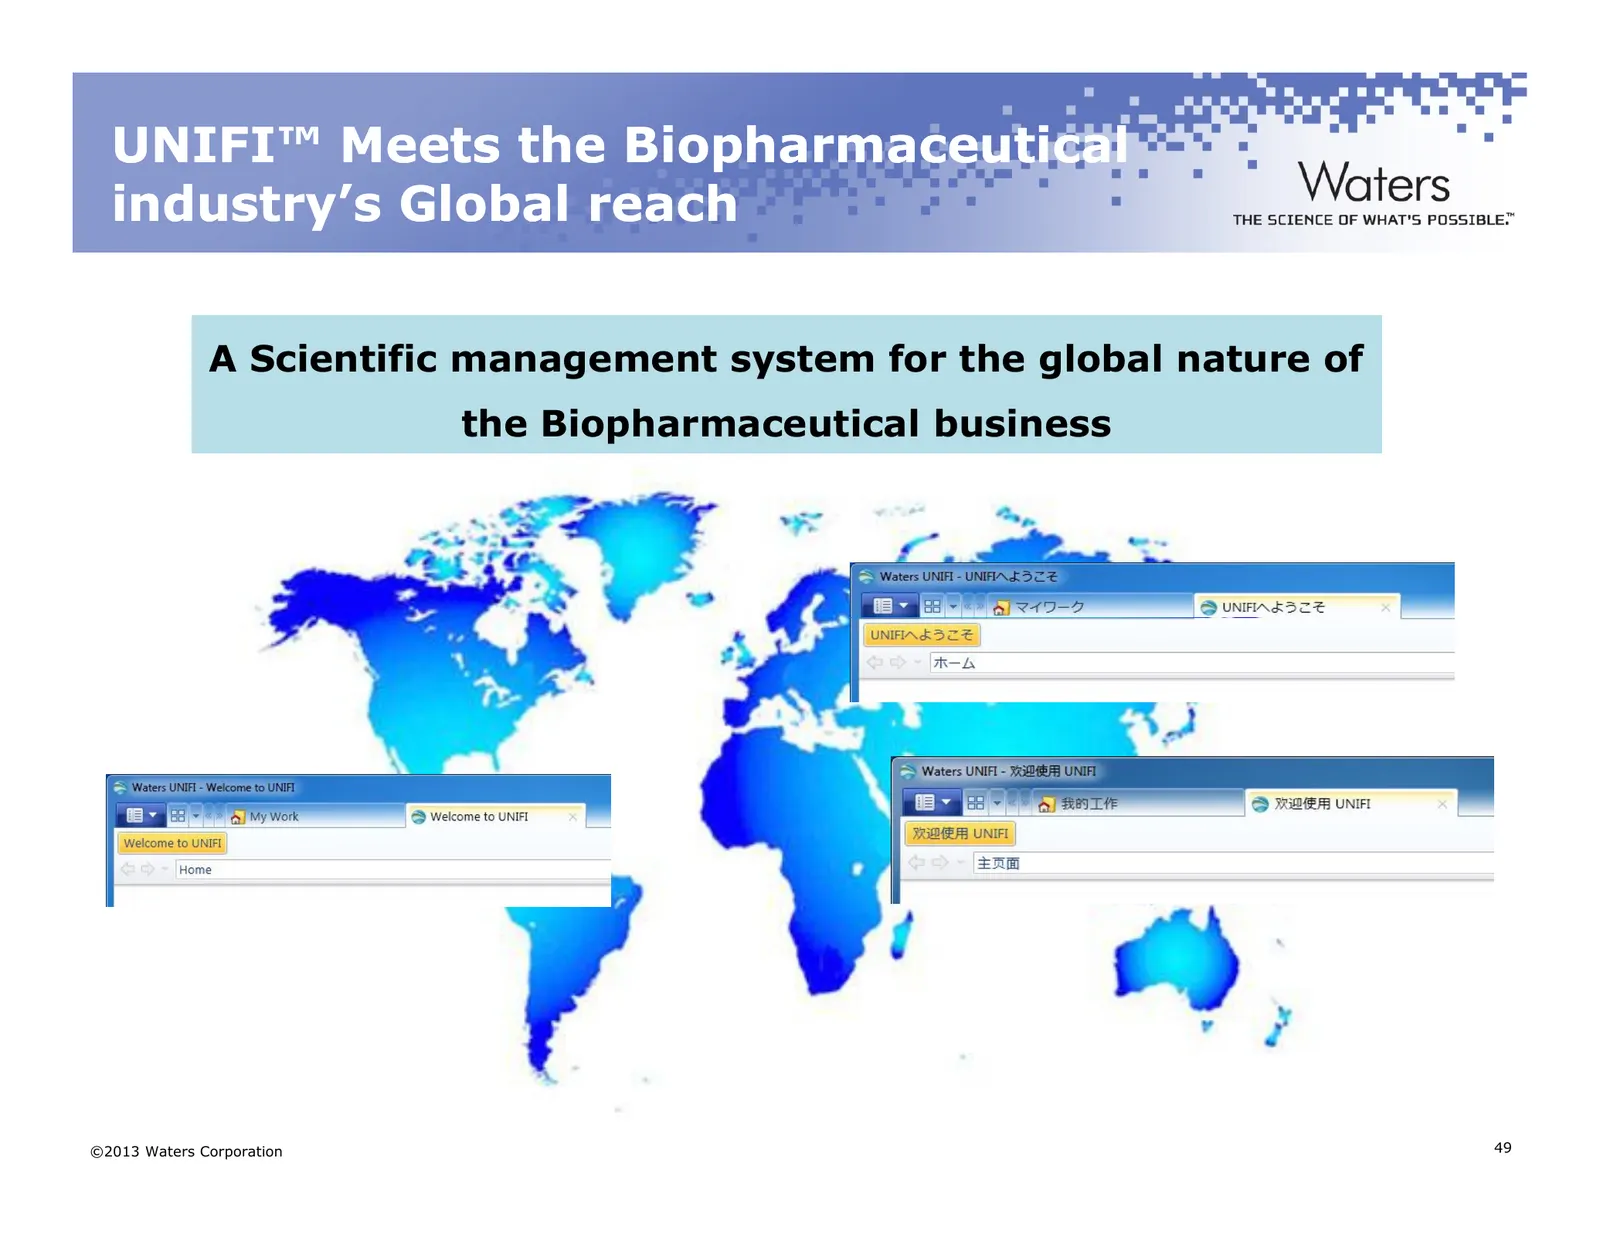
Slide 49: UNIFI Meets the Biopharmaceutical Industry's Global Reach
UNIFI™ Meets the Biopharmaceutical industry’s Global reach A Scientific management system for the global nature of the Biopharmaceutical business ©2013 Waters Corporation 49
Slide 50: Peptide Mapping in UNIFI
Peptide Mapping in UNIFITM Advanced Reporting Capabilities in a GxP-ready Environment ©2013 Waters Corporation 50
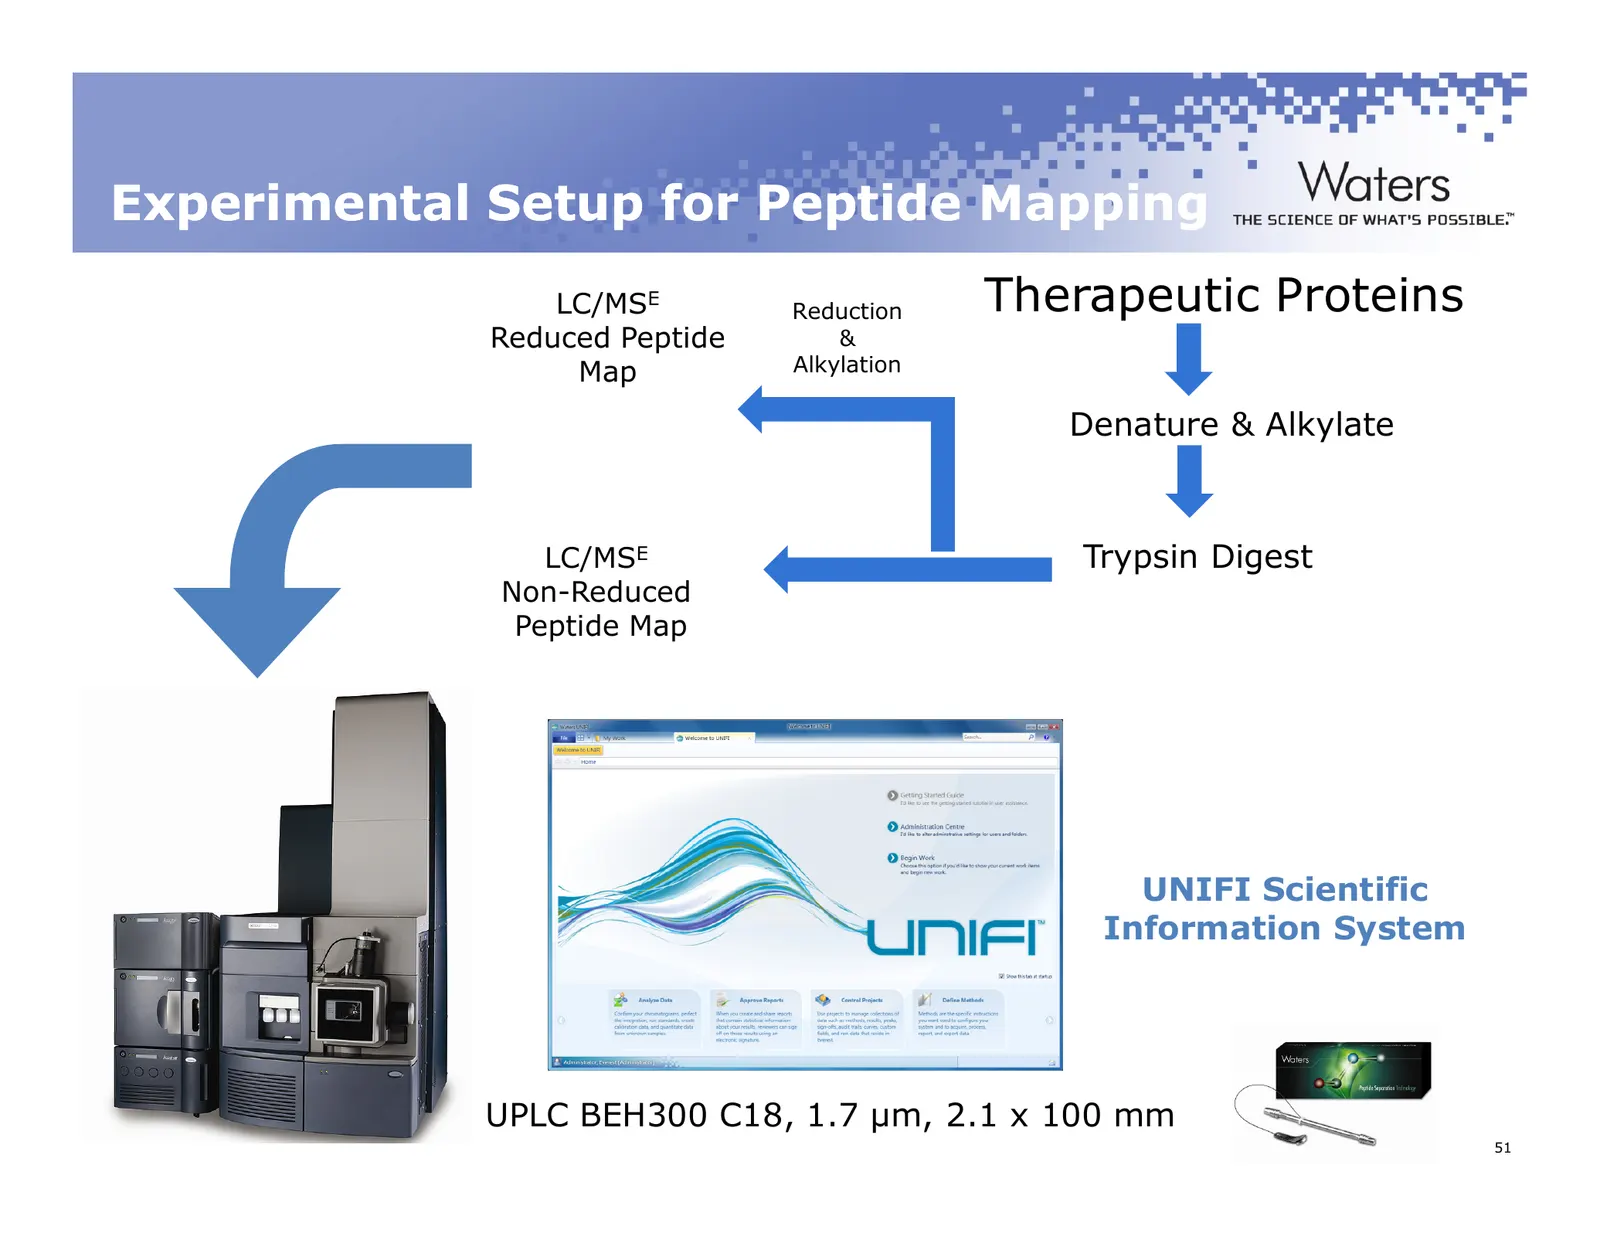
Slide 51: Experimental Setup for Peptide Mapping
Experimental Setup for Peptide Mapping LC/MSE Reduction Therapeutic Proteins Reduced Peptide & Map Alkylation Denature & Alkylate LC/MSE Trypsin Digest Non-Reduced Peptide Map UNIFI Scientific Information System UPLC BEH300 C18, 1.7 µm, 2.1 x 100 mm ©2011 Waters Corporation 51
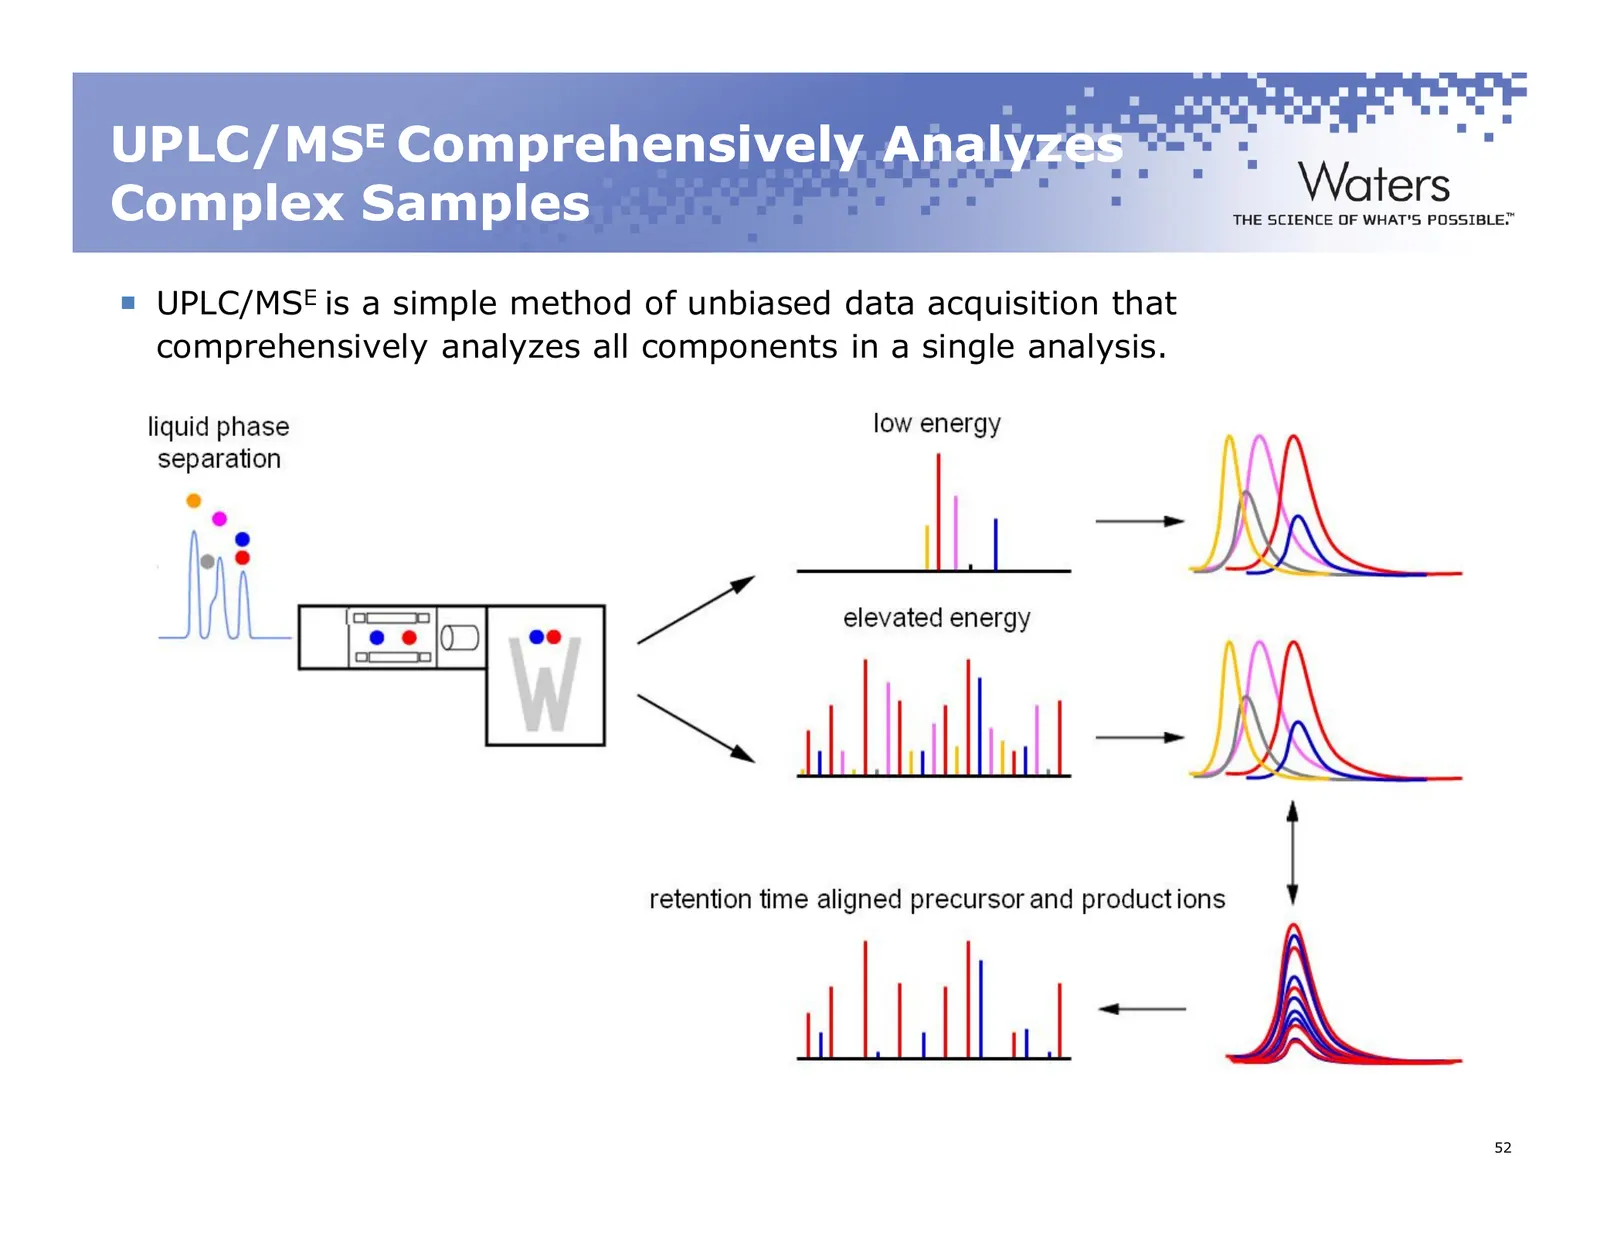
Slide 52: UPLC/MSE Comprehensively Analyzes Complex Samples
UPLC/MSE Comprehensively Analyzes Complex Samples UPLC/MSE is a simple method of unbiased data acquisition that comprehensively analyzes all components in a single analysis. ©2011 Waters Corporation 52
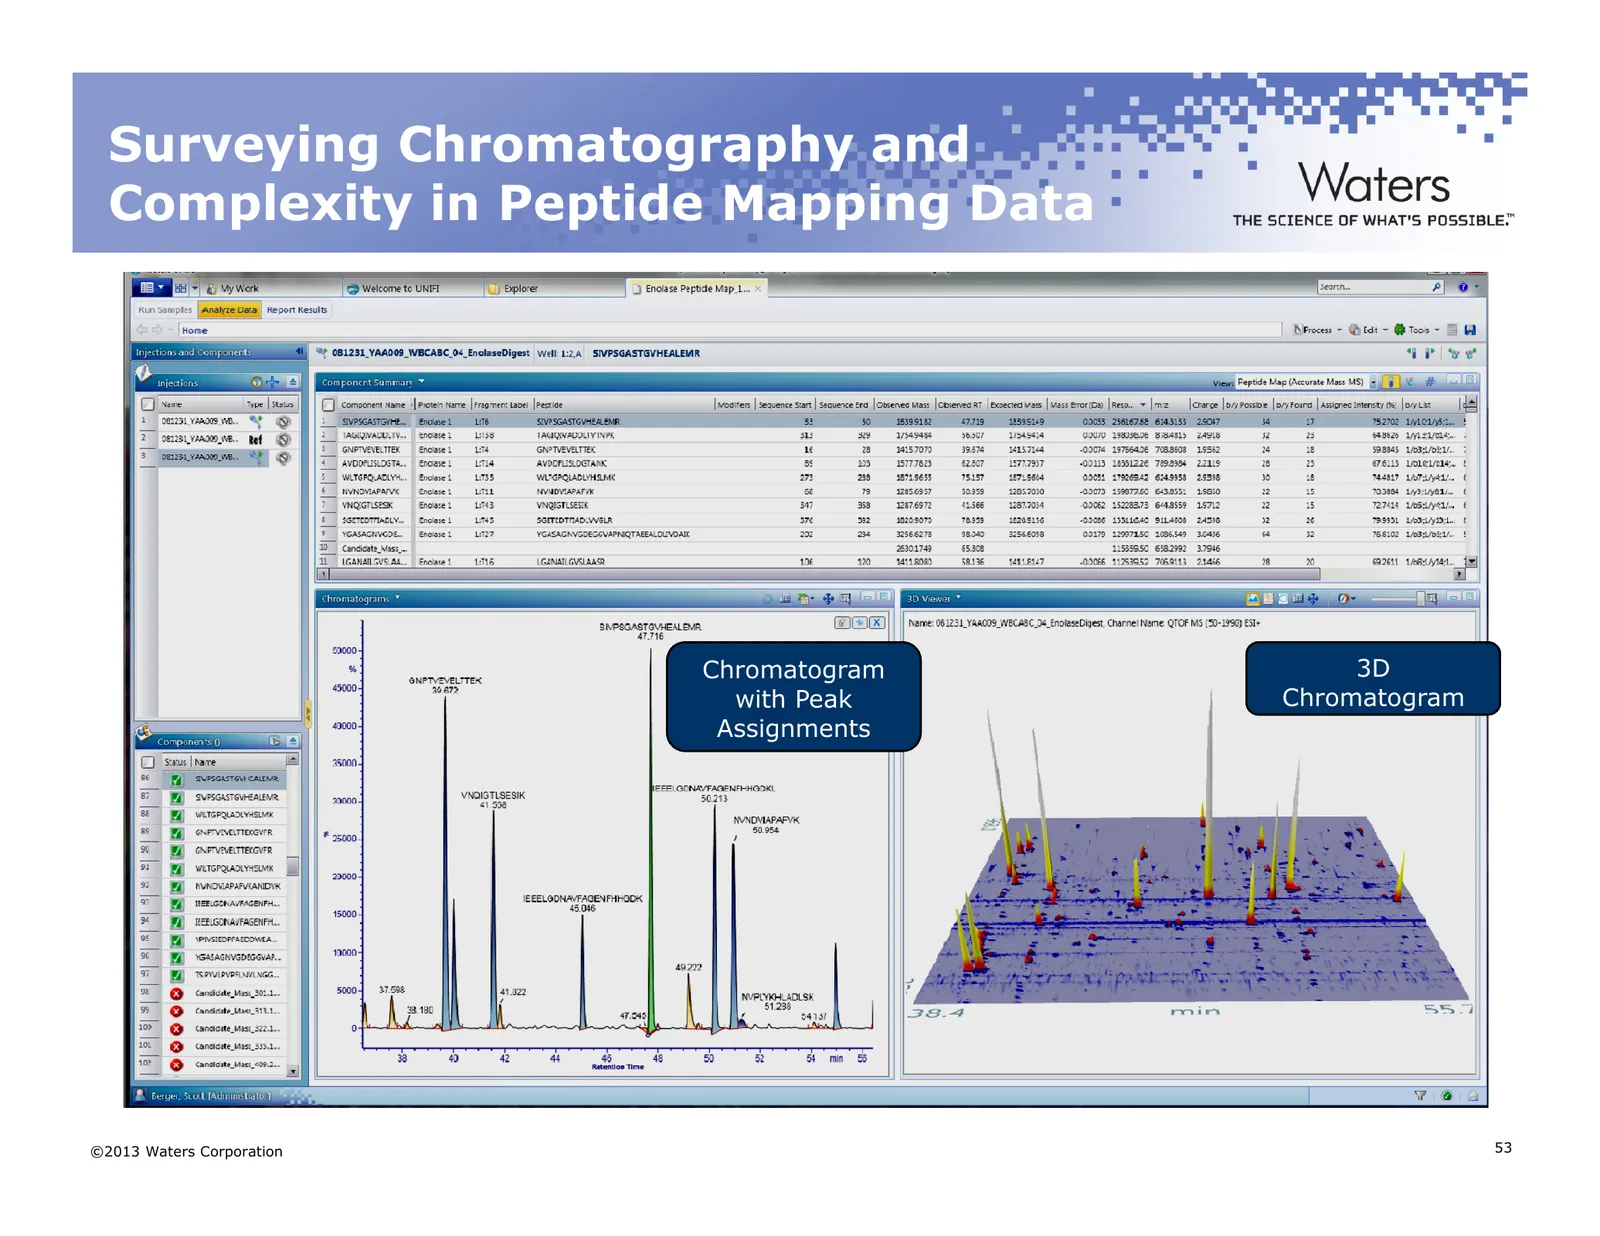
Slide 53: Surveying Chromatography and Complexity in Peptide Mapping Data
Surveying Chromatography and Complexity in Peptide Mapping Data Chromatogram 3D with Peak Chromatogram Assignments ©2013 Waters Corporation 53
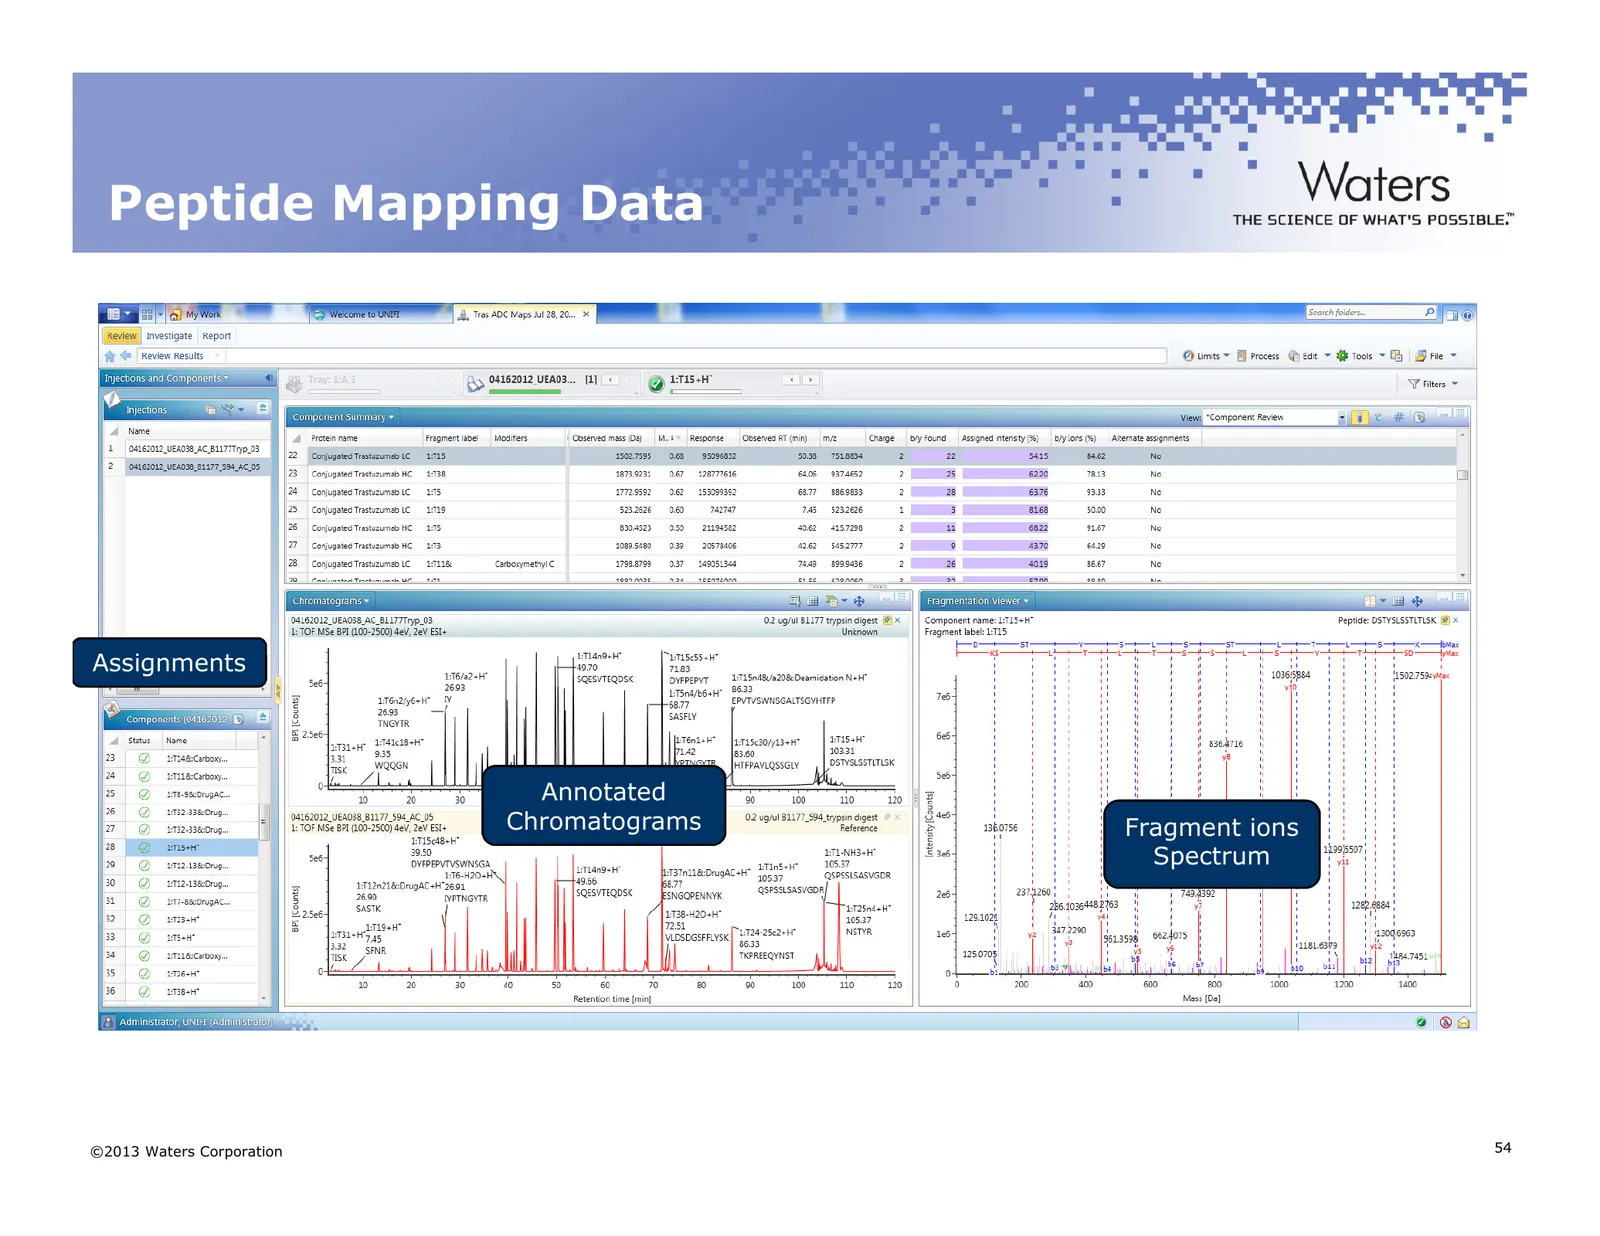
Slide 54: Peptide Mapping Data
Peptide Mapping Data Assignments Annotated Chromatograms Fragment ions Spectrum ©2013 Waters Corporation 54
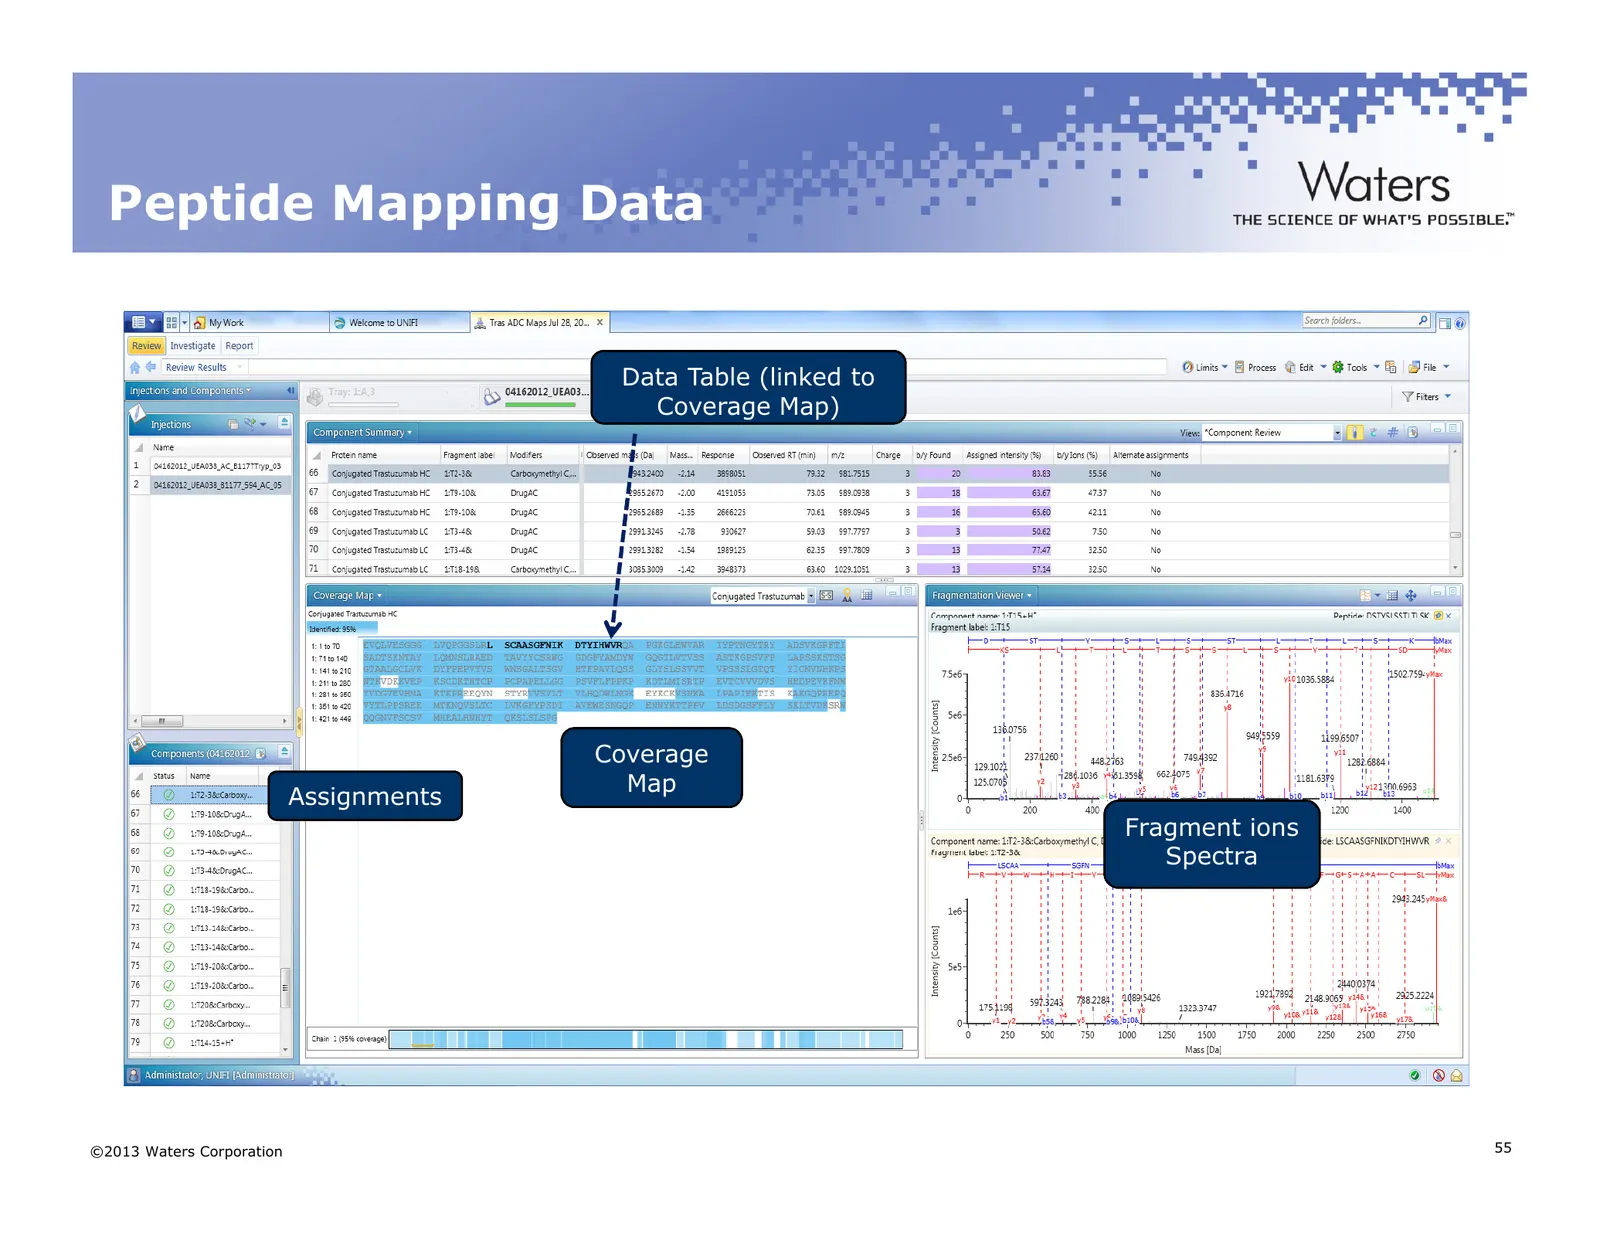
Slide 55: Peptide Mapping Data
Peptide Mapping Data Data Table (linked to Coverage Map) Coverage Map Assignments Fragment ions Spectra ©2013 Waters Corporation 55
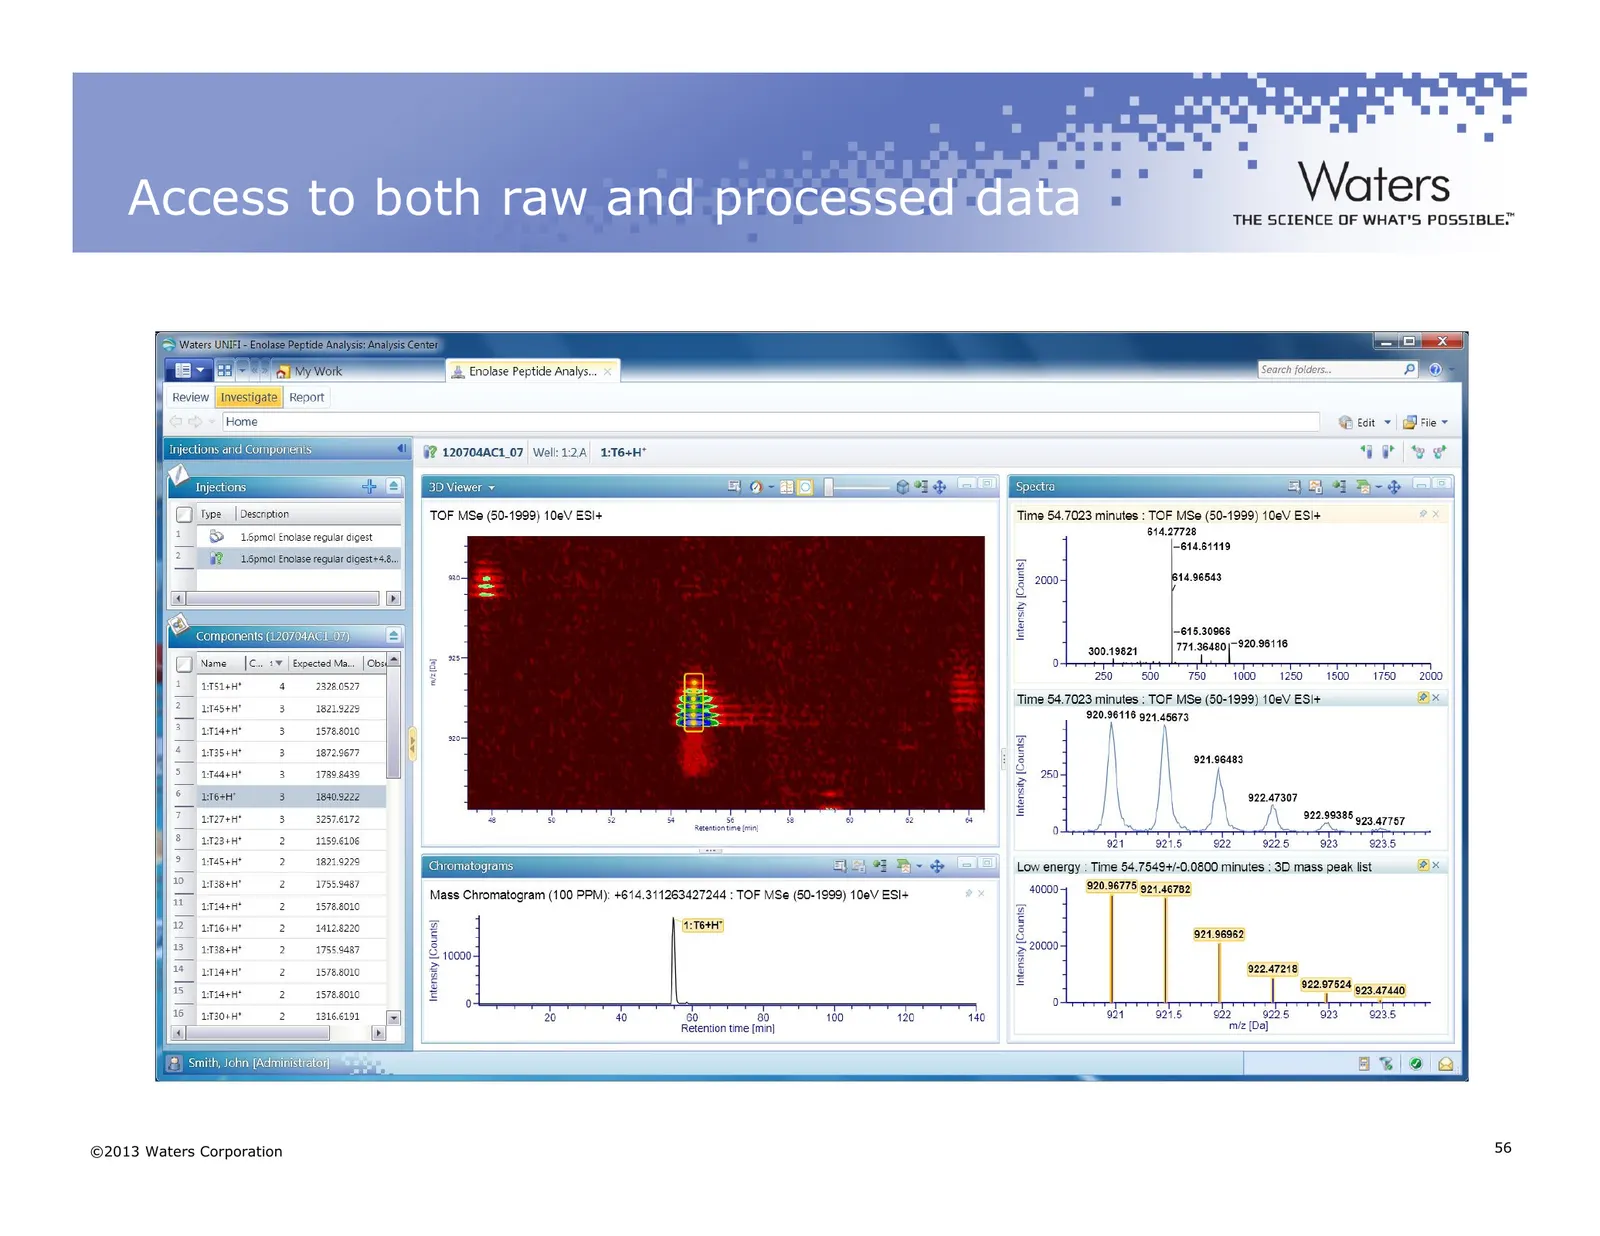
Slide 56: Access to both raw and processed data
Access to both raw and processed data ©2013 Waters Corporation 56
Slide 57: Case Study 1
Case Study 1 ©2011 Waters Corporation 57
Slide 58: Experimental Setup for Peptide Mapping
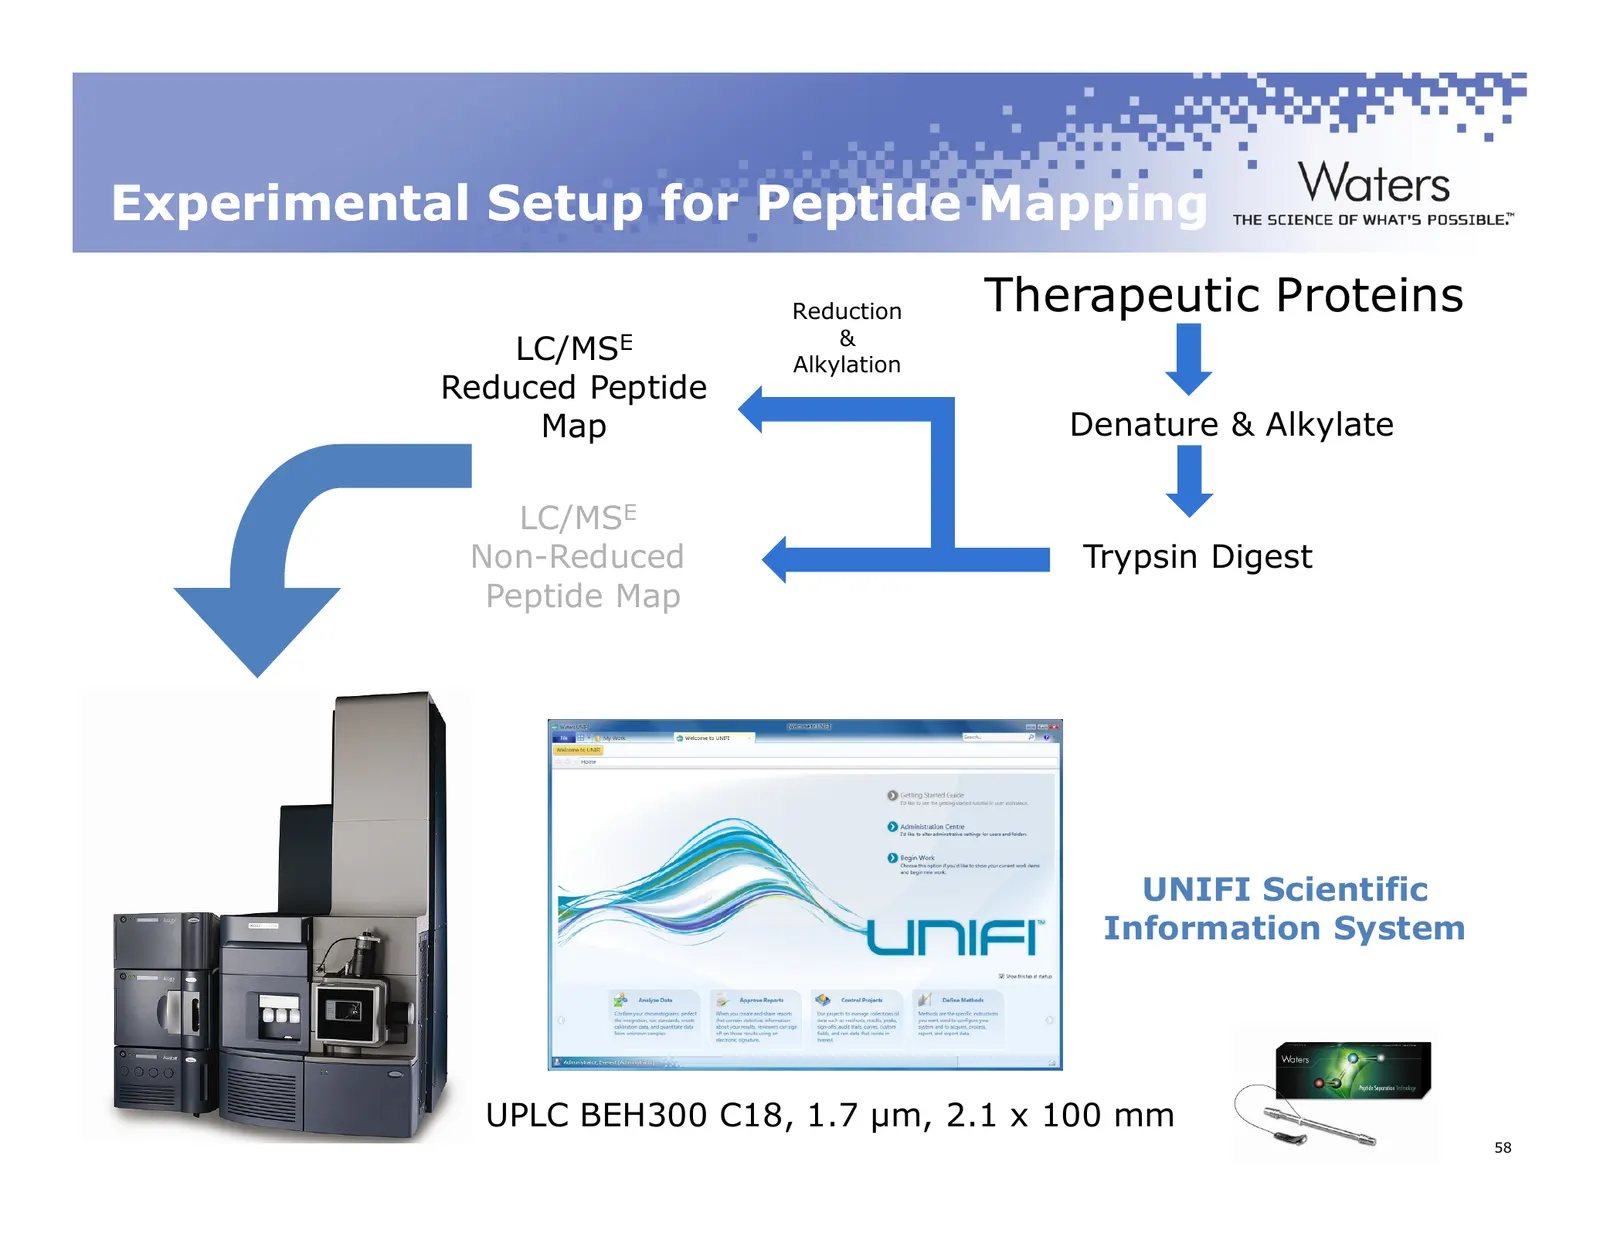
Experimental Setup for Peptide Mapping Reduction Therapeutic Proteins & LC/MSE Alkylation Reduced Peptide Map Denature & Alkylate LC/MSE Non-Reduced Trypsin Digest Peptide Map UNIFI Scientific Information System UPLC BEH300 C18, 1.7 µm, 2.1 x 100 mm ©2011 Waters Corporation 58
Slide 59: Equivalent protein coverage was obtained for innovator and biosimilar
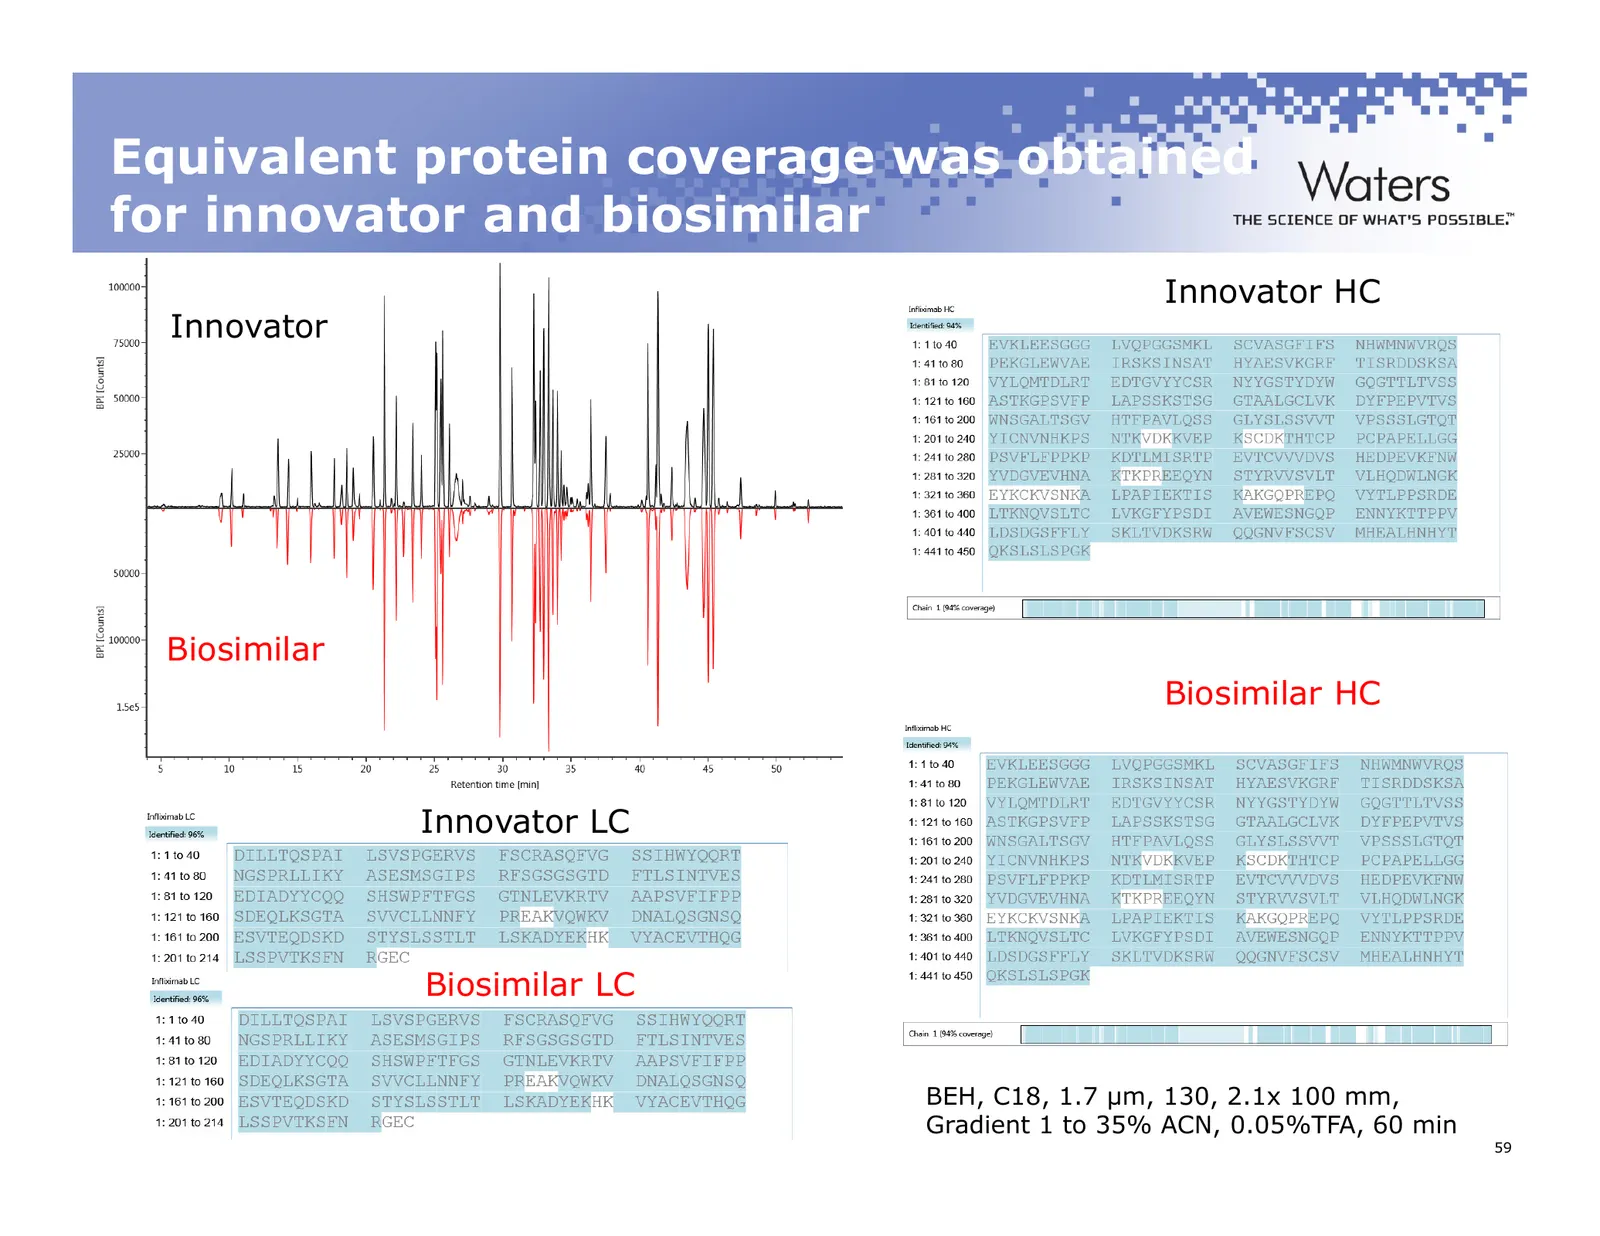
Equivalent protein coverage was obtained for innovator and biosimilar Innovator HC Innovator Biosimilar Biosimilar HC Innovator LC Biosimilar LC BEH, C18, 1.7 µm, 130, 2.1x 100 mm, Gradient 1 to 35% ACN, 0.05%TFA, 60 min ©2011 Waters Corporation 59
Slide 60: Asp Isomerization of Peptide T24
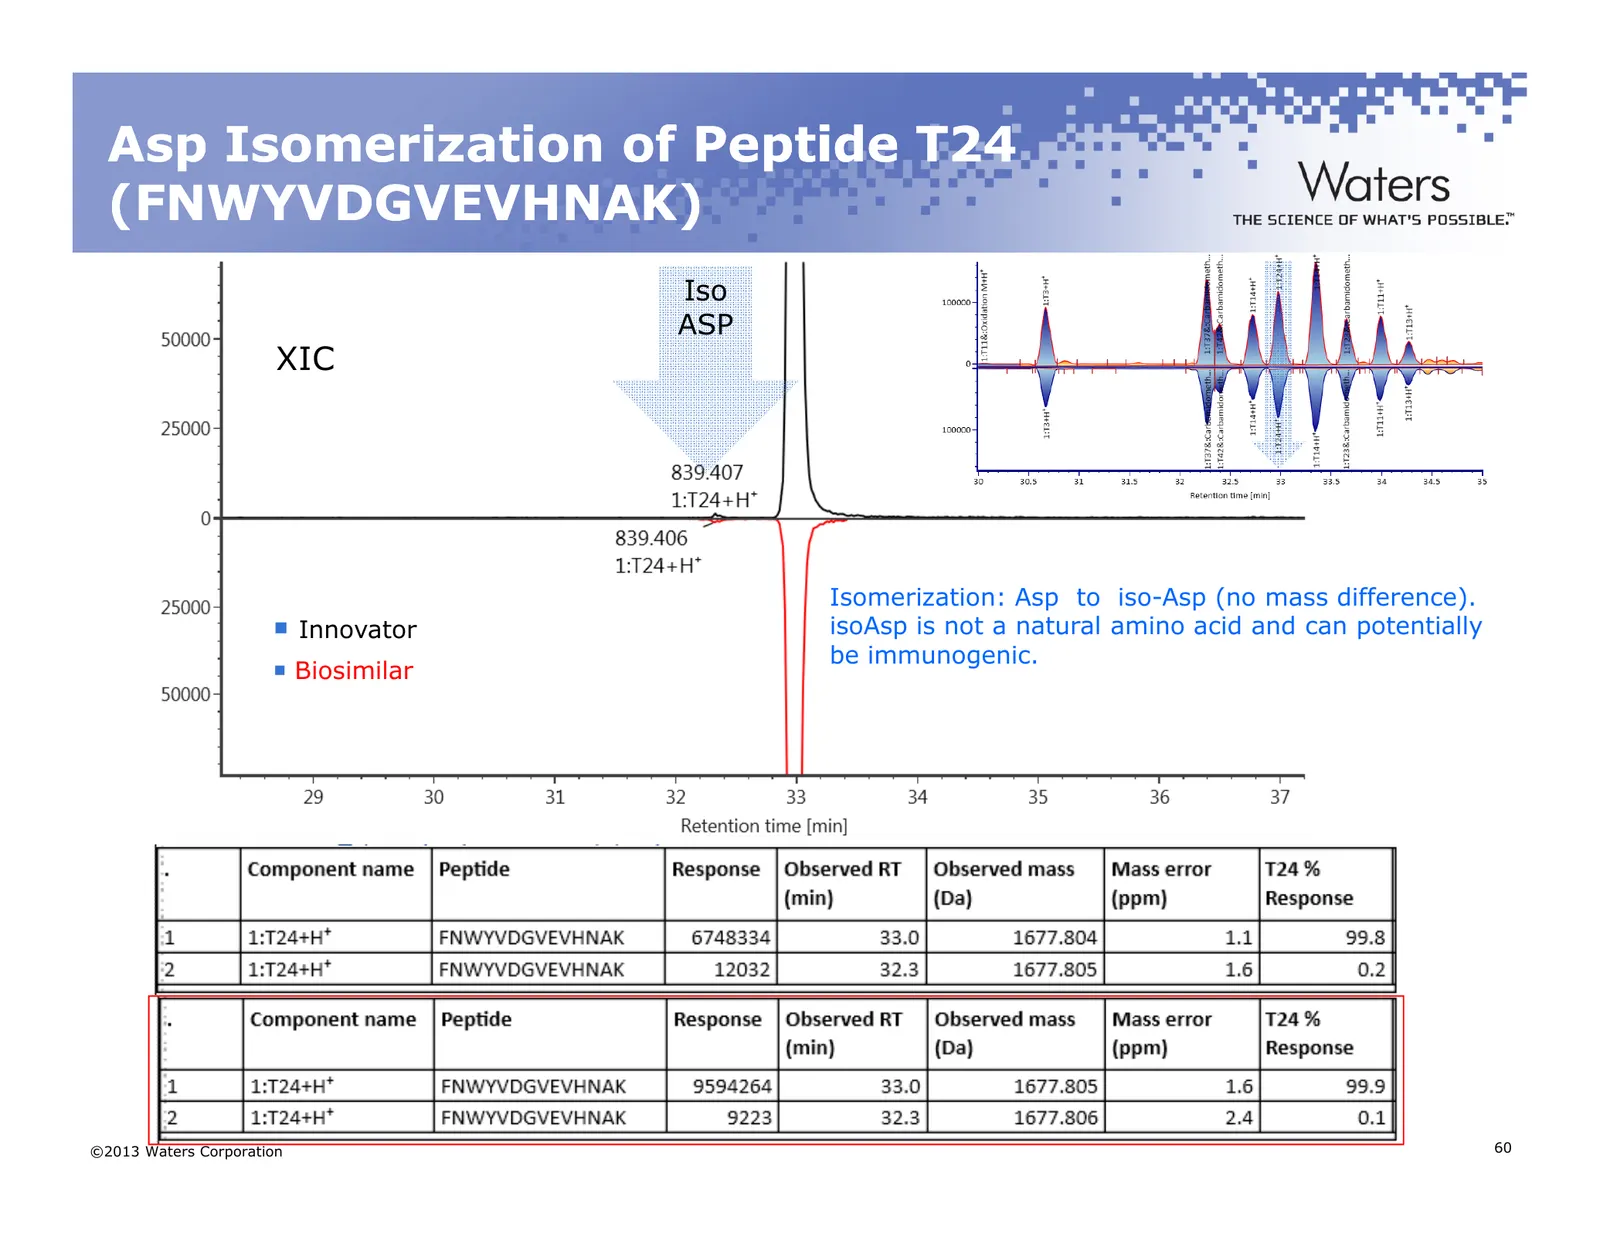
Asp Isomerization of Peptide T24 (FNWYVDGVEVHNAK) Iso ASP XIC Isomerization: Asp to iso-Asp (no mass difference). Innovator isoAsp is not a natural amino acid and can potentially be immunogenic. Biosimilar ©2013 Waters Corporation 60
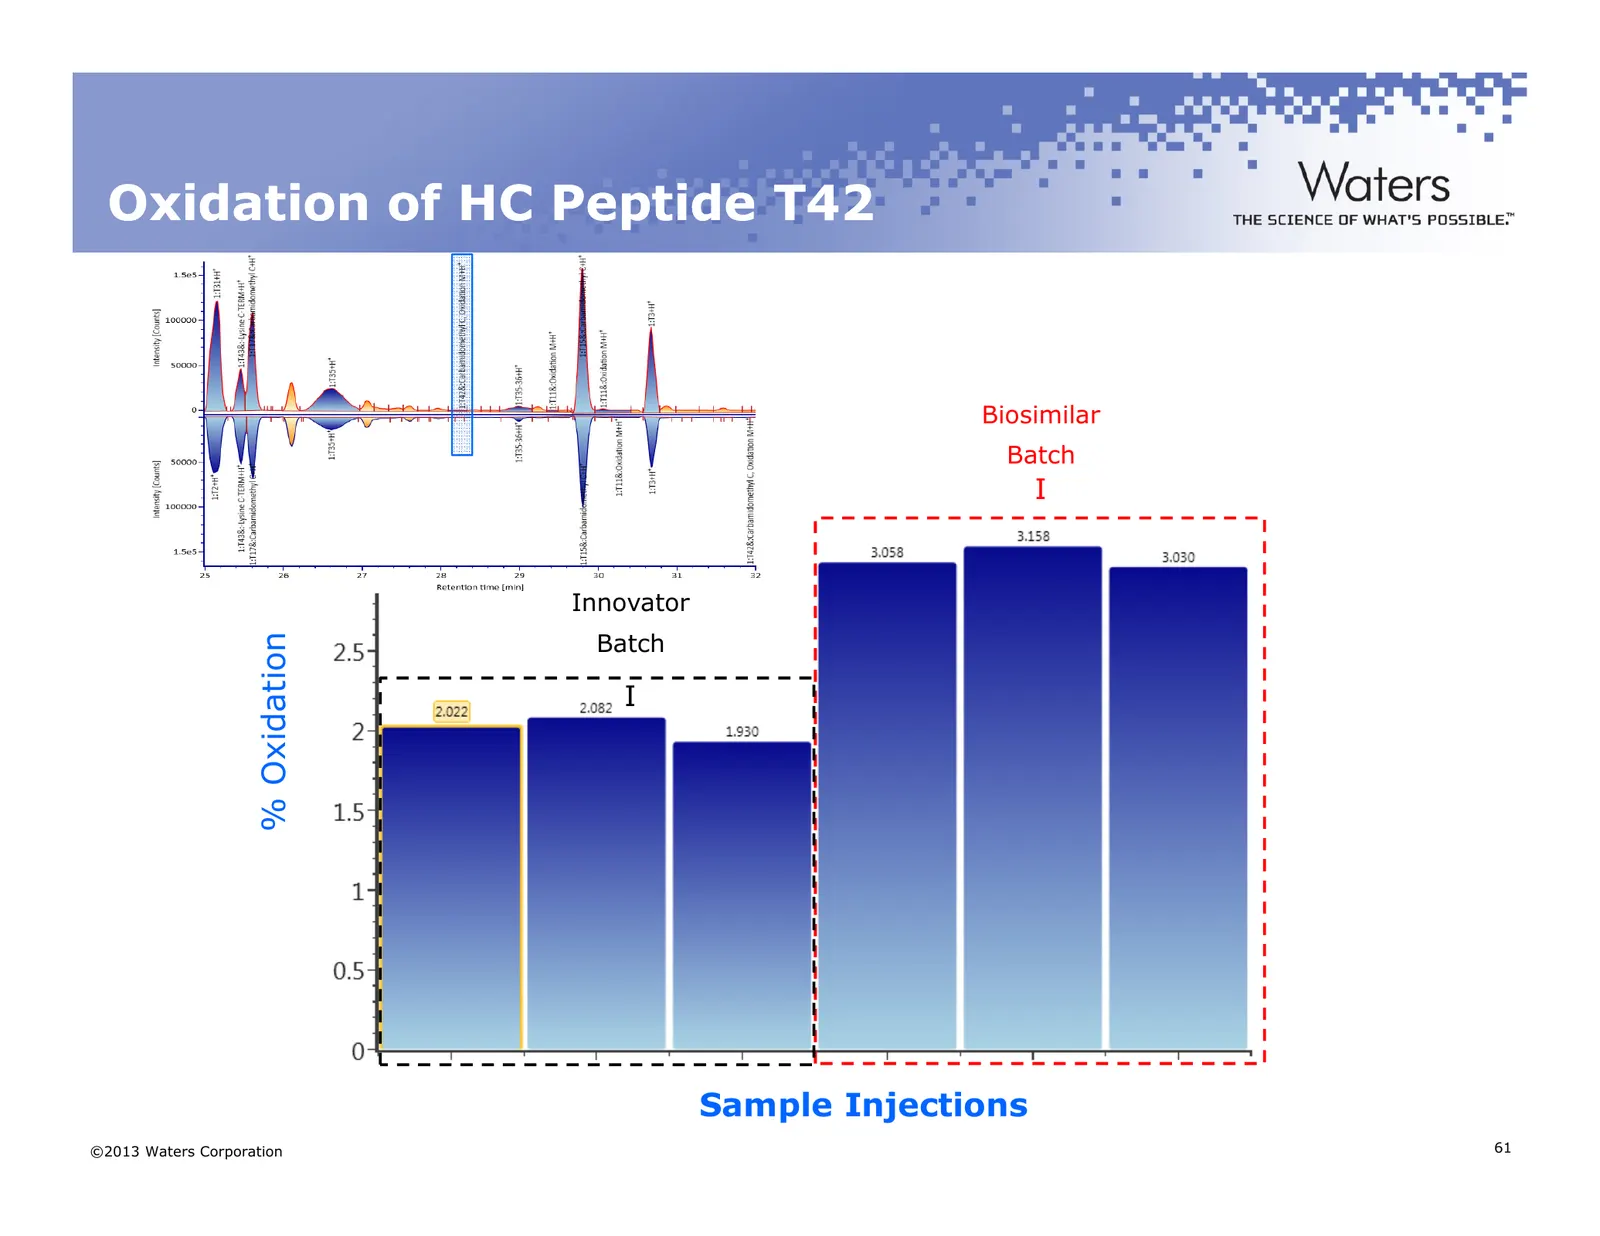
Slide 61: Oxidation of HC Peptide T42
Oxidation of HC Peptide T42 Biosimilar Batch I Innovator Batch % Oxidation I Sample Injections ©2013 Waters Corporation 61
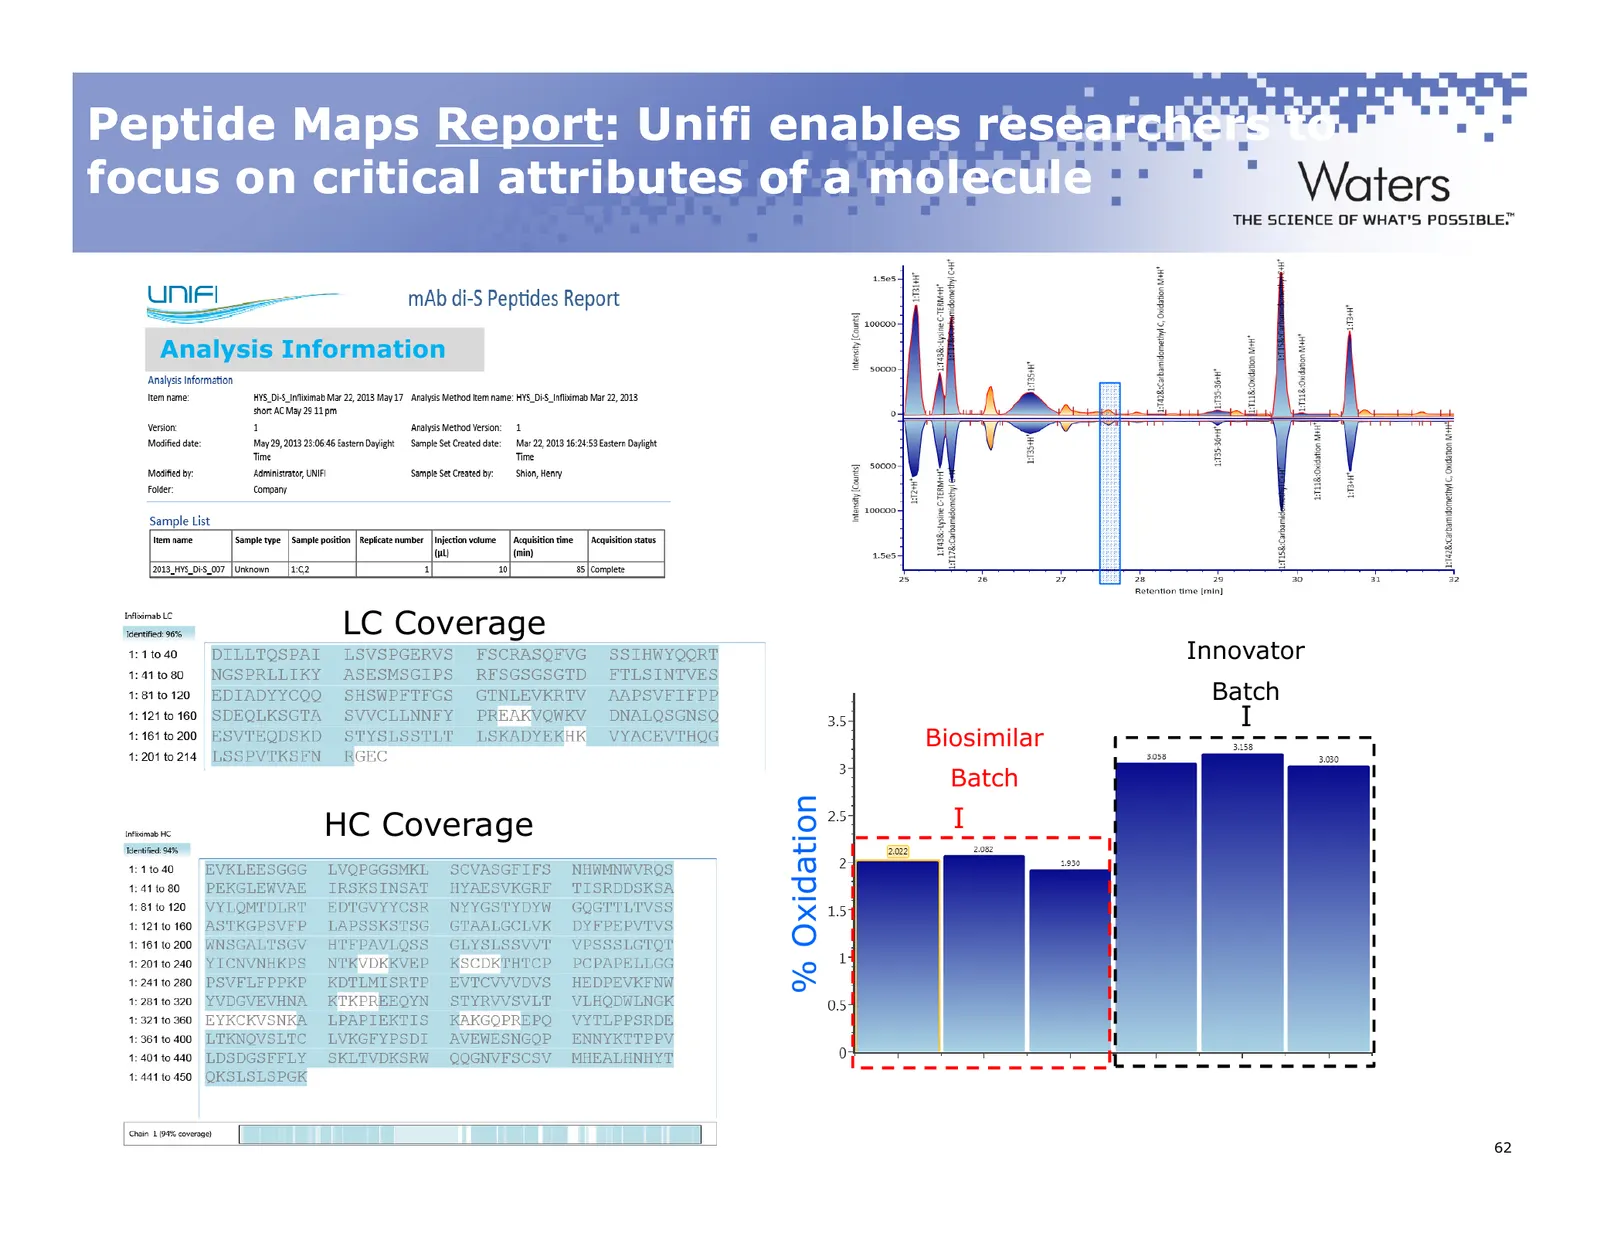
Slide 62: Peptide Maps Report
Peptide Maps Report: Report: Unifi enables researchers to focus on critical attributes of a molecule Analysis Information LC Coverage Innovator Batch I Biosimilar Batch % Oxidation I HC Coverage ©2011 Waters Corporation 62
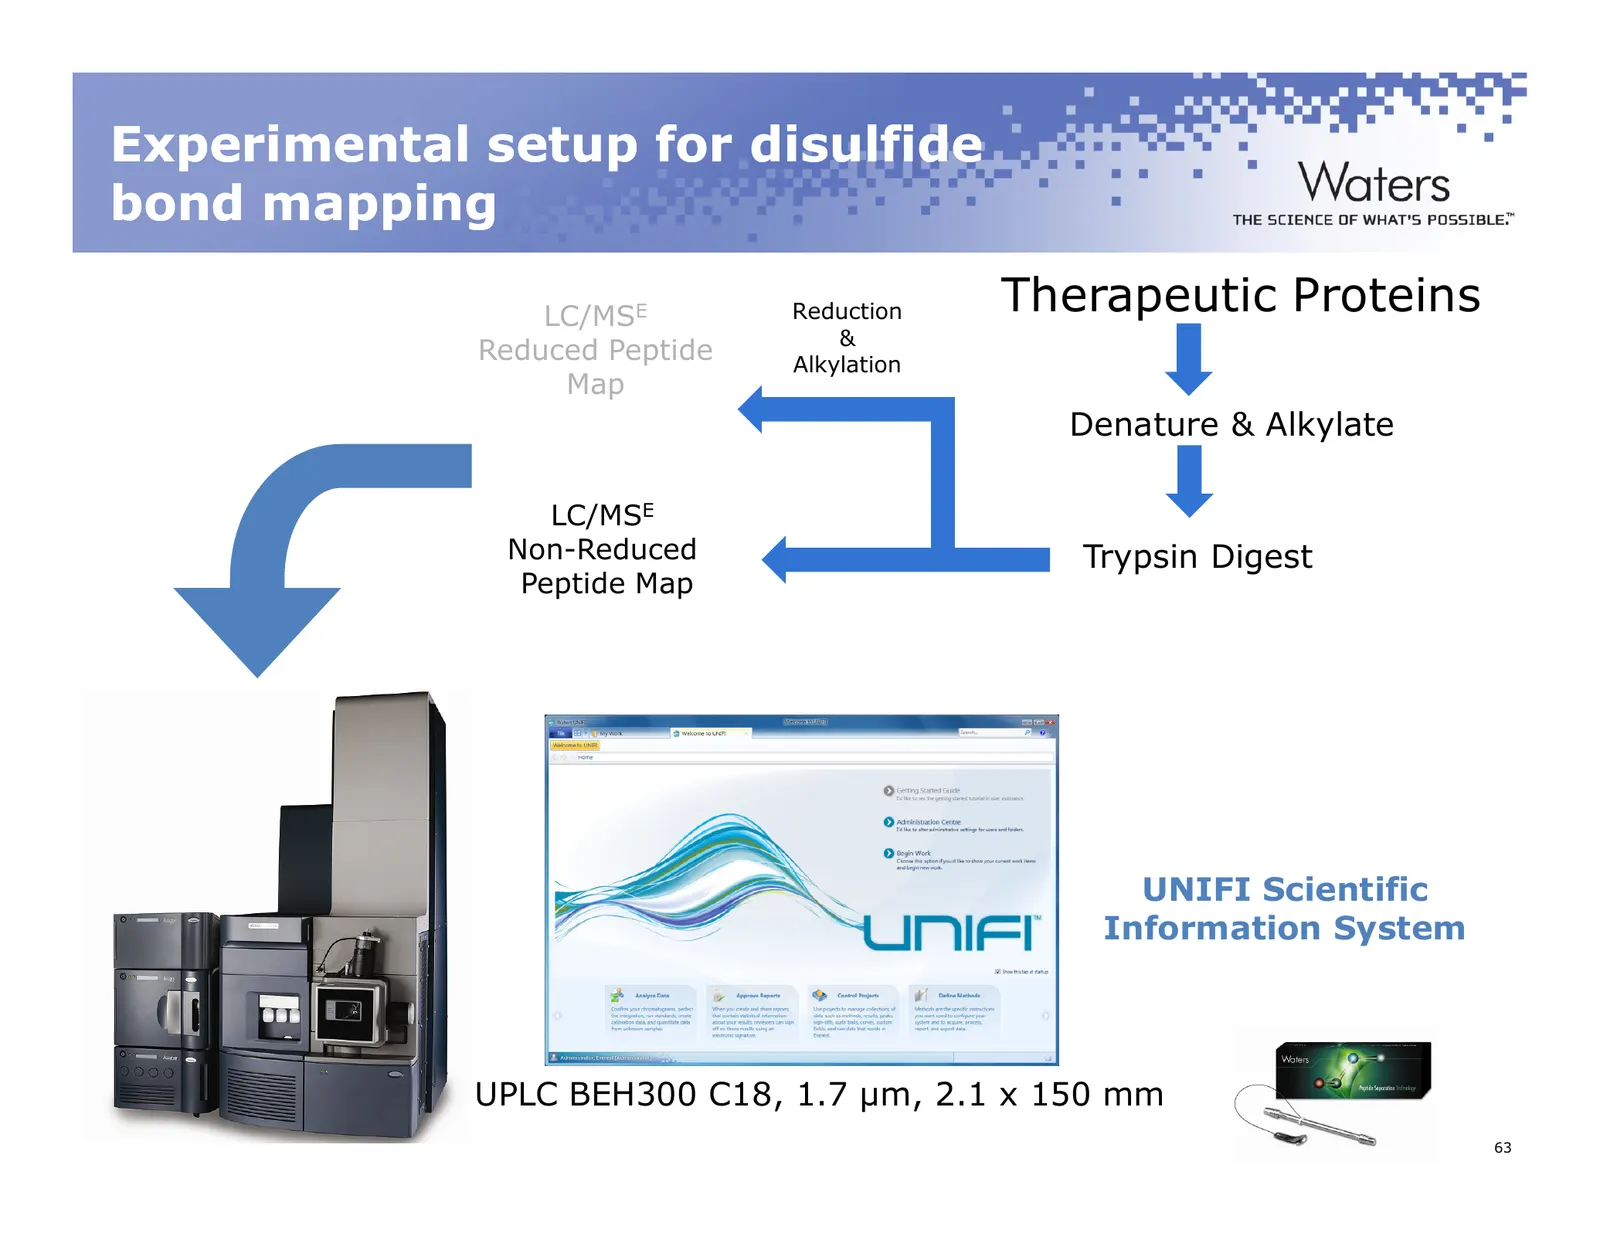
Slide 63: Experimental setup for disulfide bond mapping
Experimental setup for disulfide bond mapping LC/MSE Reduction Therapeutic Proteins & Reduced Peptide Alkylation Map Denature & Alkylate LC/MSE Non-Reduced Trypsin Digest Peptide Map UNIFI Scientific Information System UPLC BEH300 C18, 1.7 µm, 2.1 x 150 mm ©2011 Waters Corporation 63
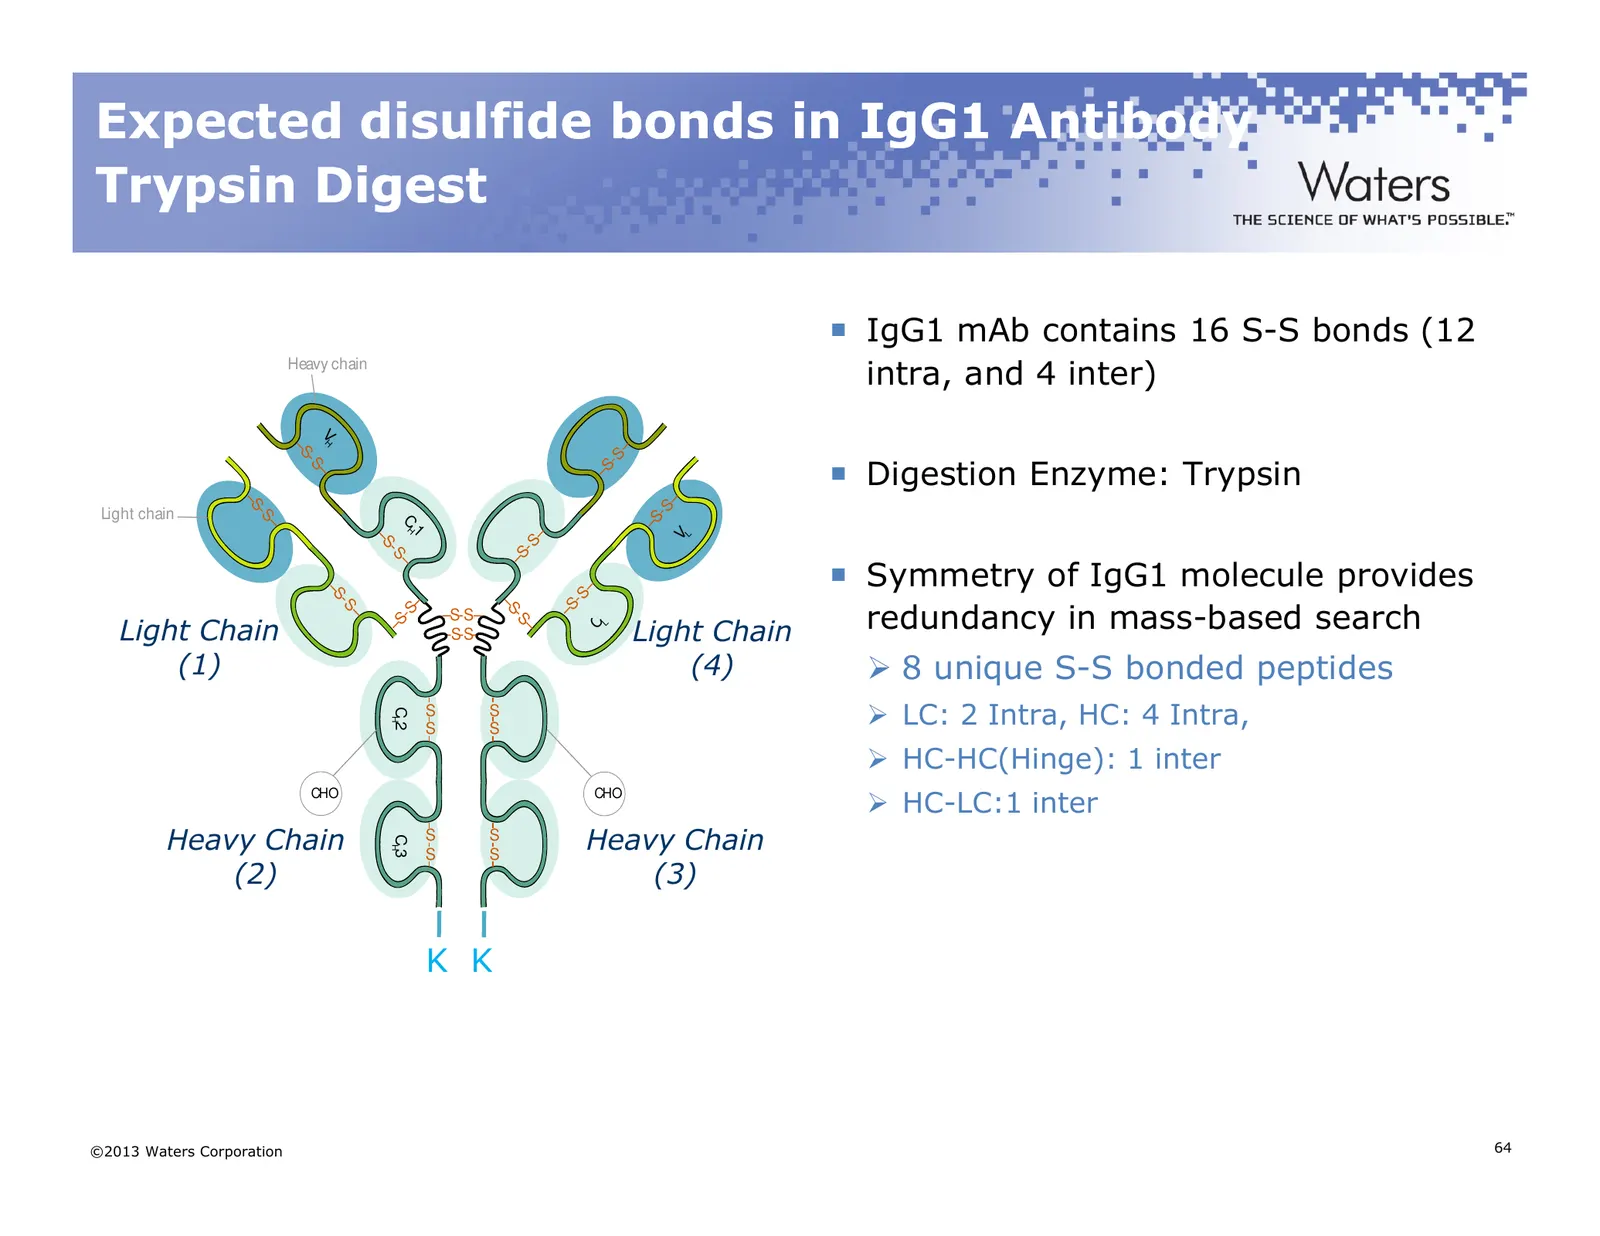
Slide 64: Expected disulfide bonds in IgG1 Antibody Trypsin Digest
Expected disulfide bonds in IgG1 Antibody Trypsin Digest IgG1 mAb contains 16 S-S bonds (12 Heavy chain intra, and 4 inter) VH –S – Digestion Enzyme: Trypsin -S -S –S – – –S -S Light chain -S –S CH – 1 – VL –S -S -S –S Symmetry of IgG1 molecule provides – – –S -S redundancy in mass-based search -S –
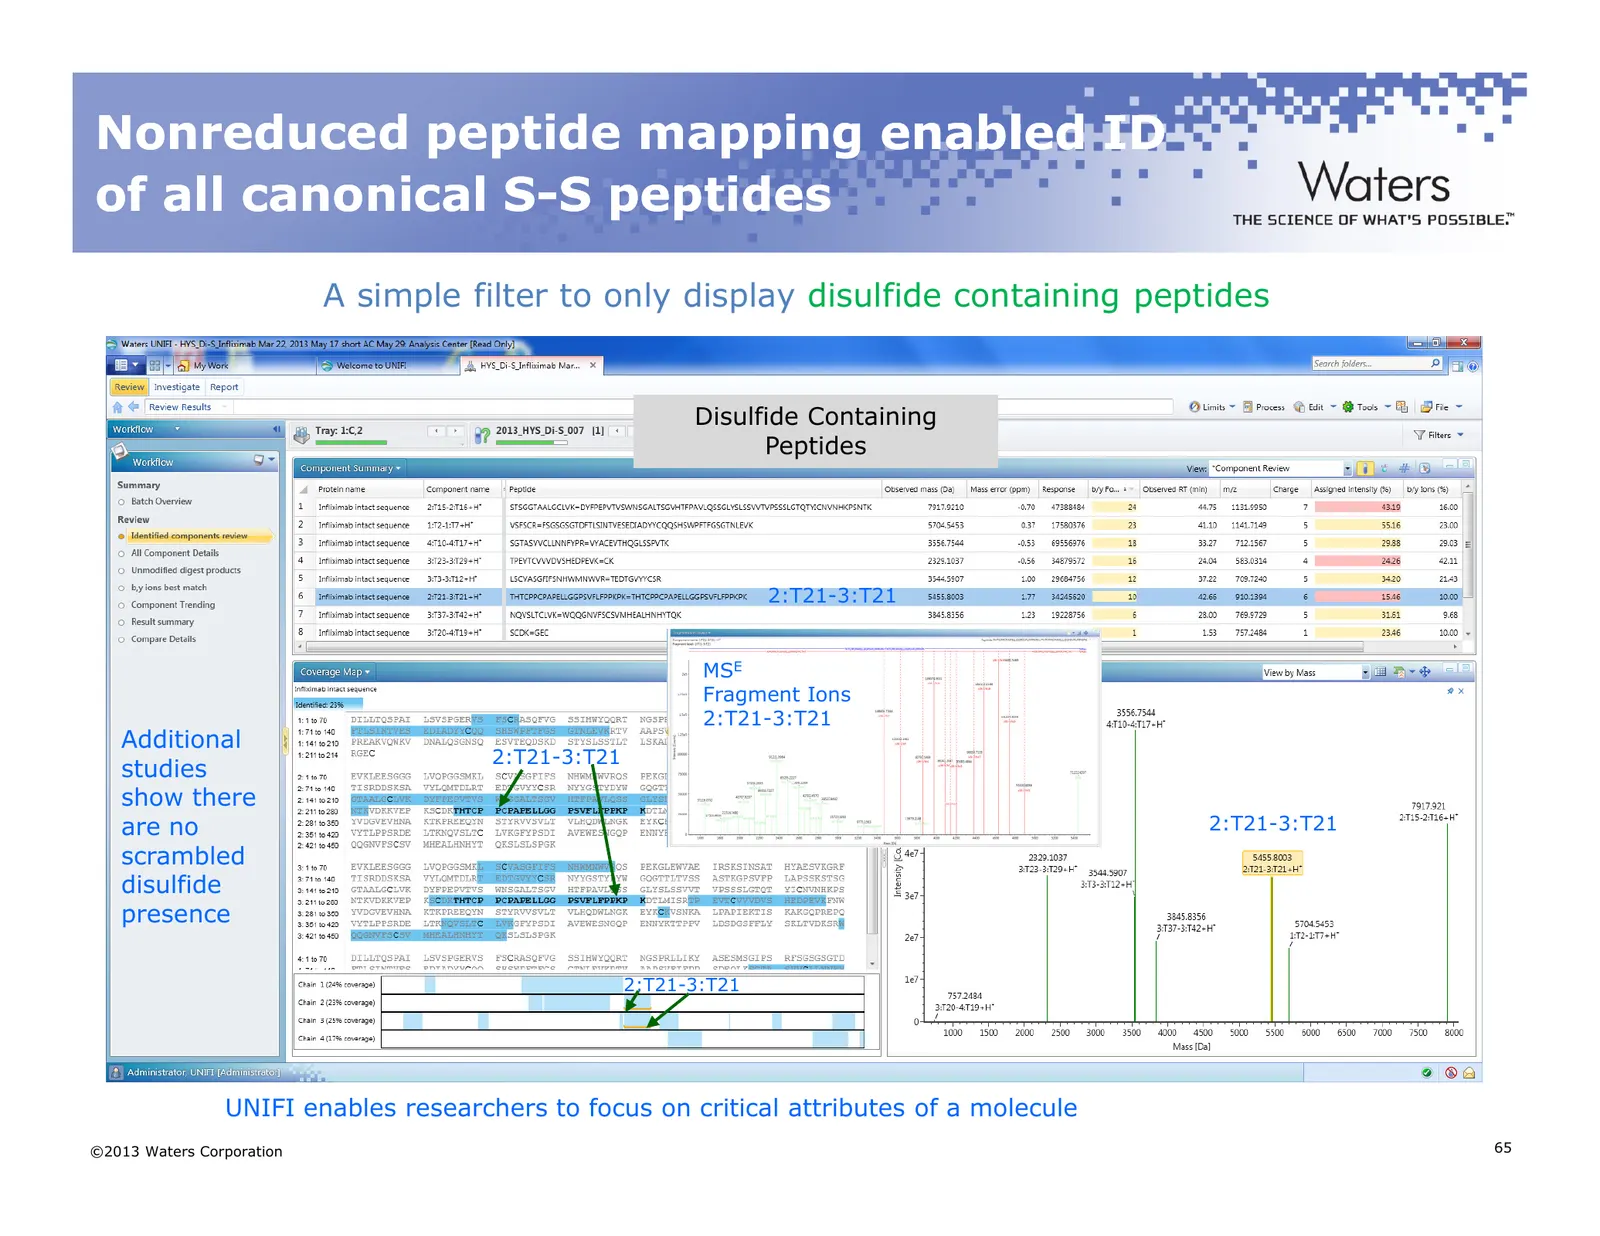
Slide 65: Nonreduced peptide mapping enabled ID of all canonical S-S peptides
Nonreduced peptide mapping enabled ID of all canonical S- S-S peptides A simple filter to only display disulfide containing peptides Disulfide Containing Peptides 2:T21-3:T21 MSE Fragment Ions 2:T21-3:T21 Additional 2:T21-3:T21 studies show there are no 2:T21-3:T21 scrambled disulfide presence 2:T21
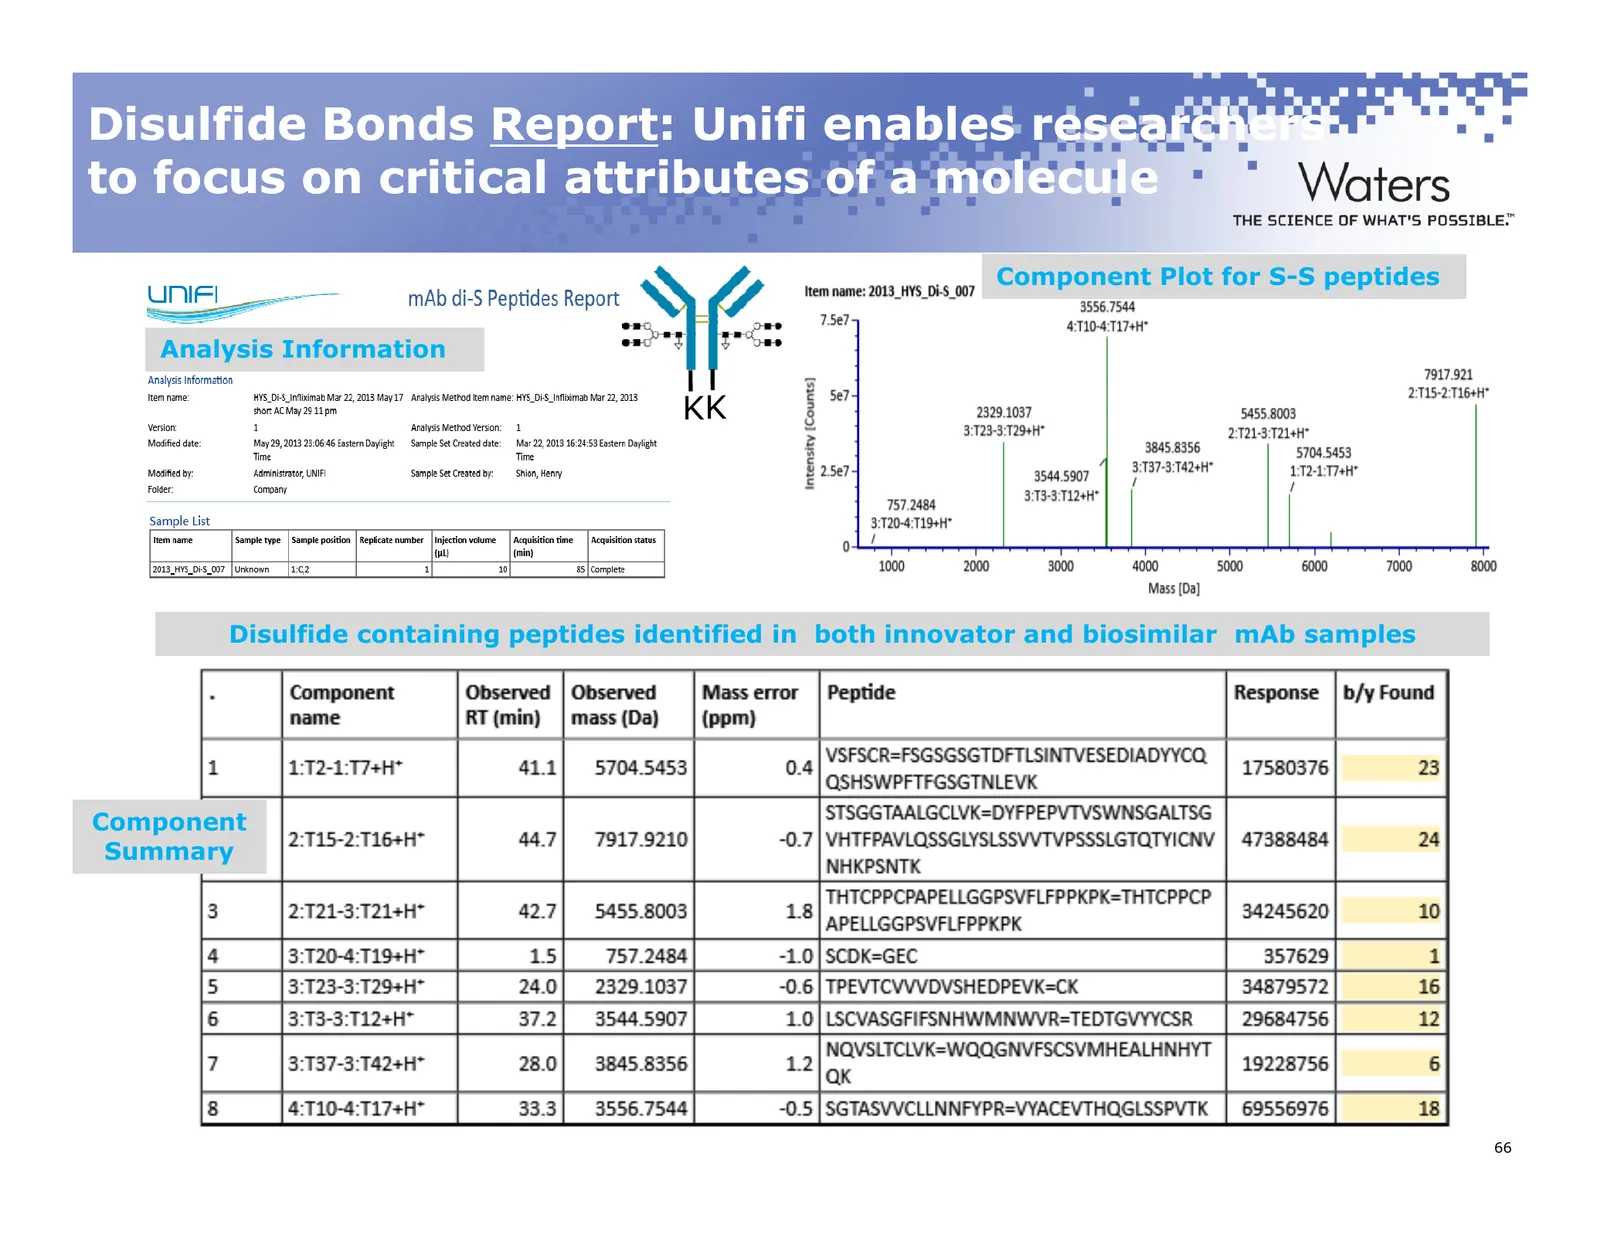
Slide 66: Disulfide Bonds Report
Disulfide Bonds Report Report:: Unifi enables researchers to focus on critical attributes of a molecule Component Plot for S-S peptides Analysis Information KK Disulfide containing peptides identified in both innovator and biosimilar mAb samples Component Summary ©2011 Waters Corporation 66
Slide 67: Case Study 2
Case Study 2 ©2013 Waters Corporation 67
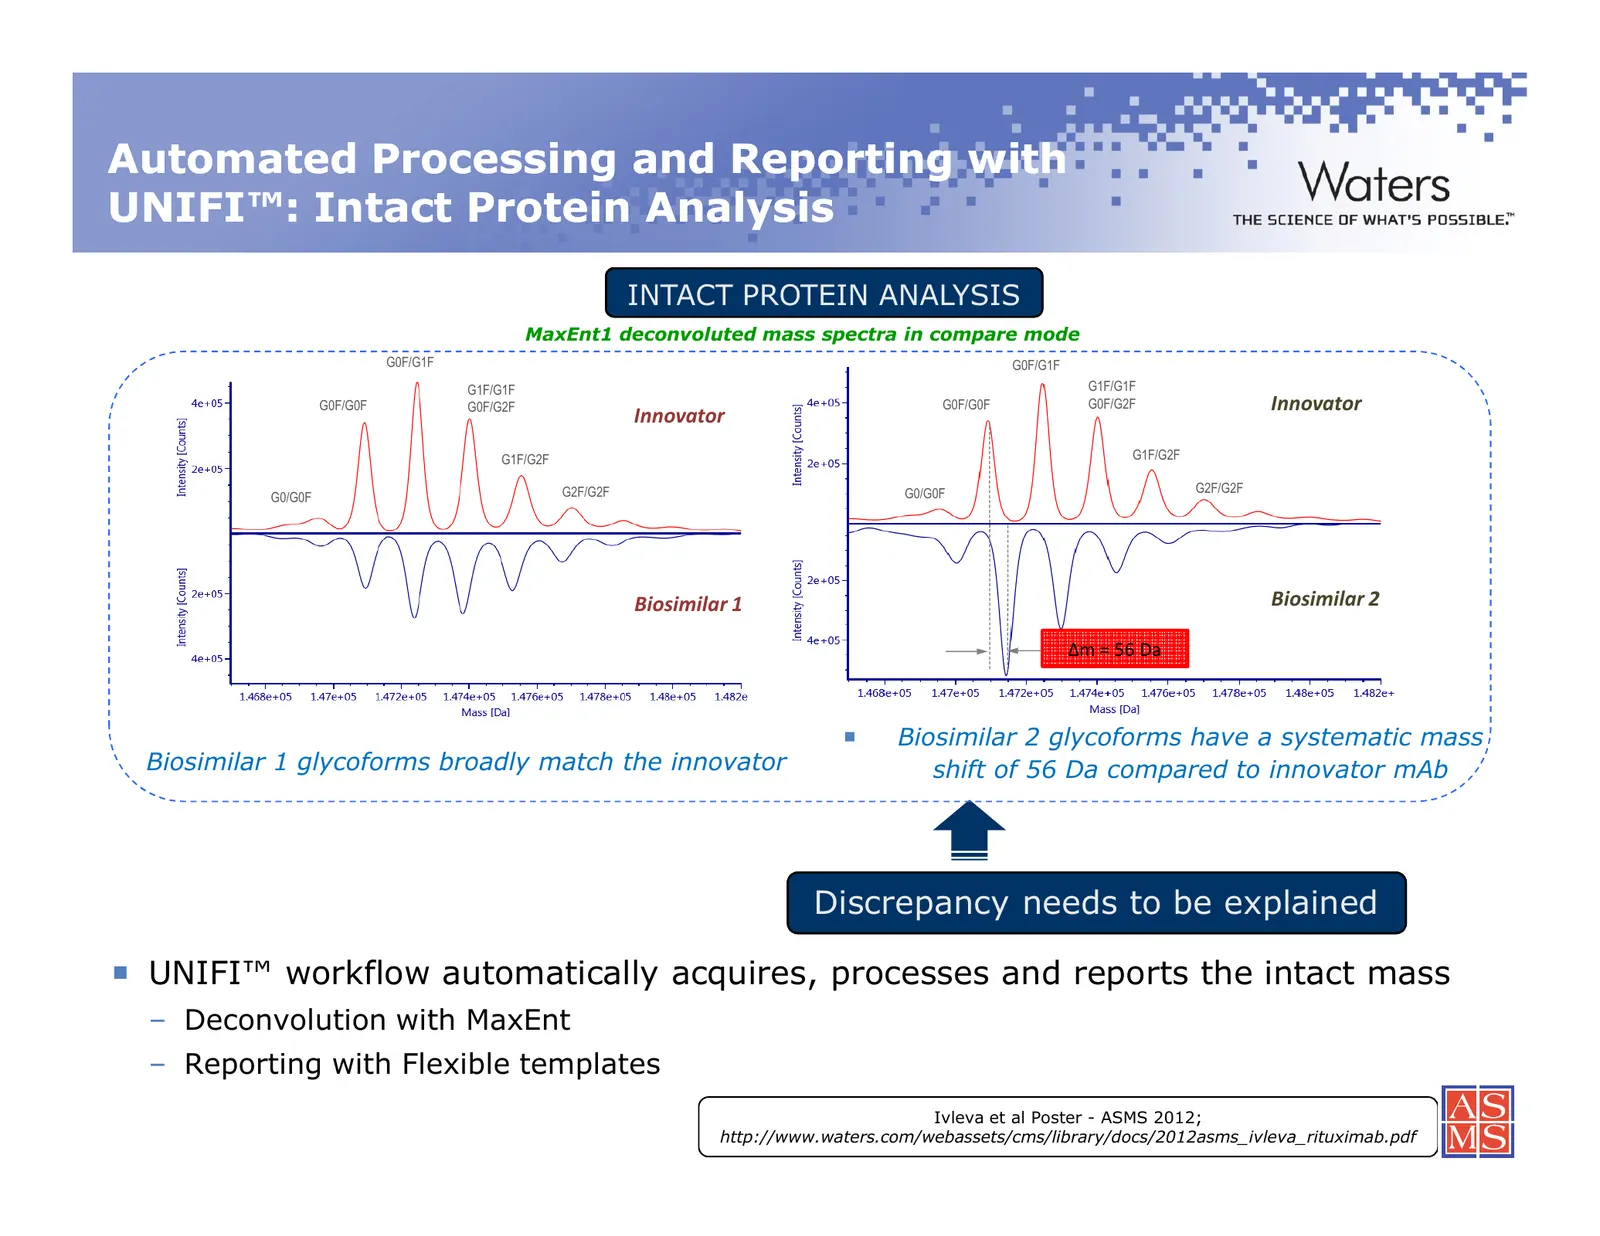
Slide 68: Automated Processing and Reporting with UNIFI: Intact Protein Analysis
Automated Processing and Reporting with UNIFI™: Intact Protein Analysis INTACT PROTEIN ANALYSIS MaxEnt1 deconvoluted mass spectra in compare mode G0F/G1F G0F/G1F G1F/G1F G1F/G1F G0F/G0F G0F/G2F G0F/G0F G0F/G2F Innovator Innovator G1F/G2F G1F/G2F G2F/G2F G0/G0F G2F/G2F G0/G0F Biosimilar 1 Biosimilar
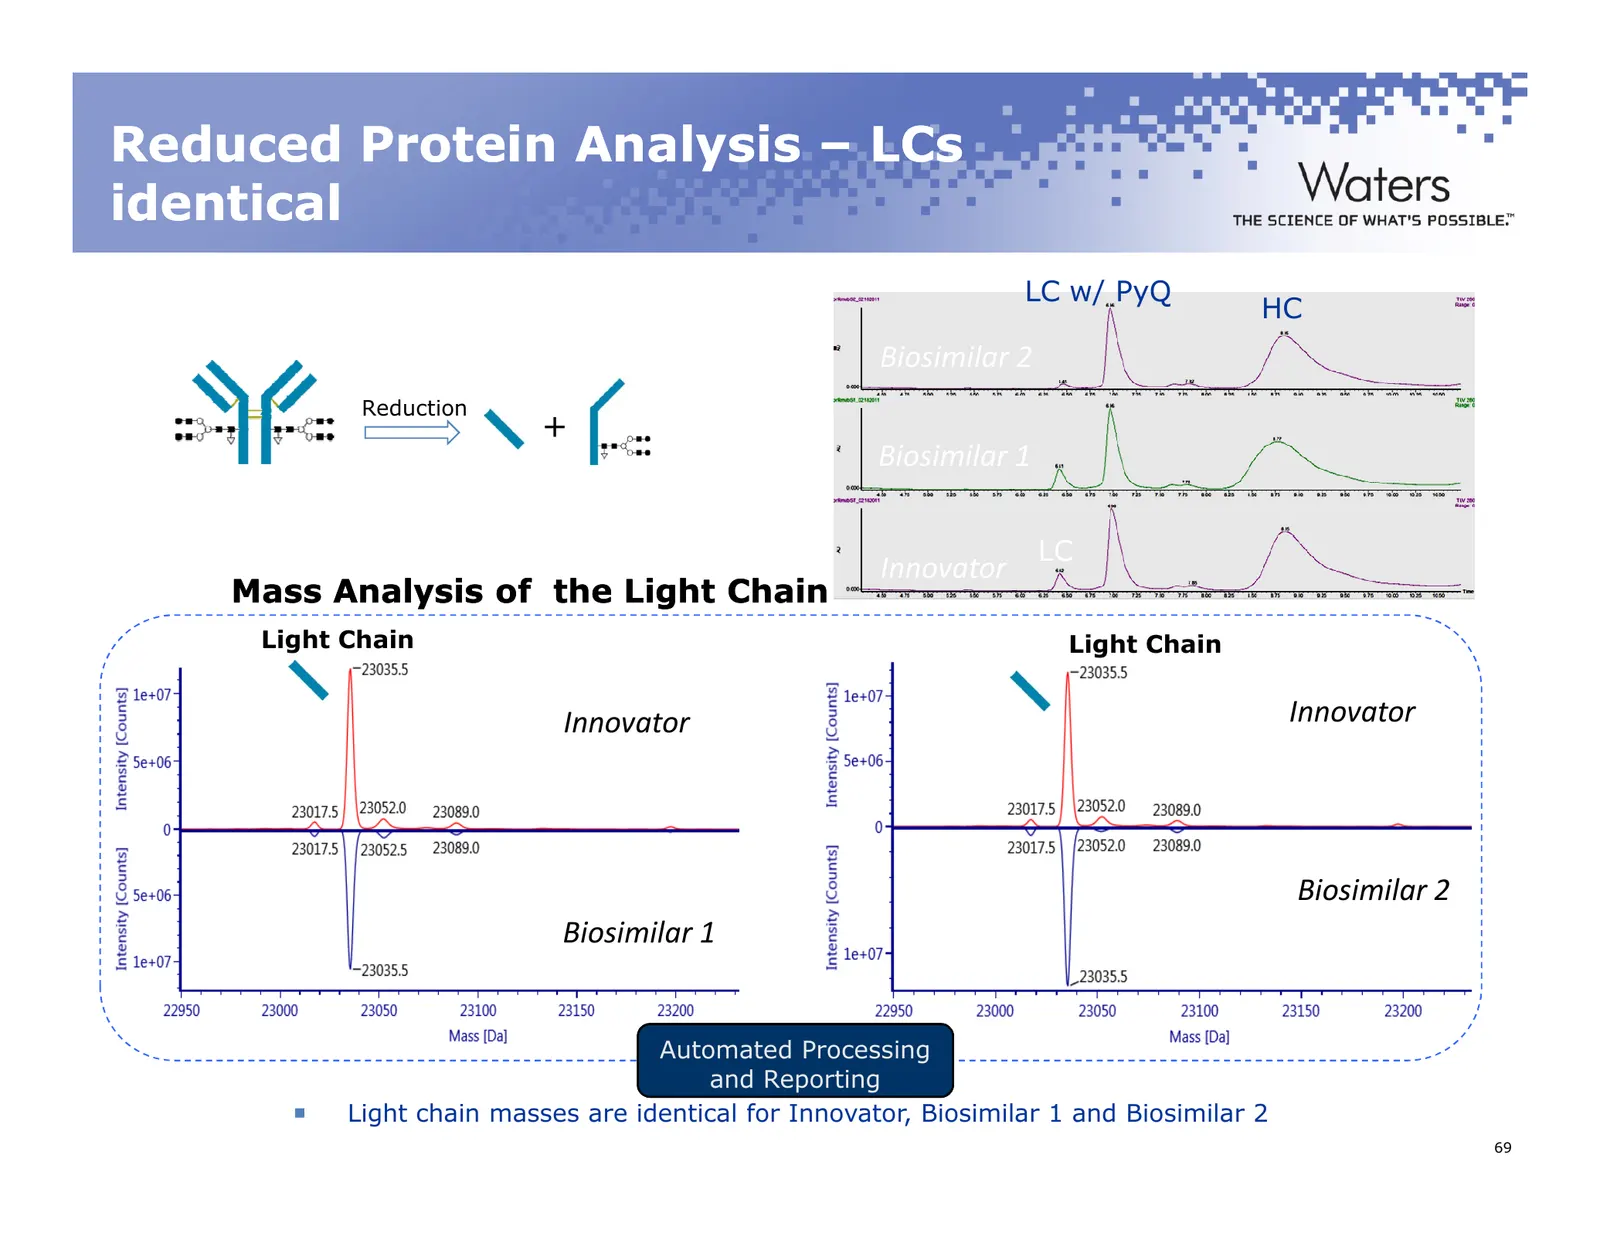
Slide 69: Reduced Protein Analysis – LCs identical
Reduced Protein Analysis – LCs identical LC w/ PyQ HC Biosimilar 2 Reduction + Biosimilar 1 LC Innovator Mass Analysis of the Light Chain Light Chain MaxEnt1 deconvoluted mass spectra in compare mode Light Chain Innovator Innovator Biosimilar 2 Biosimilar 1 Automated Processing and Reporting Light c
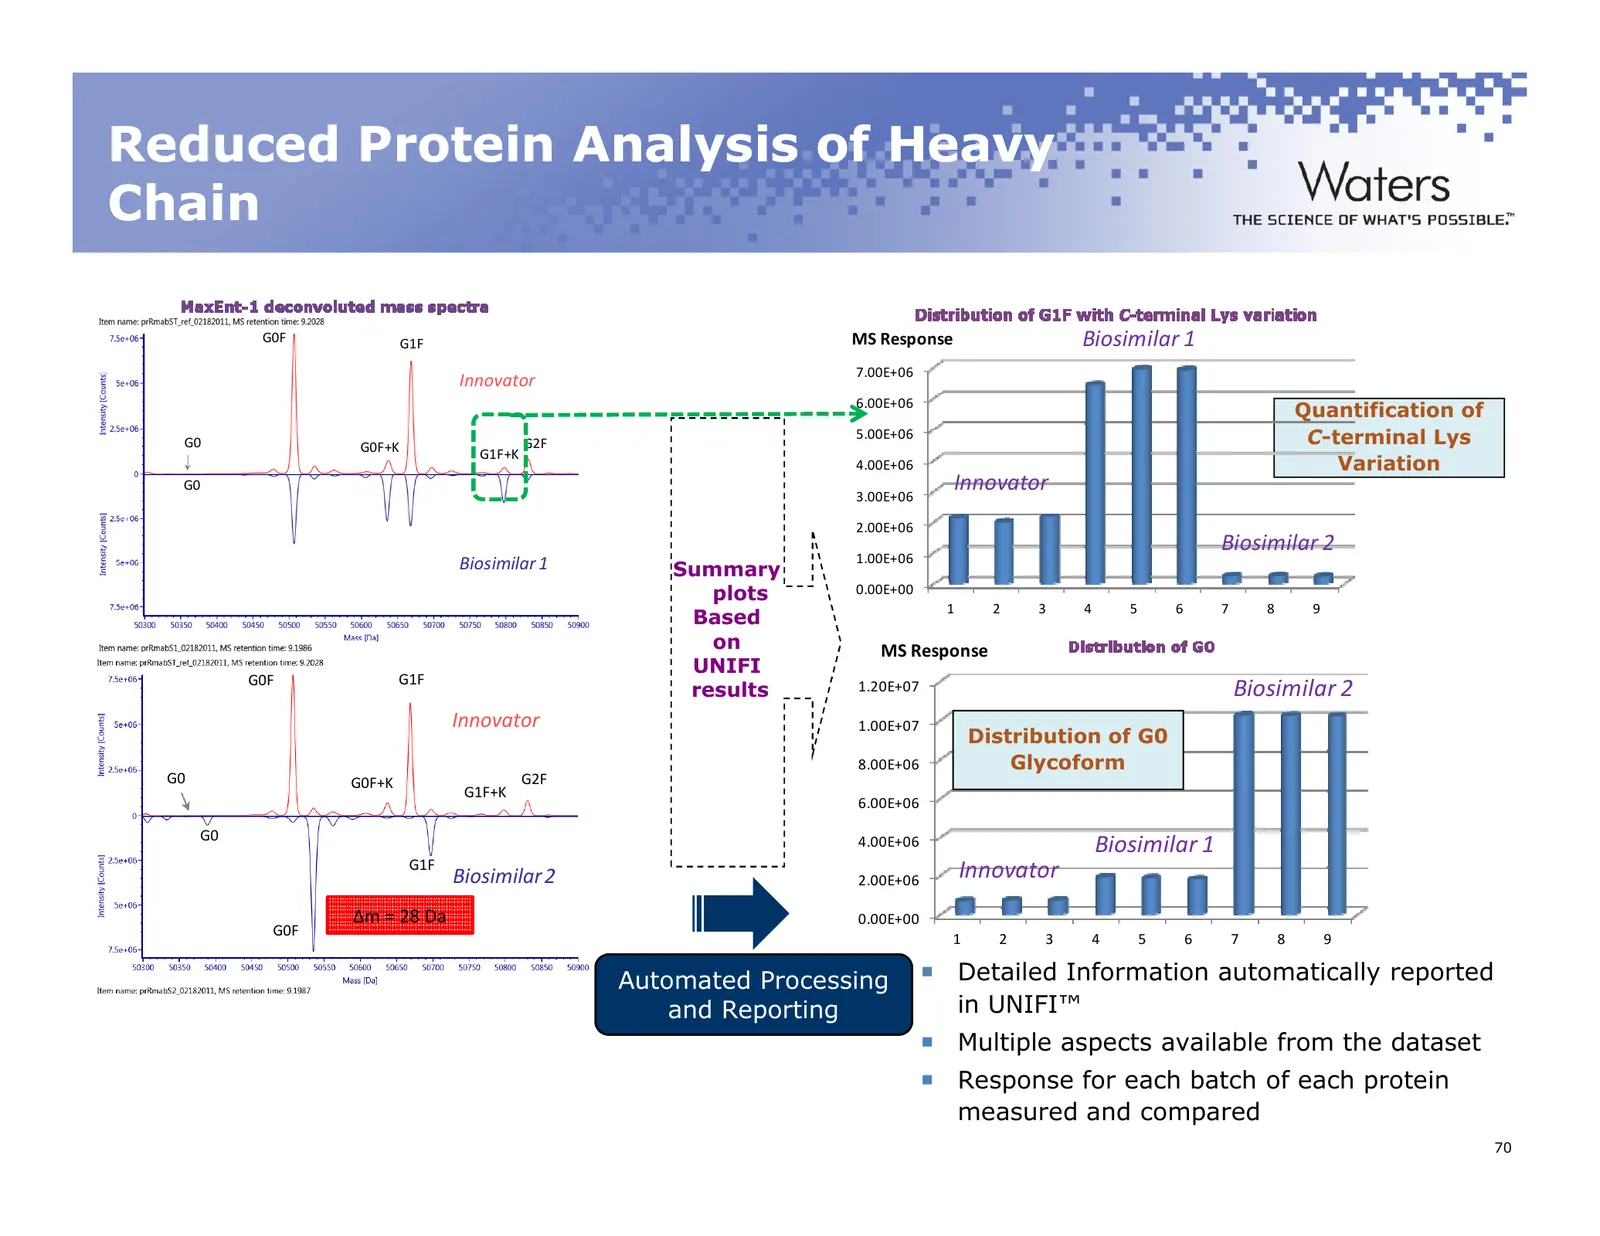
Slide 70: Reduced Protein Analysis of Heavy Chain
Reduced Protein Analysis of Heavy Chain G0F G1F MS Response Biosimilar 1 7.00E+06 Innovator 6.00E+06 Quantification of G0 G0F+K G2F 5.00E+06 C-terminal Lys G1F+K 4.00E+06 Variation G0 3.00E+06 Innovator 2.00E+06 Biosimilar 2 Biosimilar 1 1.00E+06 Summary plots 0.00E+00 1 2 3 4 5 6 7 8 9 Based on MS
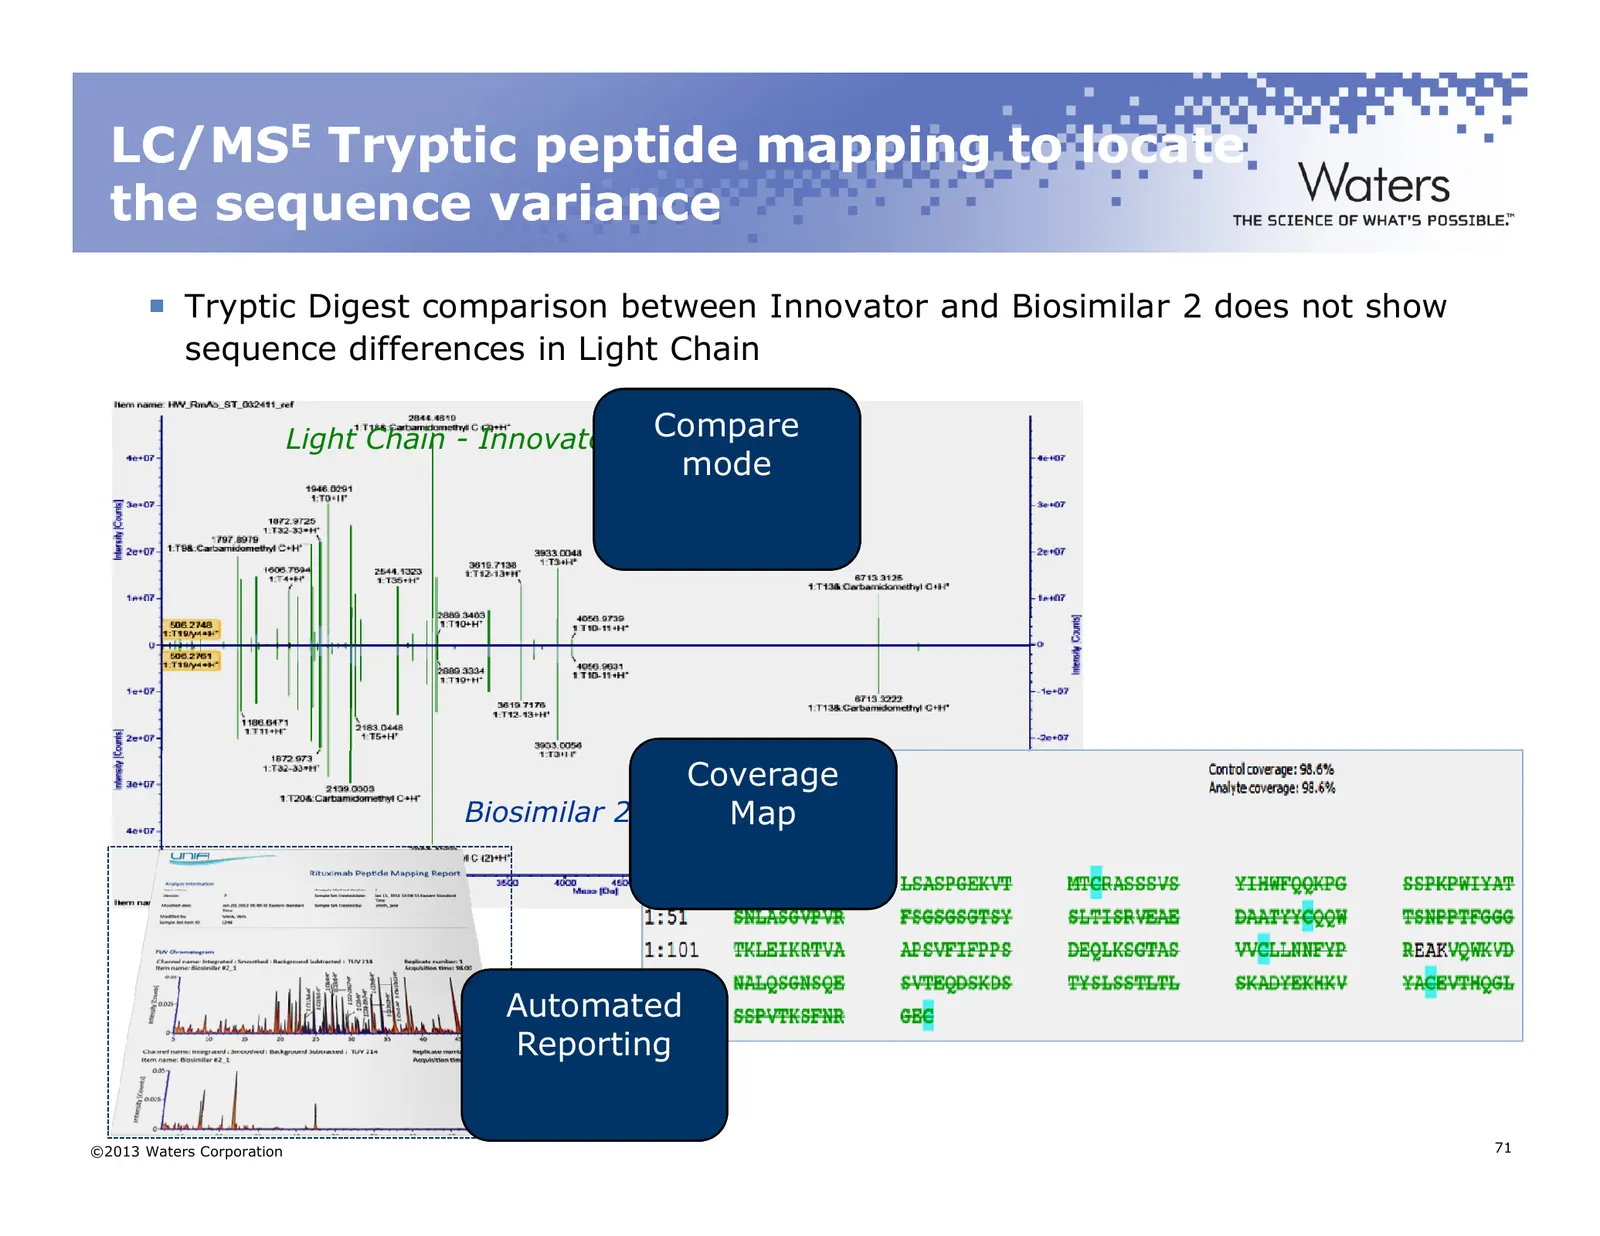
Slide 71: LC/MSE Tryptic peptide mapping to locate the sequence variance
LC/MSE Tryptic peptide mapping to locate the sequence variance Tryptic Digest comparison between Innovator and Biosimilar 2 does not show sequence differences in Light Chain Light Chain - Innovator Compare mode Coverage Biosimilar 2 Map Automated Reporting ©2013 Waters Corporation 71
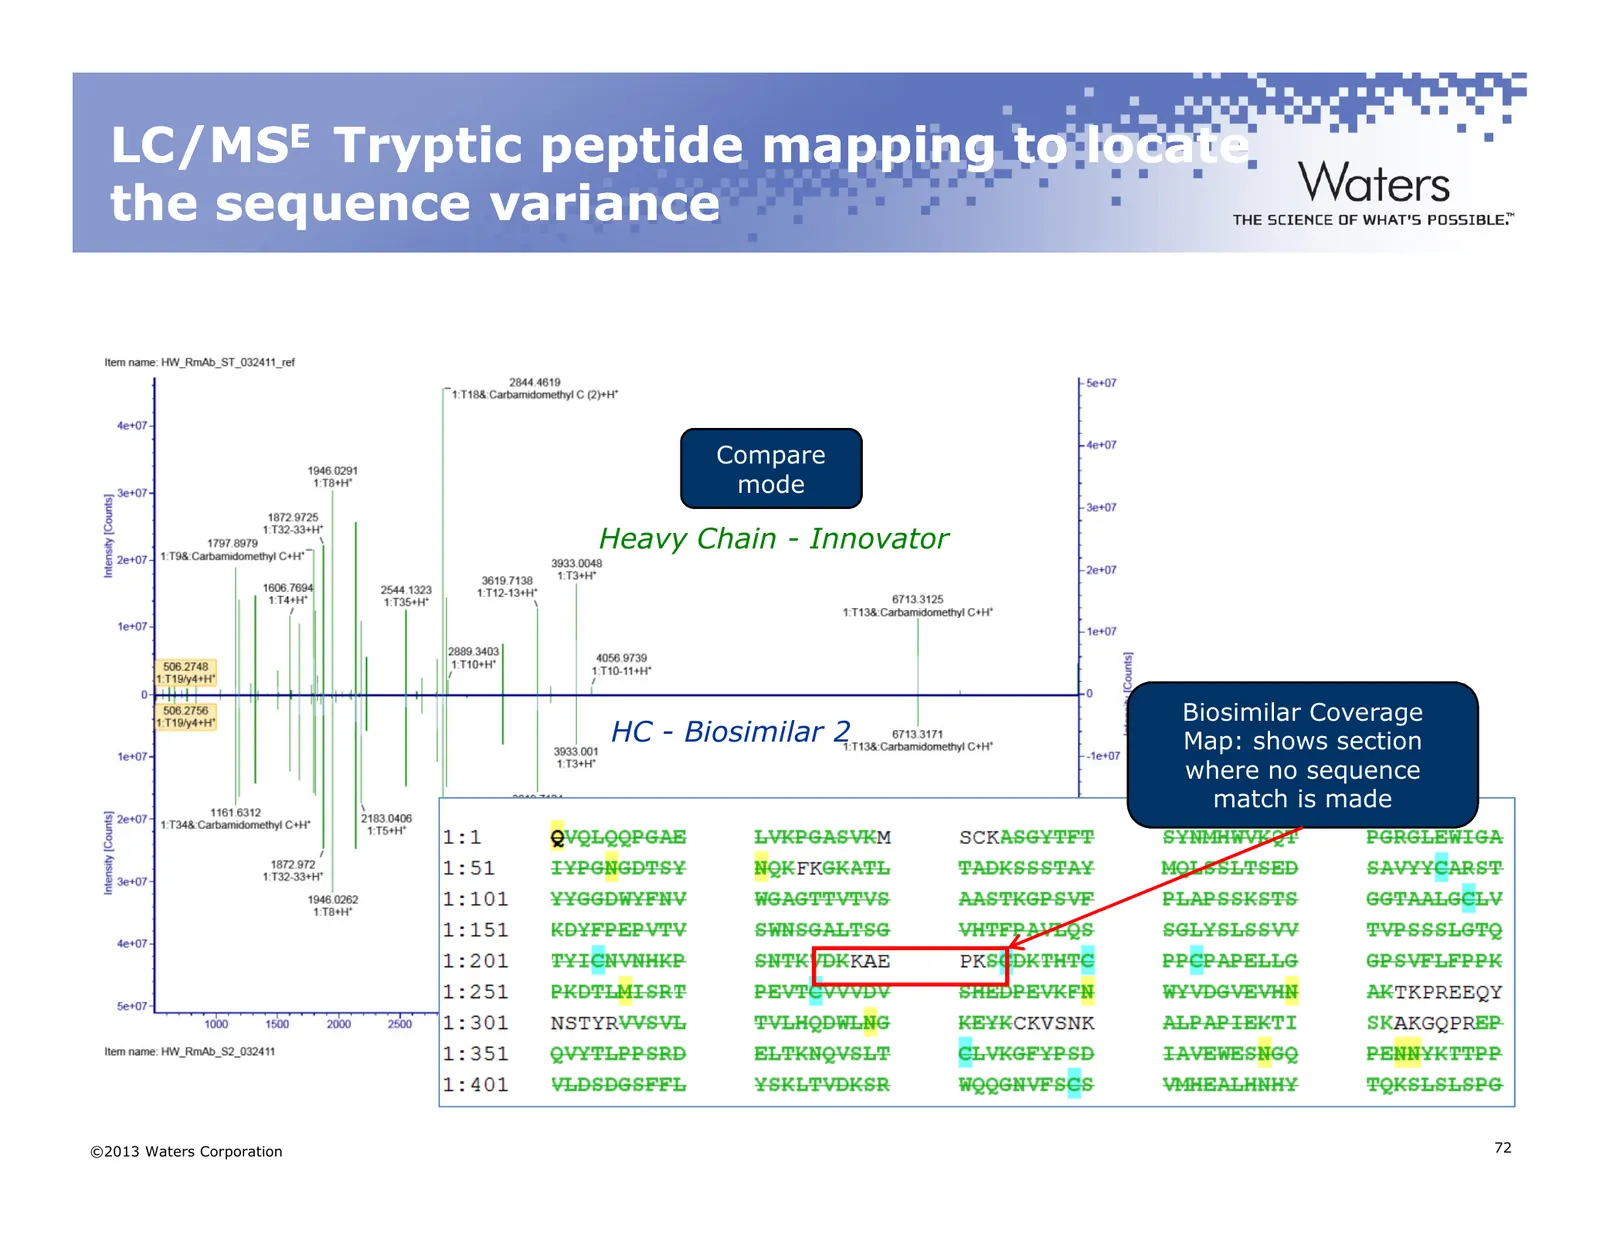
Slide 72: LC/MSE Tryptic peptide mapping to locate the sequence variance
LC/MSE Tryptic peptide mapping to locate the sequence variance Compare mode Heavy Chain - Innovator Biosimilar Coverage HC - Biosimilar 2 Map: shows section where no sequence match is made ©2013 Waters Corporation 72
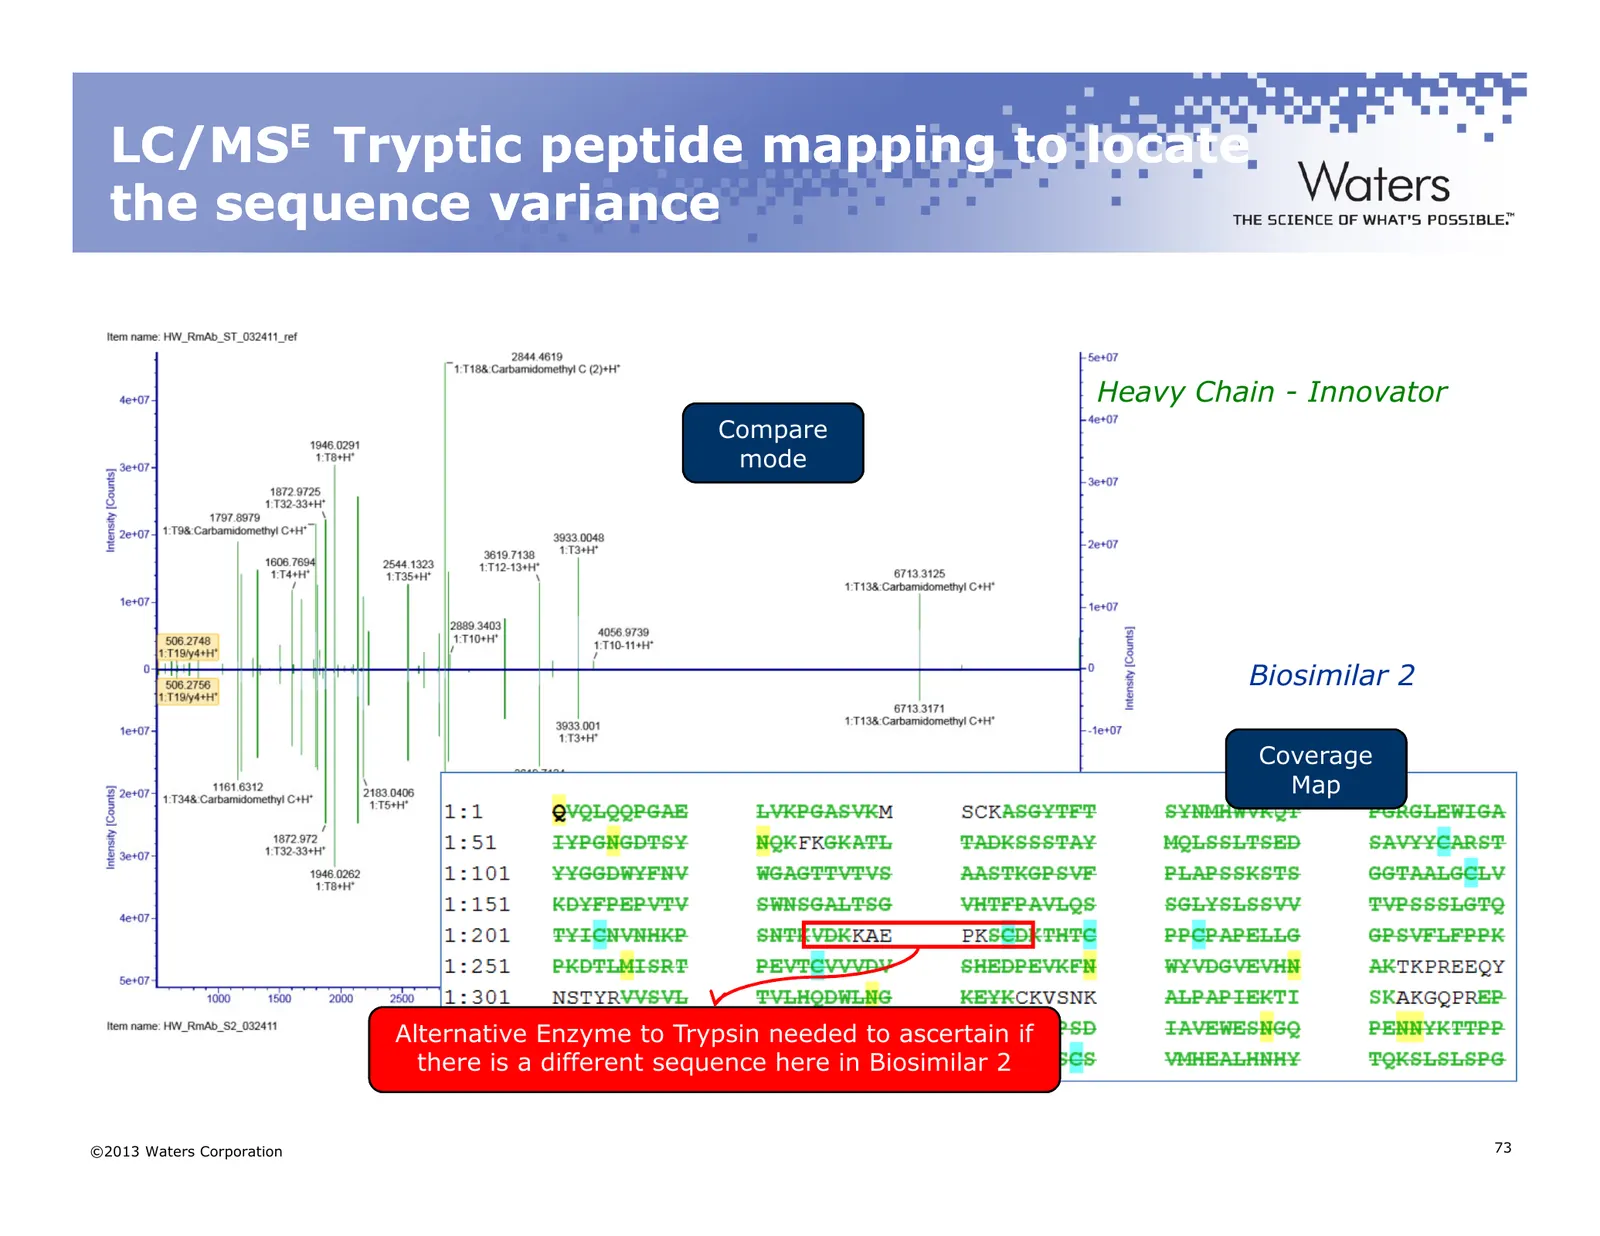
Slide 73: LC/MSE Tryptic peptide mapping to locate the sequence variance
LC/MSE Tryptic peptide mapping to locate the sequence variance Heavy Chain - Innovator Compare mode Biosimilar 2 Coverage Map Alternative Enzyme to Trypsin needed to ascertain if there is a different sequence here in Biosimilar 2 ©2013 Waters Corporation 73
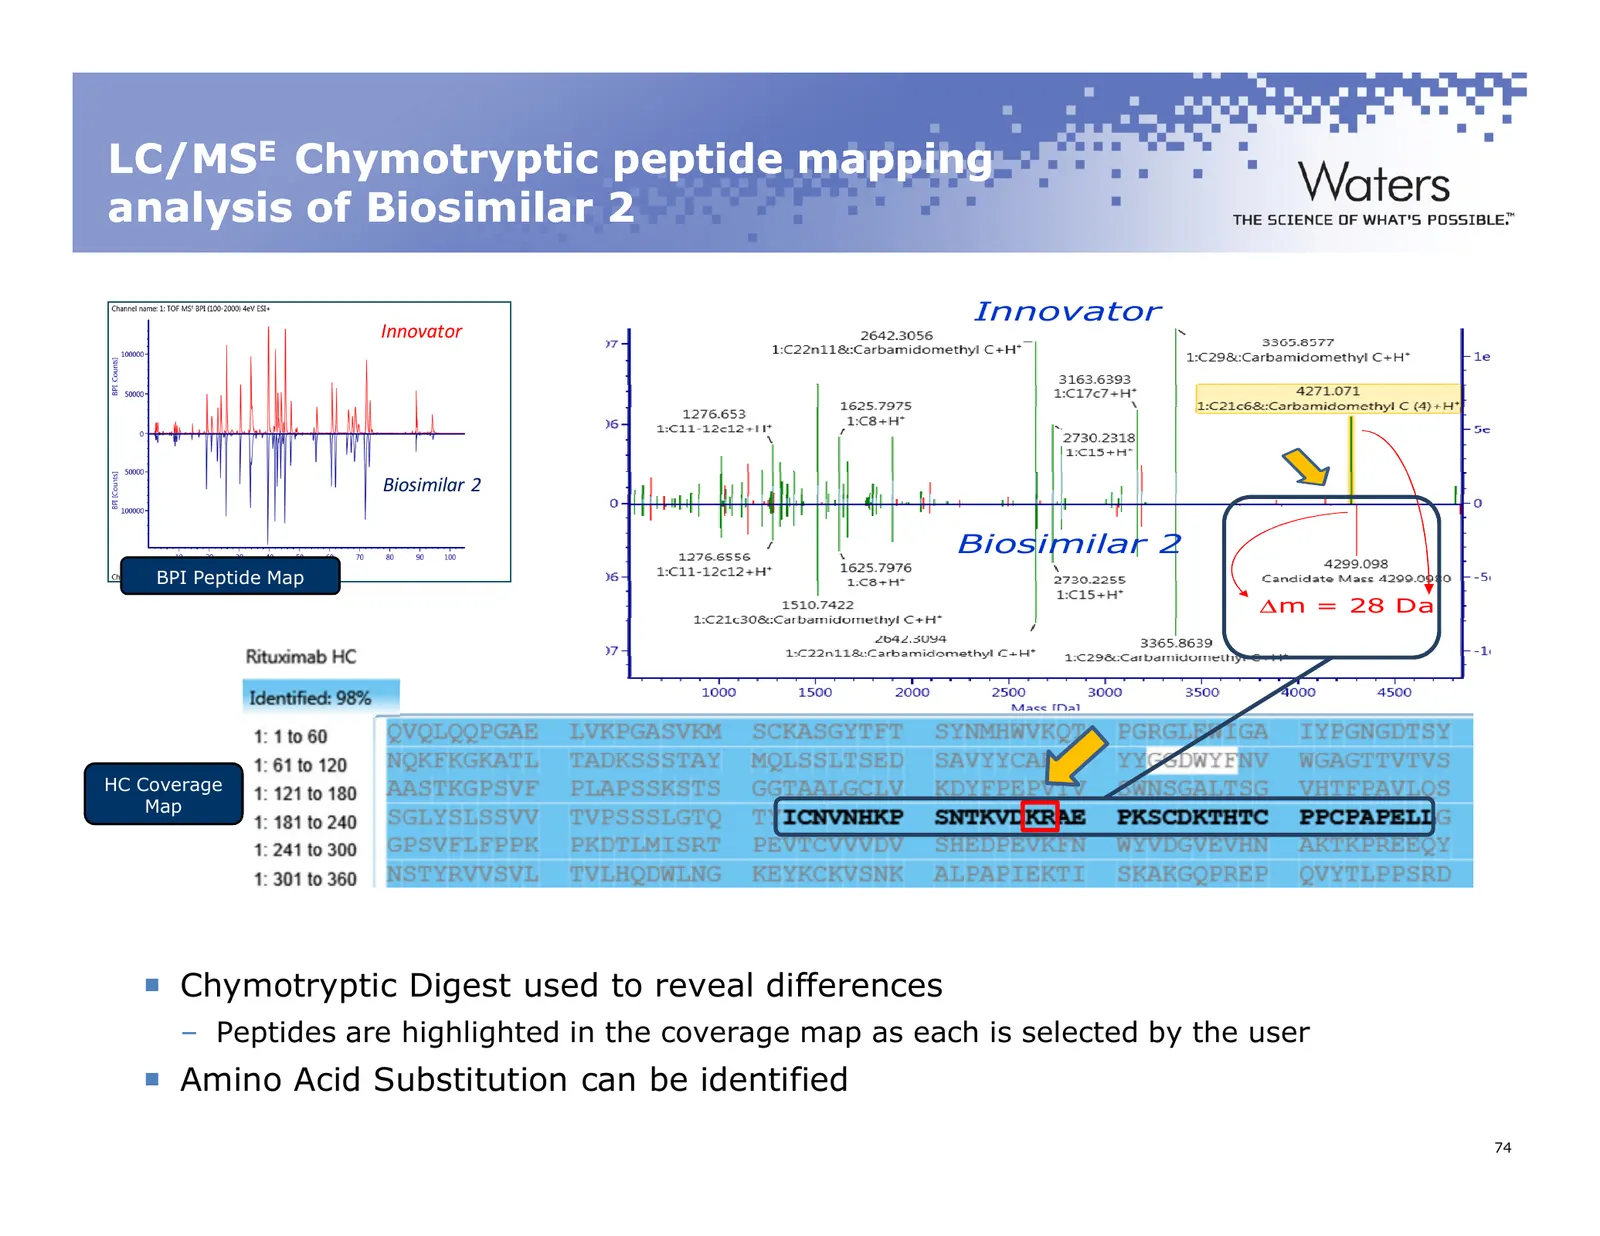
Slide 74: LC/MSE Chymotryptic peptide mapping analysis of Biosimilar 2
LC/MSE Chymotryptic peptide mapping analysis of Biosimilar 2 Innovator Innovator Biosimilar 2 Biosimilar 2 BPI Peptide Map ∆m = 28 Da HC Coverage Map Chymotryptic Digest used to reveal differences – Peptides are highlighted in the coverage map as each is selected by the user Amino Acid Substitution
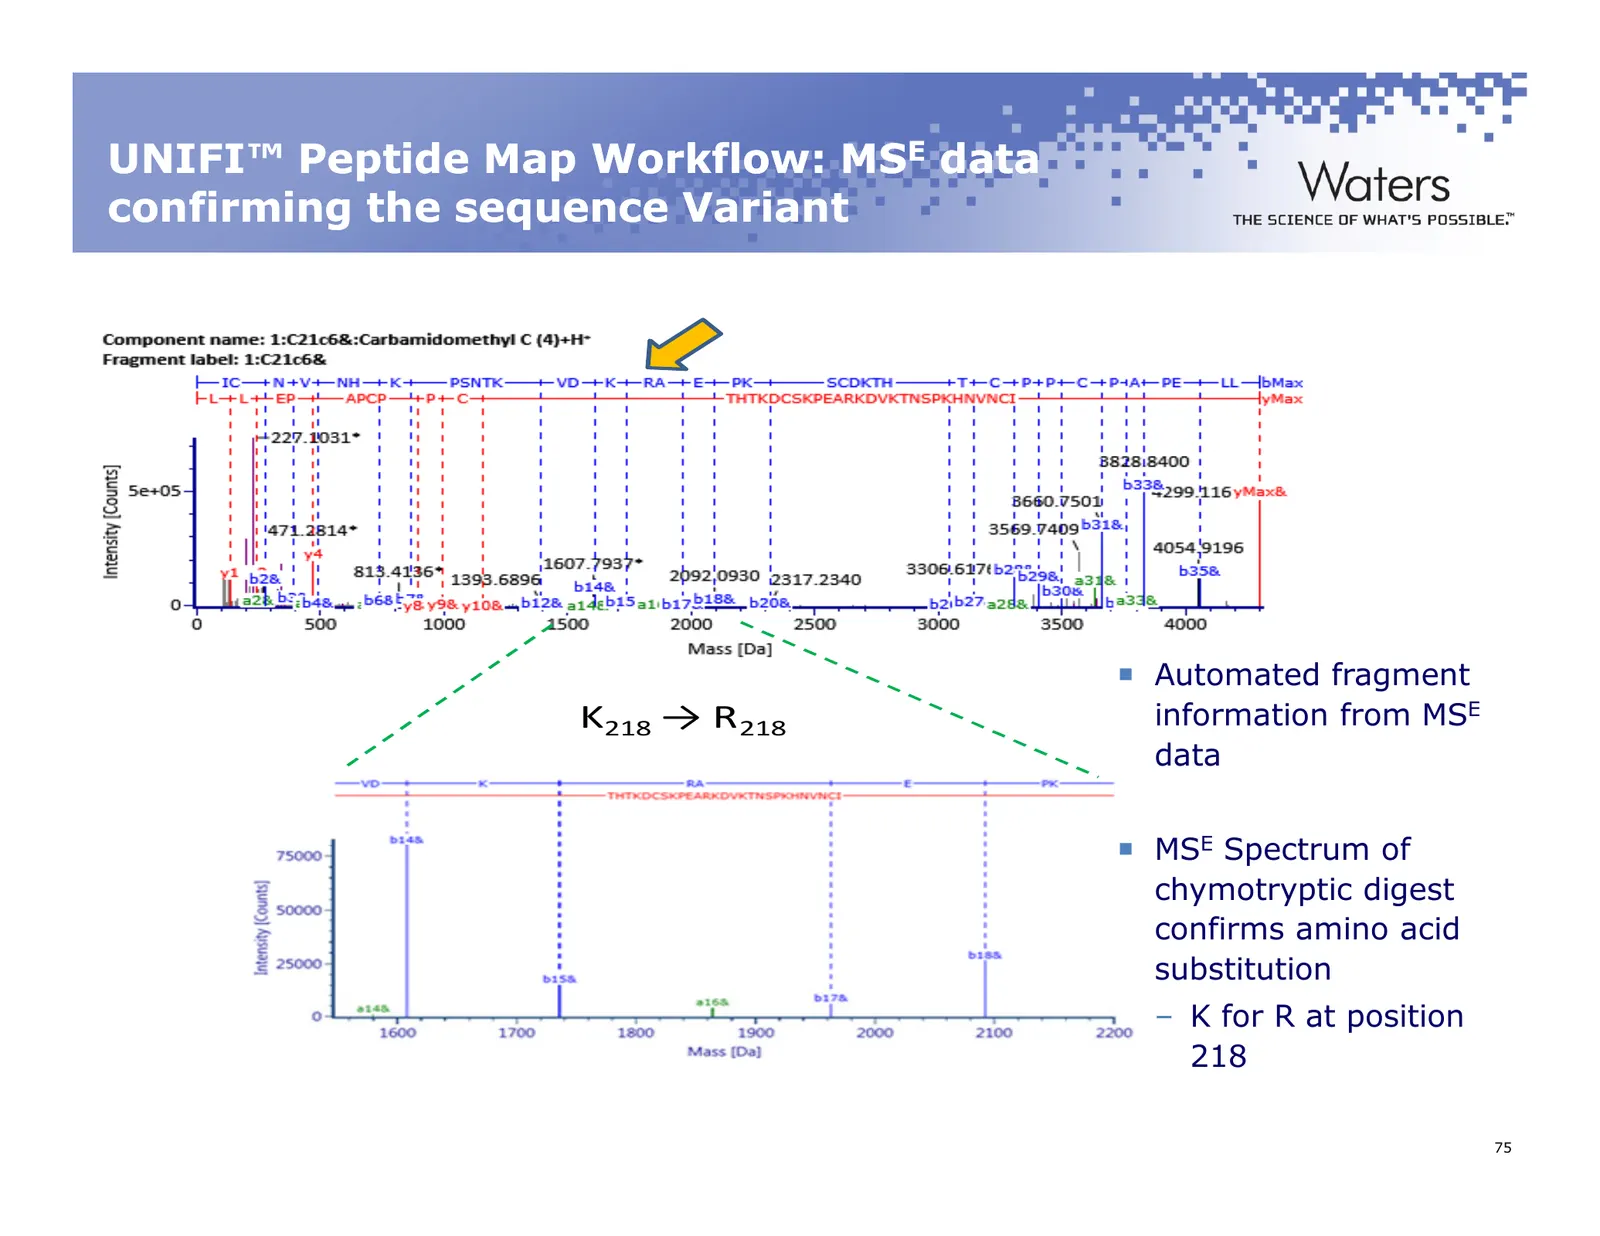
Slide 75: UNIFI Peptide Map Workflow: MSE data confirming the sequence Variant
UNIFI™ Peptide Map Workflow: MSE data confirming the sequence Variant Automated fragment K218 → R218 information from MSE data MSE Spectrum of chymotryptic digest confirms amino acid substitution – K for R at position 218 ©2011 Waters Corporation 75
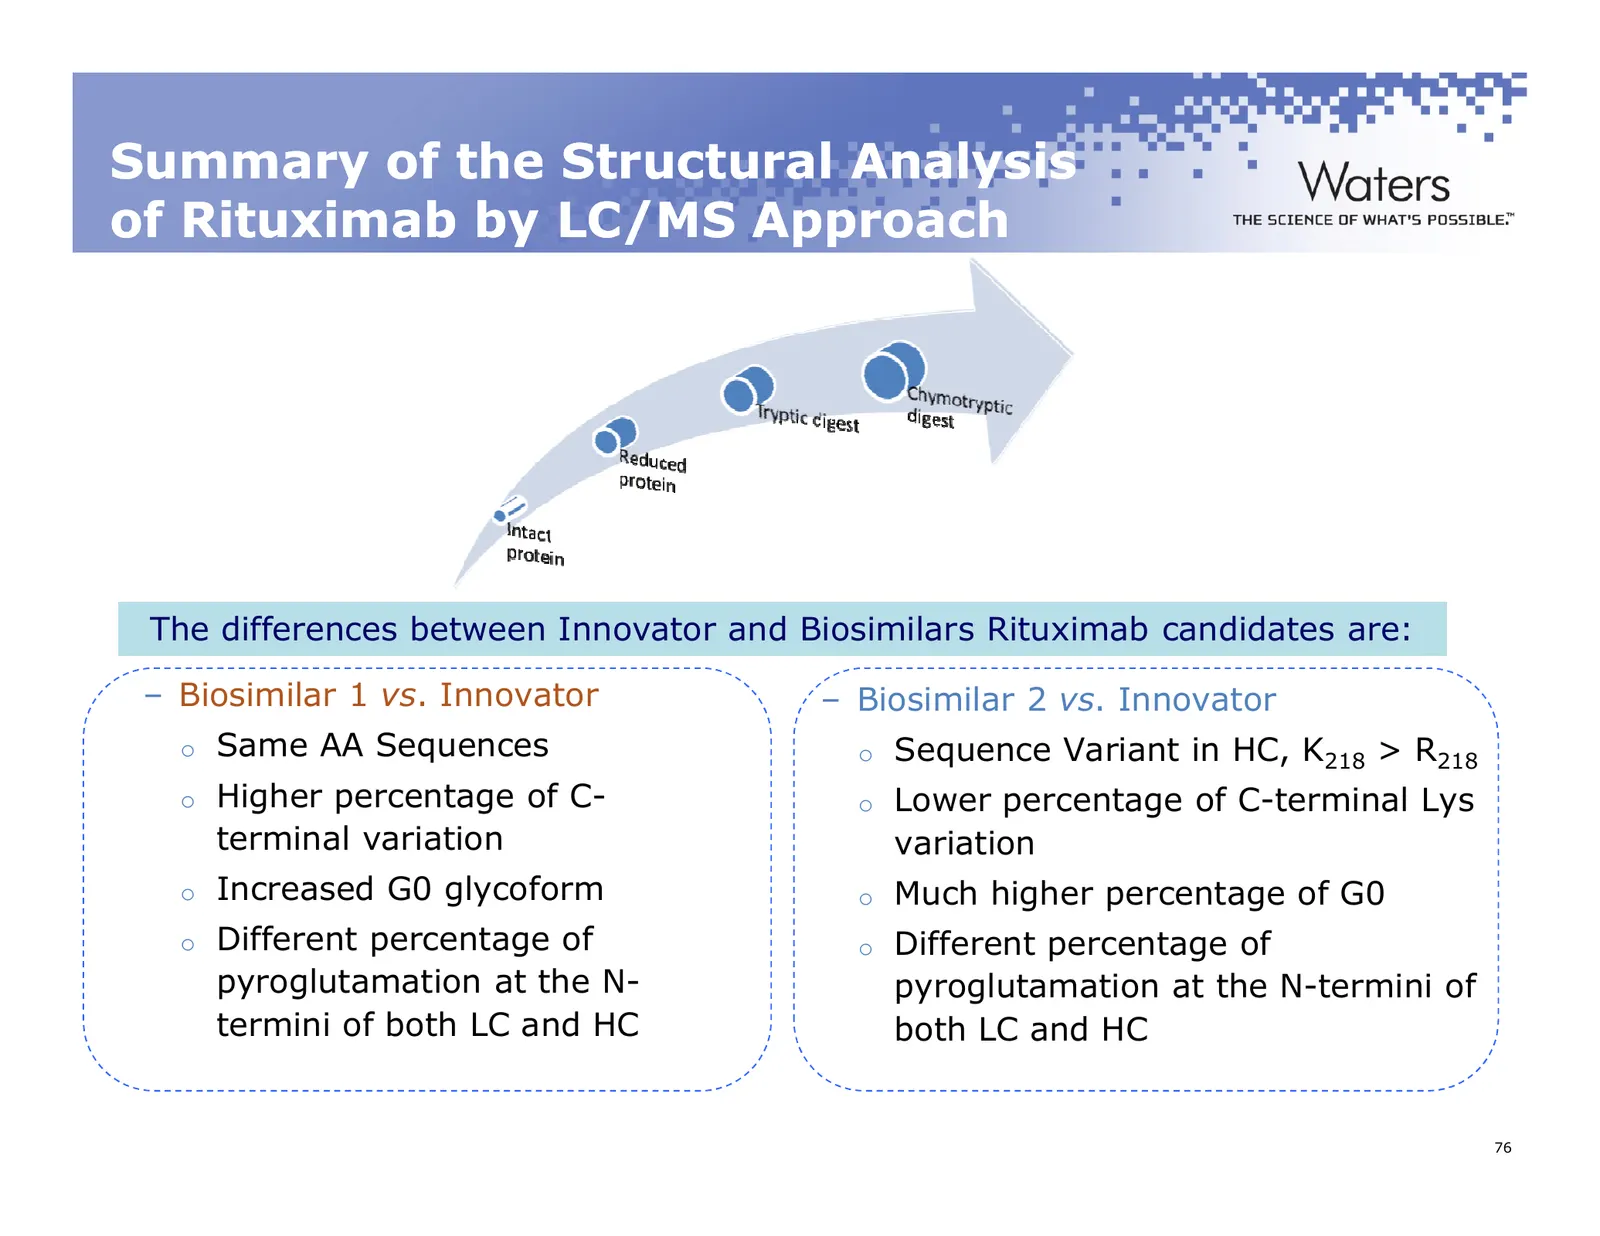
Slide 76: Summary of the Structural Analysis of Rituximab by LC/MS Approach
Summary of the Structural Analysis of Rituximab by LC/MS Approach The differences between Innovator and Biosimilars Rituximab candidates are: – Biosimilar 1 vs. Innovator – Biosimilar 2 vs. Innovator o Same AA Sequences o Sequence Variant in HC, K218 > R218 o Higher percentage of C- o Lower percenta
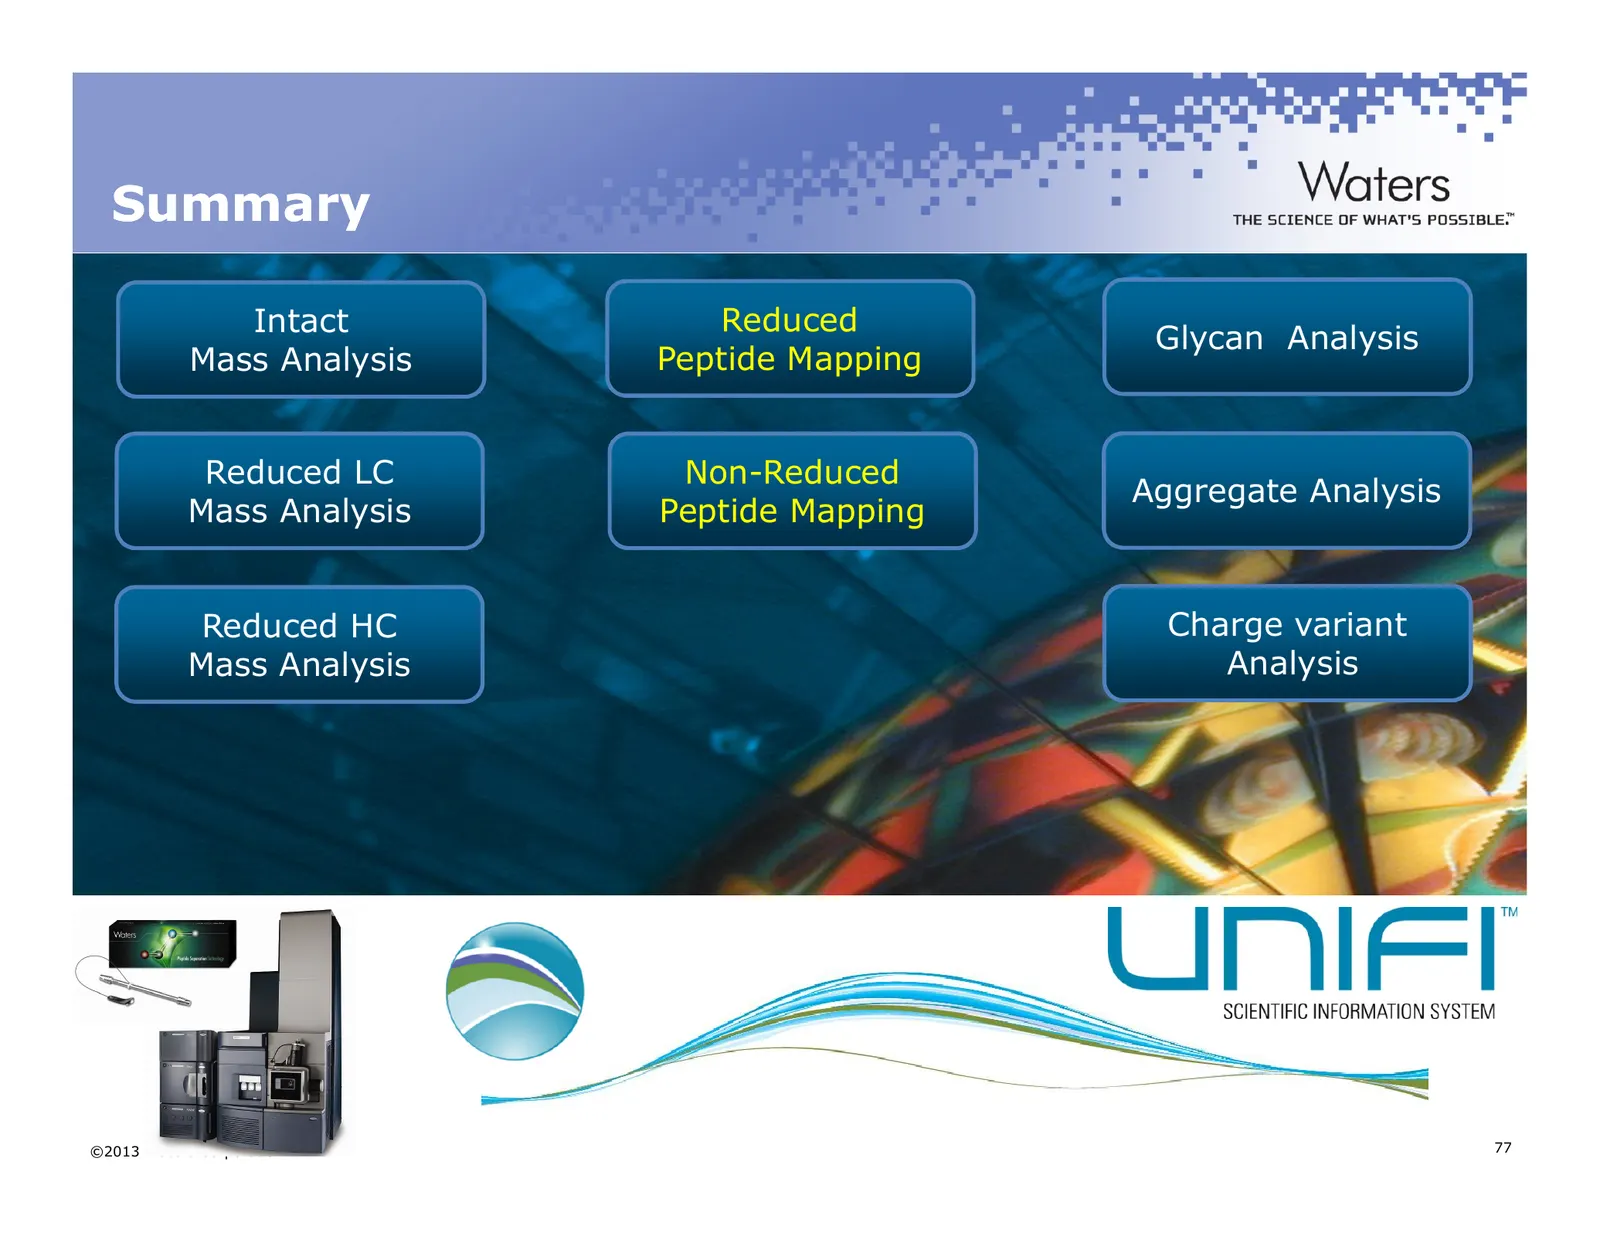
Slide 77: Summary
Summary Intact Reduced Glycan Analysis Mass Analysis Peptide Mapping Reduced LC Non-Reduced Aggregate Analysis Mass Analysis Peptide Mapping Reduced HC Charge variant Mass Analysis Analysis ©2013 Waters Corporation 77
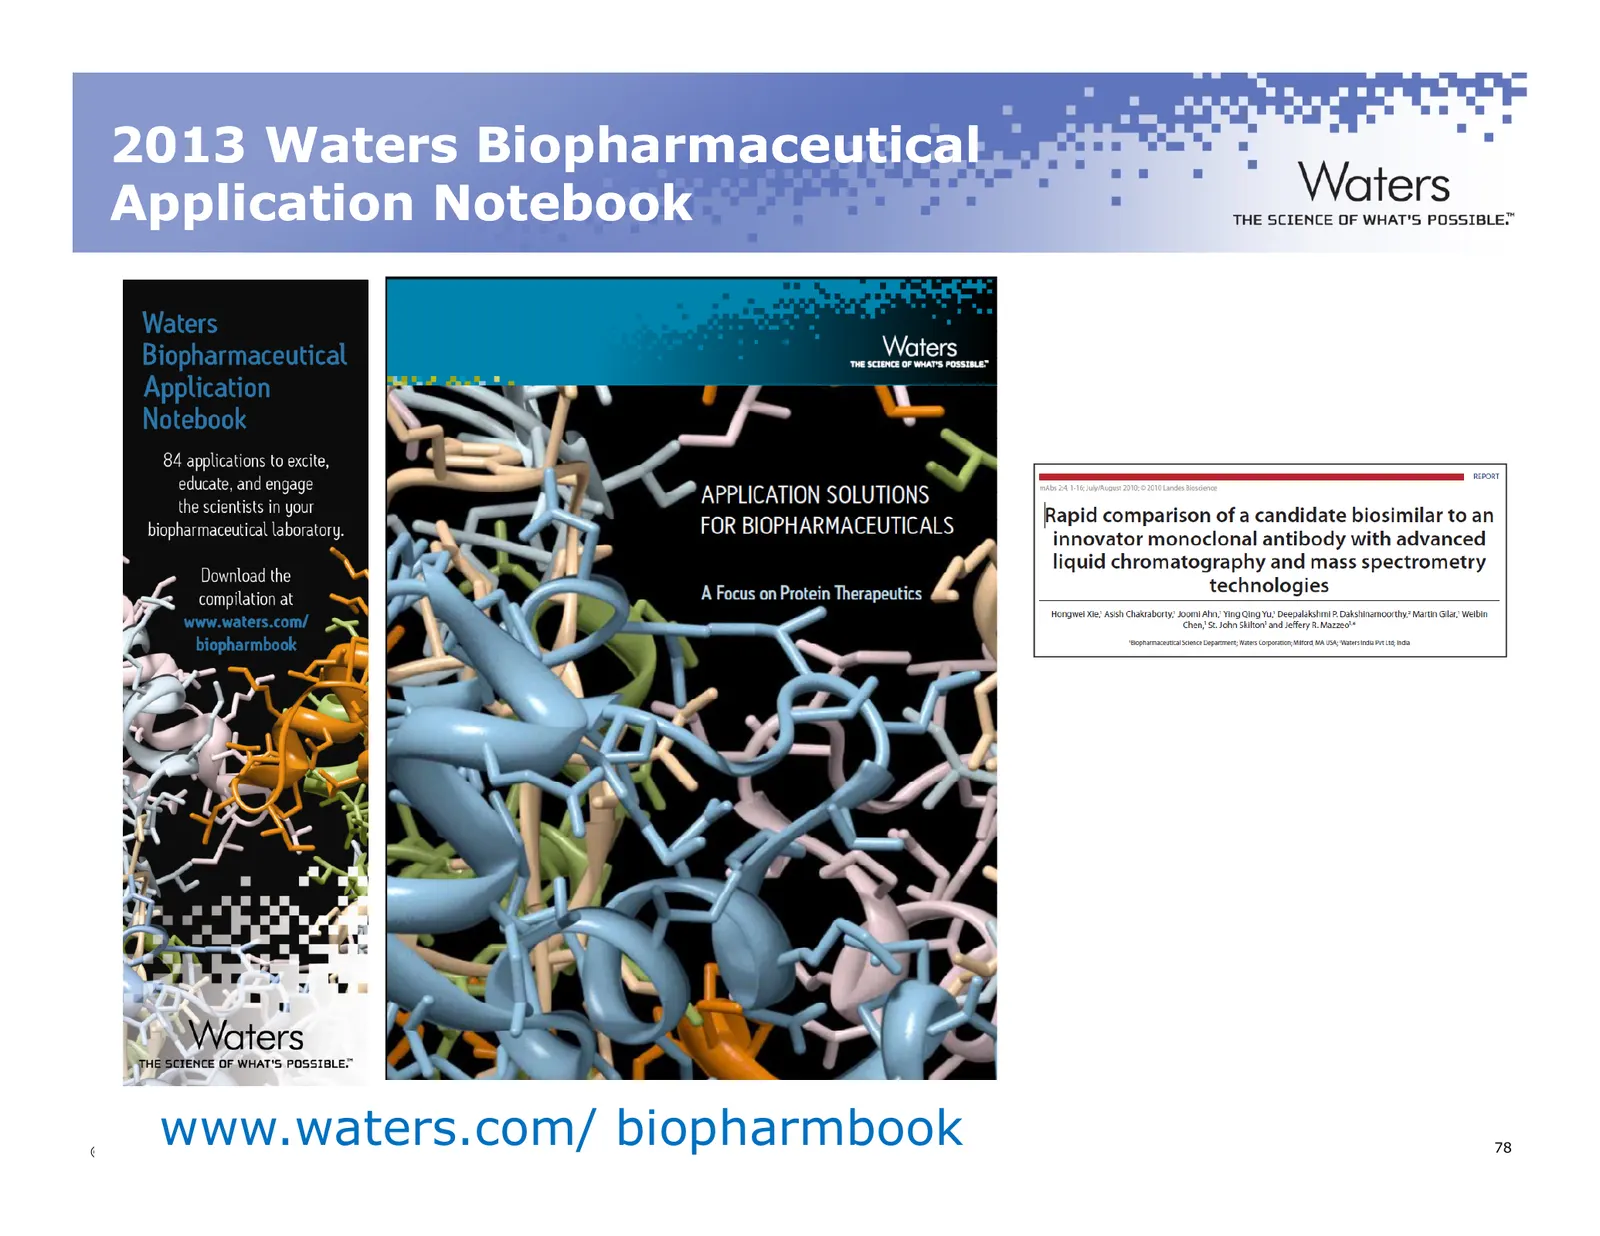
Slide 78: 2013 Waters Biopharmaceutical Application Notebook
2013 Waters Biopharmaceutical Application Notebook www.waters.com/ biopharmbook ©2013 Waters Corporation 78
Slide 79: Thank You! Questions?
Thank You! Questions? Landing Page…http://www.waters.com/AUG20 – Promotional Discount Offers on Peptide Separation Columns – PDF Slide Deck – Full Webinar Recording of Today’s Session – Compilation of Literature, White Papers, Brochures General Questions – eMail: mychemrep@waters.com ©2013 Waters Co
Source: Internet Archive copy of waters.com
More decks from Waters Corporation
 Q3 2026 Earnings Presentation30 slides · Nov 3, 2026
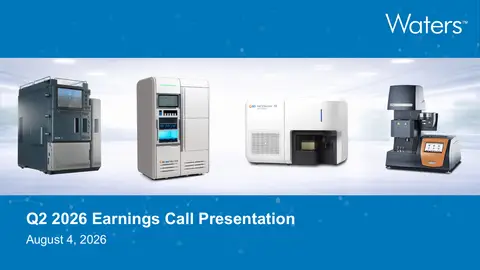 Q2 2026 Earnings Presentation33 slides · Aug 4, 2026
 Q1 2026 Earnings Presentation29 slides · May 5, 2026
 Q4 2025 Earnings Presentation22 slides · Feb 9, 2026
 J.P. Morgan 44th Annual Healthcare Conference (January 2026)29 slides · Jan 12, 2026
 J.P. Morgan 43rd Annual Healthcare Conference (November 2025)38 slides · Nov 11, 2025