Northern Tier Energy LP — Q2 2013 Earnings Presentation
10 slides from Northern Tier Energy LP's earnings presentation, Aug 13, 2013
Slide 1: Second Quarter 2013 Earnings Conference Call and Webcast
Exhibit 99.2 Second Quarter 2013 Earnings Conference Call and Webcast August 13, 2013
Slide 2: Forward Looking Statements
Forward Looking Statements This presentation includes “forward-looking statements.” The words “believe,” “expect,” “anticipate,” “plan,” “intend,” “foresee,” “should,” “would,” “could,” “attempt,” “appears,” “forecast,” “outlook,” “estimate,” “project,” “potential,” “may,” “will,” “are likely” or ot
Slide 3: Q2 2013 Financial Results; Select Balance Sheet & Cash Flow Data
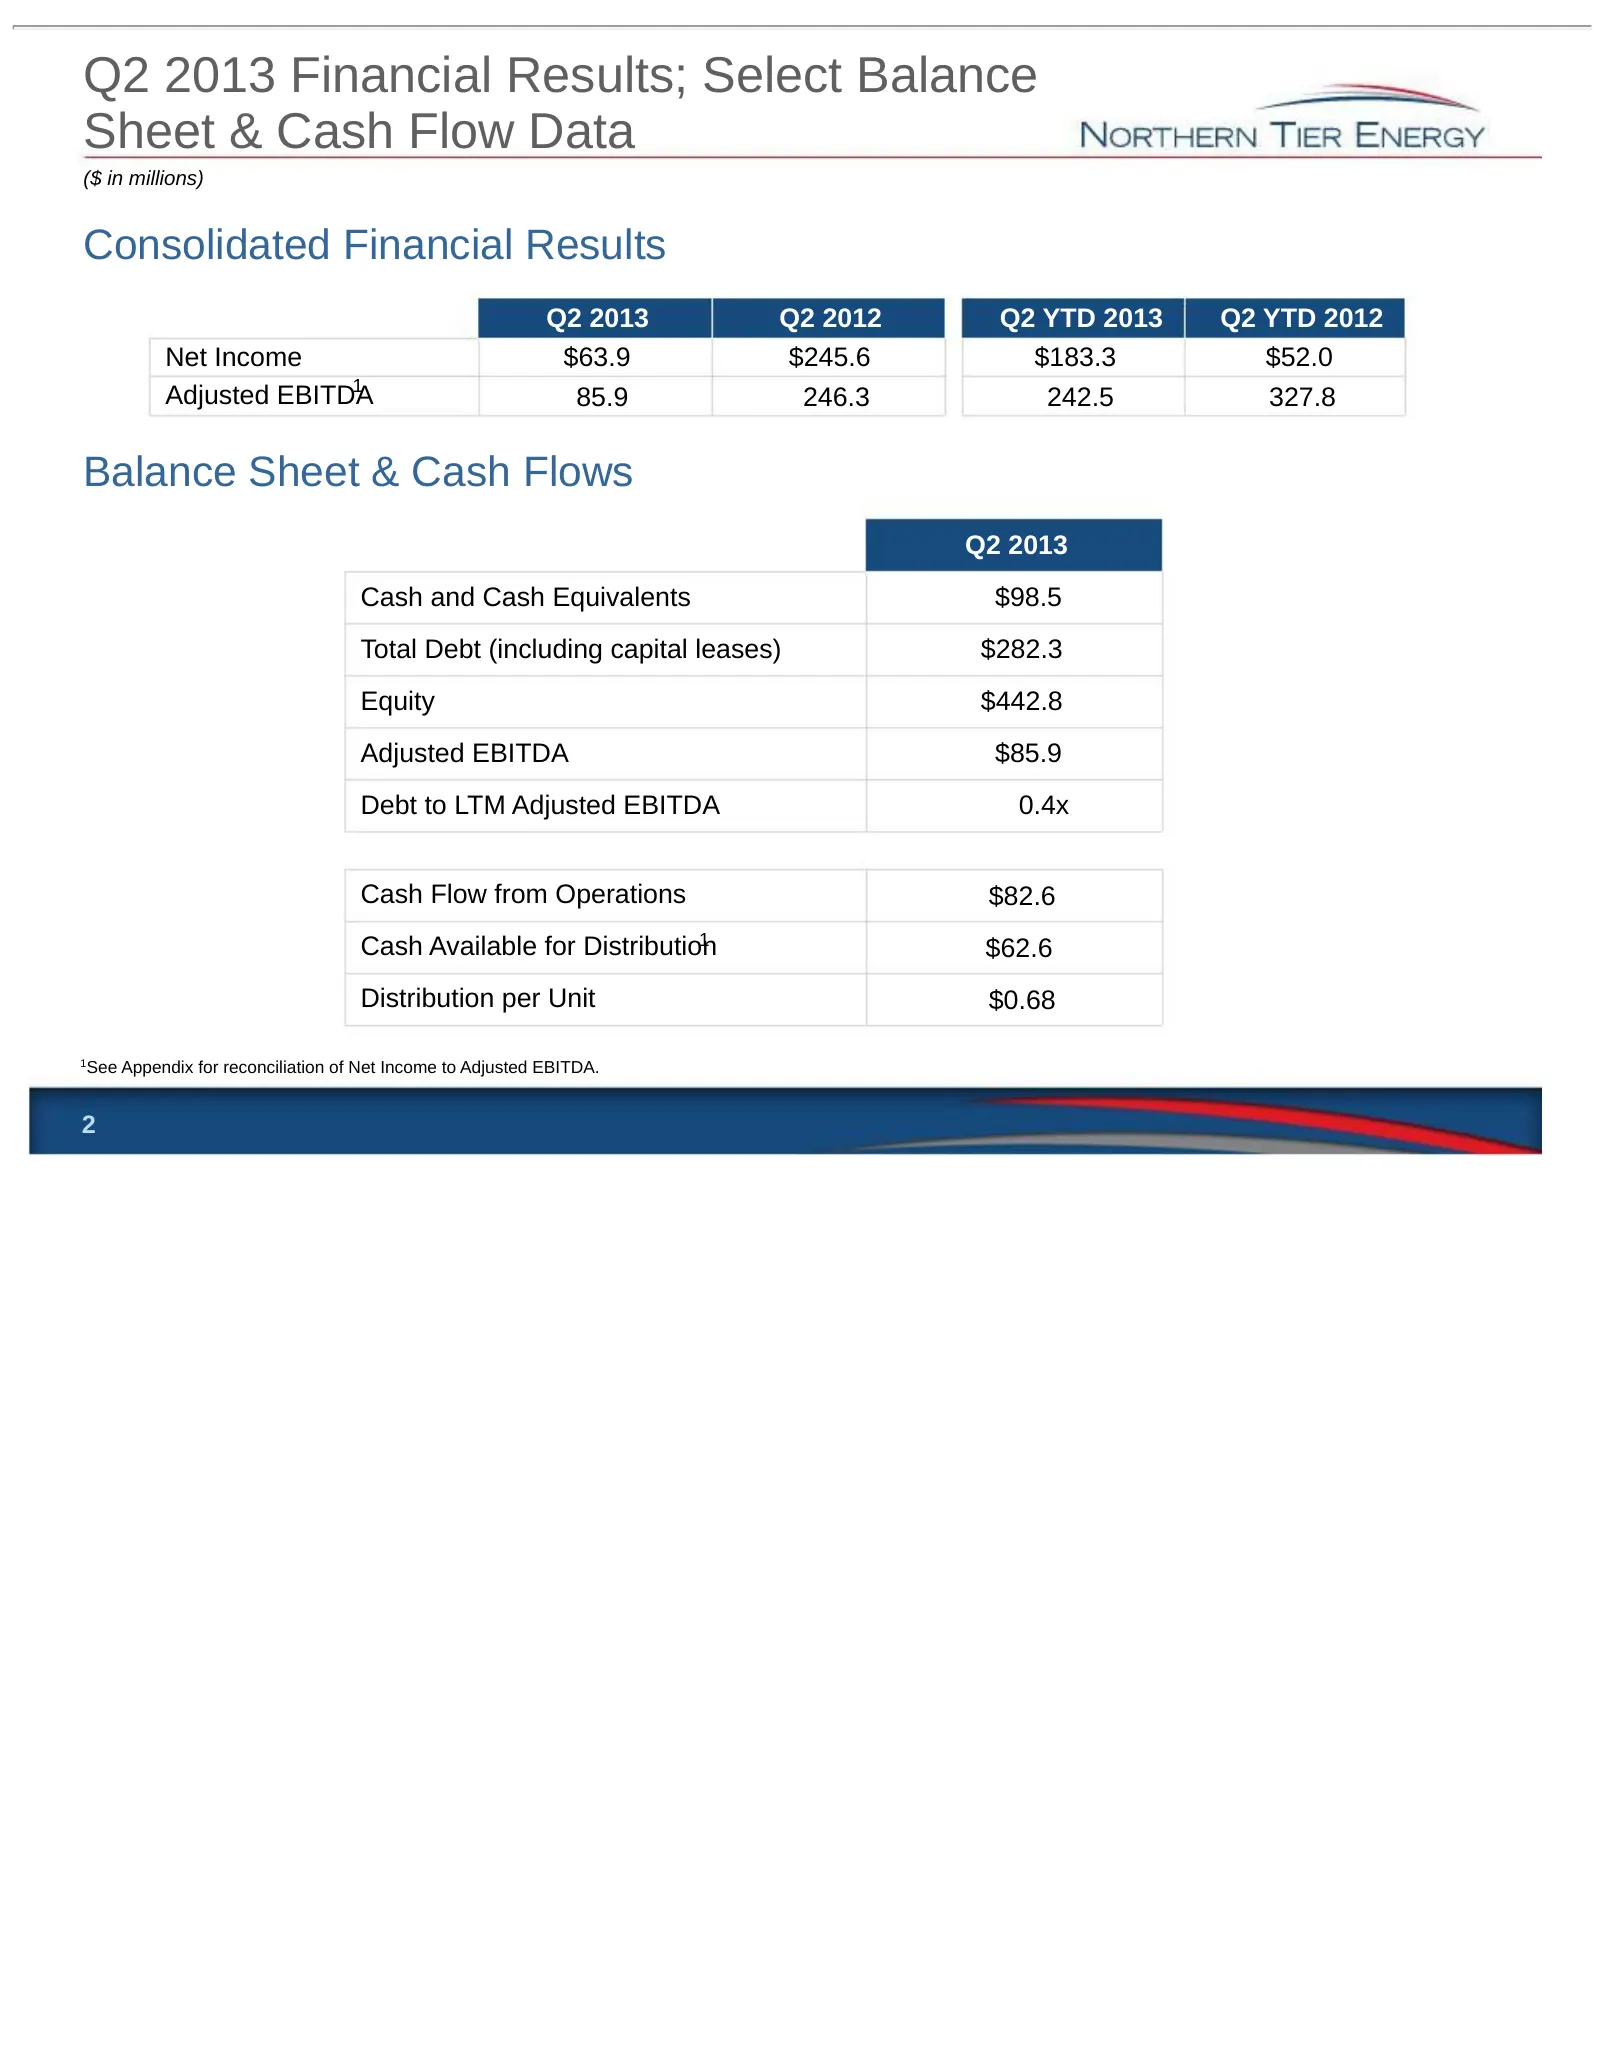
Q2 2013 Financial Results; Select Balance Sheet & Cash Flow Data ($ in millions) Consolidated Financial Results Q2 2013 Q2 2012 Q2 YTD 2013 Q2 YTD 2012 Net Income $63.9 $245.6 $183.3 $52.0 1 Adjusted EBITDA 85.9 246.3 242.5 327.8 Balance Sheet & Cash Flows Q2 2013 Cash and Cash Equivalents $98.5 Tot
Slide 4: Key Refining Performance Metrics
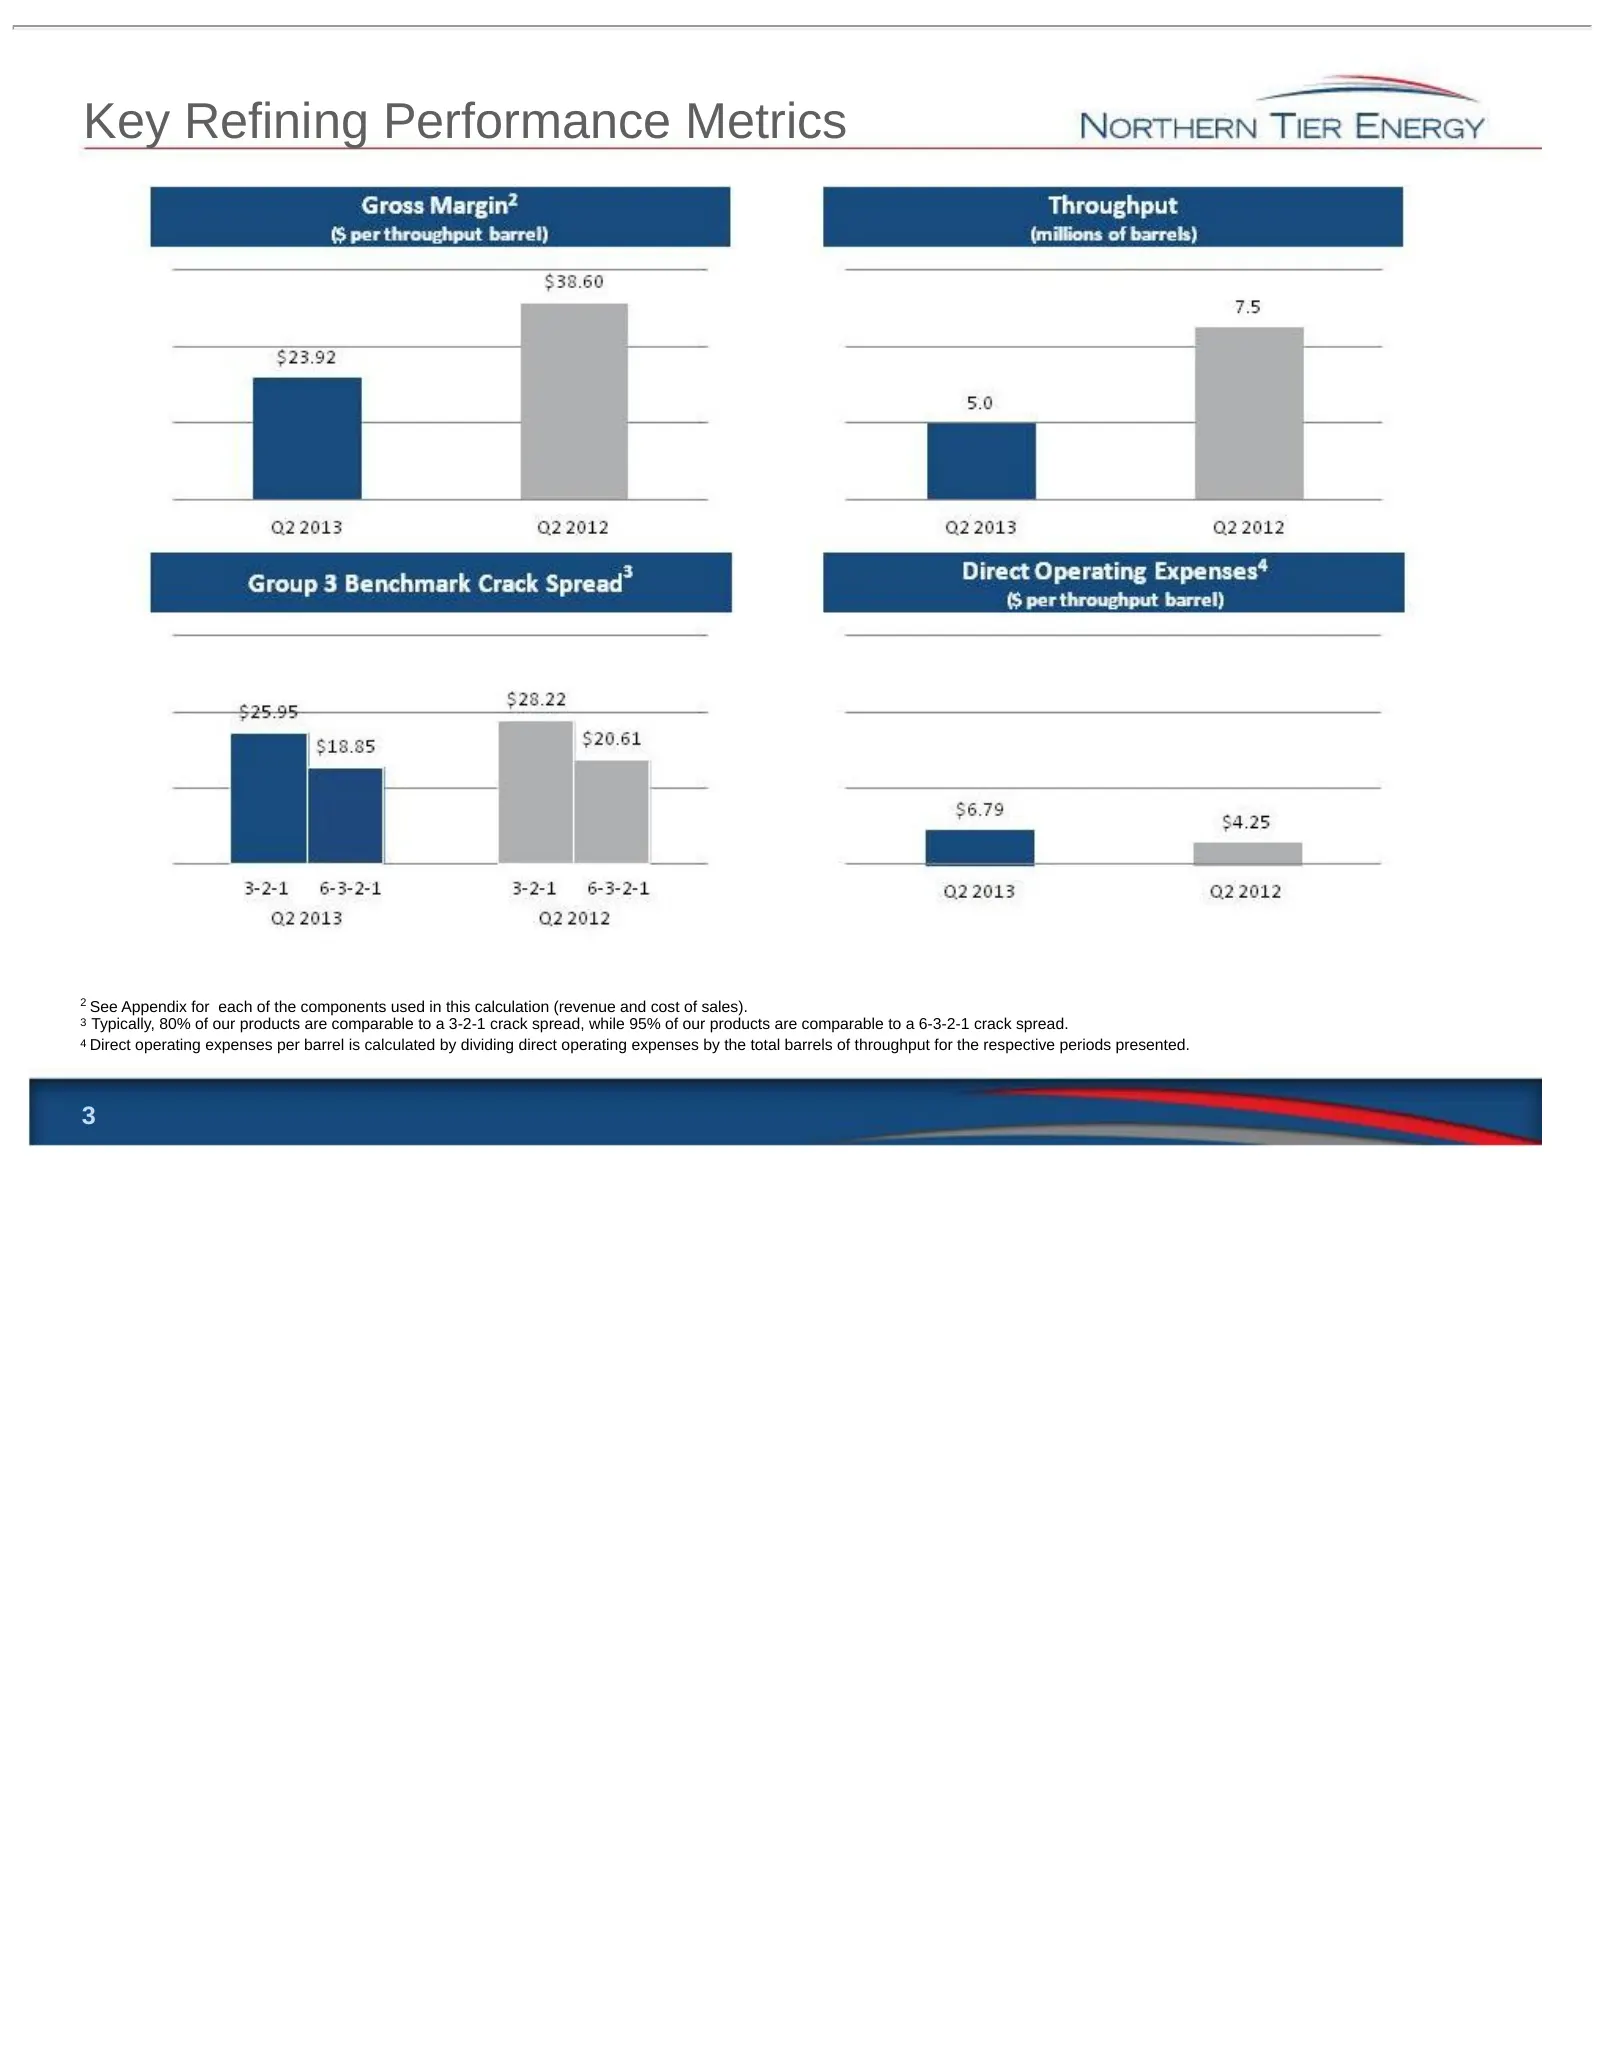
Key Refining Performance Metrics 2 See Appendix for each of the components used in this calculation (revenue and cost of sales). 3 Typically, 80% of our products are comparable to a 3-2-1 crack spread, while 95% of our products are comparable to a 6-3-2-1 crack spread. 4 Direct operating expenses pe
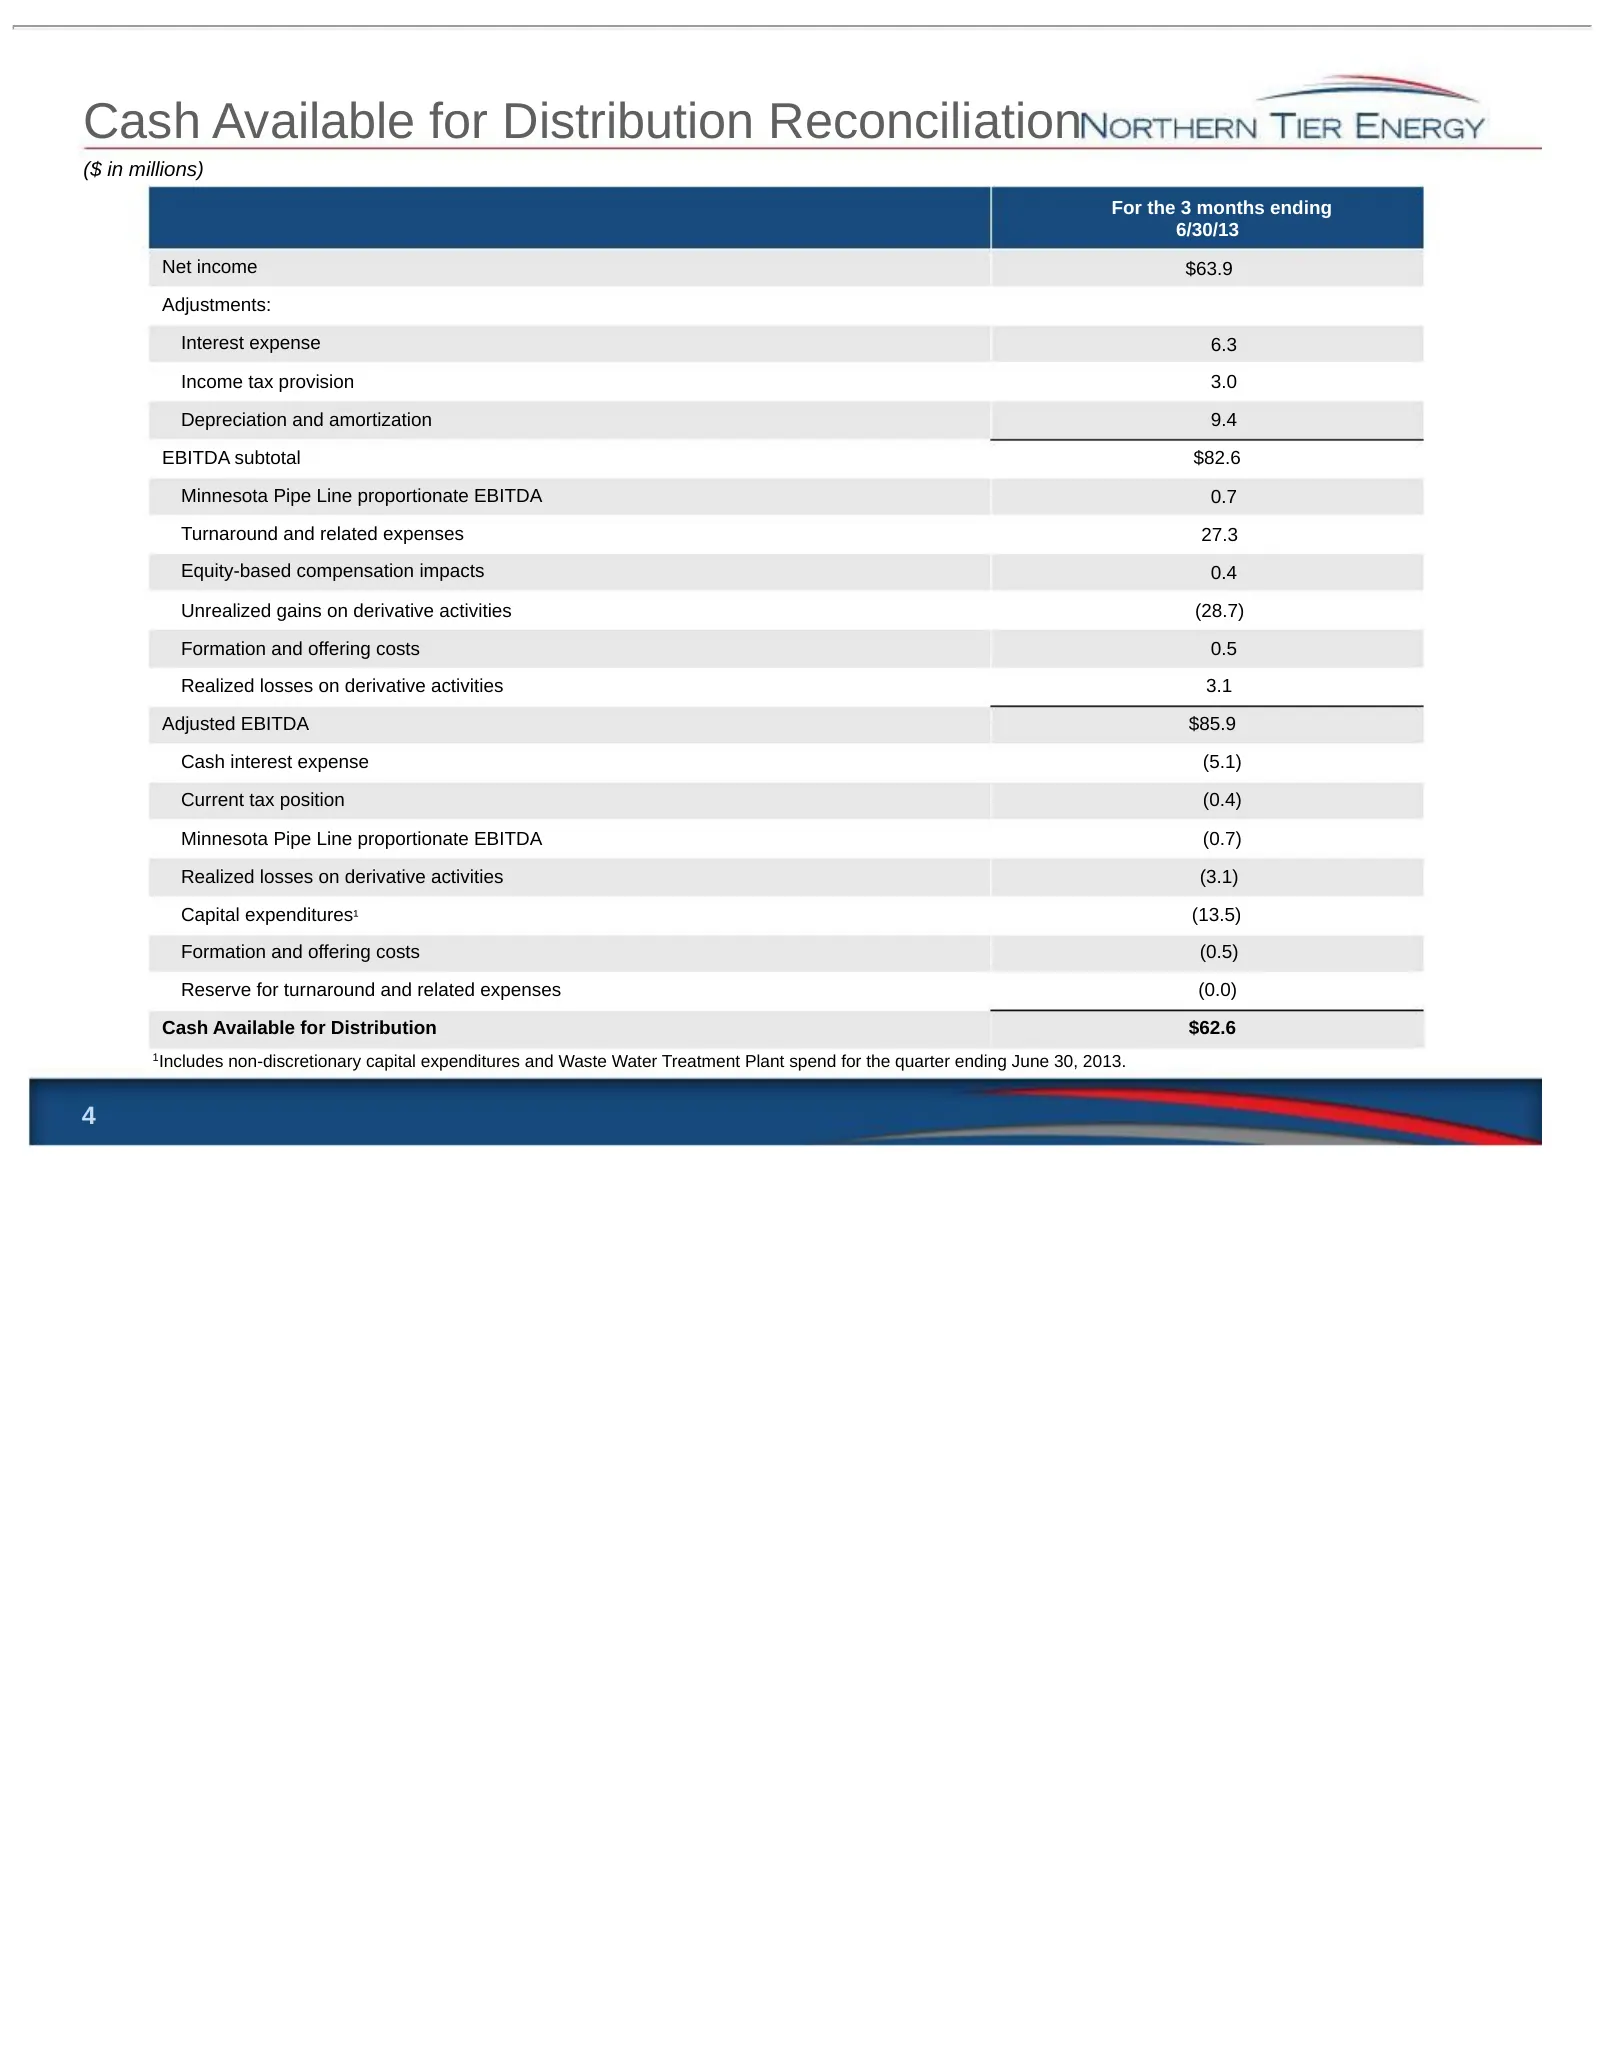
Slide 5: Cash Available for Distribution Reconciliation
Cash Available for Distribution Reconciliation ($ in millions) For the 3 months ending 6/30/13 Net income $63.9 Adjustments: Interest expense 6.3 Income tax provision 3.0 Depreciation and amortization 9.4 EBITDA subtotal $82.6 Minnesota Pipe Line proportionate EBITDA 0.7 Turnaround and related expen
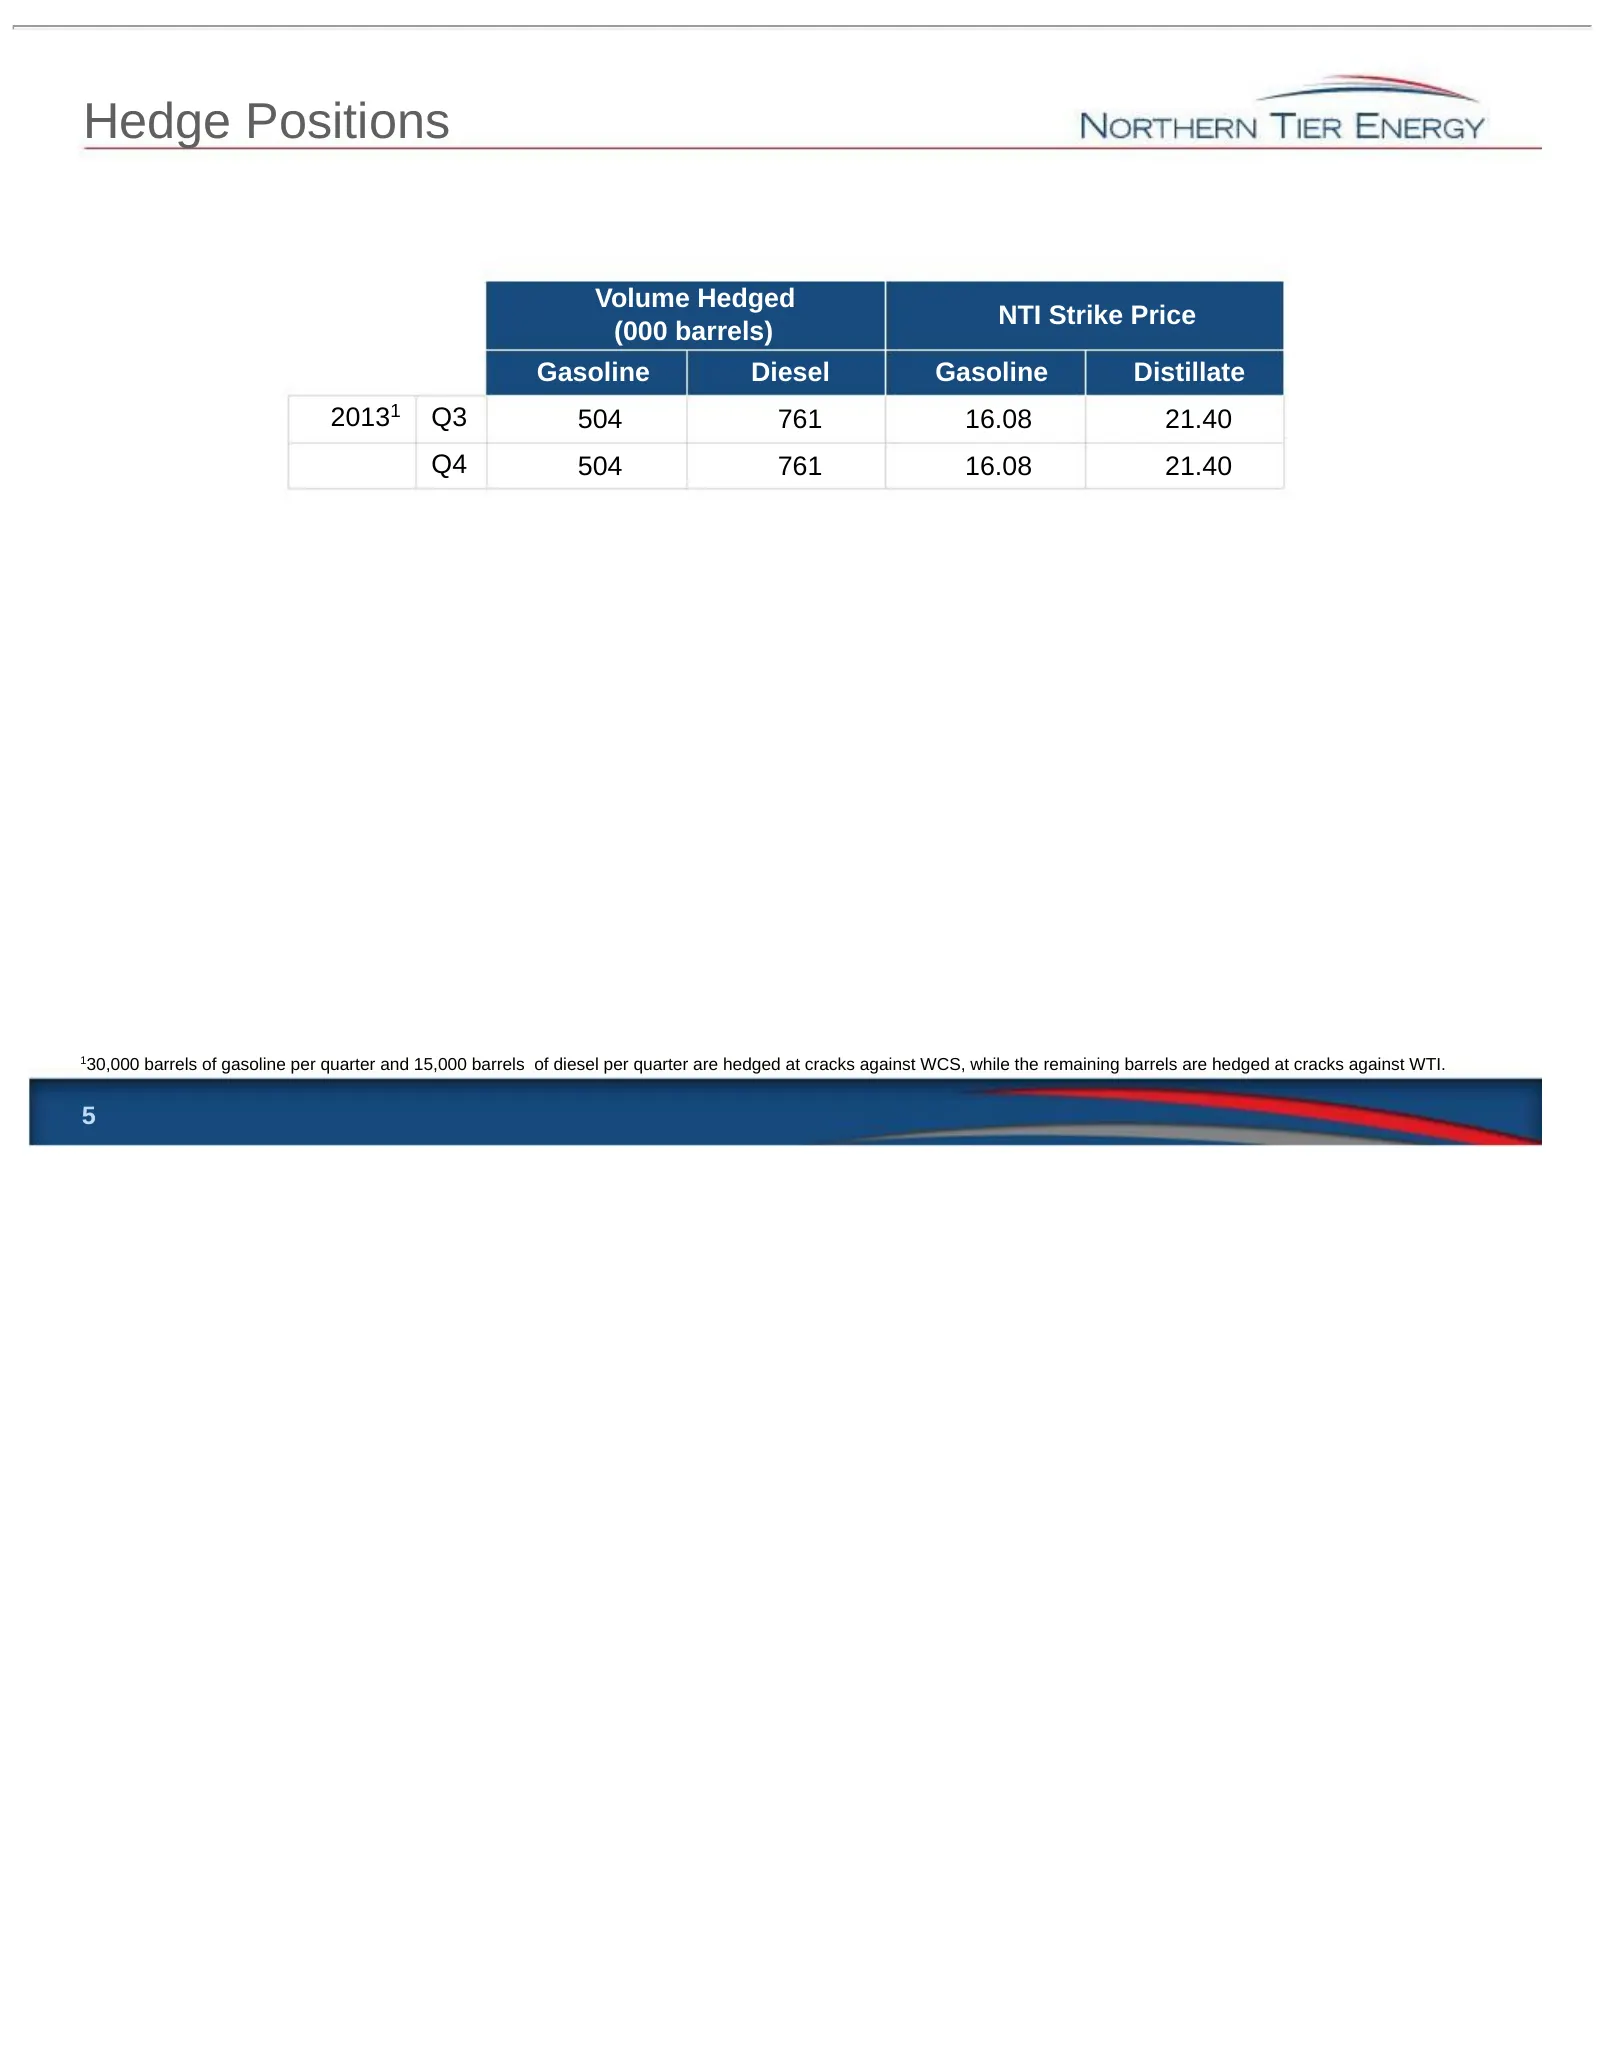
Slide 6: Hedge Positions
Hedge Positions Volume Hedged NTI Strike Price (000 barrels) Gasoline Diesel Gasoline Distillate 1 2013 Q3 504 761 16.08 21.40 Q4 504 761 16.08 21.40 1 30,000 barrels of gasoline per quarter and 15,000 barrels of diesel per quarter are hedged at cracks against WCS, while the remaining barrels are he
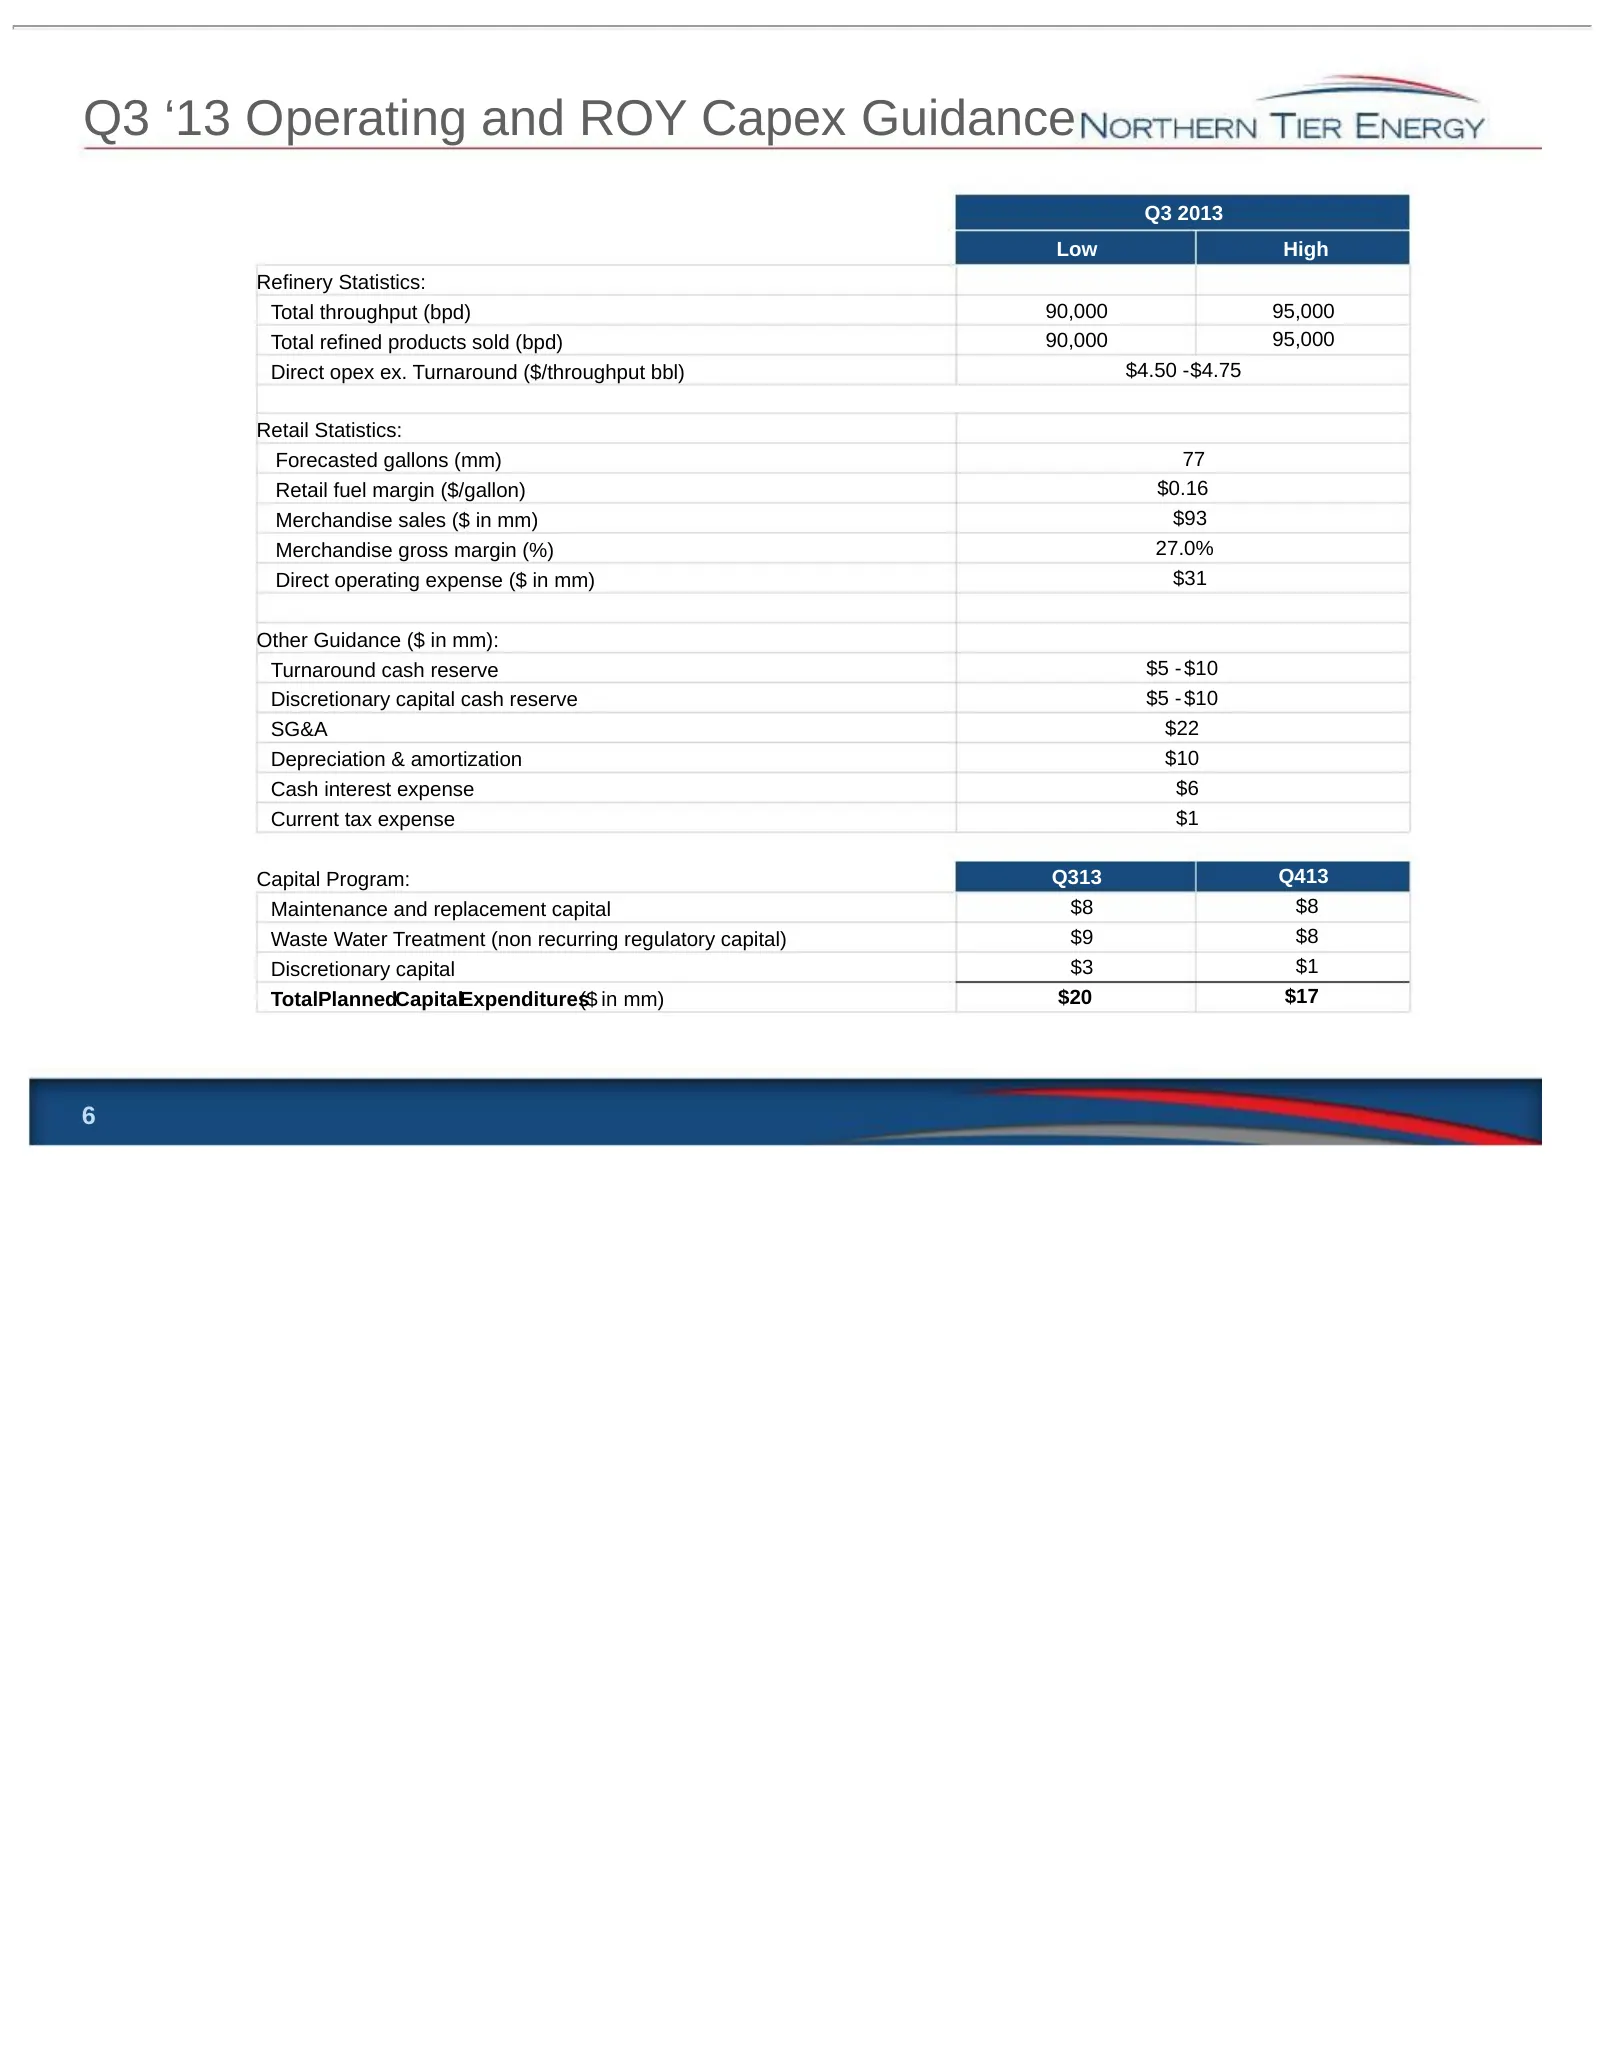
Slide 7: Q3 '13 Operating and ROY Capex Guidance
Q3 ‘13 Operating and ROY Capex Guidance Q3 2013 Low High Refinery Statistics: Total throughput (bpd) 90,000 95,000 Total refined products sold (bpd) 90,000 95,000 Direct opex ex. Turnaround ($/throughput bbl) $4.50 -$4.75 Retail Statistics: Forecasted gallons (mm) 77 Retail fuel margin ($/gallon) $0
Slide 8: Appendix
—— NORTHERN TIER ENERGY APPENDIX
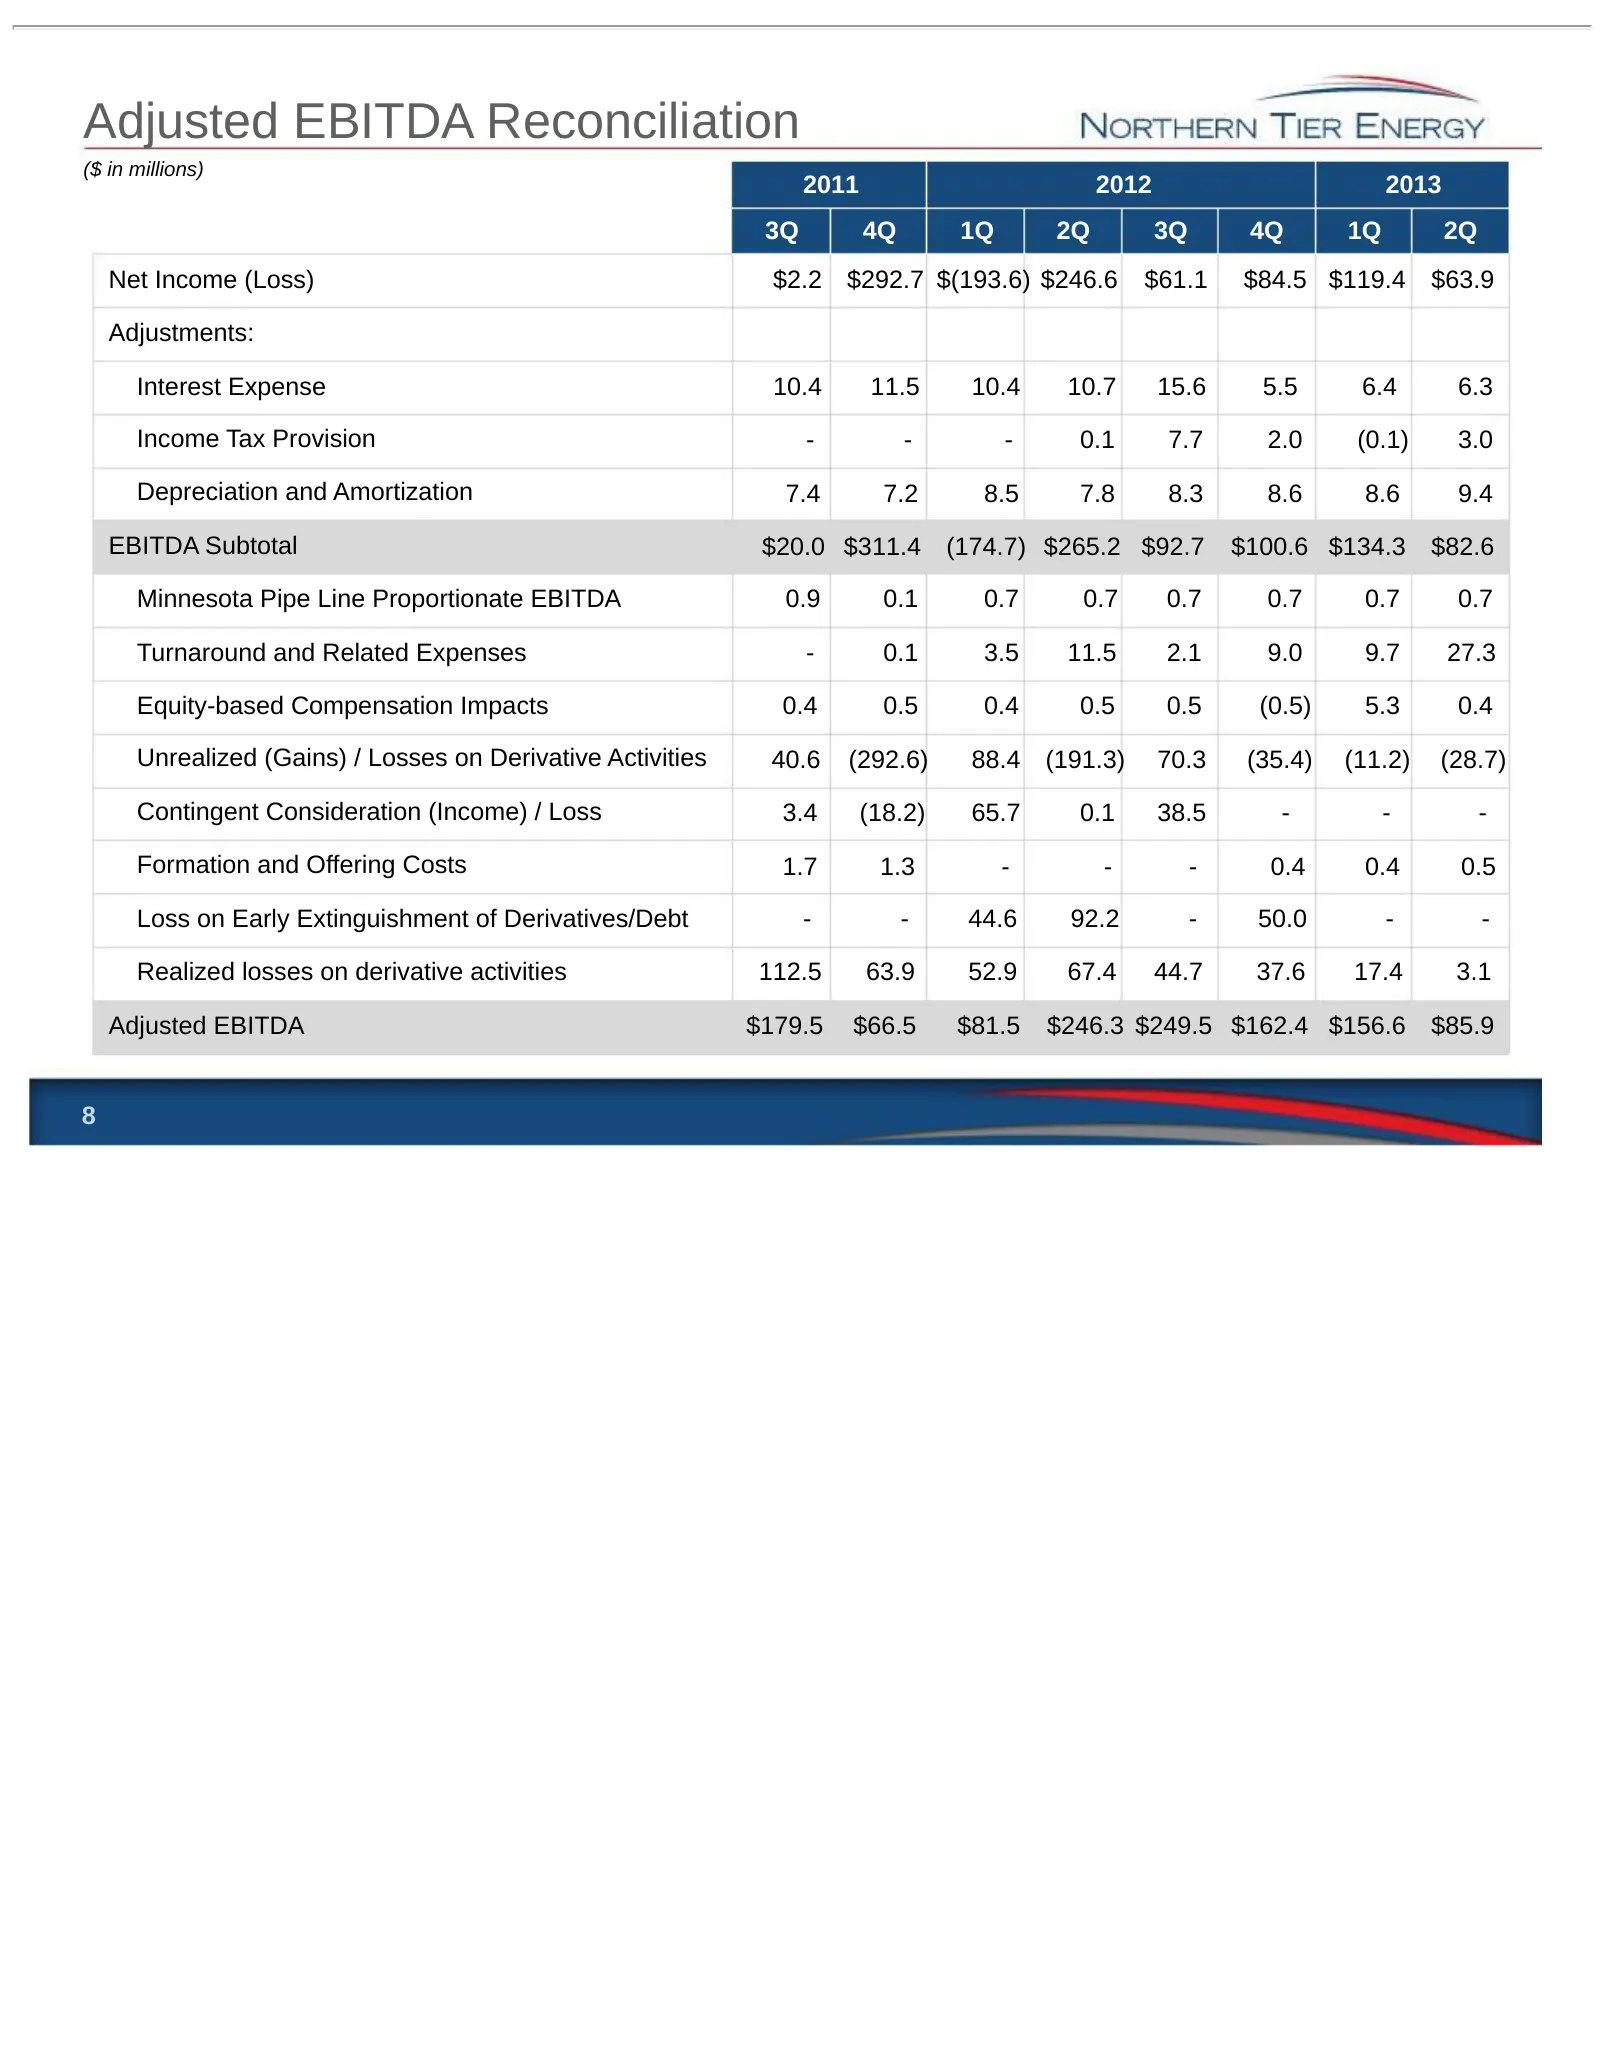
Slide 9: Adjusted EBITDA Reconciliation
Adjusted EBITDA Reconciliation ($ in millions) 2011 2012 2013 3Q 4Q 1Q 2Q 3Q 4Q 1Q 2Q Net Income (Loss) $2.2 $292.7 $(193.6) $246.6 $61.1 $84.5 $119.4 $63.9 Adjustments: Interest Expense 10.4 11.5 10.4 10.7 15.6 5.5 6.4 6.3 Income Tax Provision - - - 0.1 7.7 2.0 (0.1) 3.0 Depreciation and Amortizati
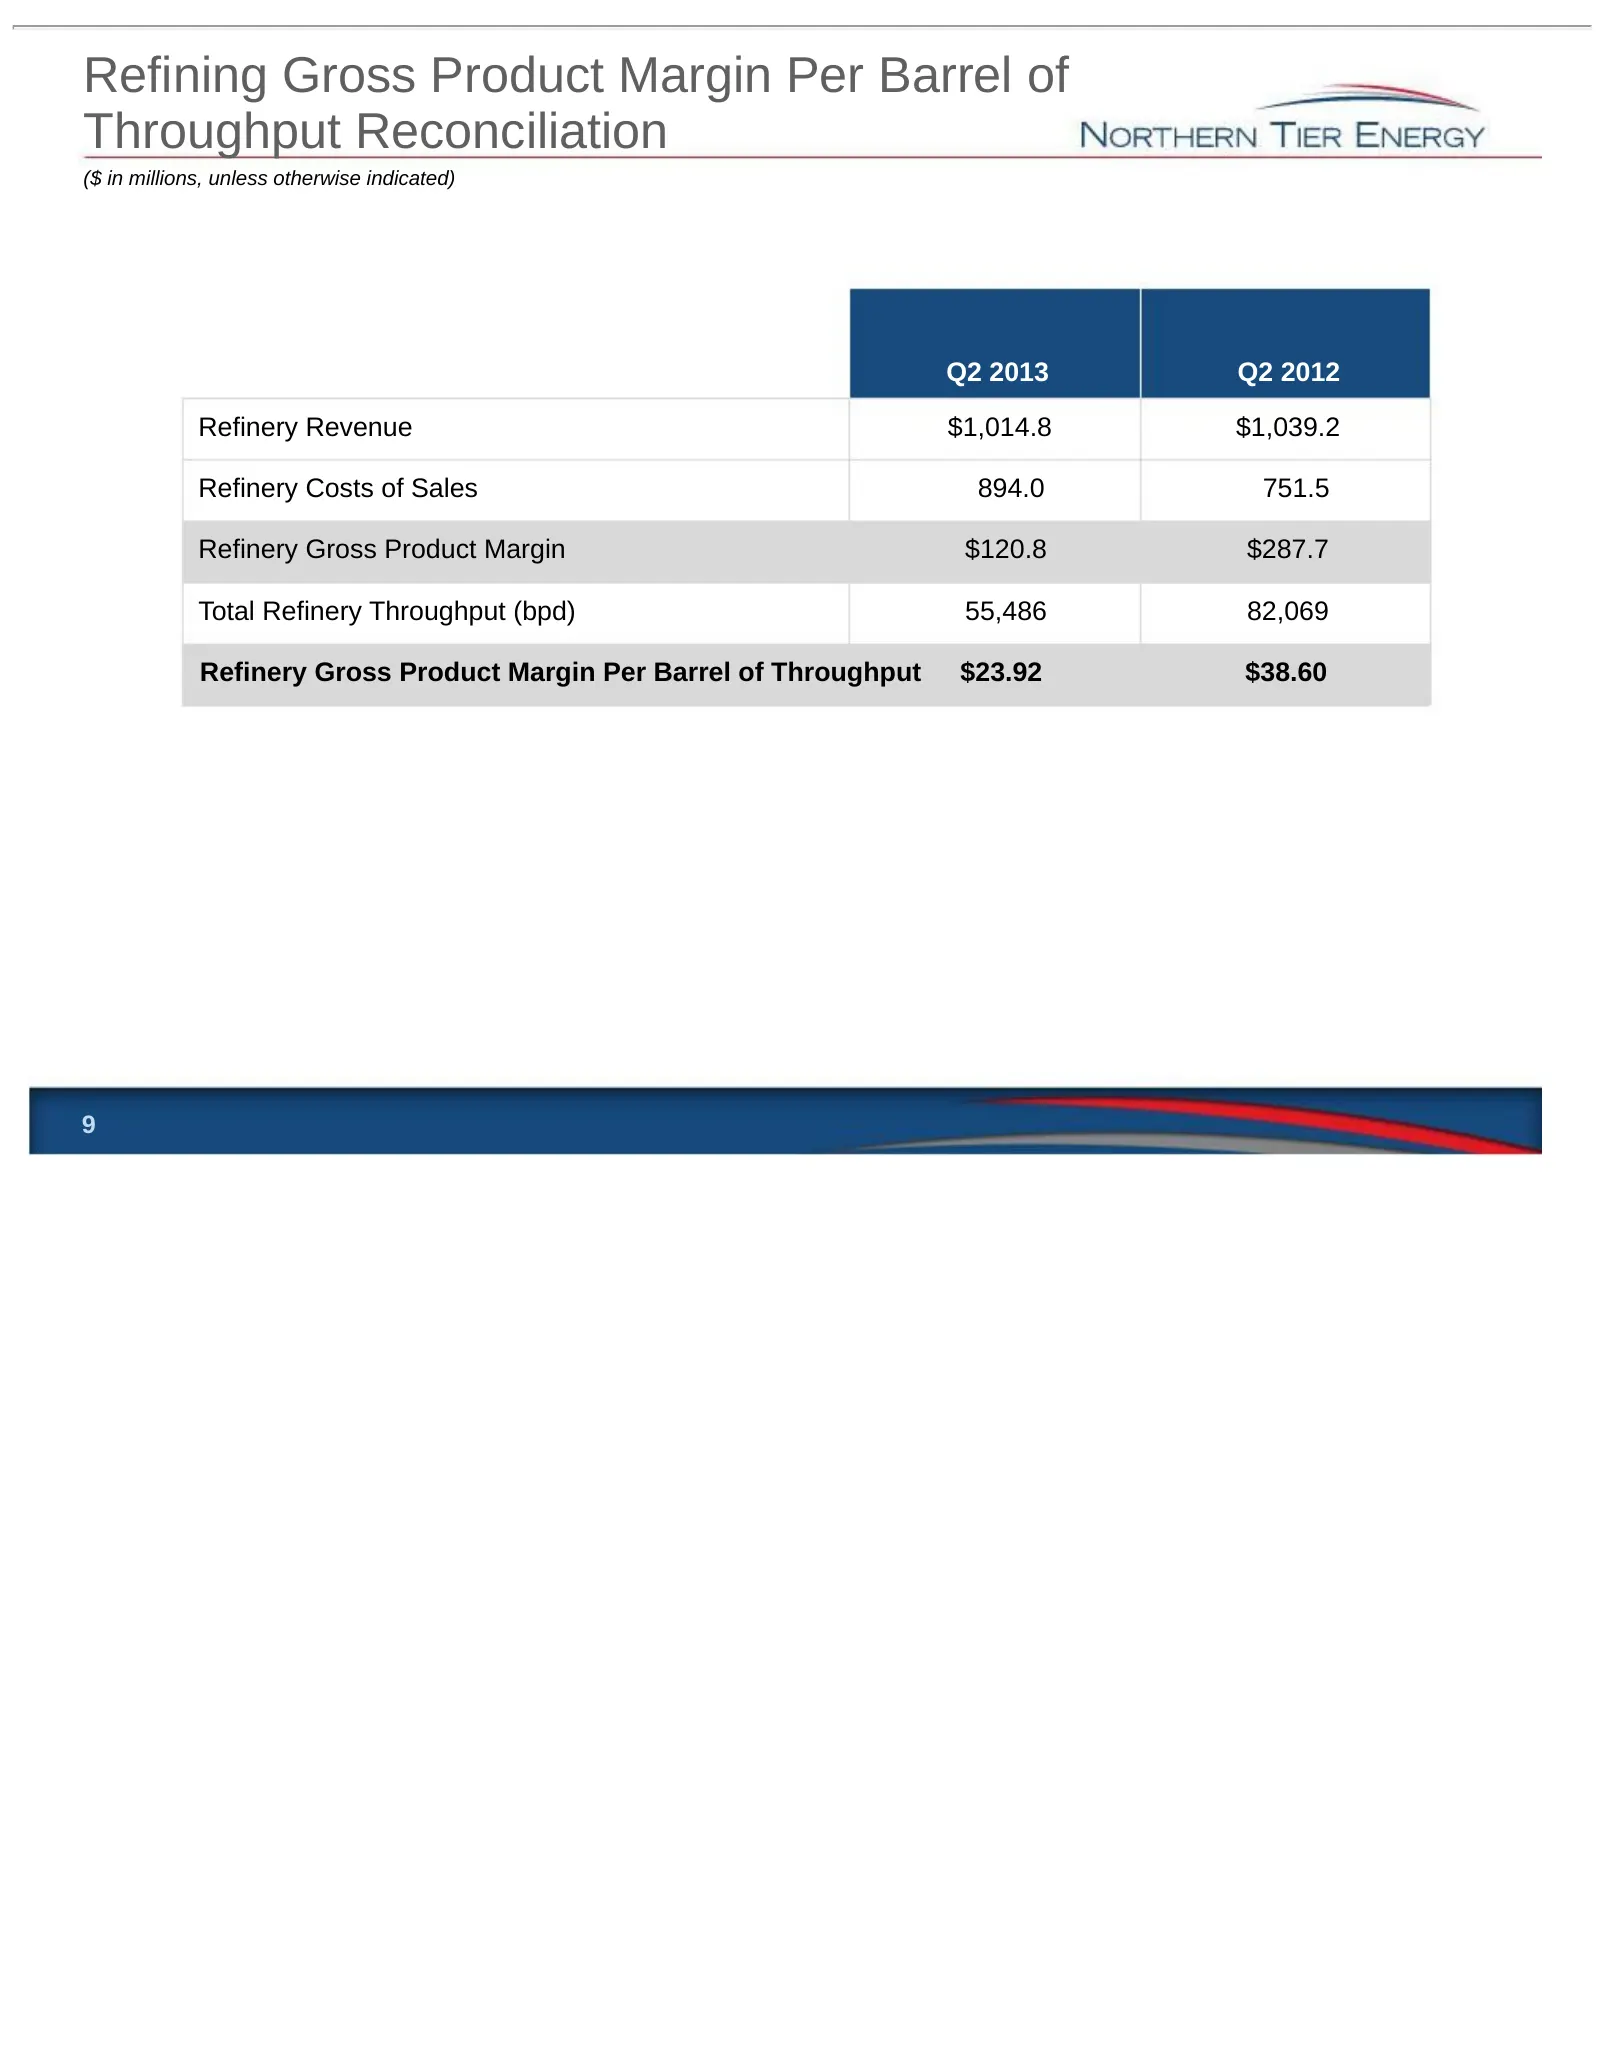
Slide 10: Refining Gross Product Margin Per Barrel of Throughput Reconciliation
Refining Gross Product Margin Per Barrel of Throughput Reconciliation ($ in millions, unless otherwise indicated) Q2 2013 Q2 2012 Refinery Revenue $1,014.8 $1,039.2 Refinery Costs of Sales 894.0 751.5 Refinery Gross Product Margin $120.8 $287.7 Total Refinery Throughput (bpd) 55,486 82,069 Refinery
Source: SEC EDGAR · 8-K filed Aug 13, 2013
More decks from Northern Tier Energy LP
 2016 Wells Fargo West Coast Energy Conference21 slides · Jun 20, 2016
 Bank of America Merrill Lynch 2016 Energy Credit Conference21 slides · Jun 8, 2016
 RBC 2016 Global Energy and Power Executive Conference20 slides · Jun 7, 2016
 Morgan Stanley Refining Corporate Access Day 201622 slides · May 12, 2016
 Citi 2016 Global Energy & Utilities Conference21 slides · May 11, 2016
 Q1 2016 Earnings Presentation13 slides · May 3, 2016