Barratt Redrow plc · LSE:BTRW
Barratt Redrow — Barratt Developments — FY2020 Earnings Presentation
56 slides from Barratt Redrow's earnings presentation, Sep 2, 2020
Slide 1: Results Presentation, Year ended 30 June 2020
RESULTS PRESENTATION Year ended 30 June 2020 2 September 2020 Saviours Place, Warrington 1
Slide 2: David Thomas, Chief Executive Officer
David Thomas Chief Executive Officer St Rumbold’s Fields, Buckingham 2
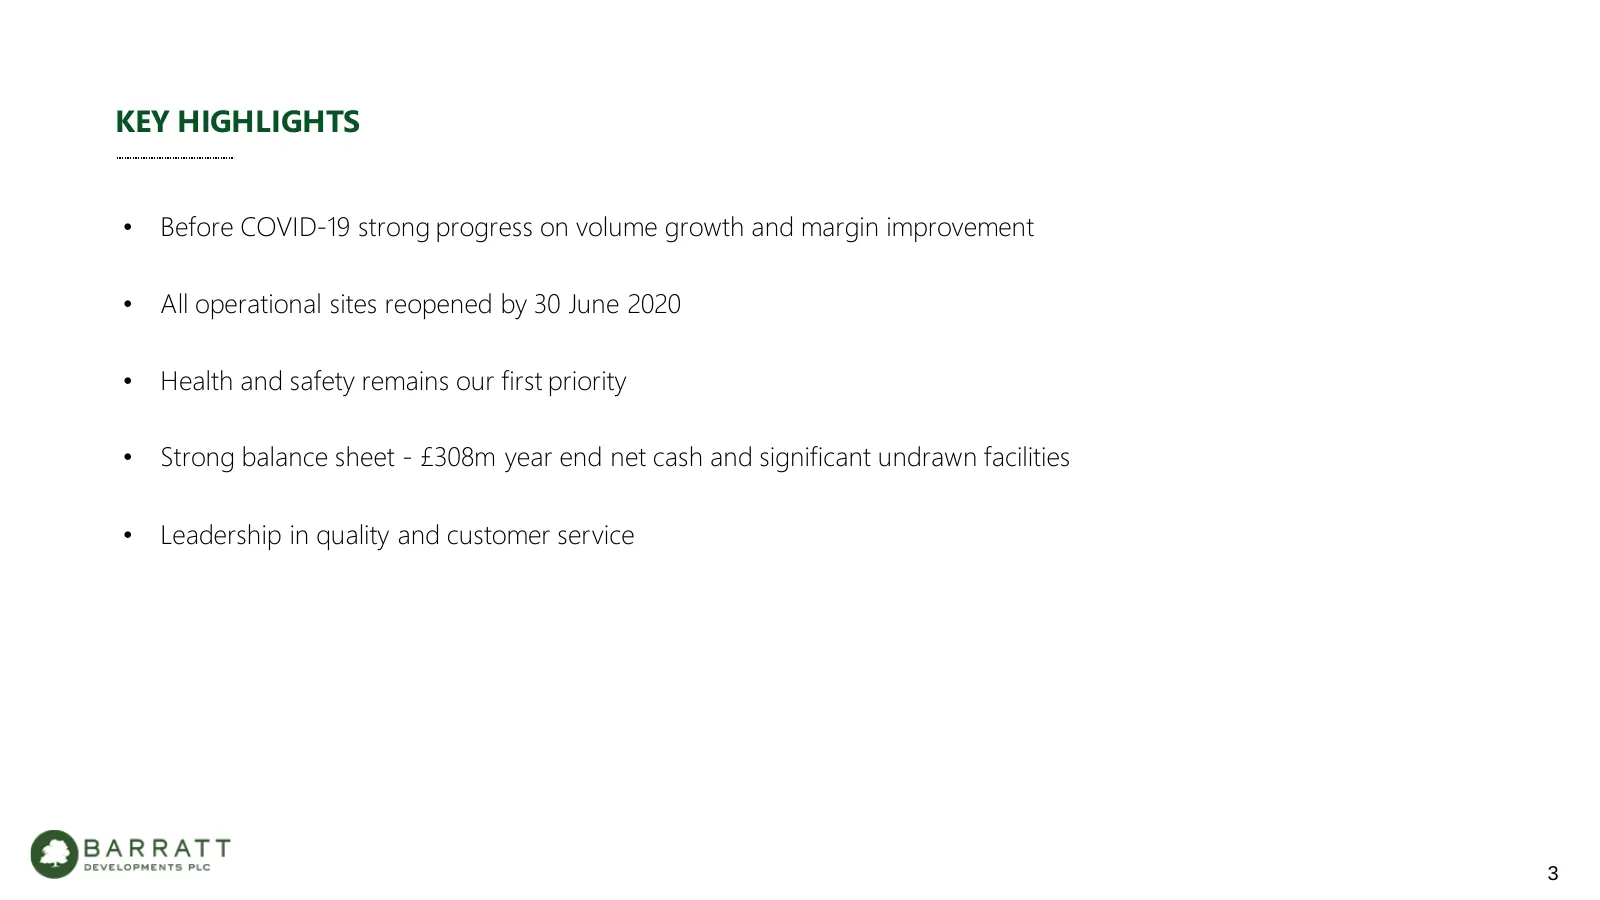
Slide 3: Key Highlights
KEY HIGHLIGHTS • Before COVID-19 strong progress on volume growth and margin improvement • All operational sites reopened by 30 June 2020 • Health and safety remains our first priority • Strong balance sheet - £308m year end net cash and significant undrawn facilities • Leadership in quality and cus
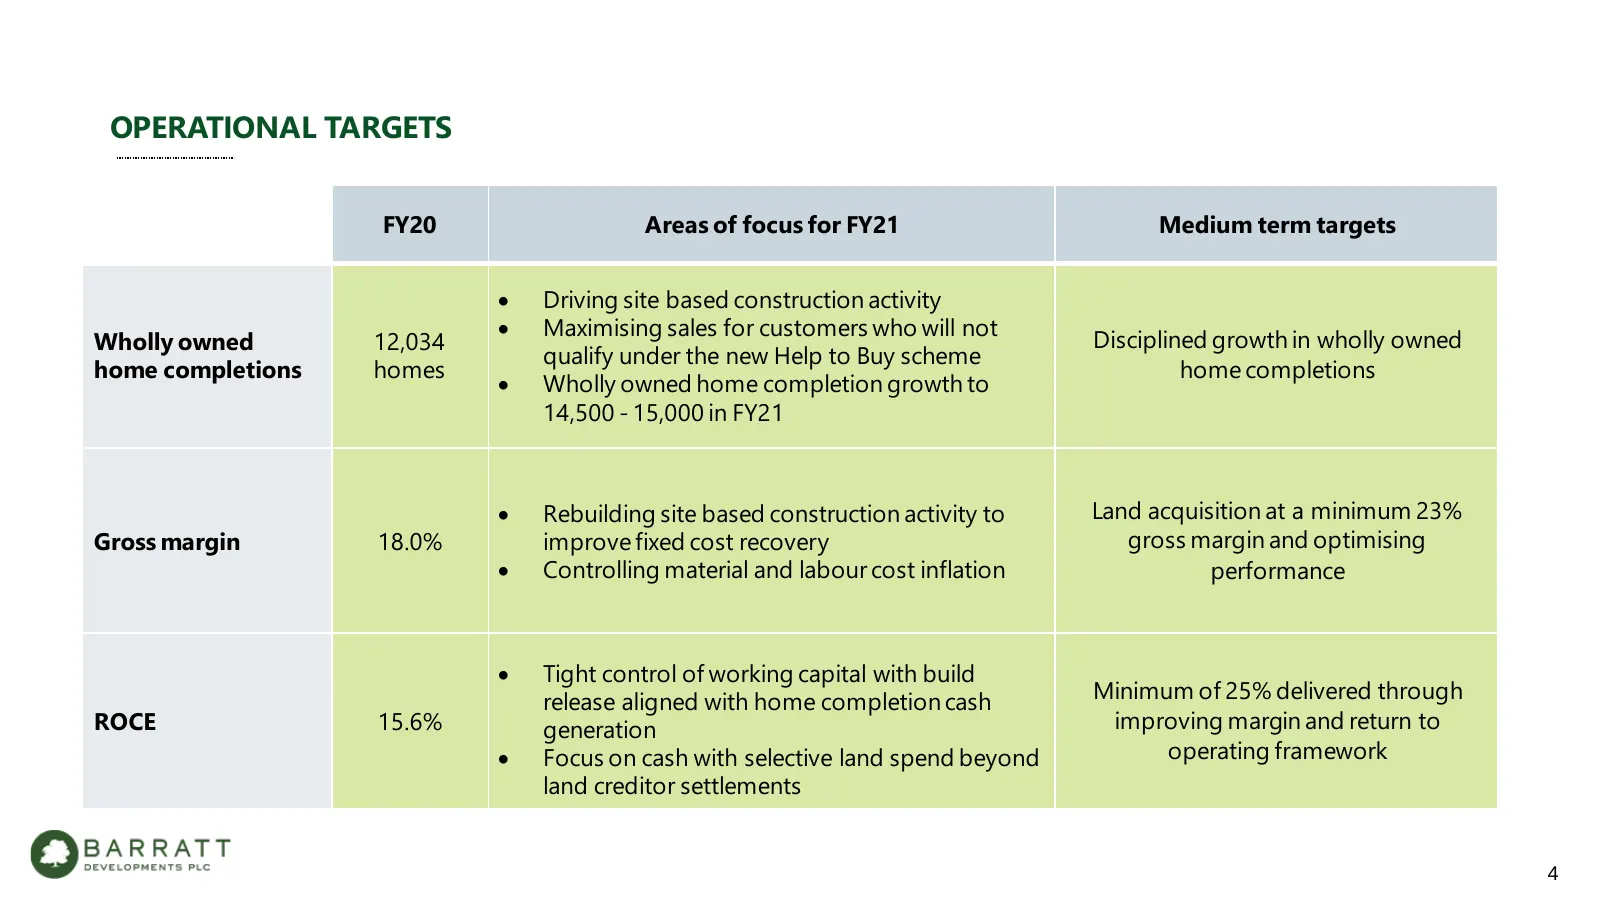
Slide 4: Operational Targets
OPERATIONAL TARGETS FY20 Areas of focus for FY21 Medium term targets Driving site based construction activity Maximising sales for customers who will not Wholly owned 12,034 Disciplined growth in wholly owned qualify under the new Help to Buy scheme home completions homes home completions Whol
Slide 5: Steven Boyes, Chief Operating Officer
Steven Boyes Chief Operating Officer Cane Hill Park, Coulsdon 5
Slide 6: Sales Performance
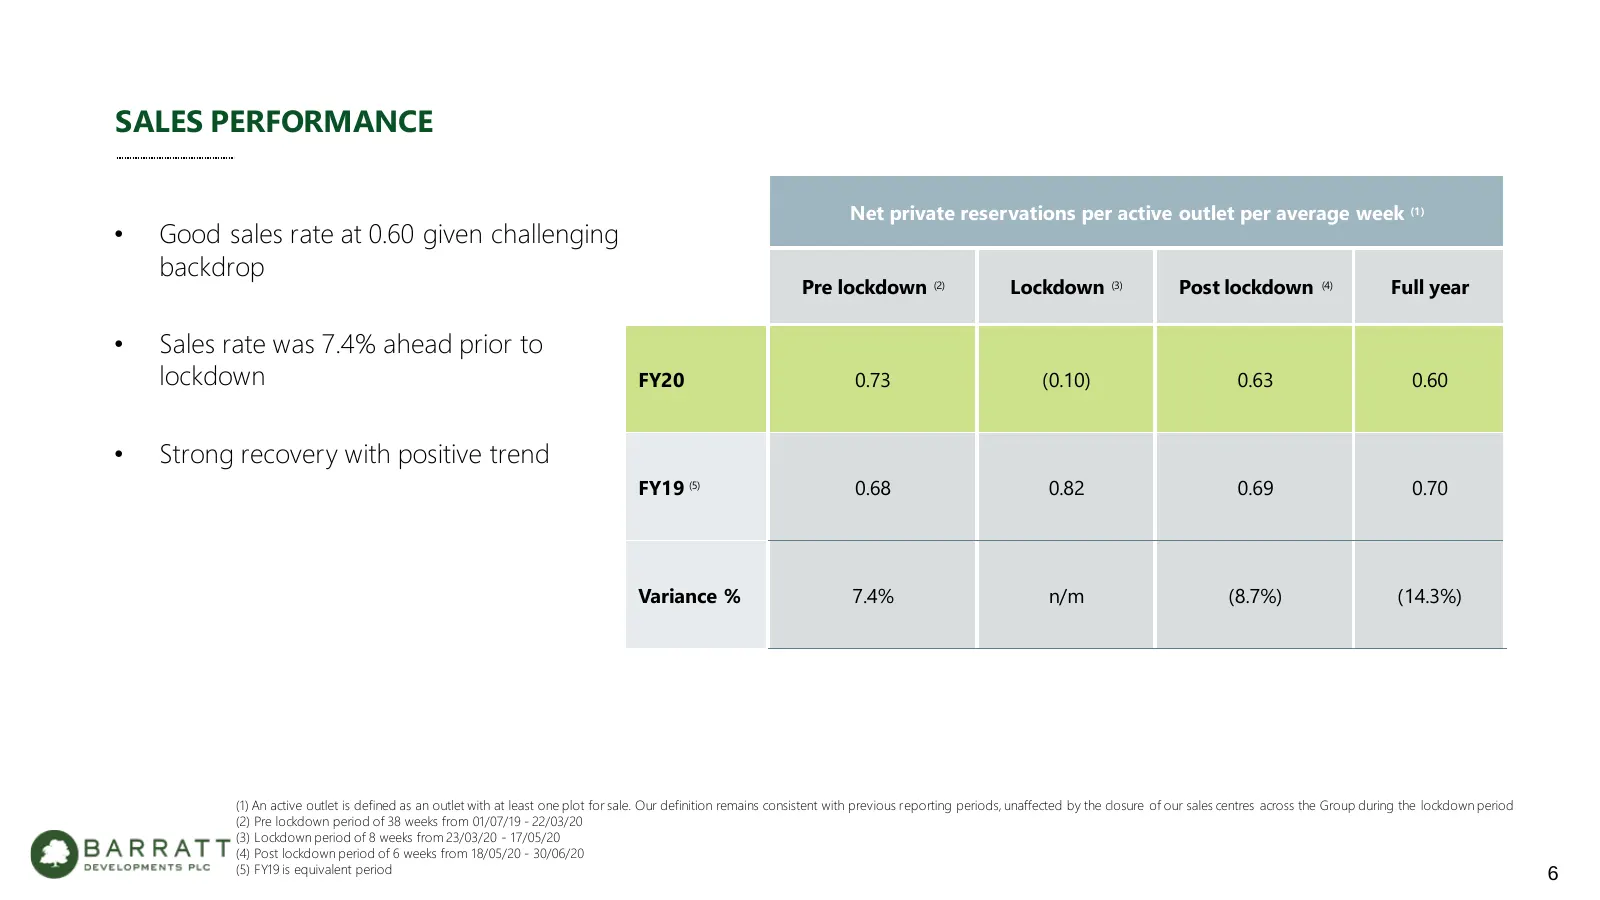
SALES PERFORMANCE Net private reservations per active outlet per average week (1) • Good sales rate at 0.60 given challenging backdrop Pre lockdown (2) Lockdown (3) Post lockdown (4) Full year • Sales rate was 7.4% ahead prior to lockdown FY20 0.73 (0.10) 0.63 0.60 • Strong recovery with positive tr
Slide 7: Completions
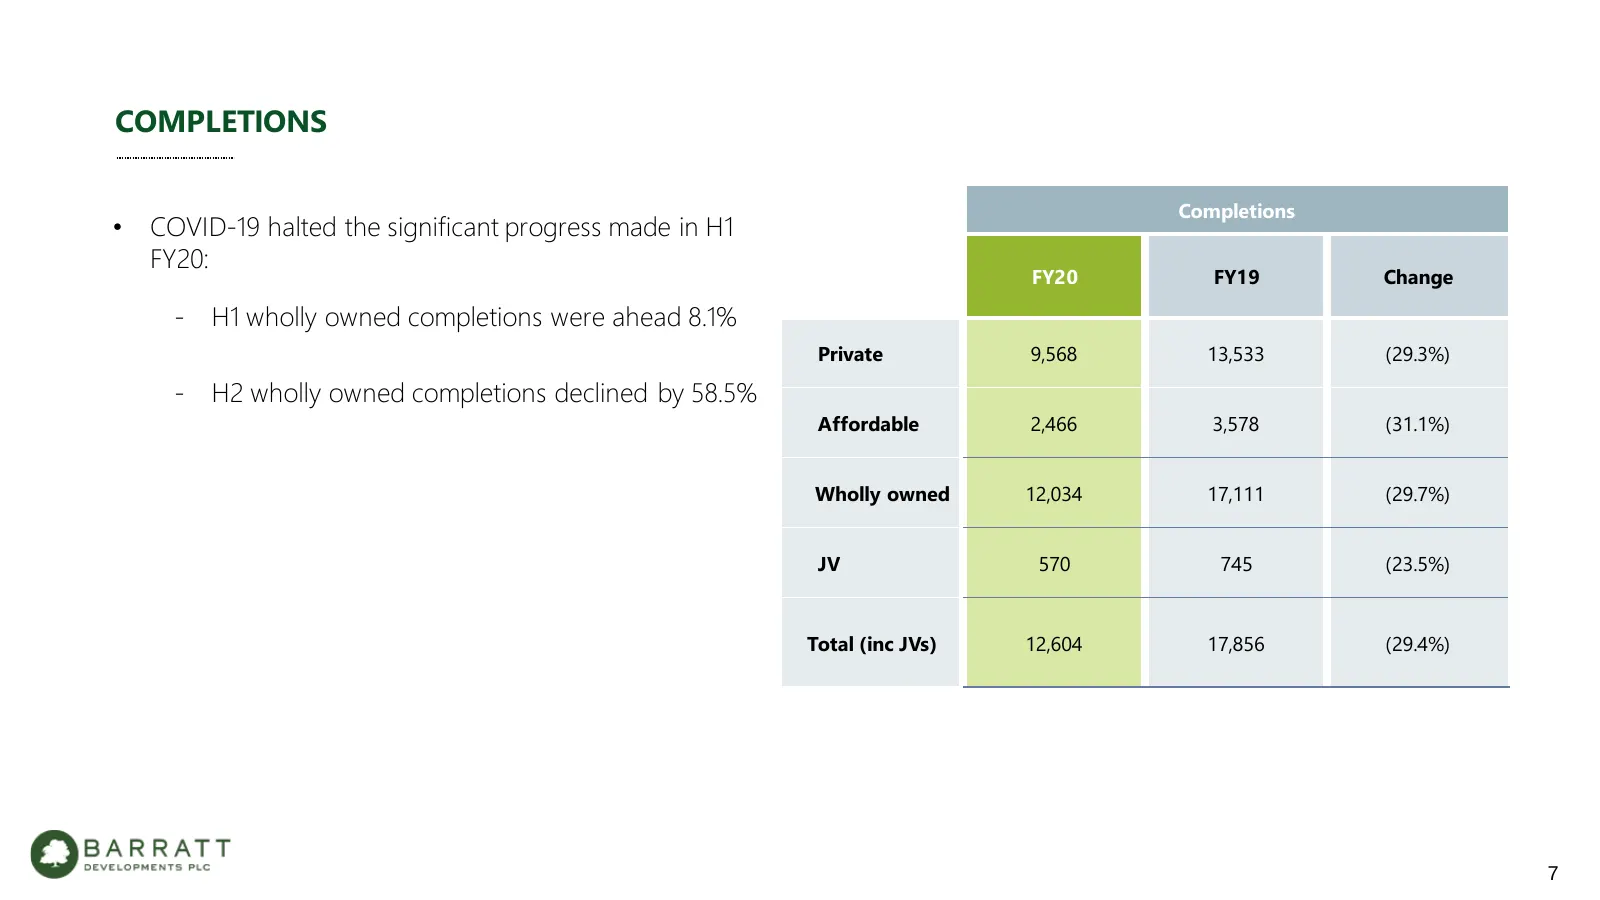
COMPLETIONS Completions • COVID-19 halted the significant progress made in H1 FY20: FY20 FY19 Change - H1 wholly owned completions were ahead 8.1% Private 9,568 13,533 (29.3%) - H2 wholly owned completions declined by 58.5% Affordable 2,466 3,578 (31.1%) Wholly owned 12,034 17,111 (29.7%) JV 570 745
Slide 8: Completions Analysis – Buyer Type
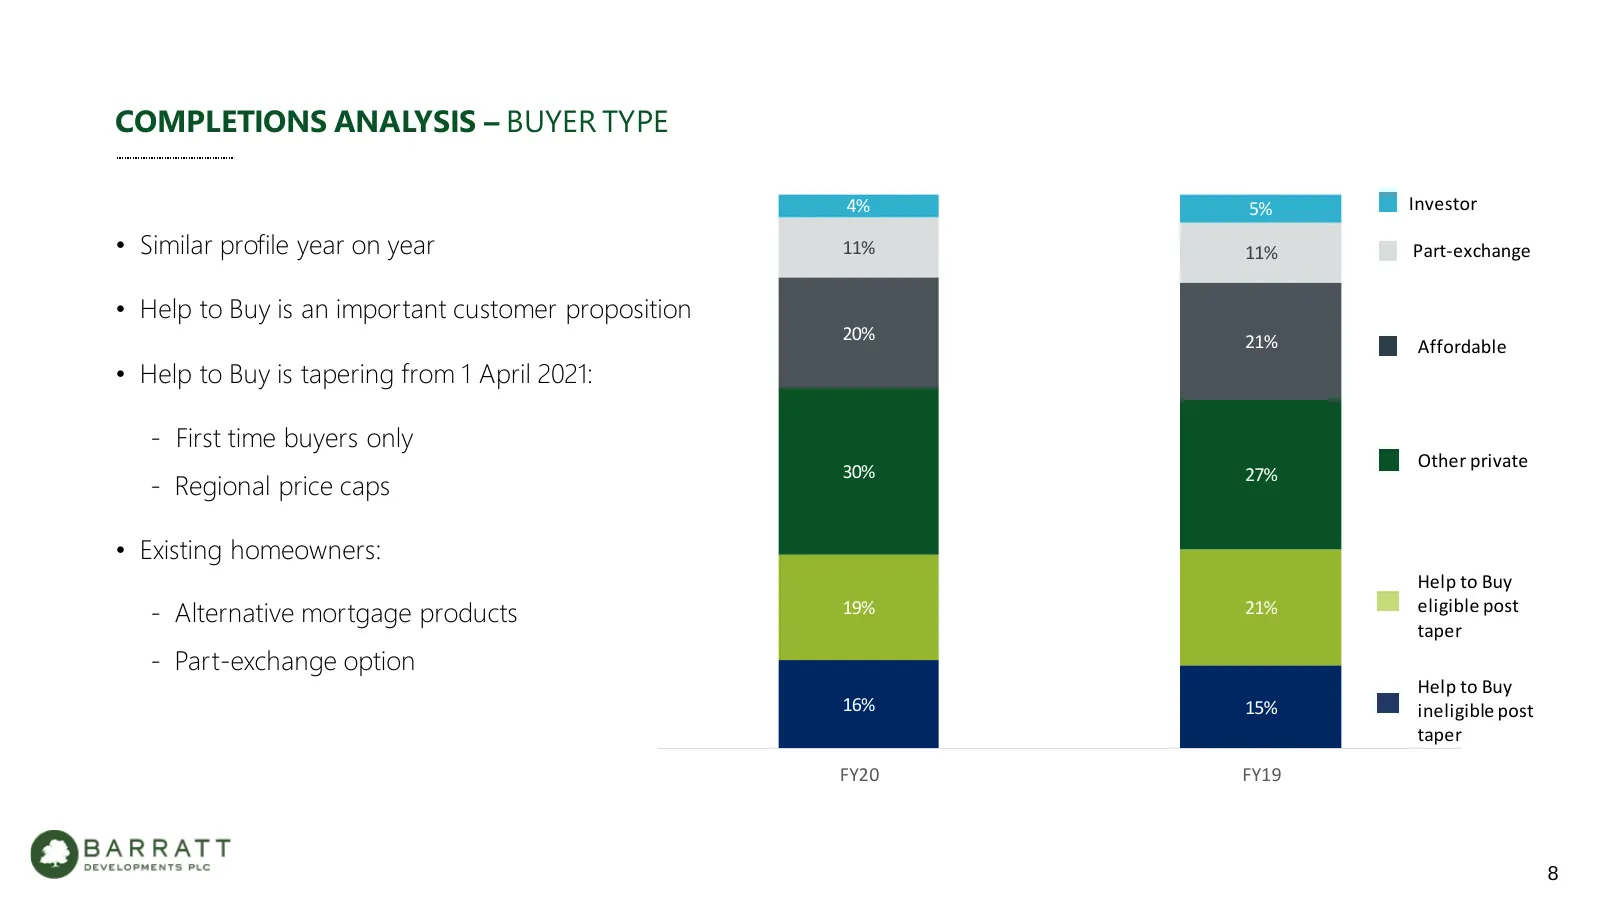
COMPLETIONS ANALYSIS – BUYER TYPE 4% 5% Investor • Similar profile year on year 11% 11% Part-exchange • Help to Buy is an important customer proposition 20% 21% Affordable • Help to Buy is tapering from 1 April 2021: - First time buyers only Other private 30% - Regional price caps 27% • Existing hom
Slide 9: Pricing Trends Remain Positive
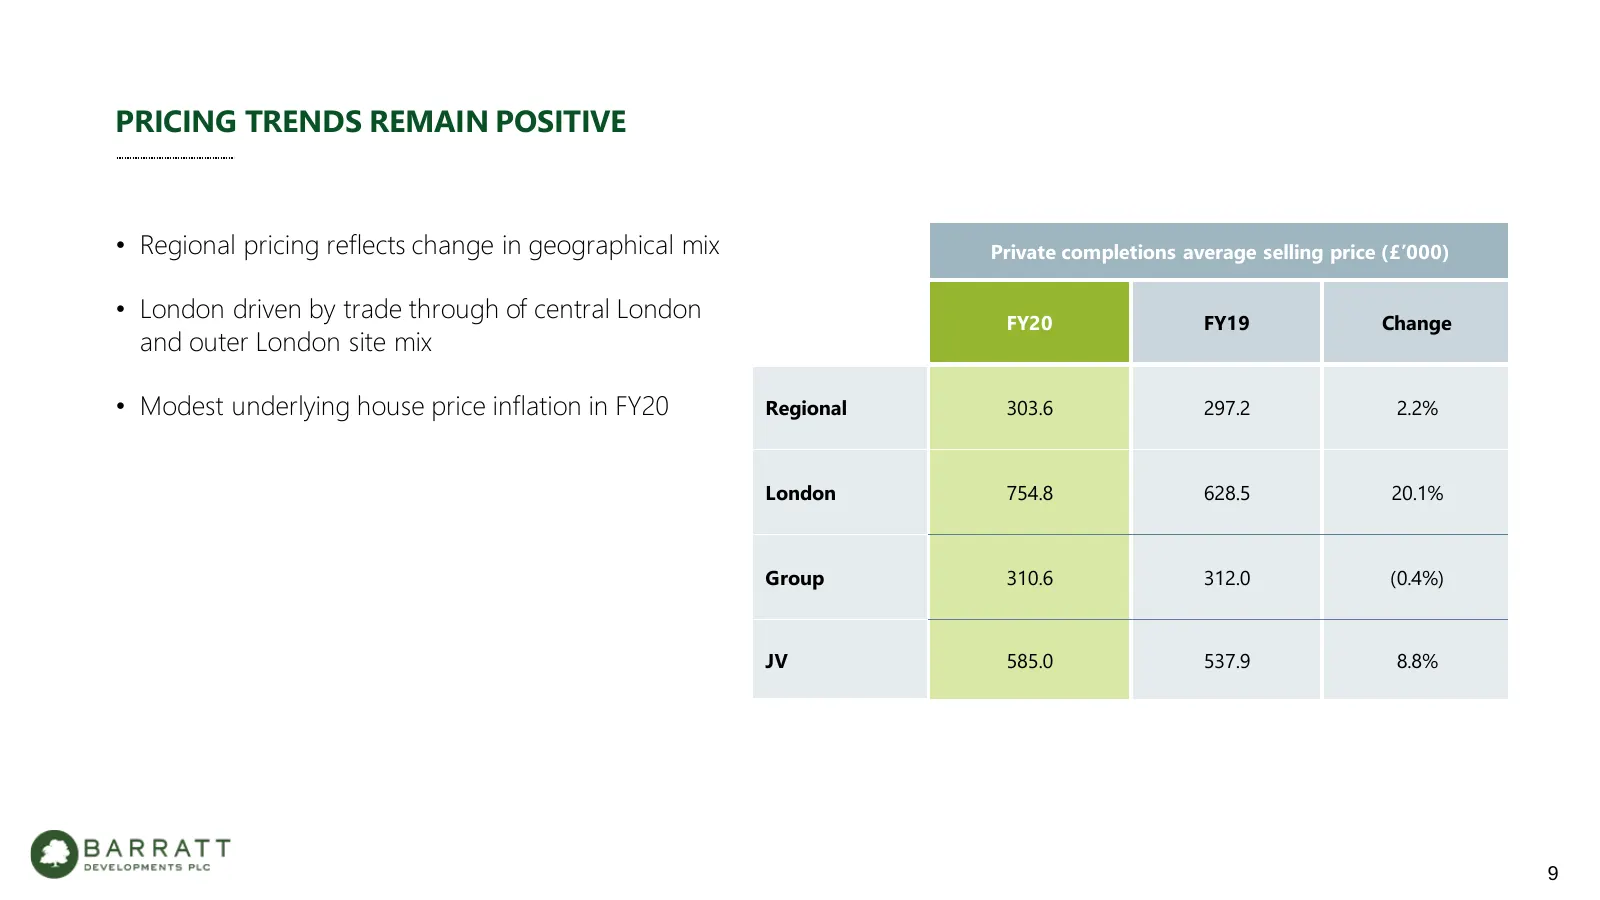
PRICING TRENDS REMAIN POSITIVE • Regional pricing reflects change in geographical mix Private completions average selling price (£’000) • London driven by trade through of central London FY20 FY19 Change and outer London site mix • Modest underlying house price inflation in FY20 Regional 303.6 297.2
Slide 10: Operational Activity
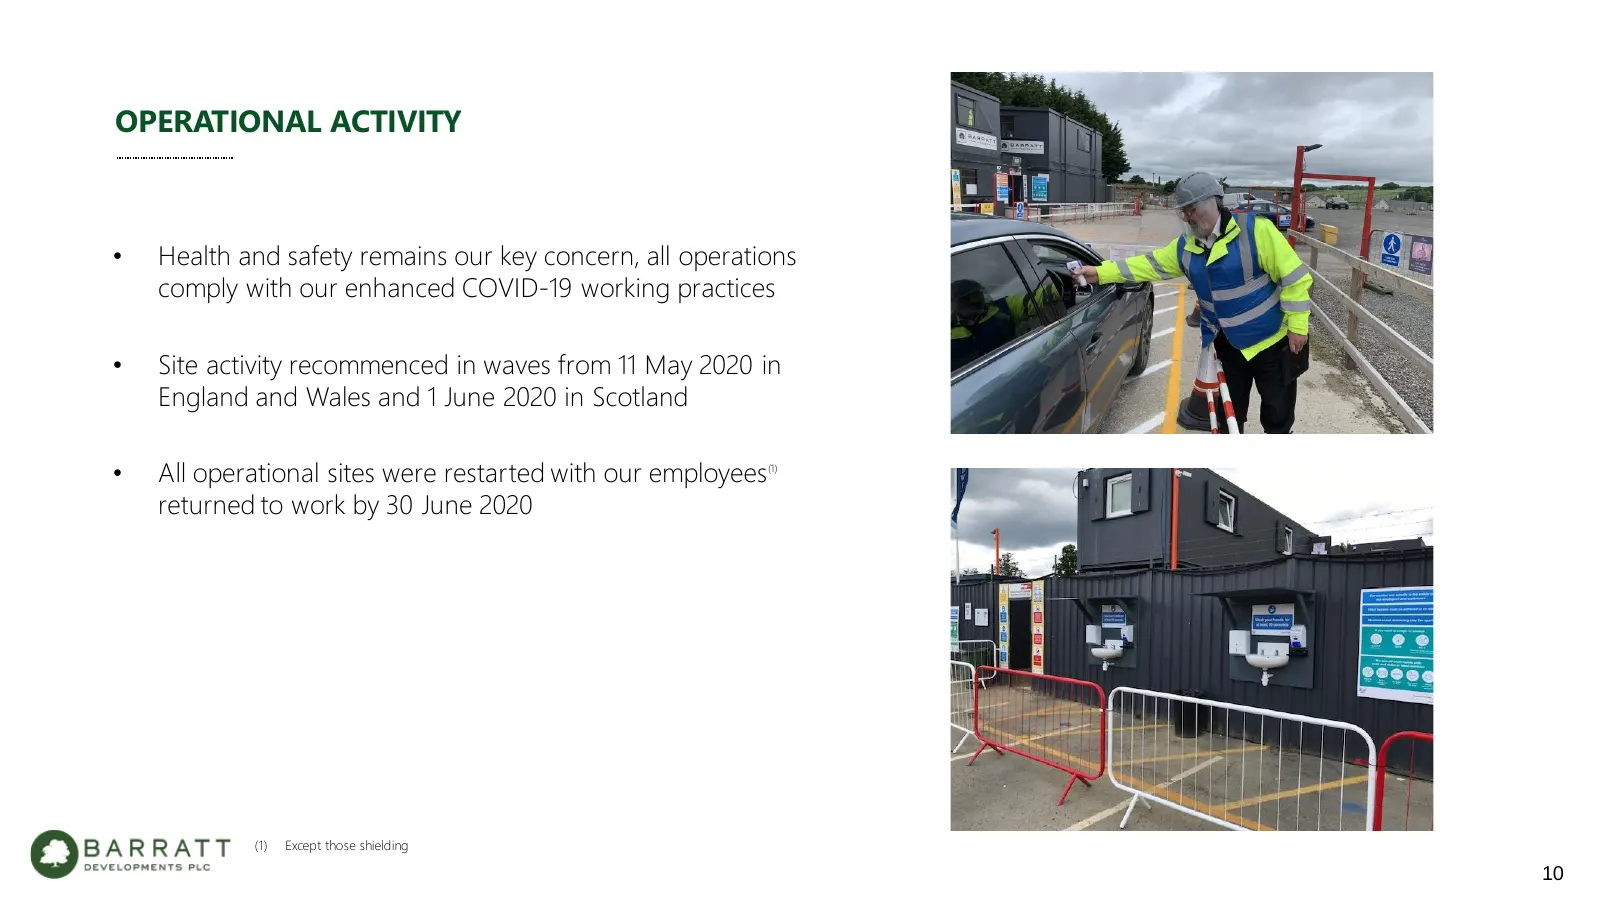
OPERATIONAL ACTIVITY • Health and safety remains our key concern, all operations comply with our enhanced COVID-19 working practices • Site activity recommenced in waves from 11 May 2020 in England and Wales and 1 June 2020 in Scotland • All operational sites were restarted with our employees (1) re
Slide 11: Rebuilding Our Construction Activity
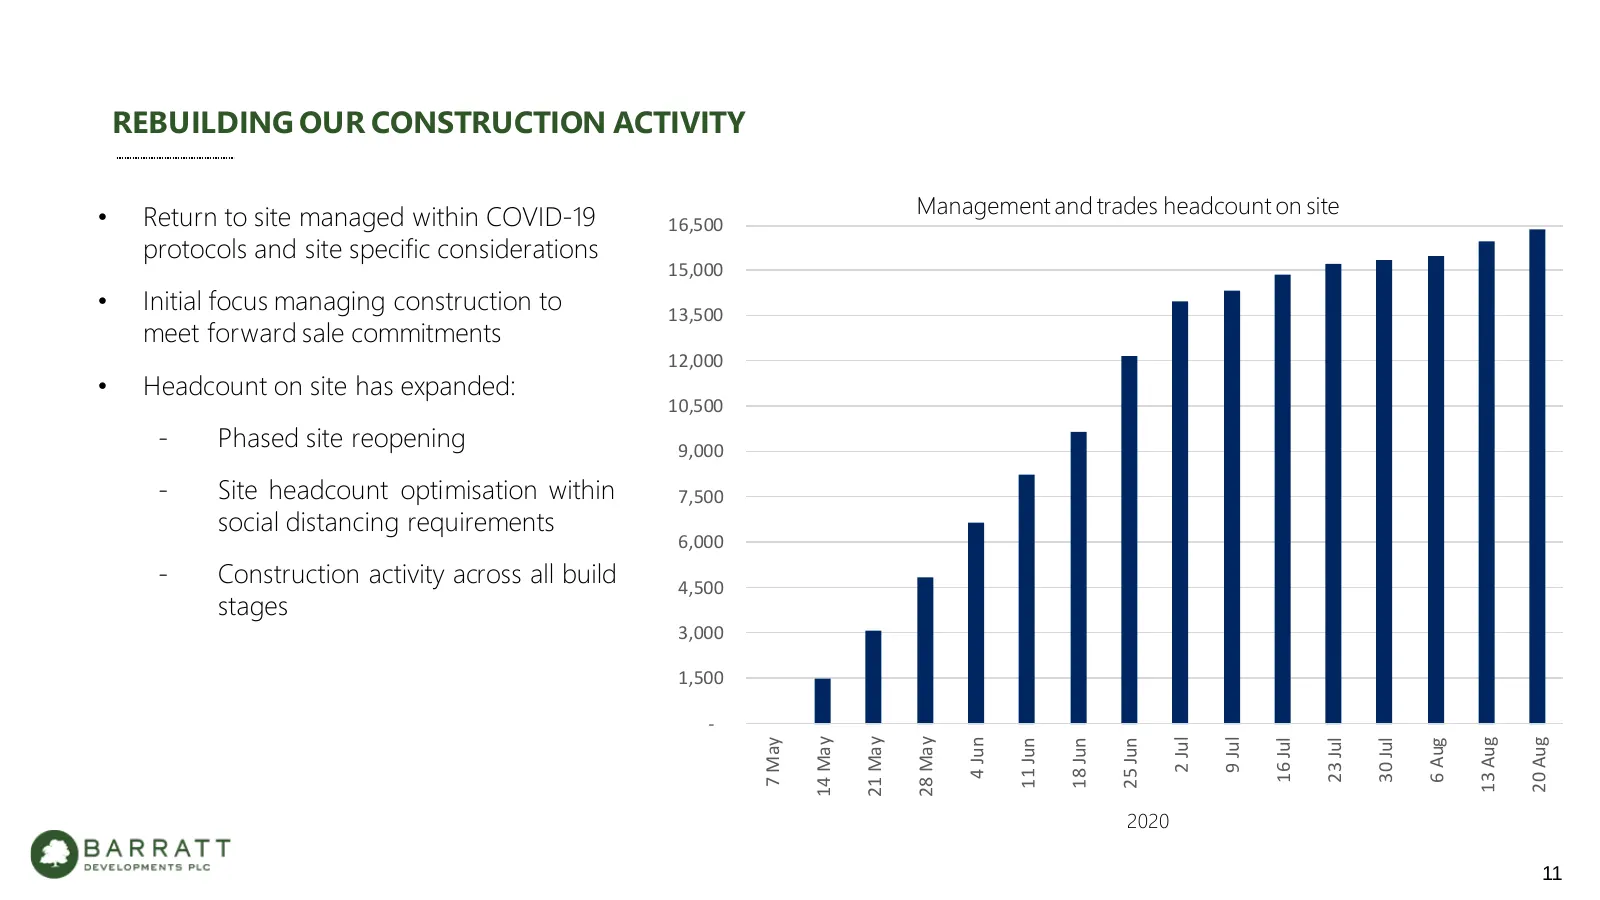
REBUILDING OUR CONSTRUCTION ACTIVITY Management and trades headcount on site • Return to site managed within COVID-19 16,500 protocols and site specific considerations 15,000 • Initial focus managing construction to 13,500 meet forward sale commitments 12,000 • Headcount on site has expanded: 10,500
Slide 12: Optimising Our Construction Activity
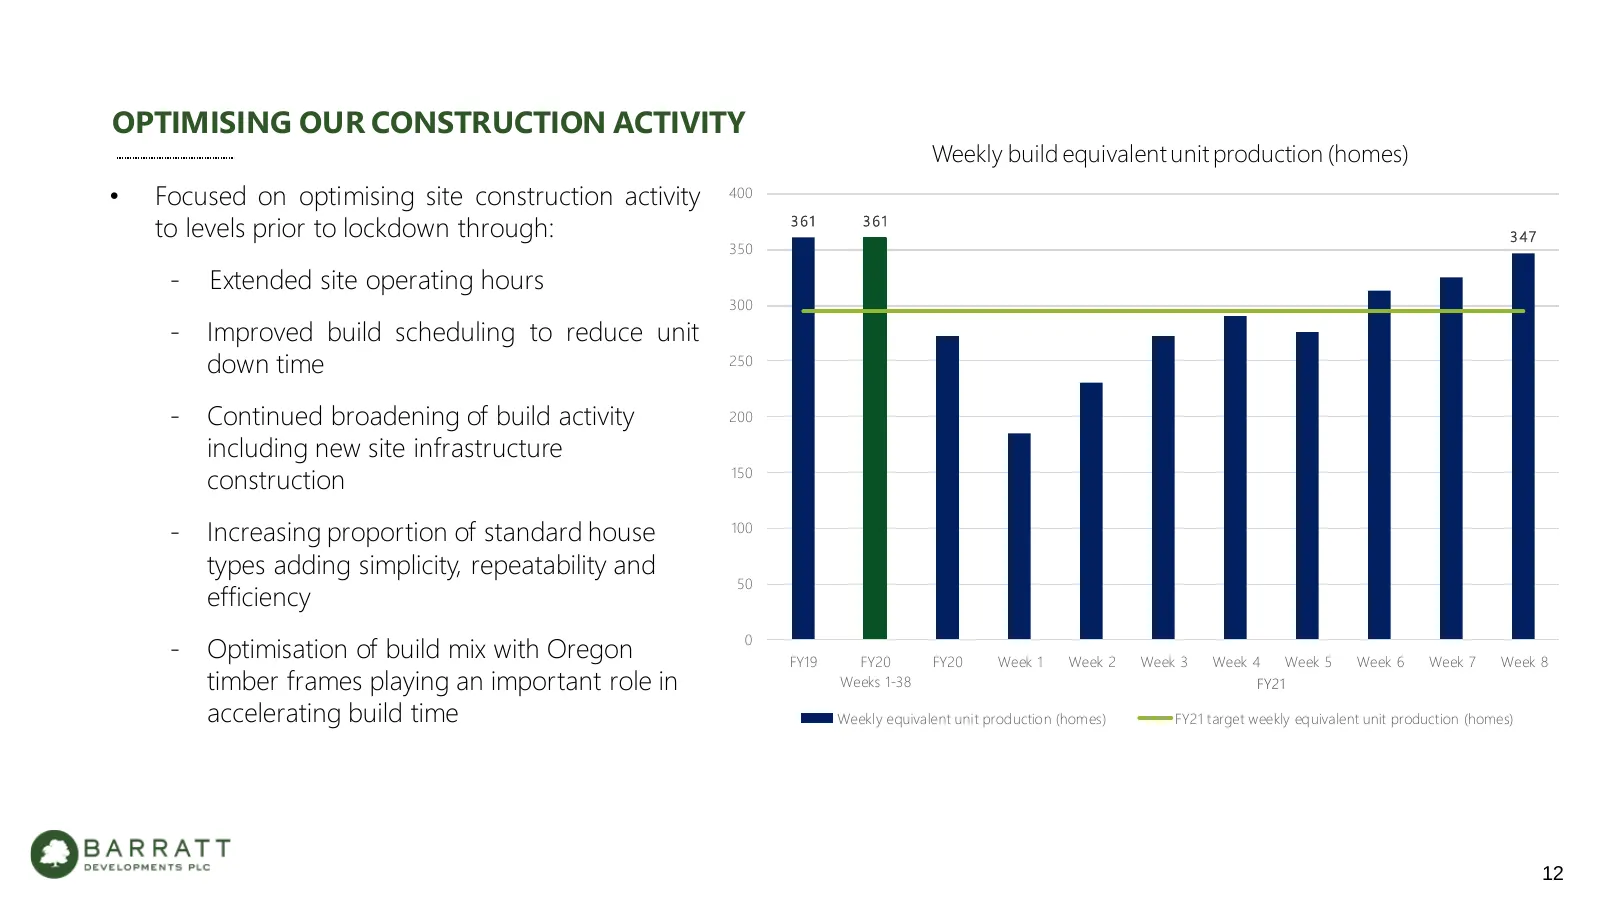
OPTIMISING OUR CONSTRUCTION ACTIVITY Weekly build equivalent unit production (homes) • Focused on optimising site construction activity 400 to levels prior to lockdown through: 361 361 347 350 - Extended site operating hours 300 - Improved build scheduling to reduce unit down time 250 - Continued br
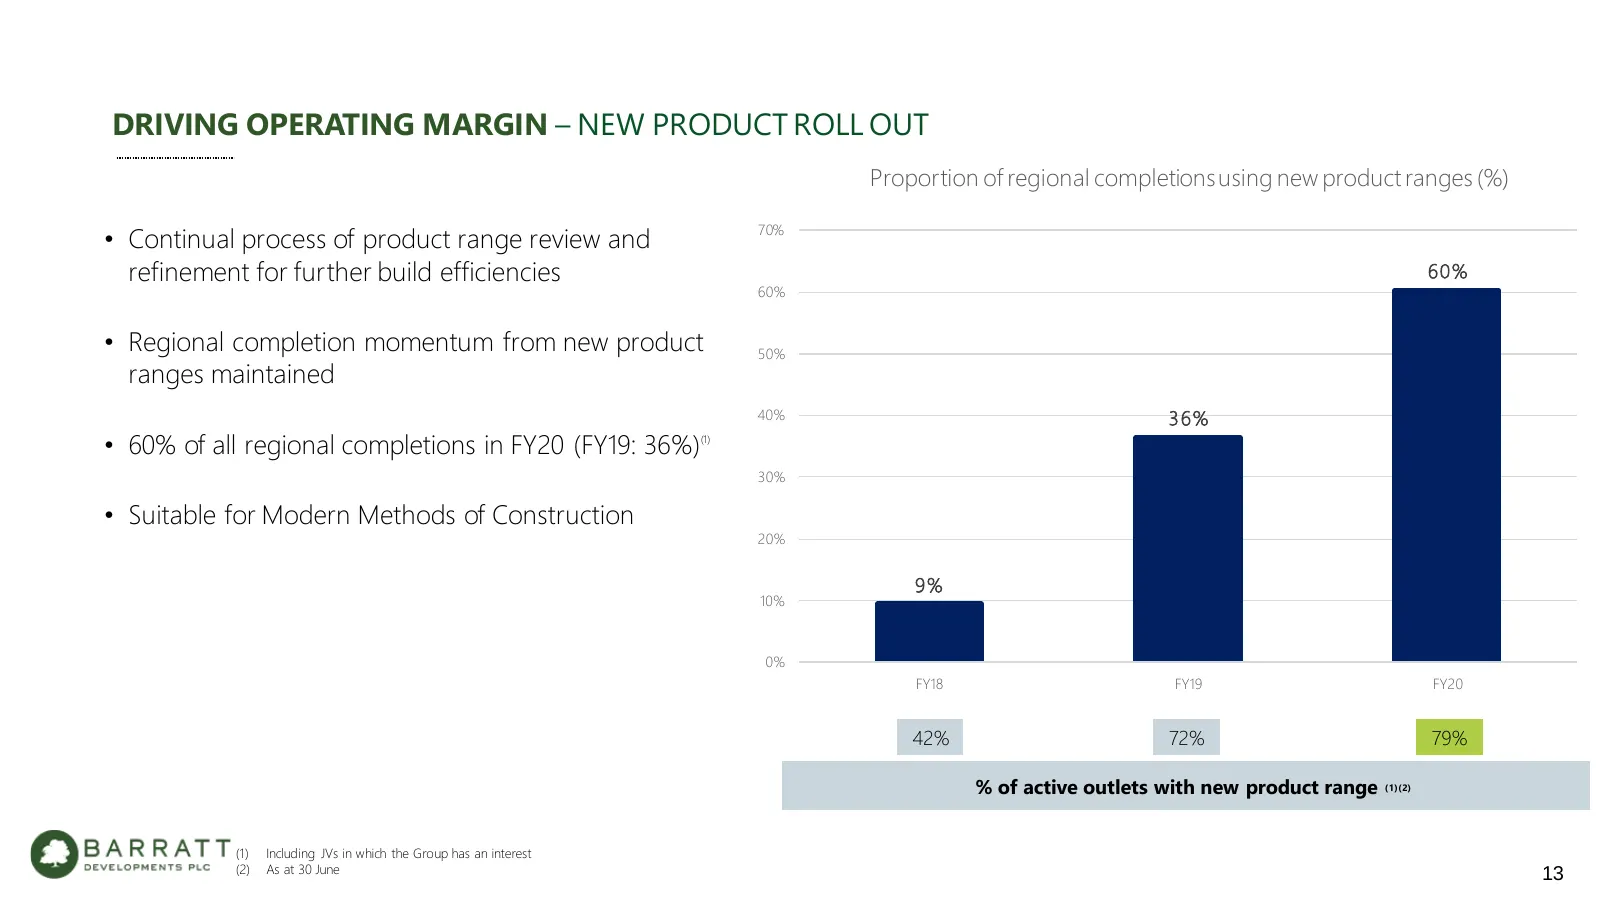
Slide 13: Driving Operating Margin – New Product Roll Out
DRIVING OPERATING MARGIN – NEW PRODUCT ROLL OUT Proportion of regional completions using new product ranges (%) 70% • Continual process of product range review and refinement for further build efficiencies 60% 60% • Regional completion momentum from new product 50% ranges maintained +19% 40% 36% • 6
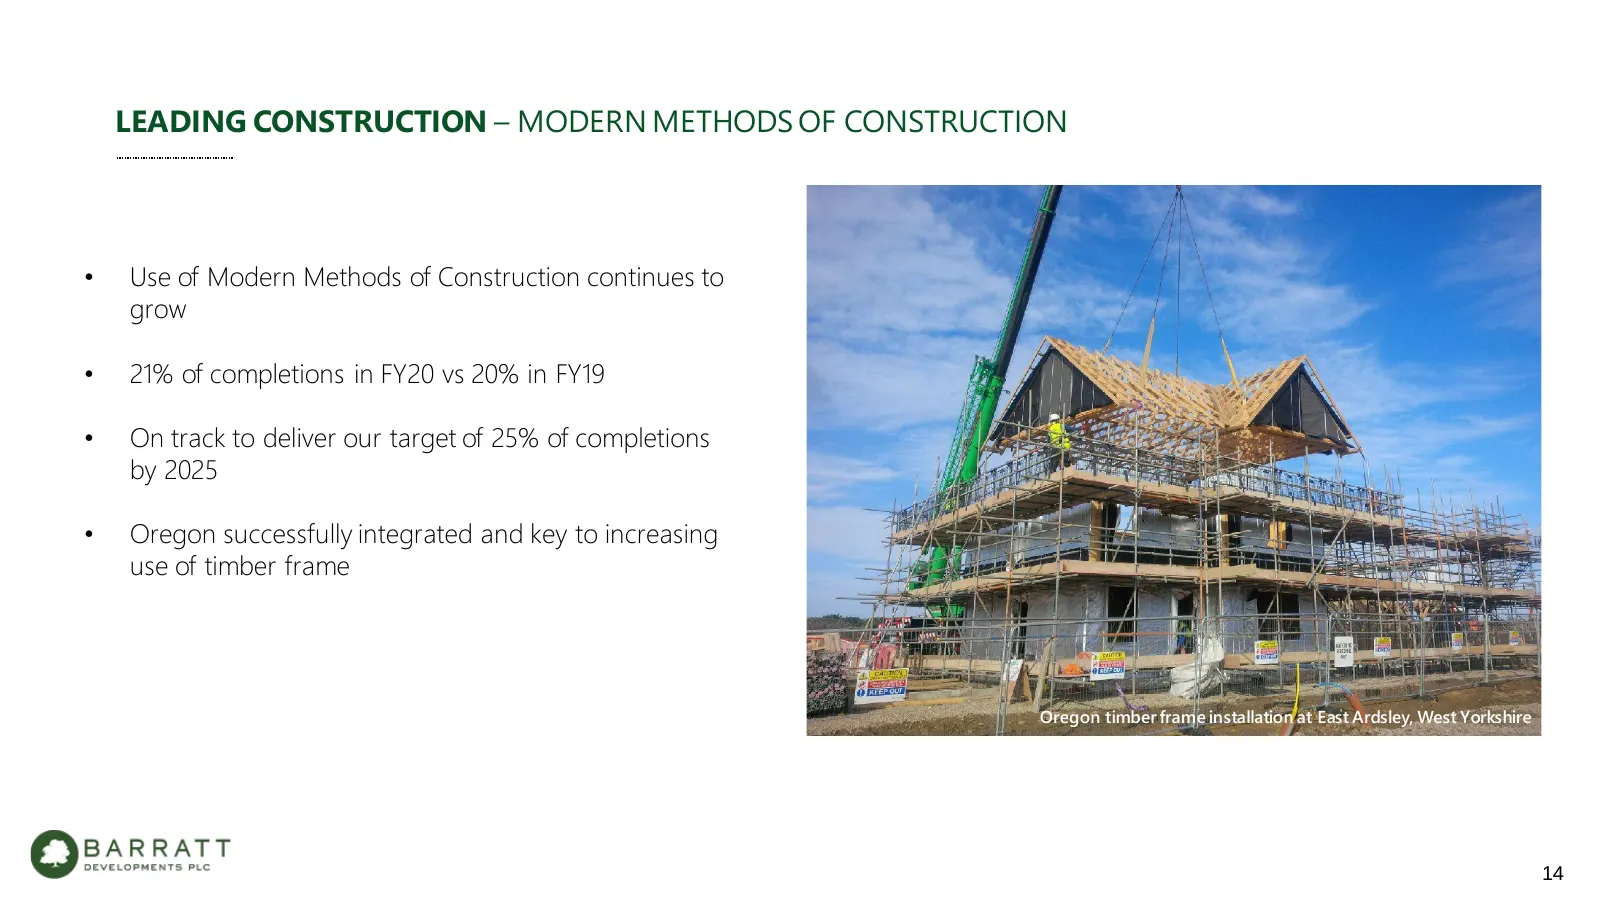
Slide 14: Leading Construction – Modern Methods of Construction
LEADING CONSTRUCTION – MODERN METHODS OF CONSTRUCTION • Use of Modern Methods of Construction continues to grow • 21% of completions in FY20 vs 20% in FY19 • On track to deliver our target of 25% of completions by 2025 • Oregon successfully integrated and key to increasing use of timber frame Oregon
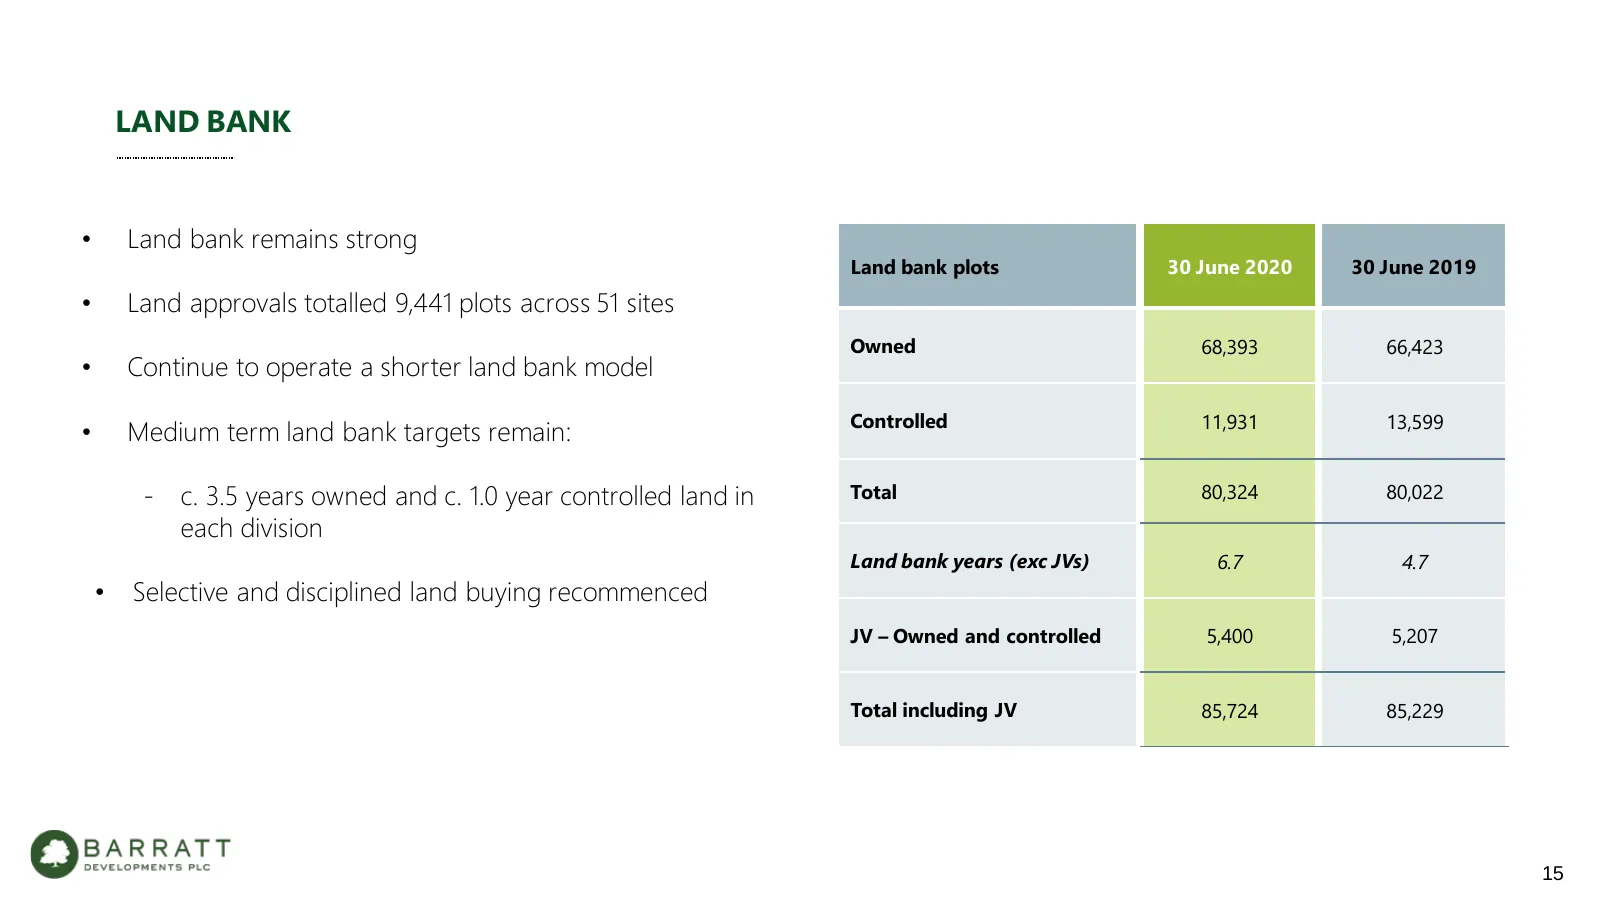
Slide 15: Land Bank
LAND BANK • Land bank remains strong Land bank plots 30 June 2020 30 June 2019 • Land approvals totalled 9,441 plots across 51 sites Owned 68,393 66,423 • Continue to operate a shorter land bank model Controlled 11,931 13,599 • Medium term land bank targets remain: - c. 3.5 years owned and c. 1.0 ye
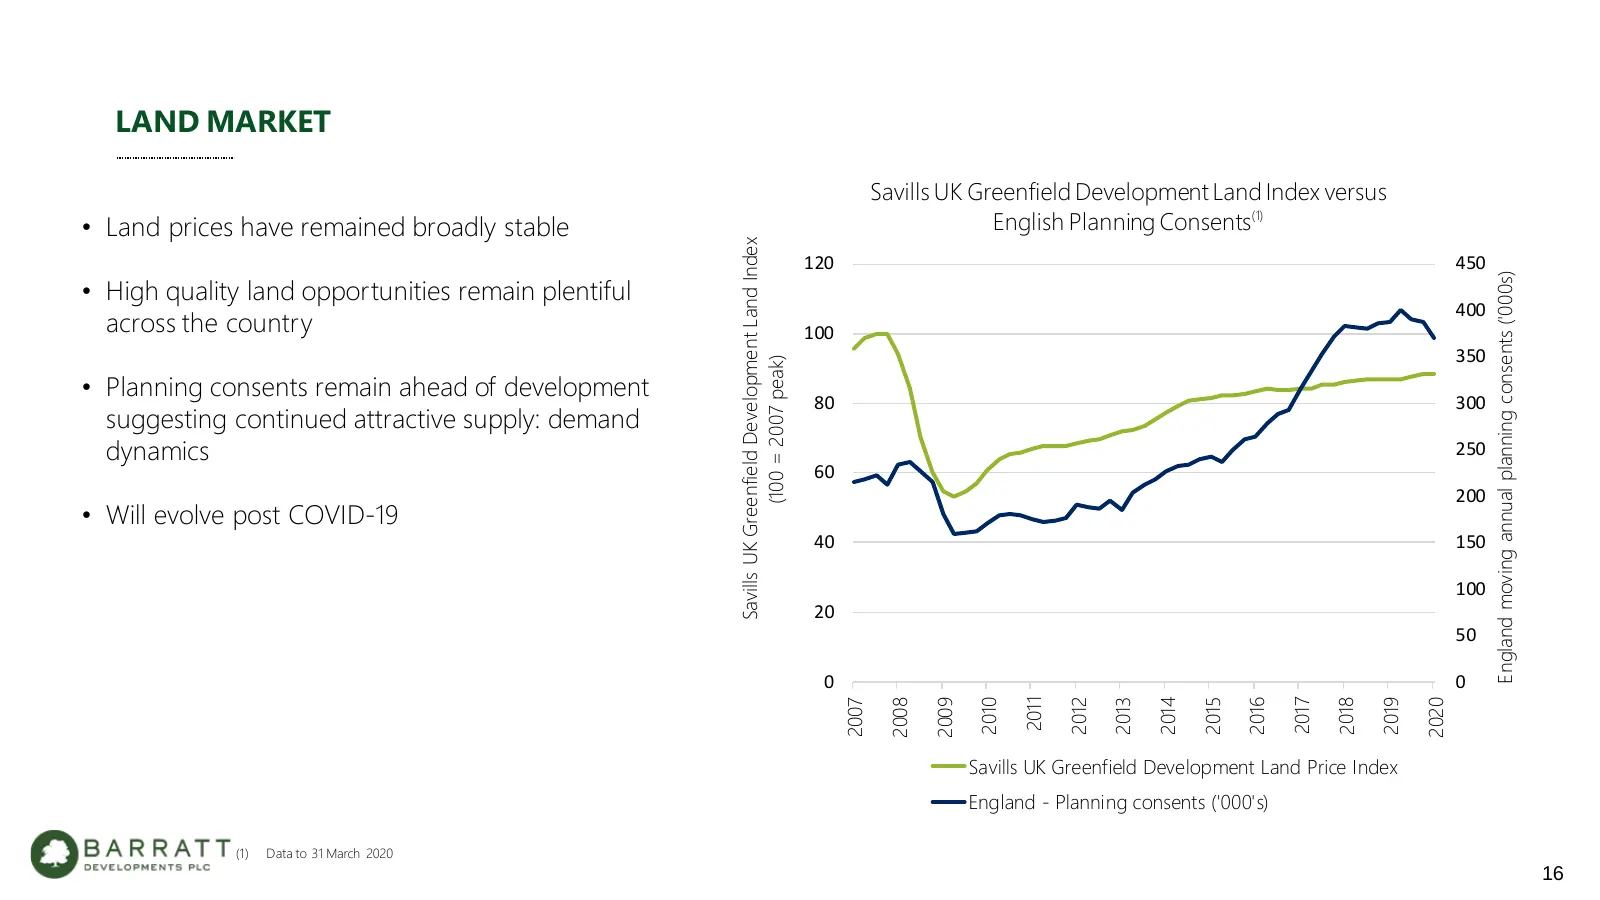
Slide 16: Land Market
LAND MARKET Savills UK Greenfield Development Land Index versus • Land prices have remained broadly stable English Planning Consents(1) HOLDING PICTURE – CB 450 Savills UK Greenfield Development Land Index 120 England moving annual planning consents ('000s) • High quality land opportunities remain p
Slide 17: Managing the Cost Environment
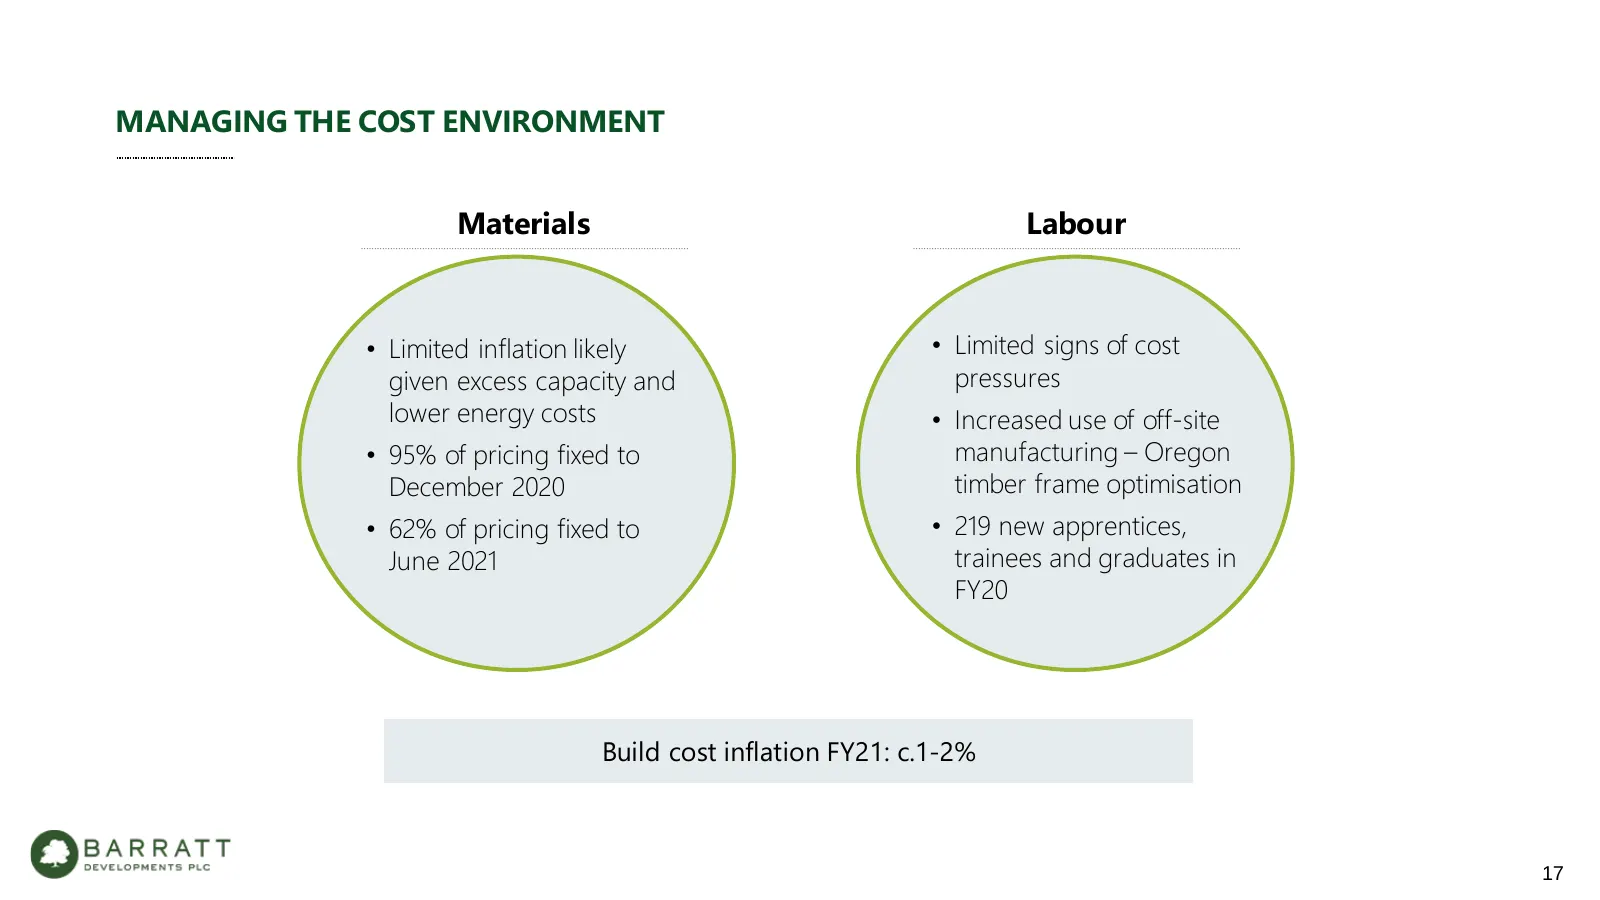
MANAGING THE COST ENVIRONMENT Materials Labour • Limited inflation likely • Limited signs of cost given excess capacity and pressures lower energy costs • Increased use of off-site • 95% of pricing fixed to manufacturing – Oregon December 2020 timber frame optimisation • 62% of pricing fixed to • 21
Slide 18: Summary
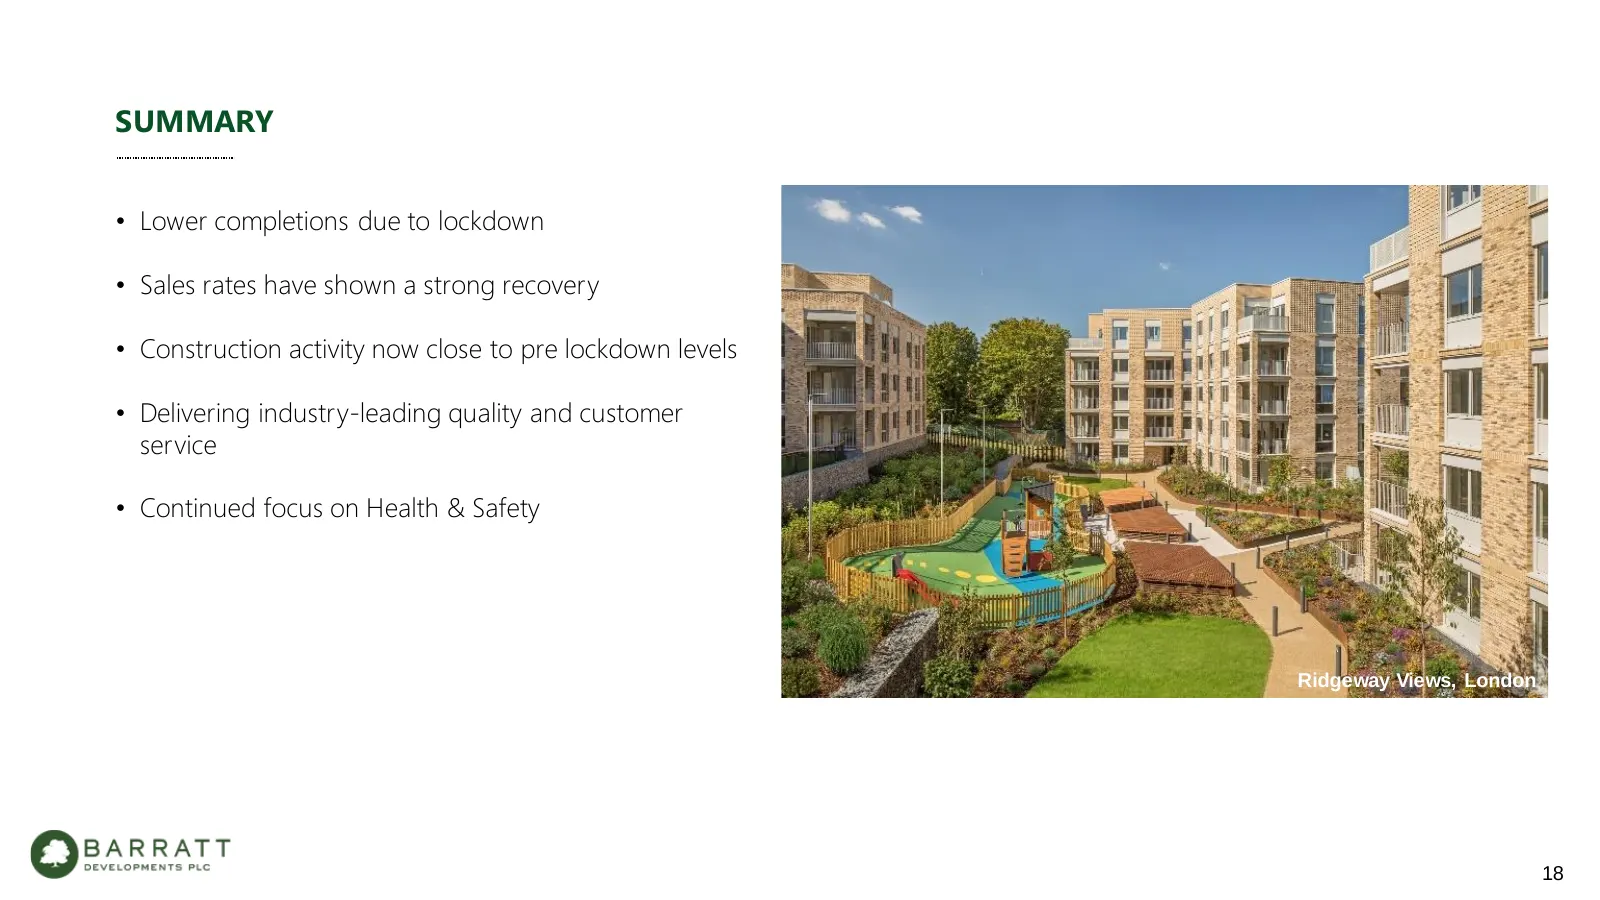
SUMMARY • Lower completions due to lockdown • Sales rates have shown a strong recovery • Construction activity now close to pre lockdown levels • Delivering industry-leading quality and customer service • Continued focus on Health & Safety Ridgeway Views, London Octavia Gardens, Chapel-en-le-Frith 1
Slide 19: Jessica White, Chief Financial Officer
Jessica White Chief Financial Officer Fairfield Croft, 19 York
Slide 20: Performance
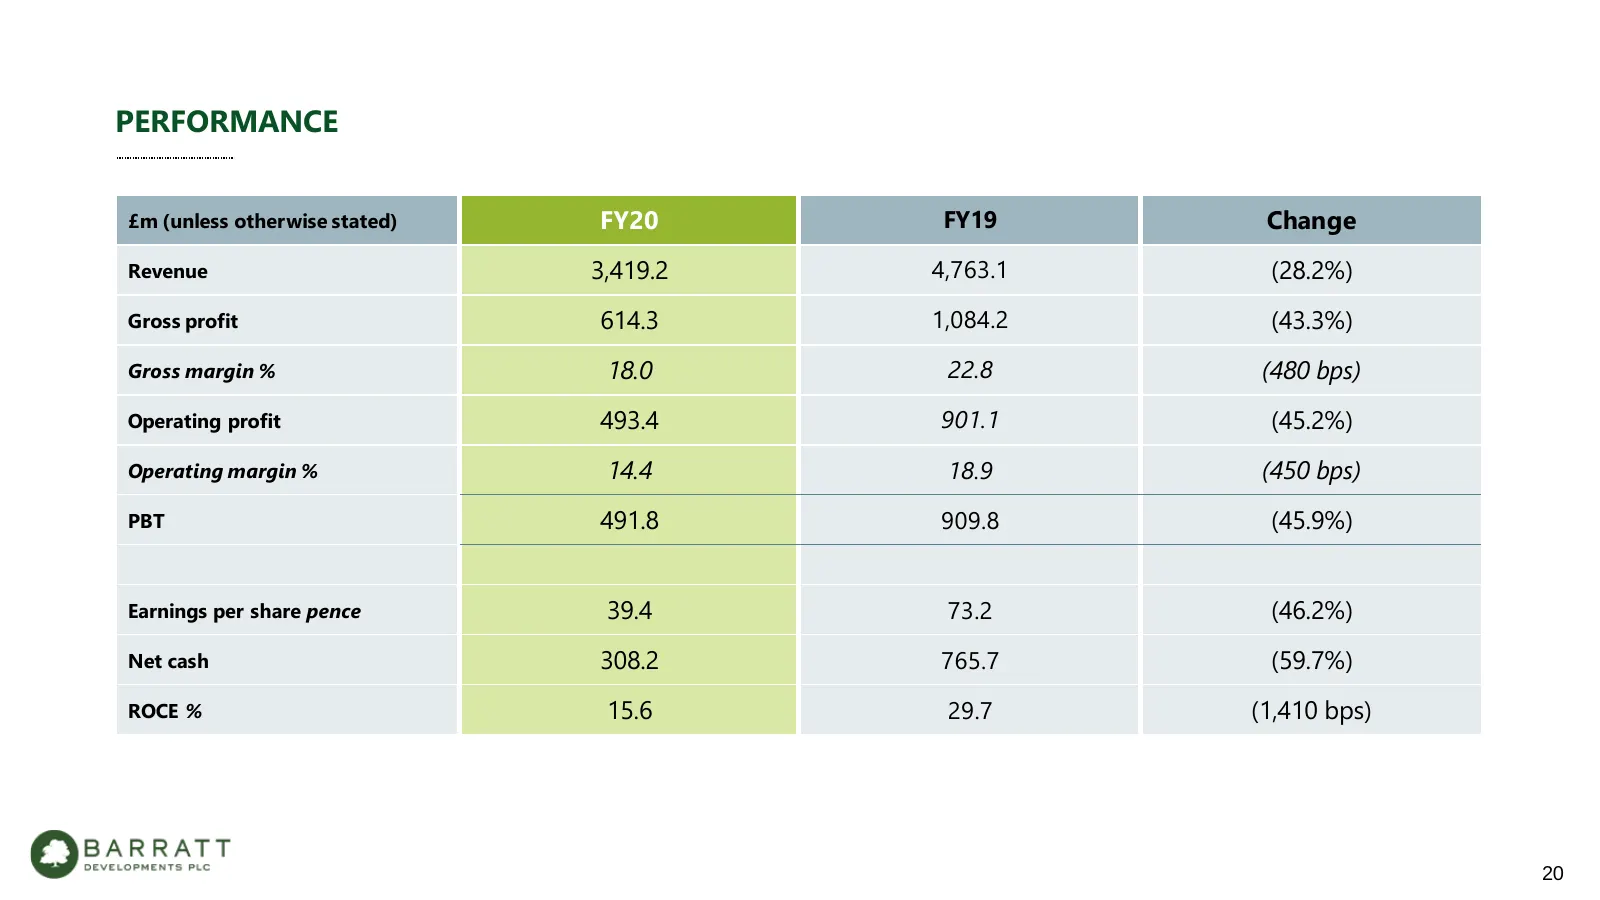
PERFORMANCE £m (unless otherwise stated) FY20 FY19 Change Revenue 3,419.2 4,763.1 (28.2%) Gross profit 614.3 1,084.2 (43.3%) Gross margin % 18.0 22.8 (480 bps) Operating profit 493.4 901.1 (45.2%) Operating margin % 14.4 18.9 (450 bps) PBT 491.8 909.8 (45.9%) Earnings per share pence 39.4 73.2 (46.2
Slide 21: Revenue Summary
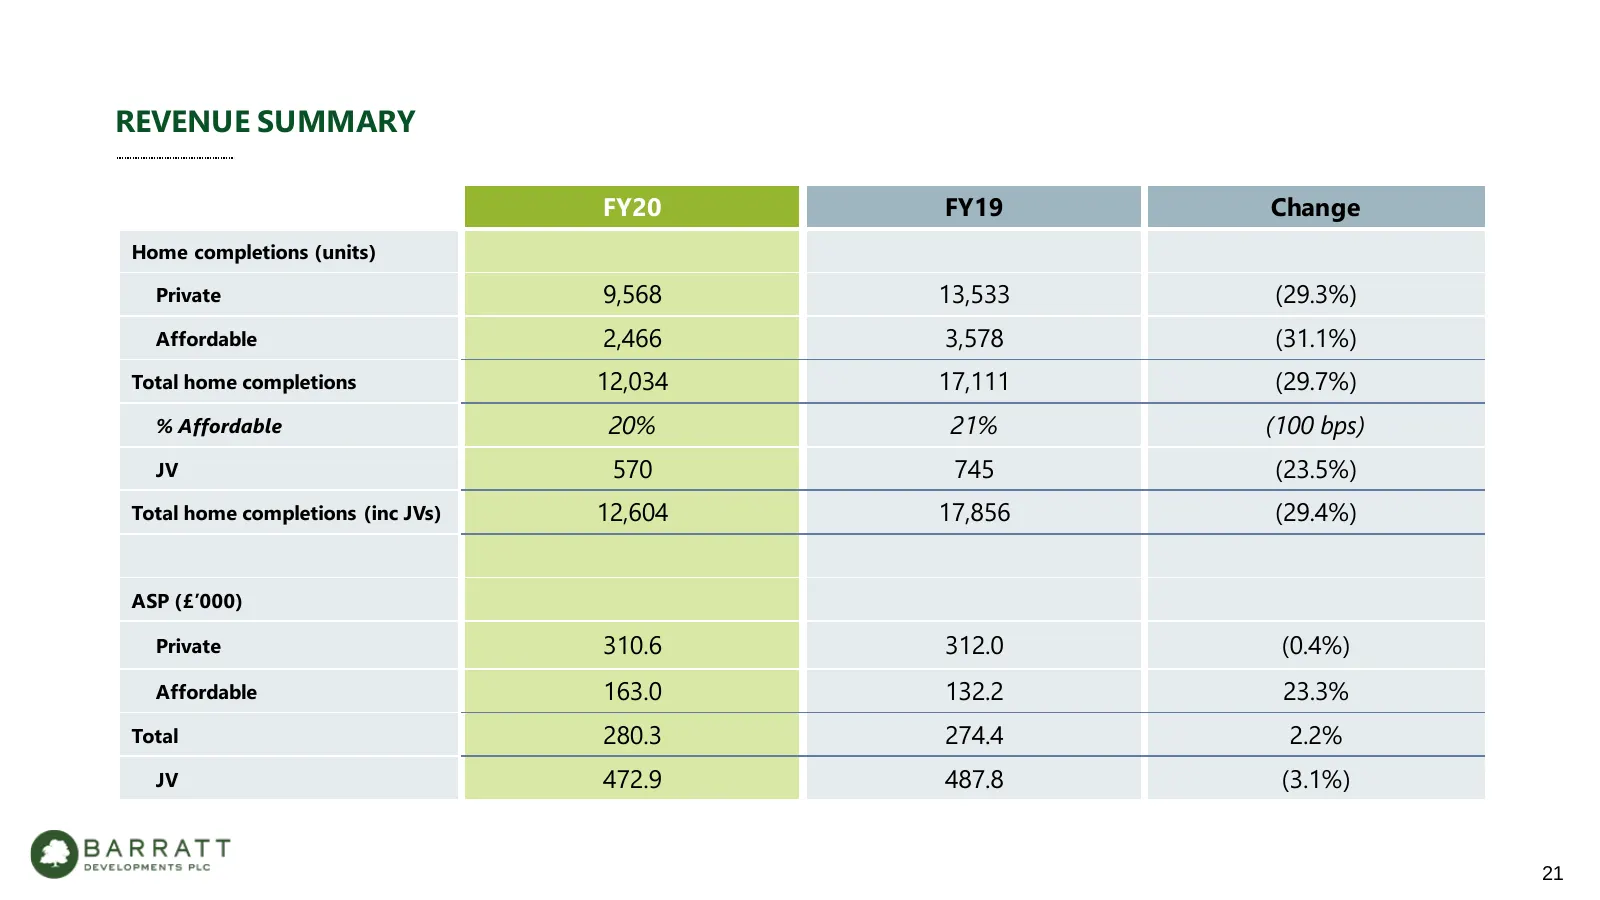
REVENUE SUMMARY FY20 FY19 Change Home completions (units) Private 9,568 13,533 (29.3%) Affordable 2,466 3,578 (31.1%) Total home completions 12,034 17,111 (29.7%) % Affordable 20% 21% (100 bps) JV 570 745 (23.5%) Total home completions (inc JVs) 12,604 17,856 (29.4%) ASP (£’000) Private 310.6 312.0
Slide 22: COVID-19 Impact and Adjusted Items
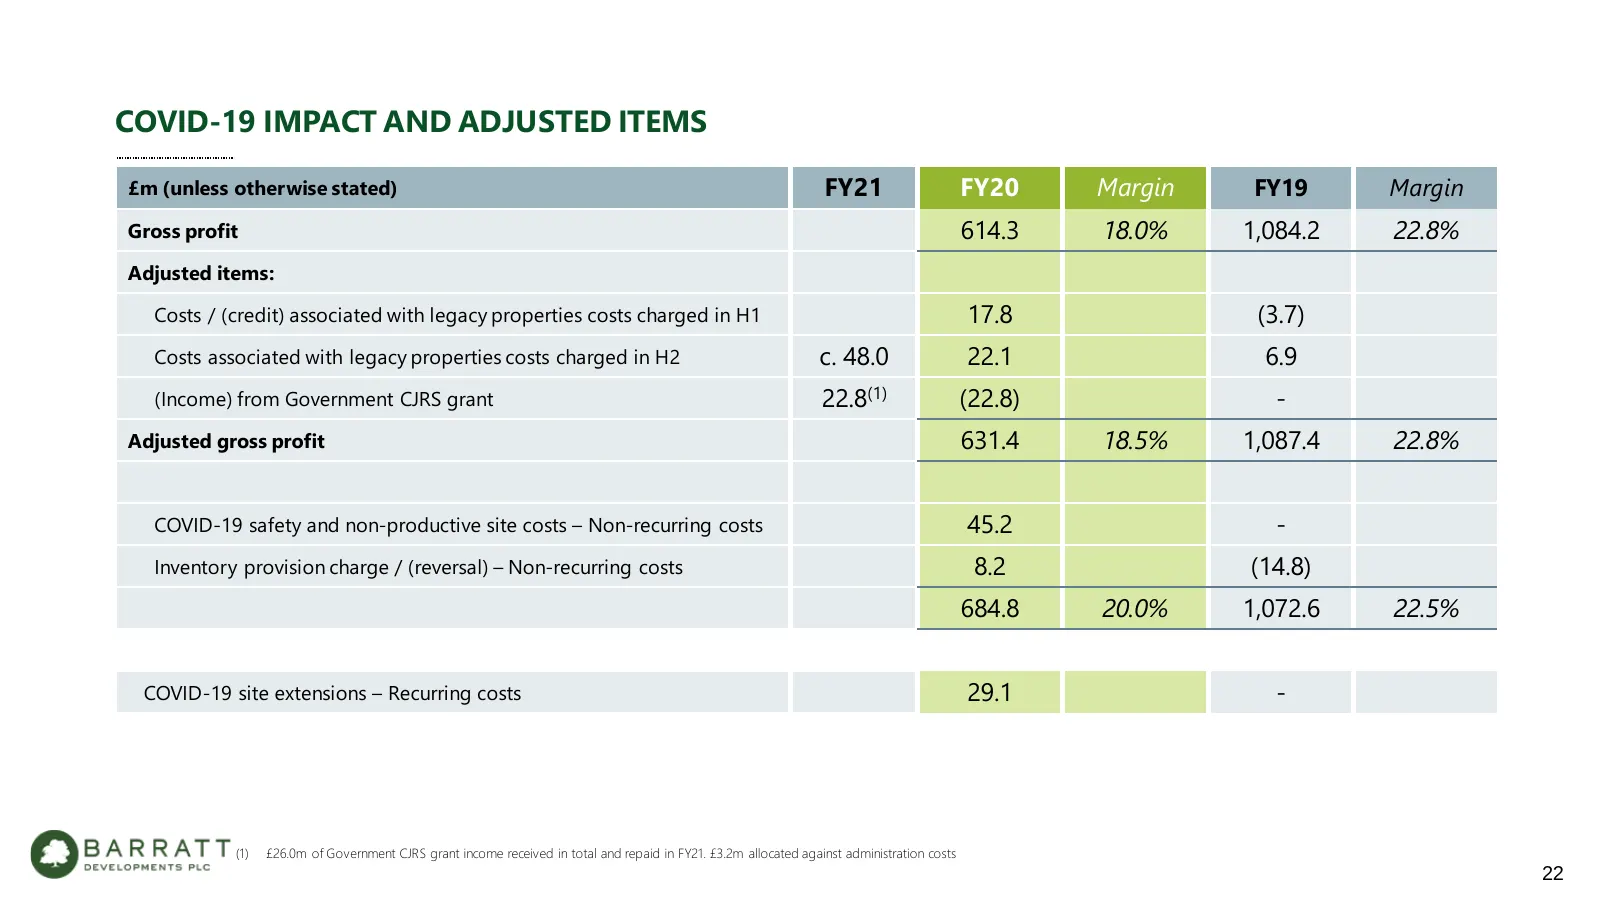
COVID-19 IMPACT AND ADJUSTED ITEMS £m (unless otherwise stated) FY21 FY20 Margin FY19 Margin Gross profit 614.3 18.0% 1,084.2 22.8% Adjusted items: Costs / (credit) associated with legacy properties costs charged in H1 17.8 (3.7) Costs associated with legacy properties costs charged in H2 c. 48.0 22
Slide 23: Operating Margin Bridge
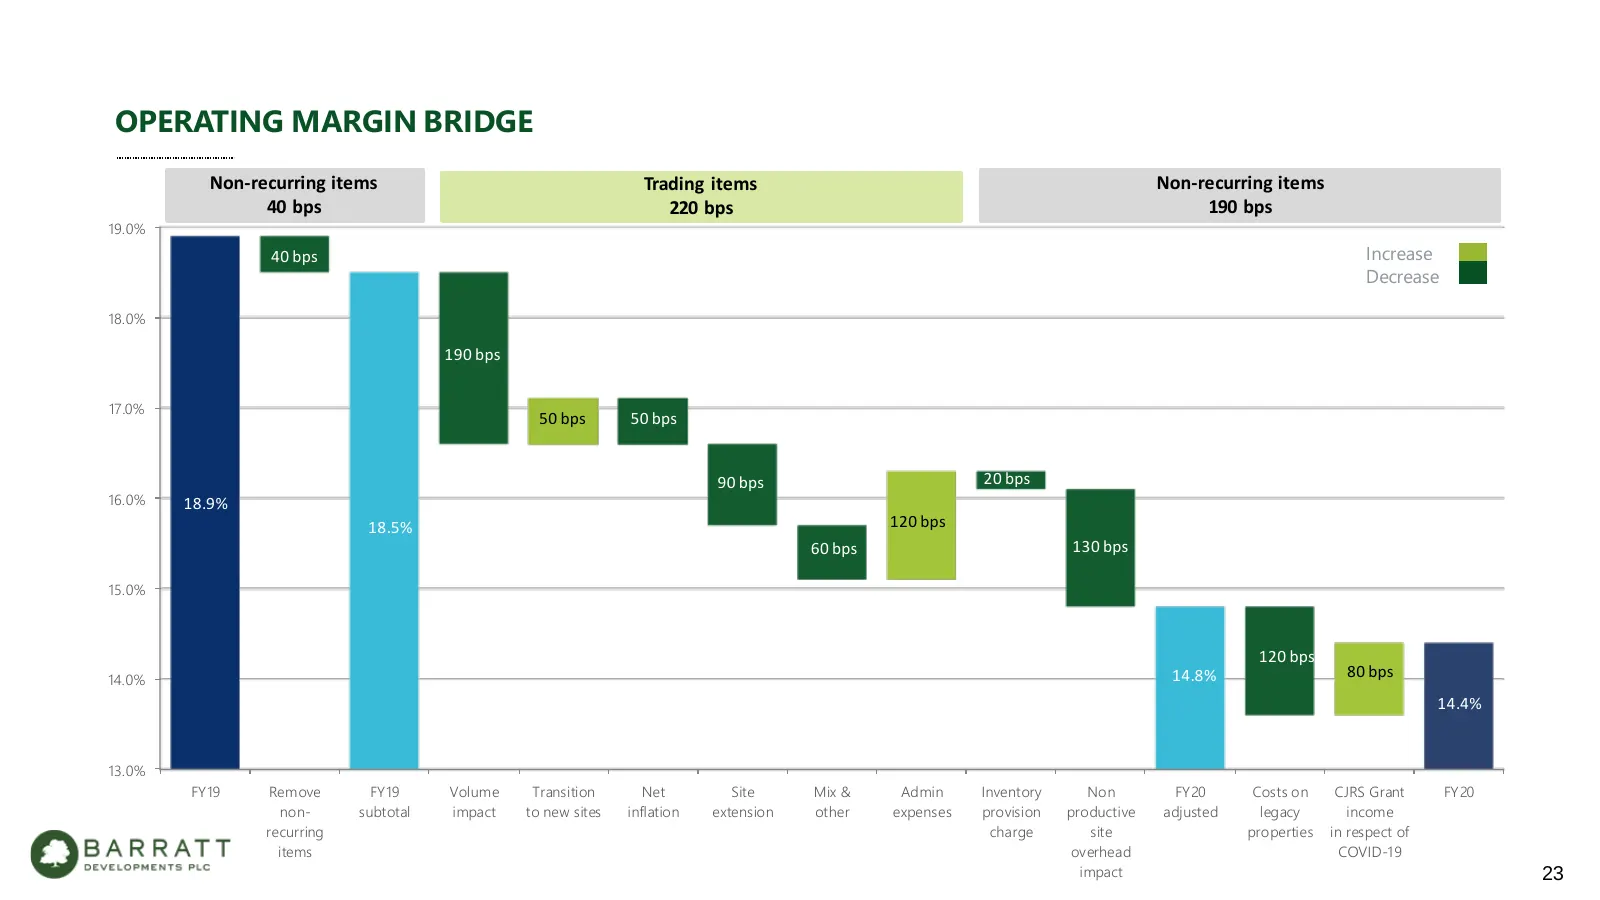
OPERATING MARGIN BRIDGE Non-recurring items Trading items Non-recurring items 40 bps 220 bps 190 bps 19.0% 40 bps Increase Decrease 18.0% 190 bps 17.0% 50 bps 50 bps 90 bps 20 bps 16.0% 18.9% 18.5% 120 bps 60 bps 130 bps 15.0% 120 bps 14.0% 14.8% 80 bps 14.4% 13.0% FY19 Remove FY19 Volume Transition
Slide 24: Operating Framework
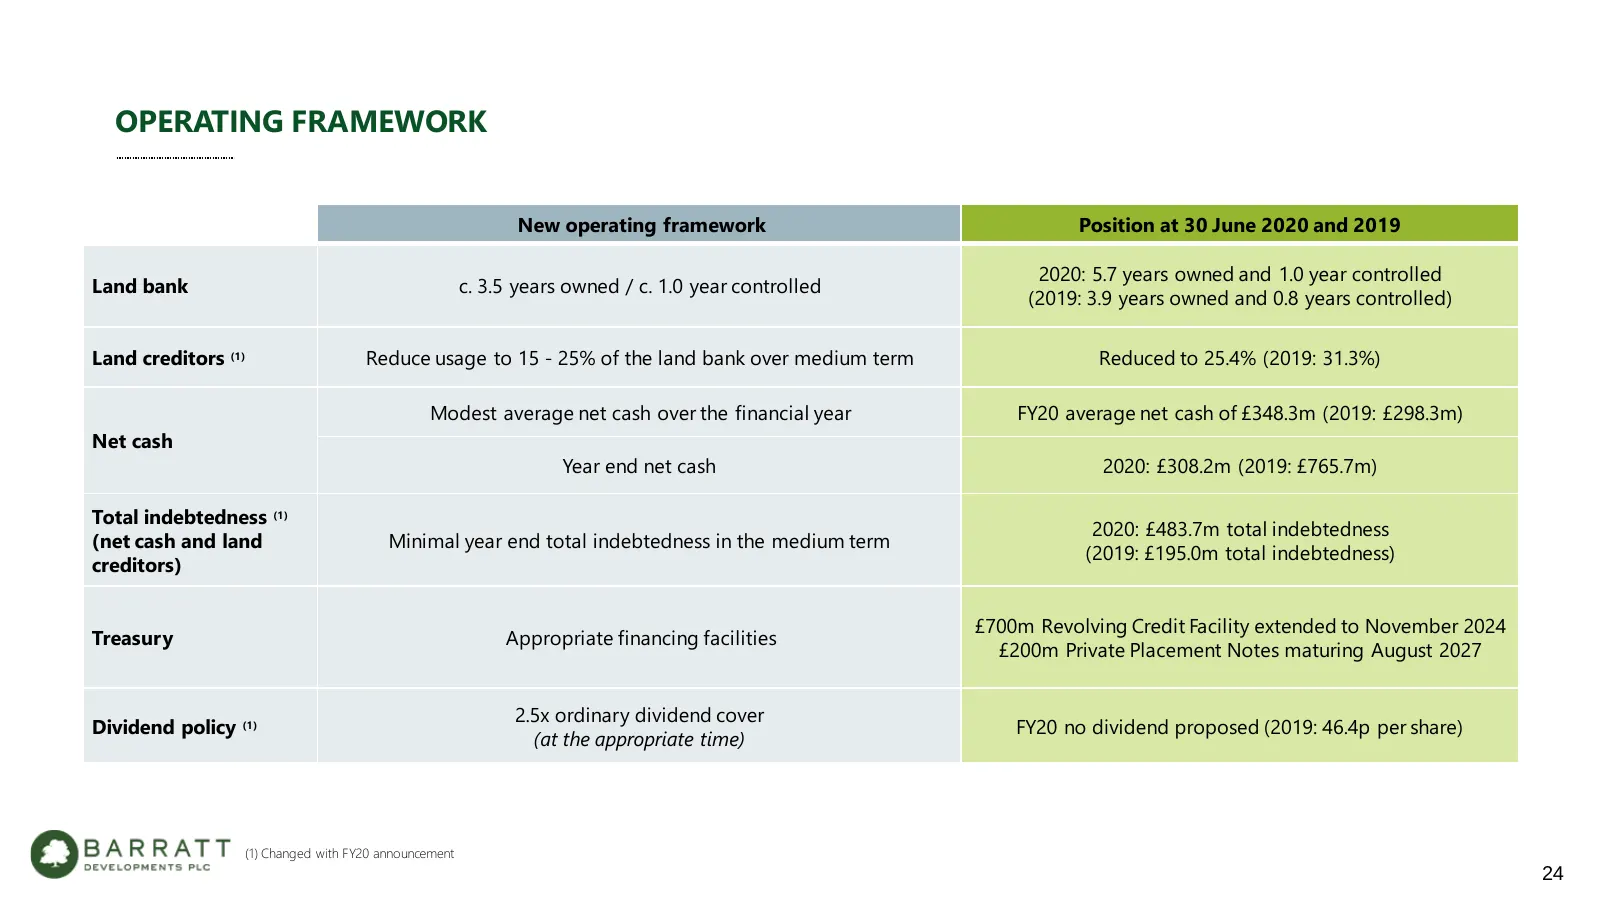
OPERATING FRAMEWORK New operating framework Position at 30 June 2020 and 2019 2020: 5.7 years owned and 1.0 year controlled Land bank c. 3.5 years owned / c. 1.0 year controlled (2019: 3.9 years owned and 0.8 years controlled) Land creditors (1) Reduce usage to 15 - 25% of the land bank over medium
Slide 25: Balance Sheet
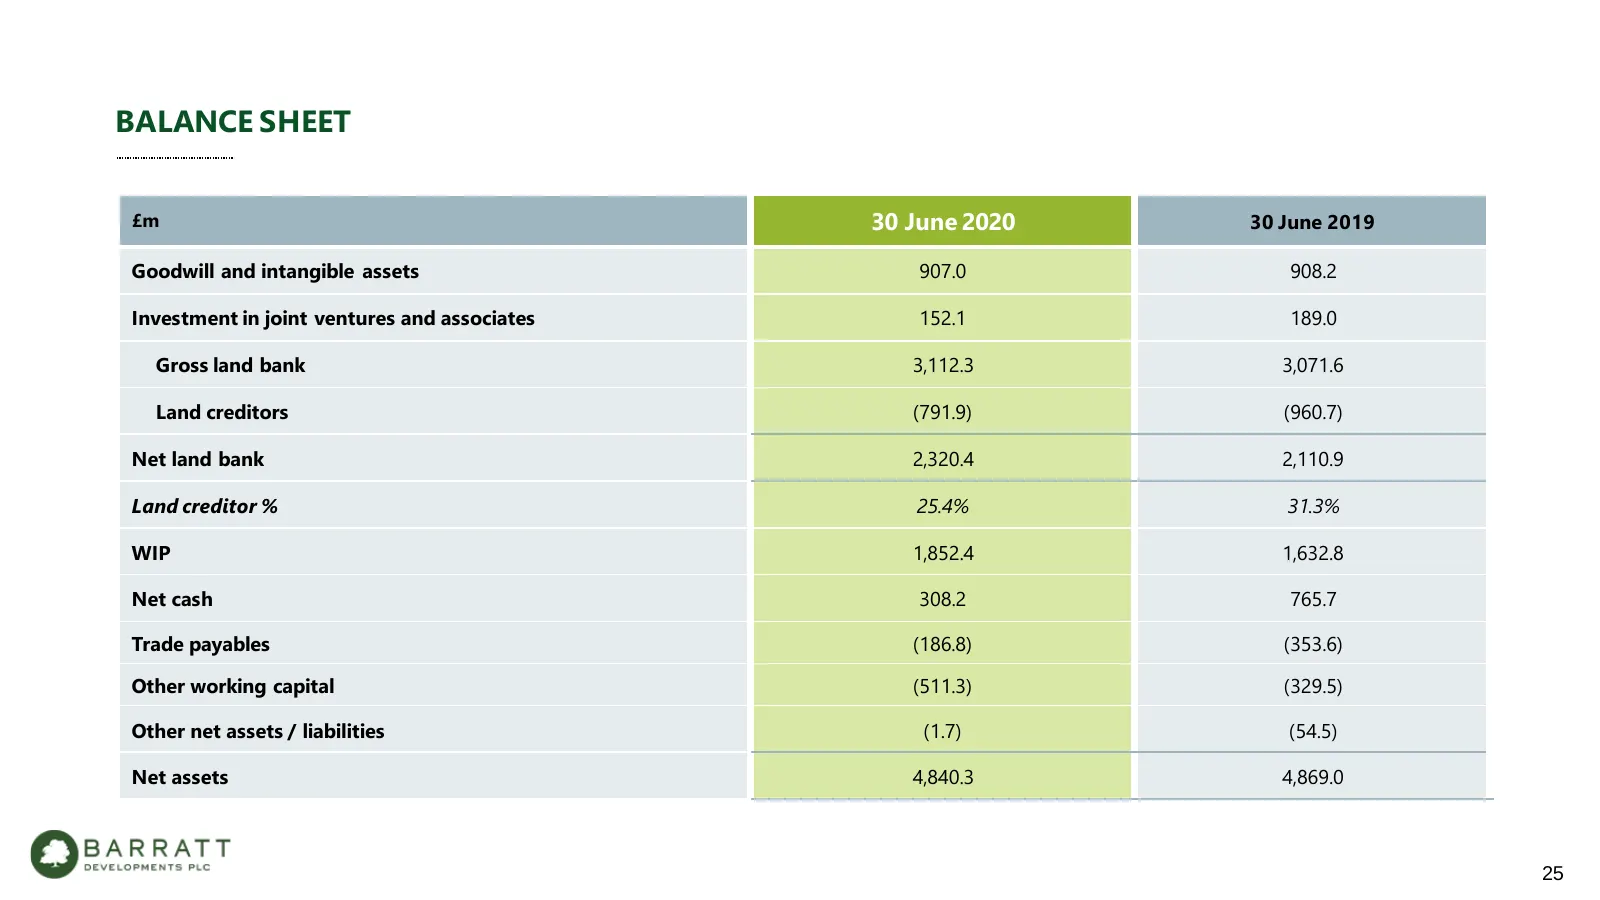
BALANCE SHEET £m 30 June 2020 30 June 2019 Goodwill and intangible assets 907.0 908.2 Investment in joint ventures and associates 152.1 189.0 Gross land bank 3,112.3 3,071.6 Land creditors (791.9) (960.7) Net land bank 2,320.4 2,110.9 Land creditor % 25.4% 31.3% WIP 1,852.4 1,632.8 Net cash 308.2 76
Slide 26: Cash Flow
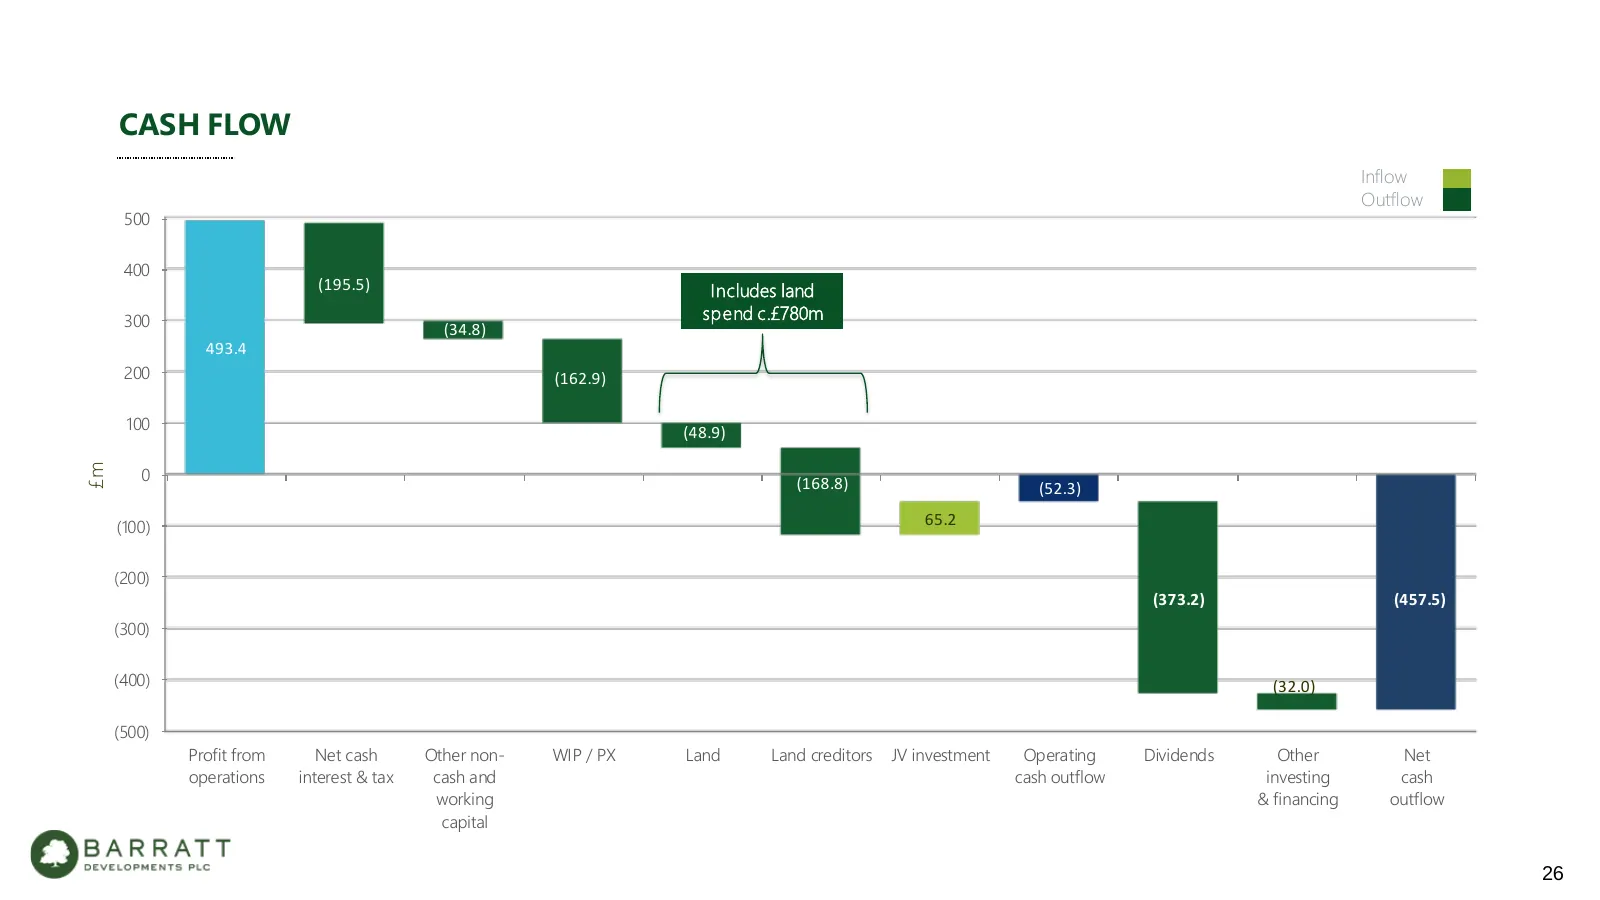
CASH FLOW Inflow Outflow 500 400 (195.5) Includes land 300 spend c.£780m (34.8) 493.4 200 (162.9) 100 (48.9) £m 0 (168.8) (52.3) (100) 65.2 (200) (373.2) (457.5) (300) (400) (32.0) (500) Profit from Net cash Other non- WIP / PX Land Land creditors JV investment Operating Dividends Other Net operatio
Slide 27: Guidance for FY21
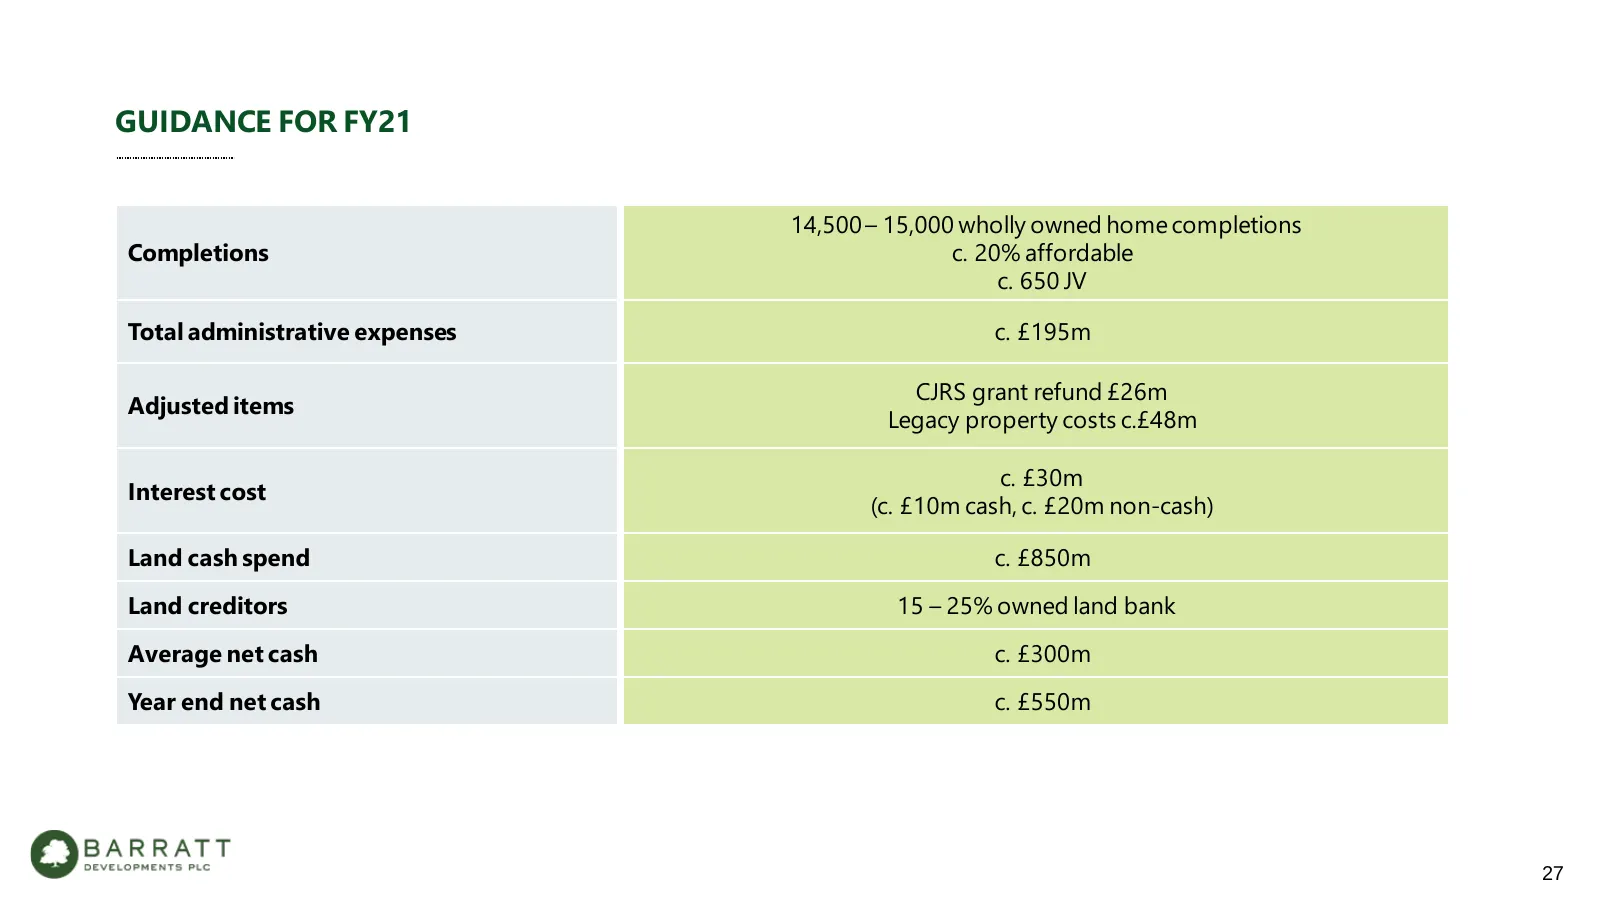
GUIDANCE FOR FY21 14,500 – 15,000 wholly owned home completions Completions c. 20% affordable c. 650 JV Total administrative expenses c. £195m CJRS grant refund £26m Adjusted items Legacy property costs c.£48m c. £30m Interest cost (c. £10m cash, c. £20m non-cash) Land cash spend c. £850m Land credi
Slide 28: Financial Summary
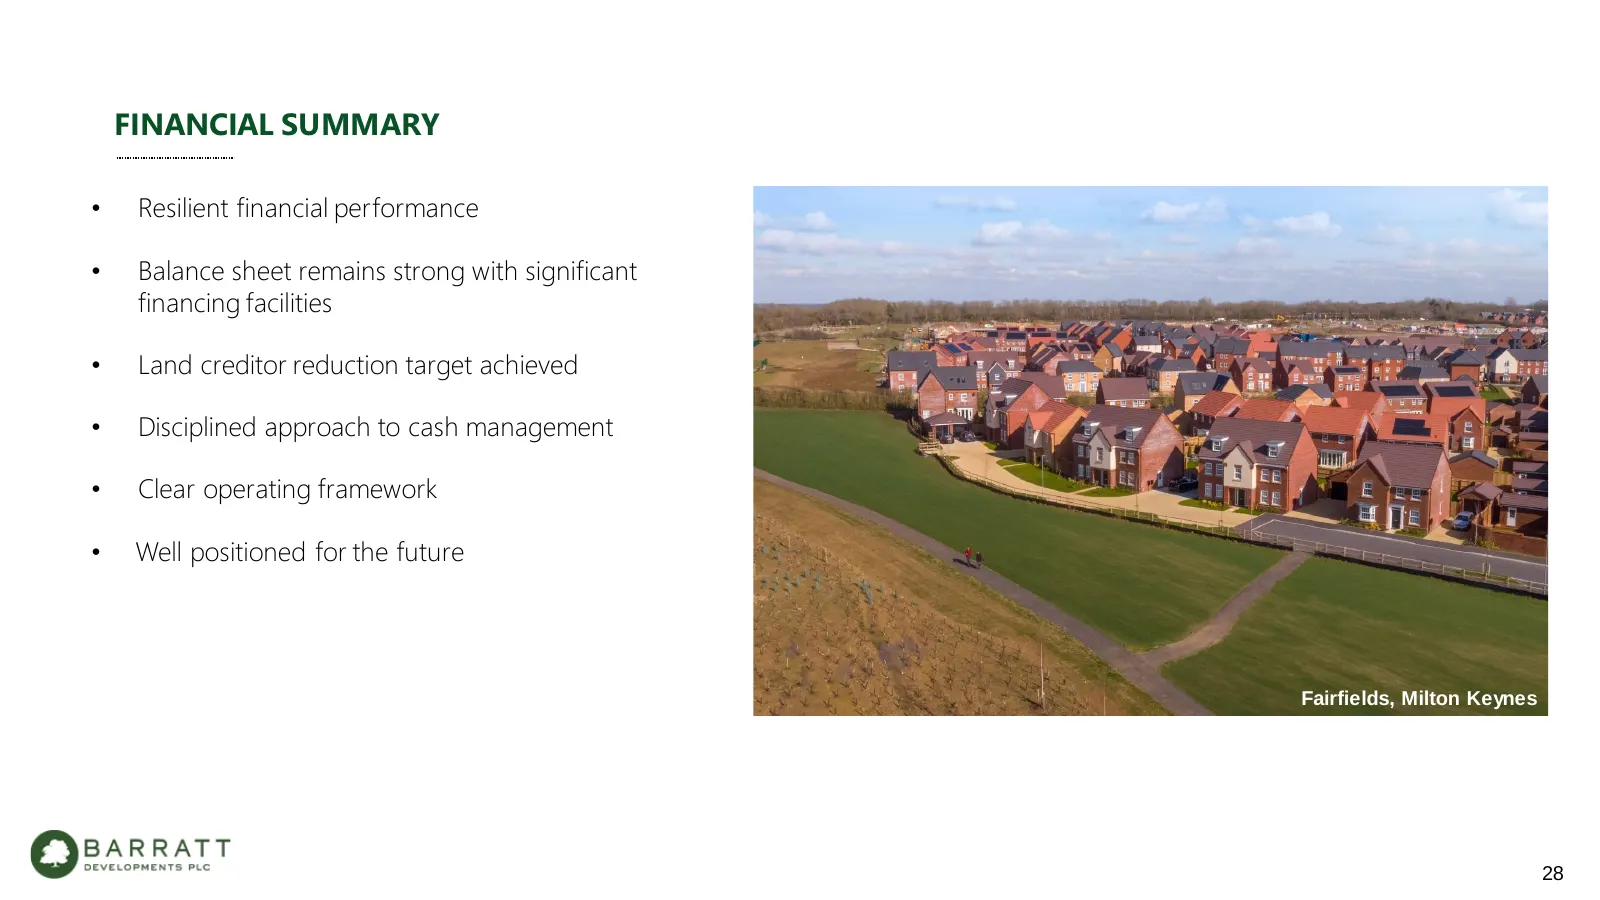
FINANCIAL SUMMARY • Resilient financial performance • Balance sheet remains strong with significant financing facilities • Land creditor reduction target achieved • Disciplined approach to cash management • Clear operating framework • Well positioned for the future Cricket Field Grove, Crowthorne Fa
Slide 29: David Thomas, Chief Executive
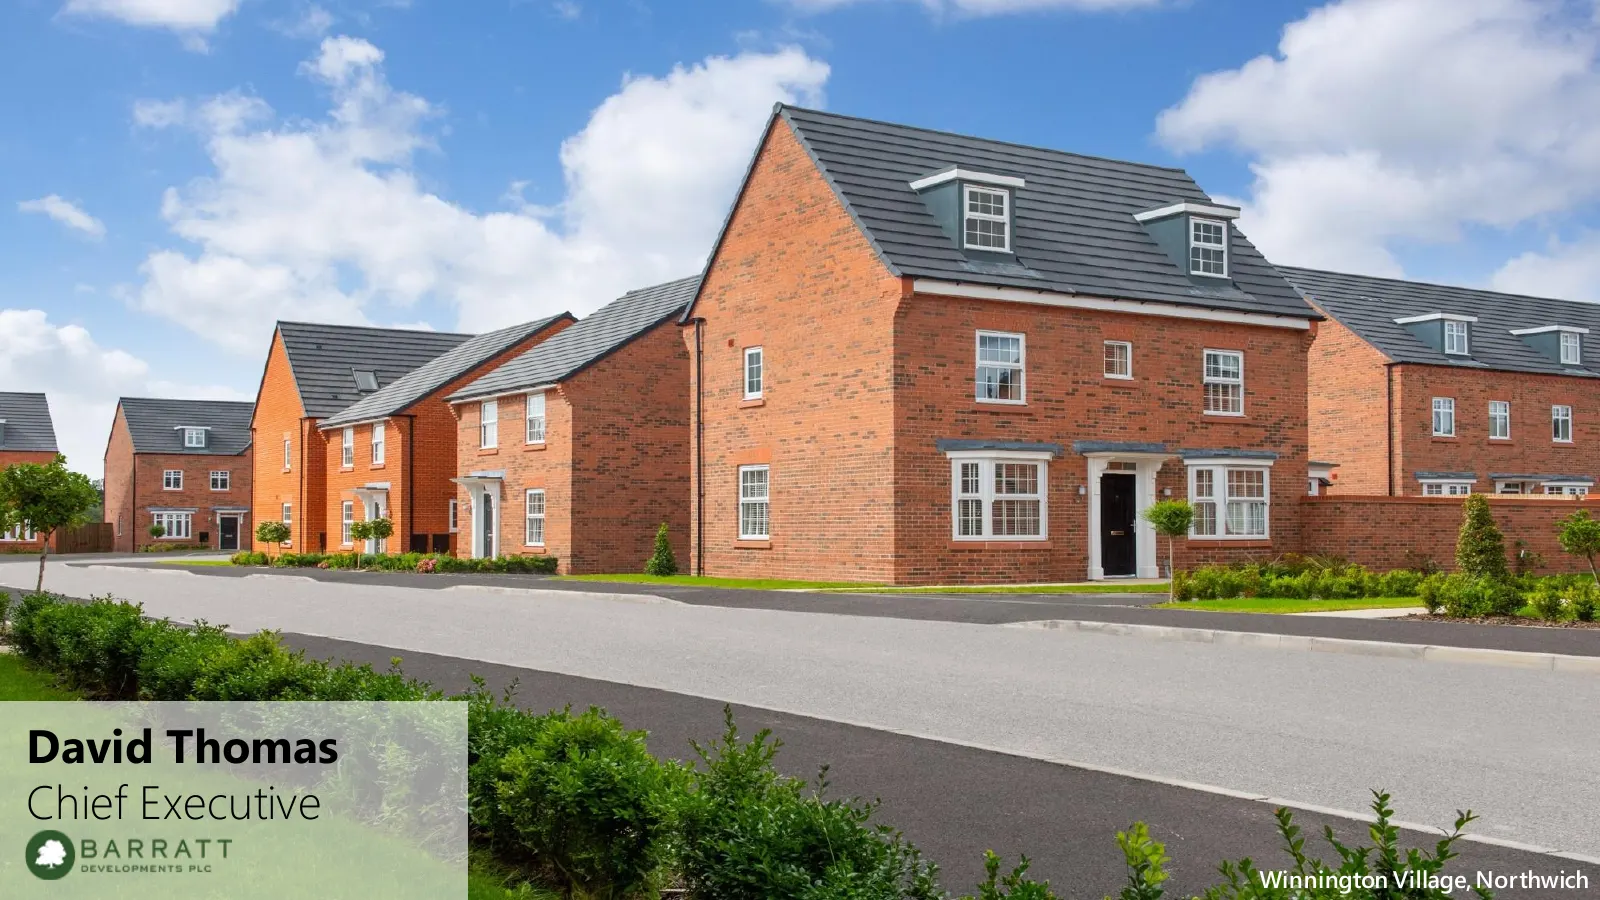
David Thomas Chief Executive Winnington Village, Northwich 29
Slide 30: Investment Proposition
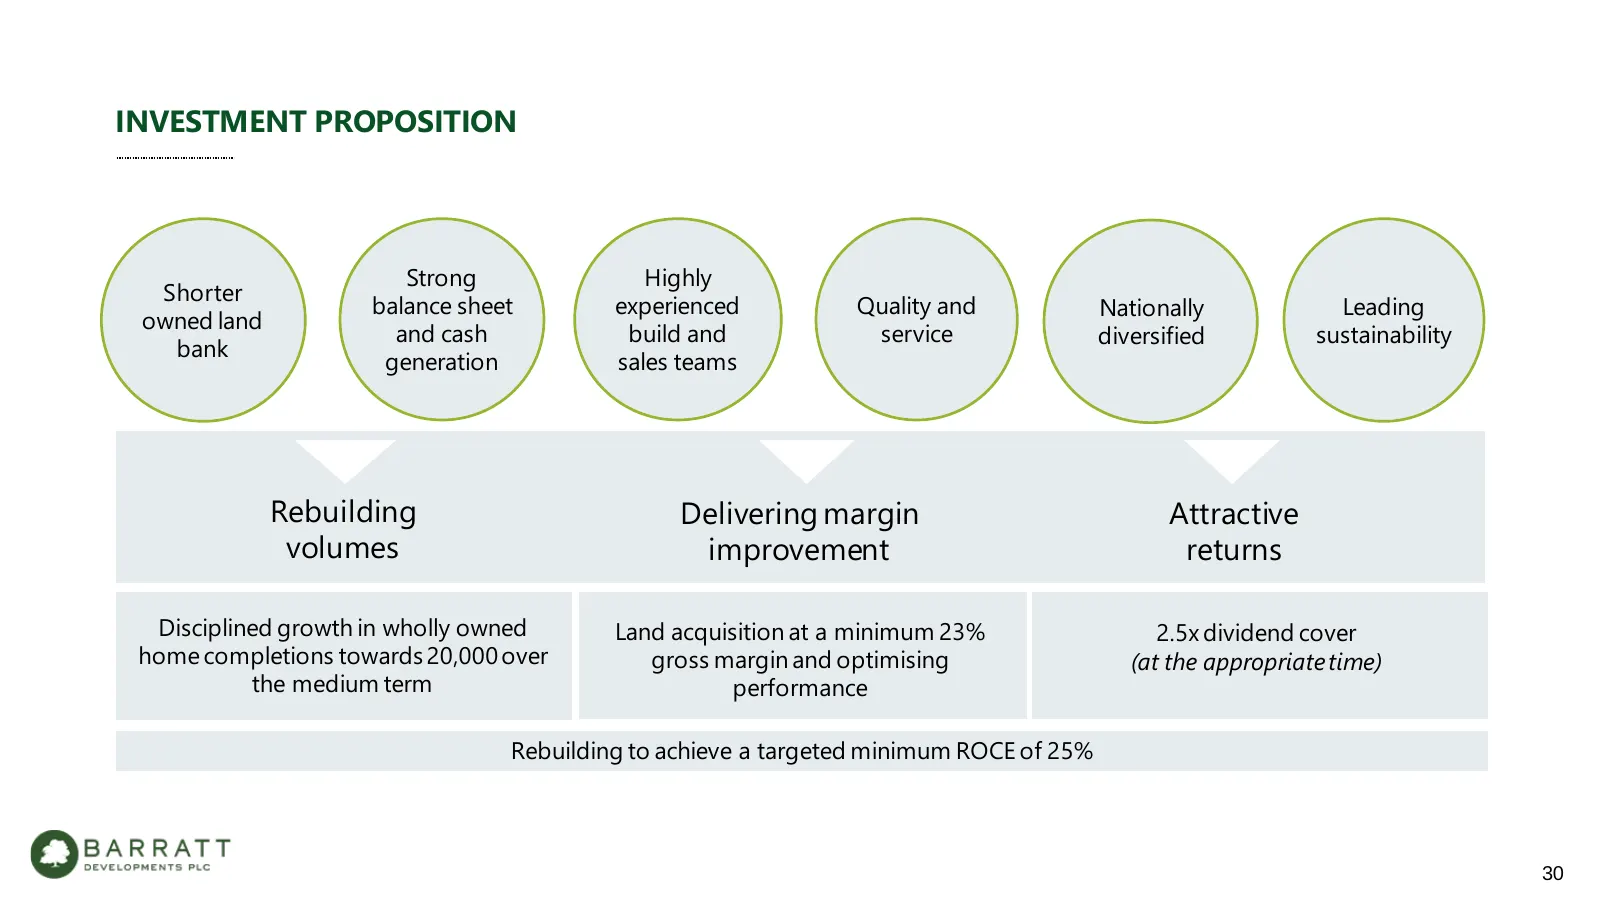
INVESTMENT PROPOSITION Strong Highly Shorter balance sheet experienced Quality and Nationally Leading owned land and cash build and service diversified sustainability bank generation sales teams Rebuilding Delivering margin Attractive volumes improvement returns Disciplined growth in wholly owned La
Slide 31: Market Fundamentals
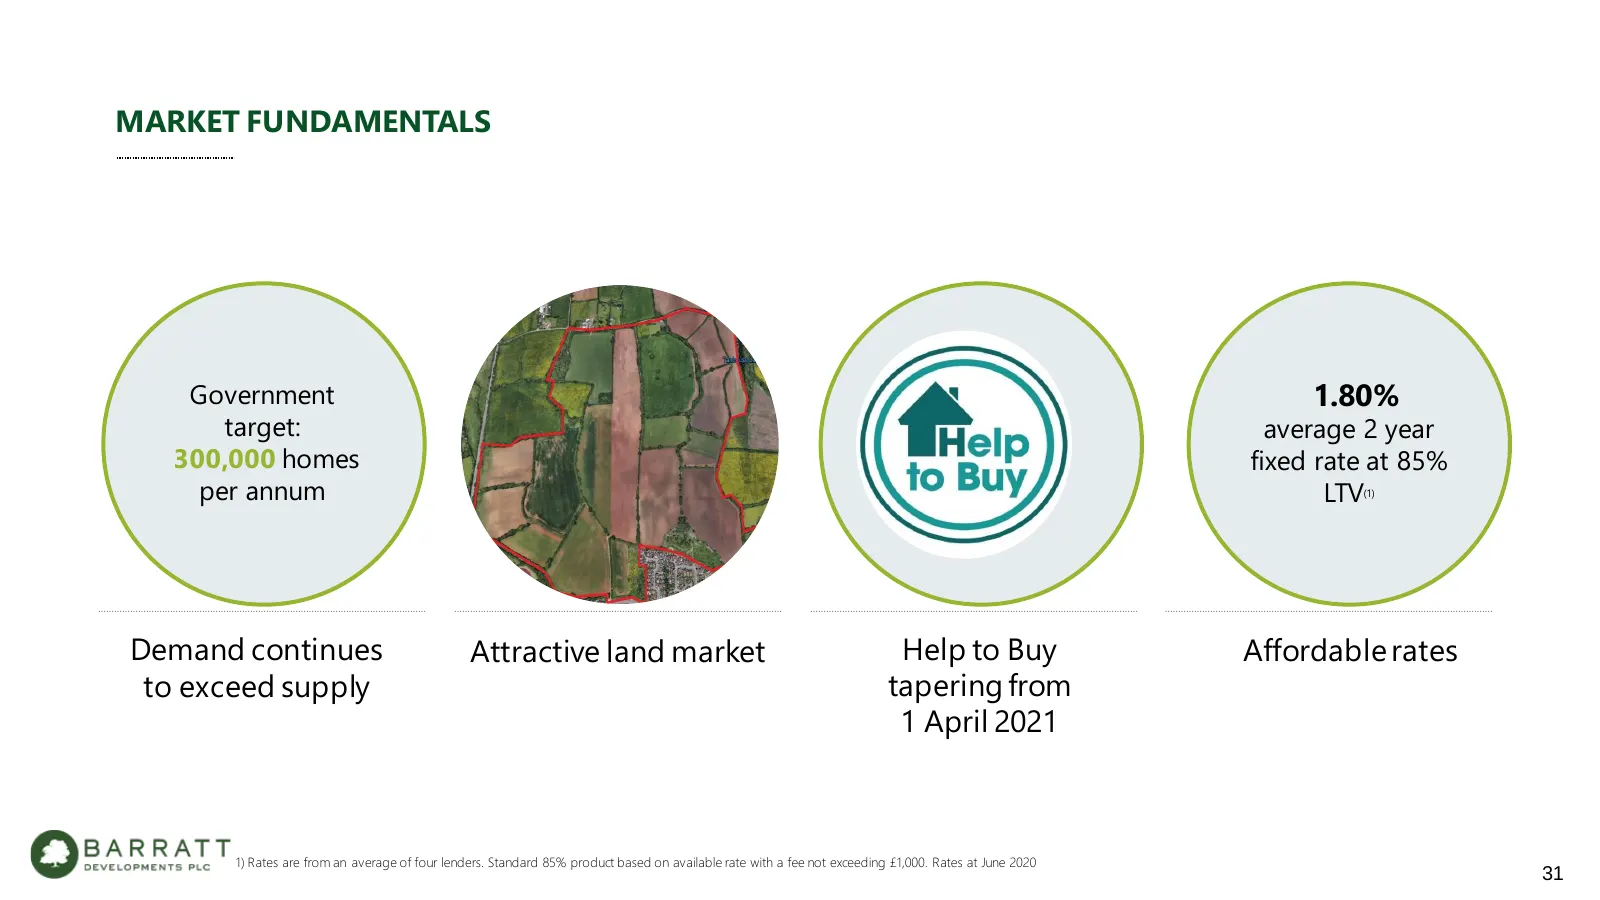
MARKET FUNDAMENTALS Government 1.80% target: average 2 year 300,000 homes fixed rate at 85% per annum LTV (1) Demand continues Attractive land market Help to Buy Affordable rates to exceed supply tapering from 1 April 2021 1) Rates are from an average of four lenders. Standard 85% product based on a
Slide 32: Mortgage Affordability Remains Attractive
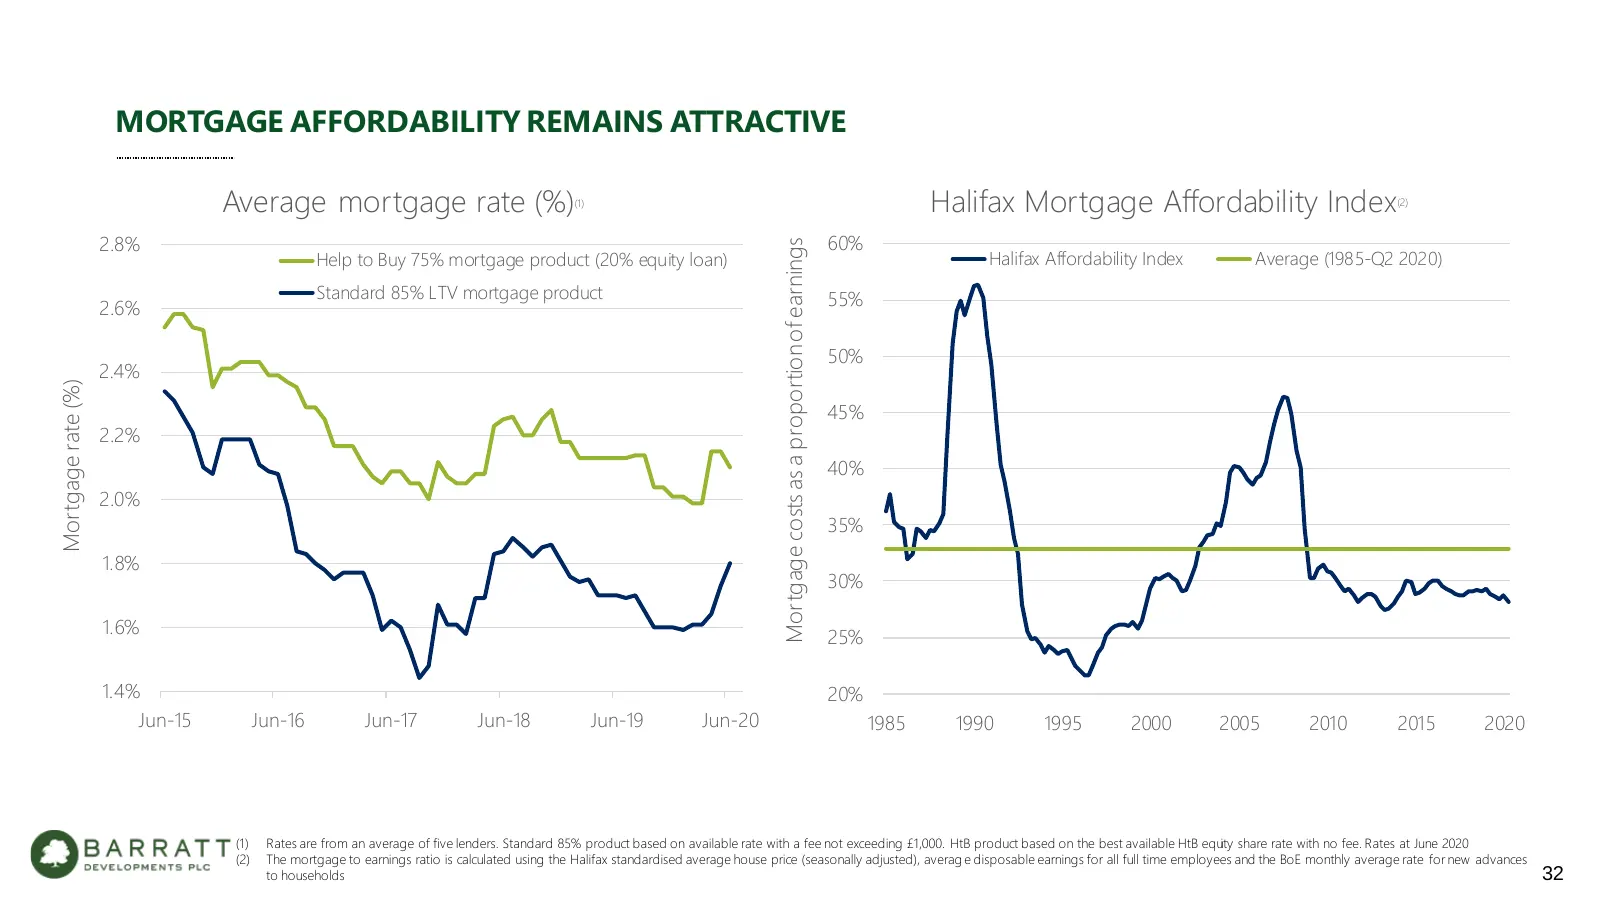
MORTGAGE AFFORDABILITY REMAINS ATTRACTIVE Average mortgage rate (%) (1) Halifax Mortgage Affordability Index (2) 2.8% 60% Mortgage costs as a proportion of earnings Help to Buy 75% mortgage product (20% equity loan) Halifax Affordability Index Average (1985-Q2 2020) Standard 85% LTV mortgage product
Slide 33: Mortgage LTV Restrictions
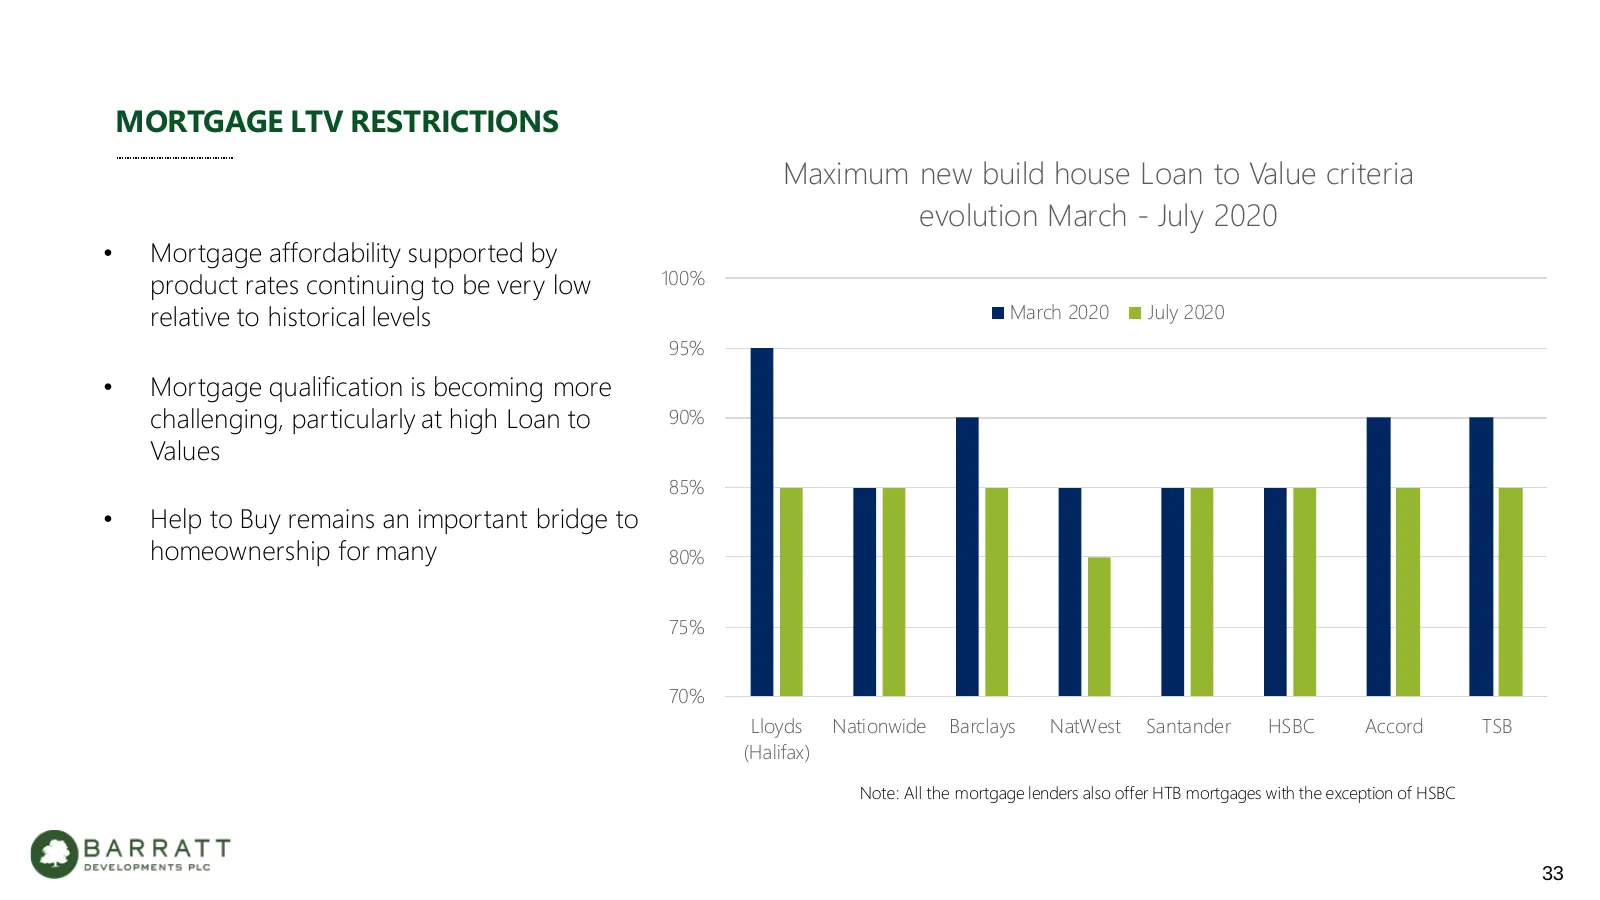
MORTGAGE LTV RESTRICTIONS Maximum new build house Loan to Value criteria evolution March - July 2020 • Mortgage affordability supported by product rates continuing to be very low 100% relative to historical levels March 2020 July 2020 95% • Mortgage qualification is becoming more challenging, partic
Slide 34: Our Priorities and Principles – Delivering for the Long Term
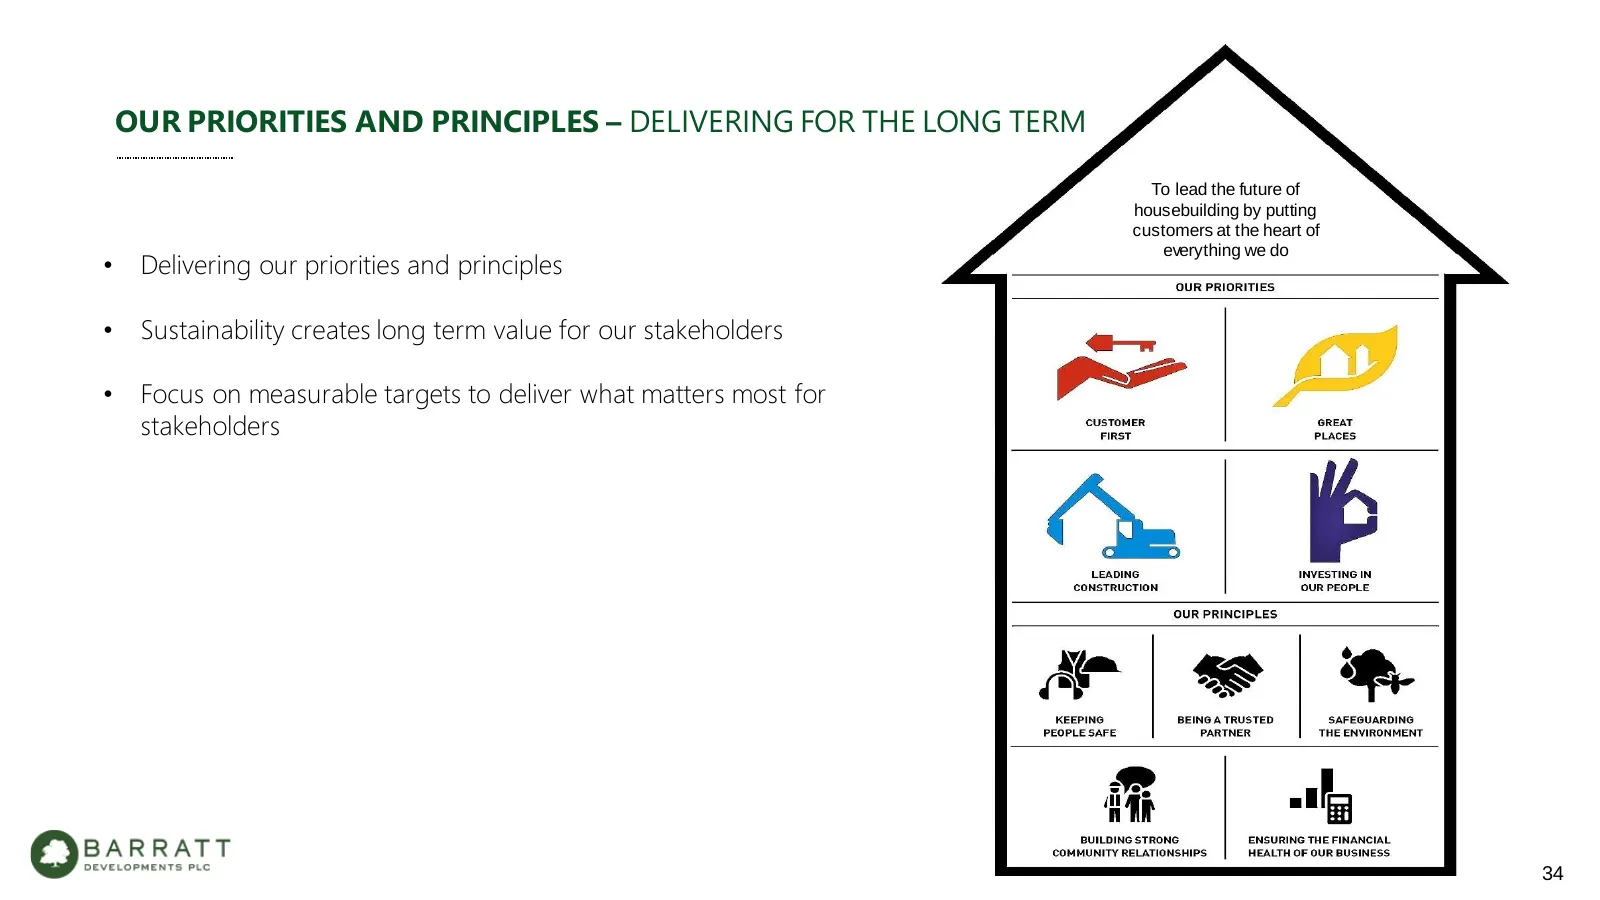
OUR PRIORITIES AND PRINCIPLES – DELIVERING FOR THE LONG TERM To lead the future of housebuilding by putting customers at the heart of everything we do • Delivering our priorities and principles • Sustainability creates long term value for our stakeholders • Focus on measurable targets to deliver wha
Slide 35: Safeguarding the Environment
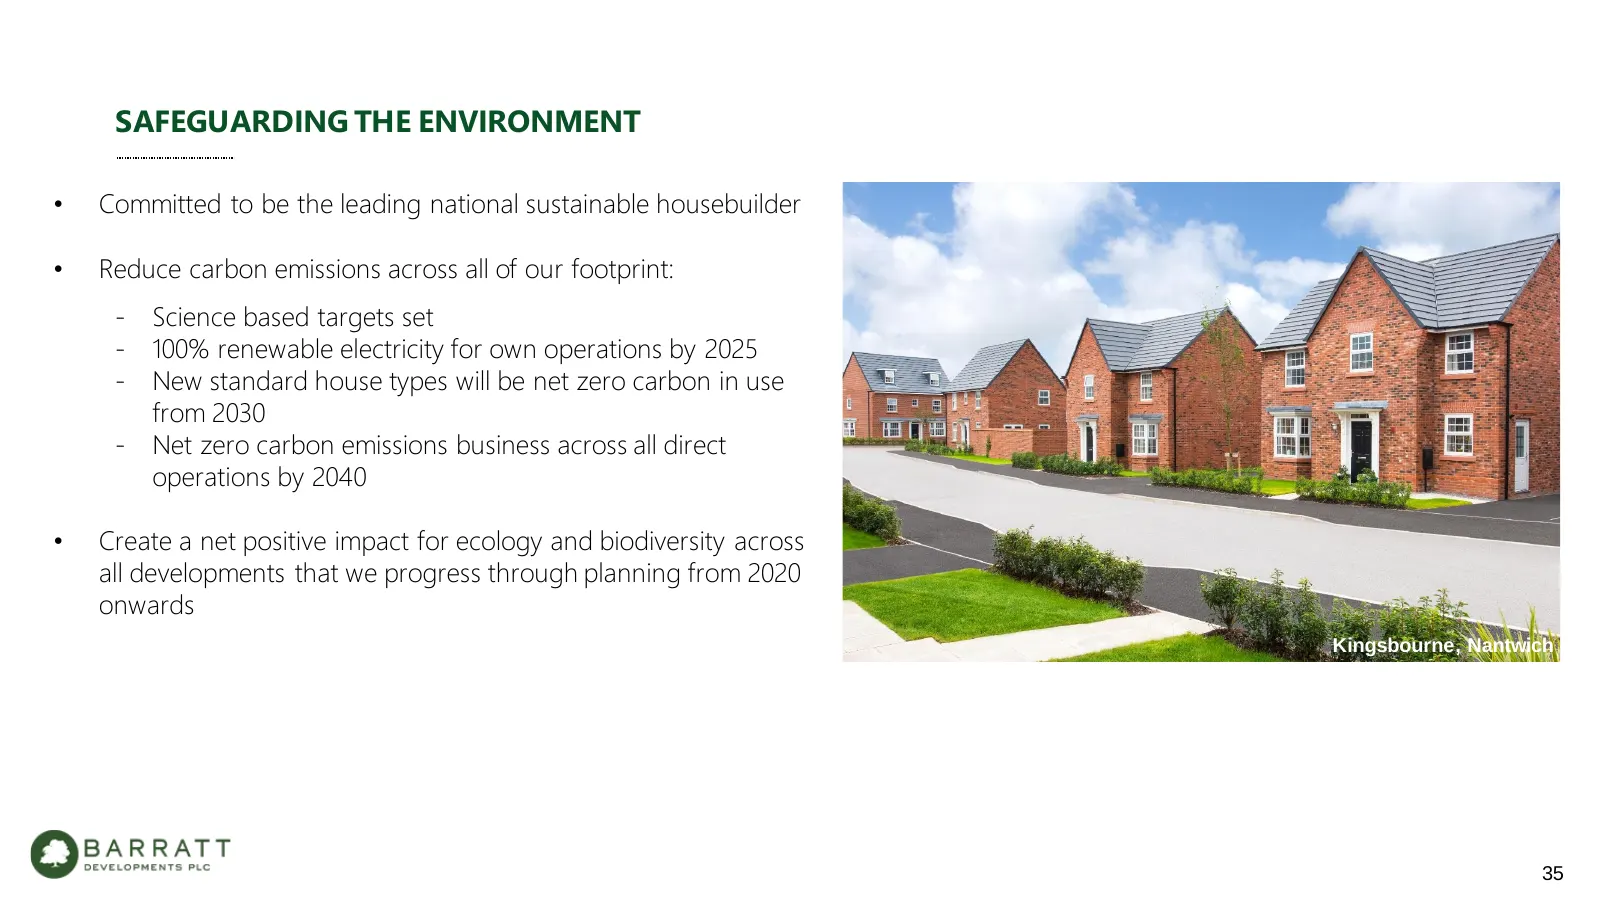
SAFEGUARDING THE ENVIRONMENT • Committed to be the leading national sustainable housebuilder • Reduce carbon emissions across all of our footprint: - Science based targets set - 100% renewable electricity for own operations by 2025 - New standard house types will be net zero carbon in use from 2030
Slide 36: Current Trading
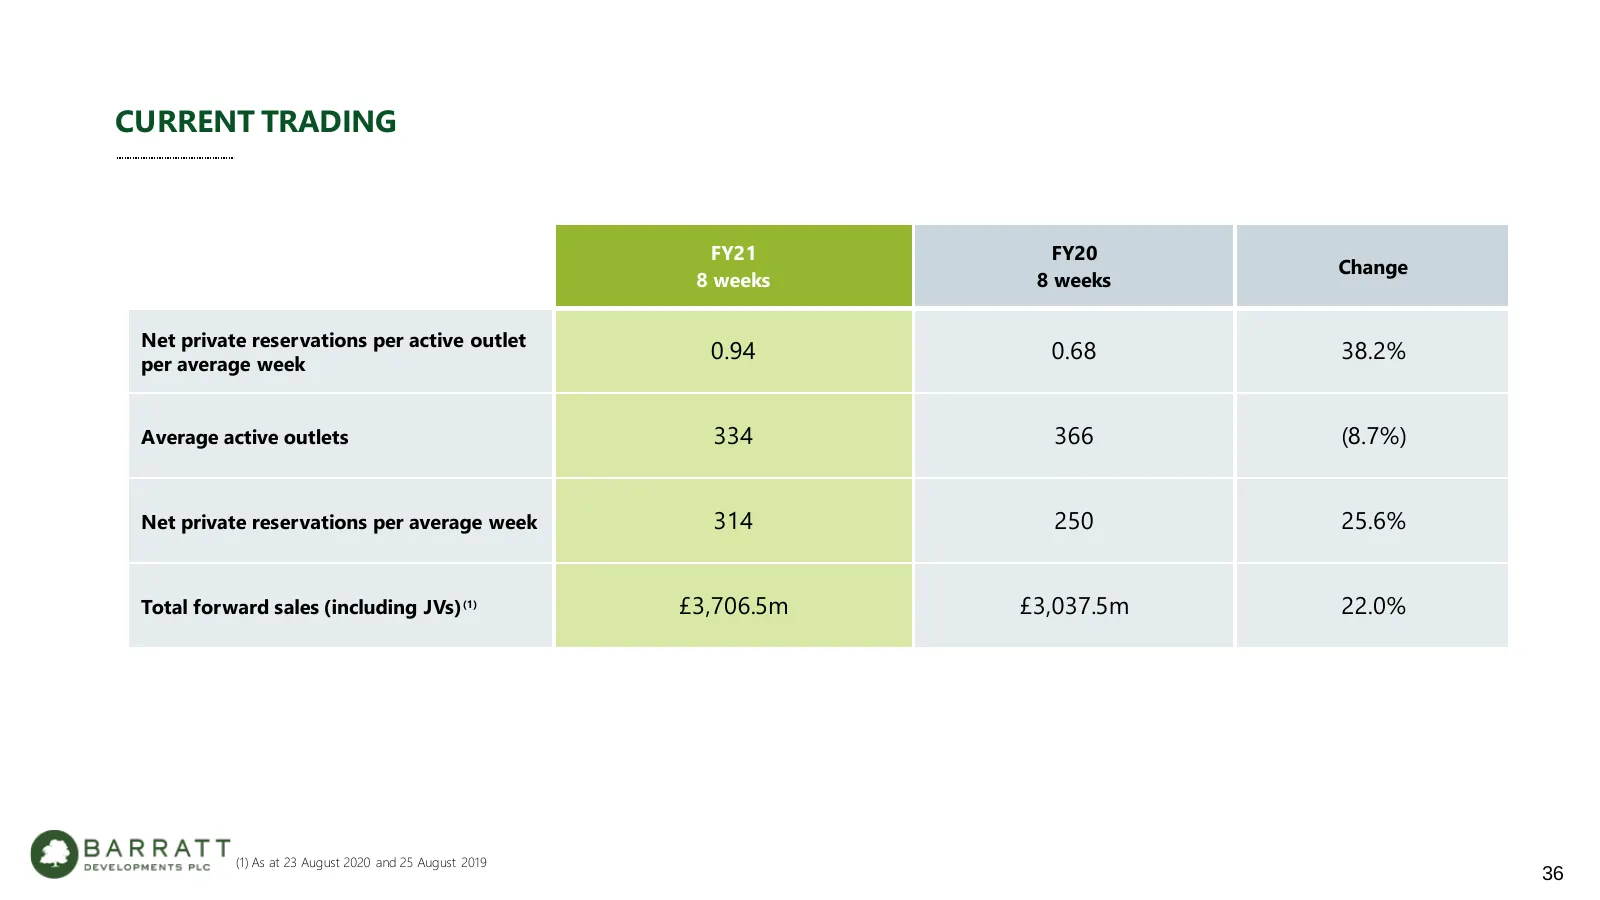
CURRENT TRADING FY21 FY20 Change 8 weeks 8 weeks Net private reservations per active outlet per average week 0.94 0.68 38.2% Average active outlets 334 366 (8.7%) Net private reservations per average week 314 250 25.6% Total forward sales (including JVs) (1) £3,706.5m £3,037.5m 22.0% (1) As at 23 Au
Slide 37: Conclusion
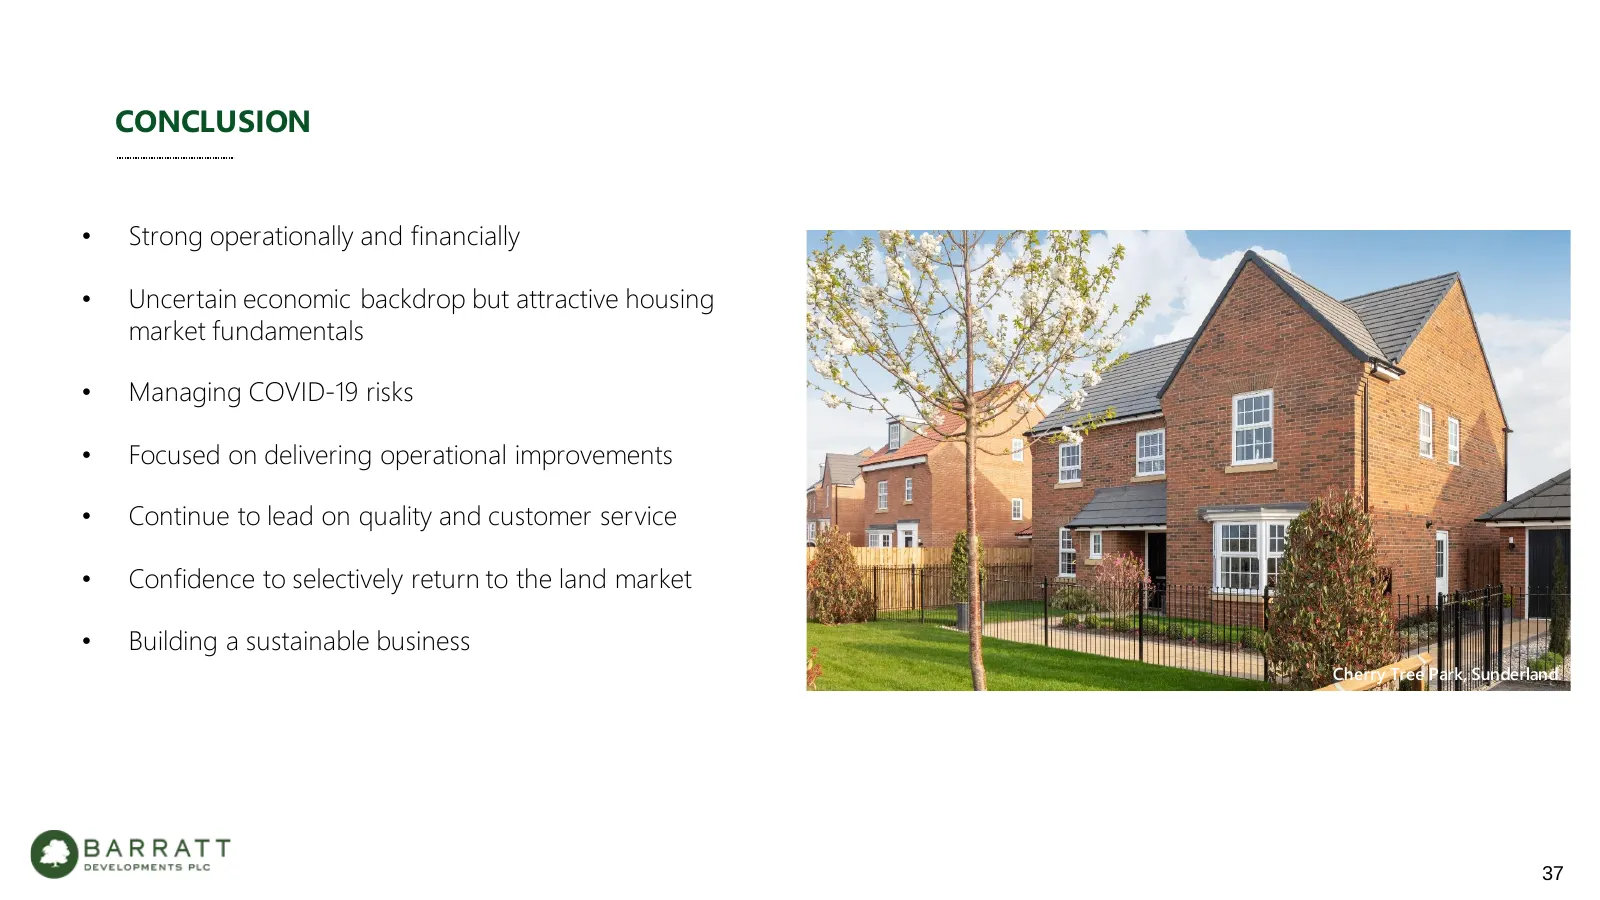
CONCLUSION • Strong operationally and financially • Uncertain economic backdrop but attractive housing market fundamentals • Managing COVID-19 risks • Focused on delivering operational improvements • Continue to lead on quality and customer service • Confidence to selectively return to the land mark
Slide 38: Q&A
Q&A New Lubbesthorpe, Leicester 38
Slide 39: Appendices – Index
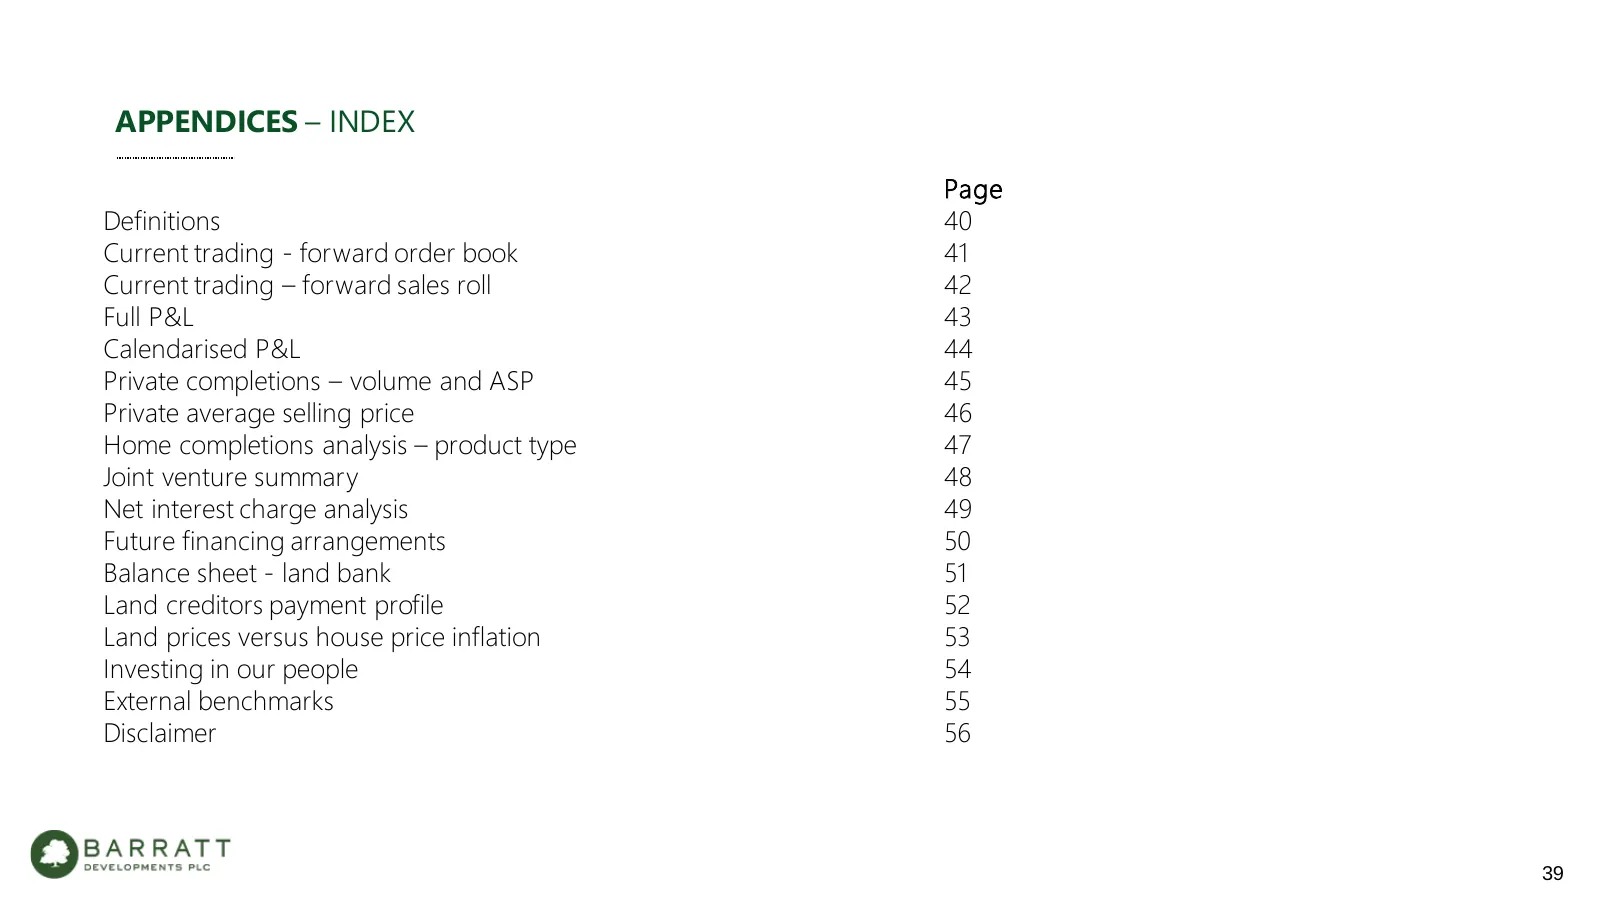
APPENDICES – INDEX Page Definitions 40 Current trading - forward order book 41 Current trading – forward sales roll 42 Full P&L 43 Calendarised P&L 44 Private completions – volume and ASP 45 Private average selling price 46 Home completions analysis – product type 47 Joint venture summary 48 Net int
Slide 40: Definitions
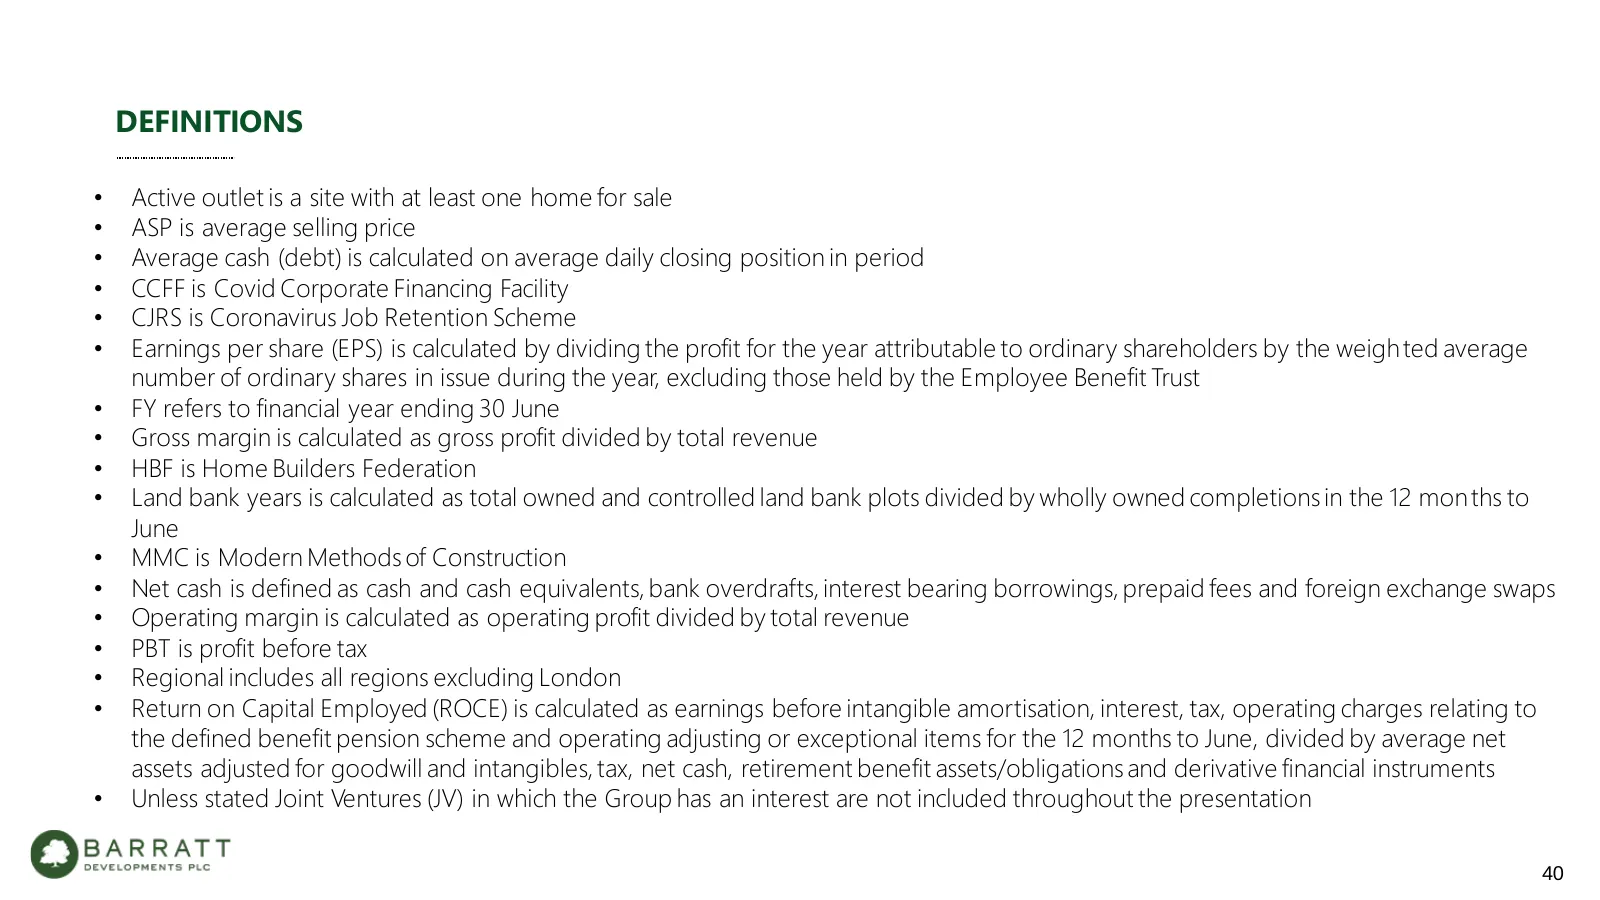
DEFINITIONS • Active outlet is a site with at least one home for sale • ASP is average selling price • Average cash (debt) is calculated on average daily closing position in period • CCFF is Covid Corporate Financing Facility • CJRS is Coronavirus Job Retention Scheme • Earnings per share (EPS) is c
Slide 41: Current Trading – Forward Order Book
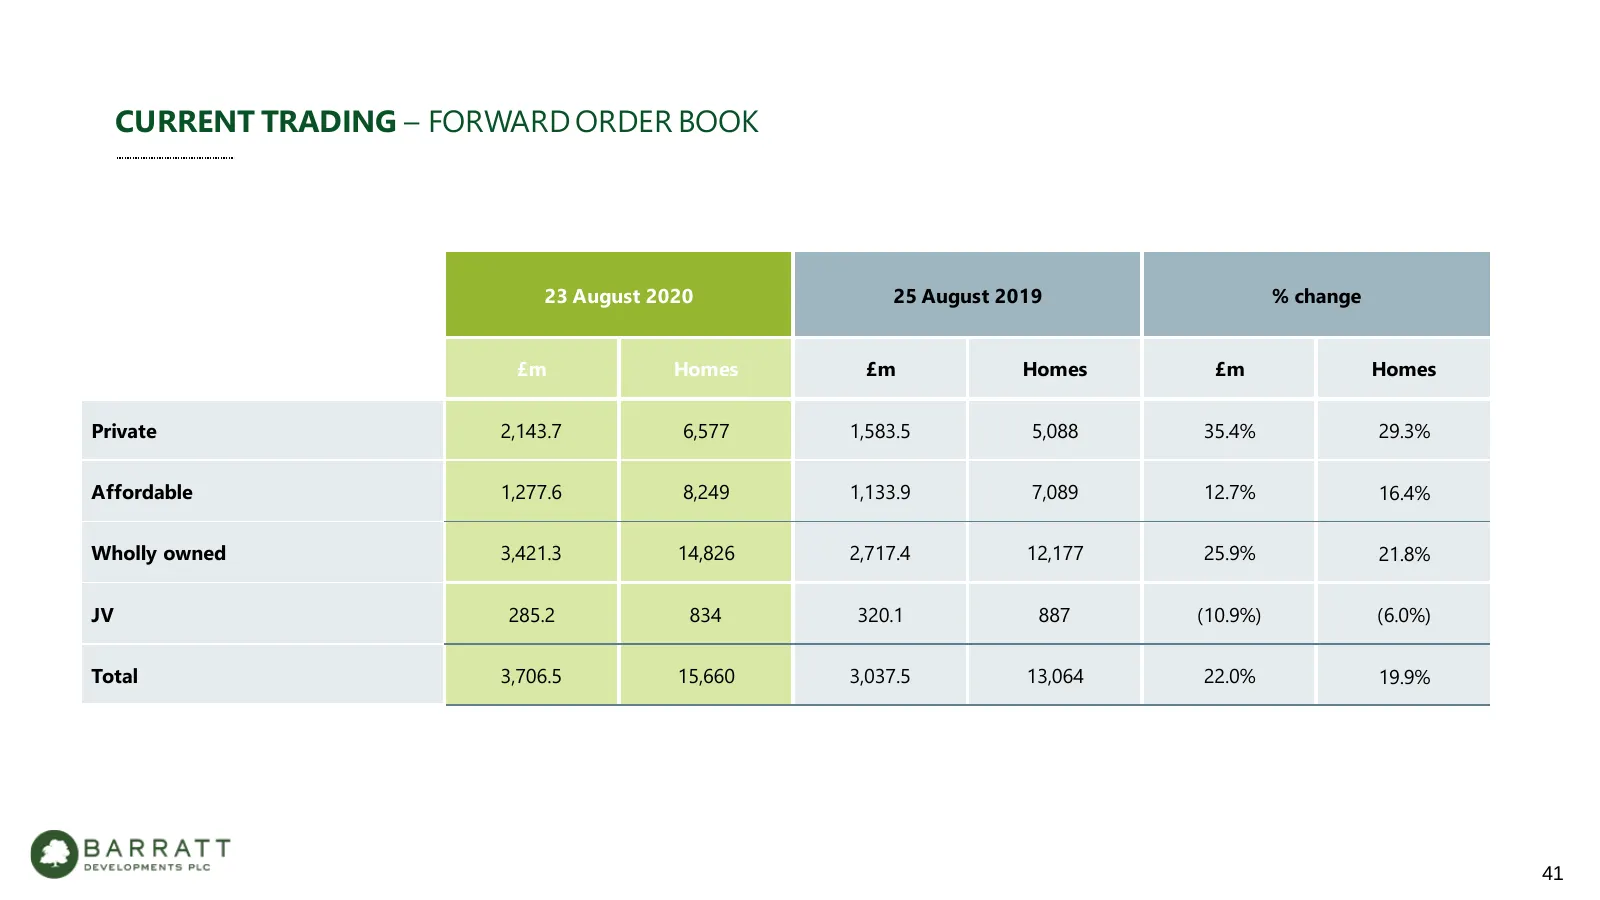
CURRENT TRADING – FORWARD ORDER BOOK 23 August 2020 25 August 2019 % change £m Homes £m Homes £m Homes Private 2,143.7 6,577 1,583.5 5,088 35.4% 29.3% Affordable 1,277.6 8,249 1,133.9 7,089 12.7% 16.4% Wholly owned 3,421.3 14,826 2,717.4 12,177 25.9% 21.8% JV 285.2 834 320.1 887 (10.9%) (6.0%) Total
Slide 42: Current Trading – Forward Sales Roll
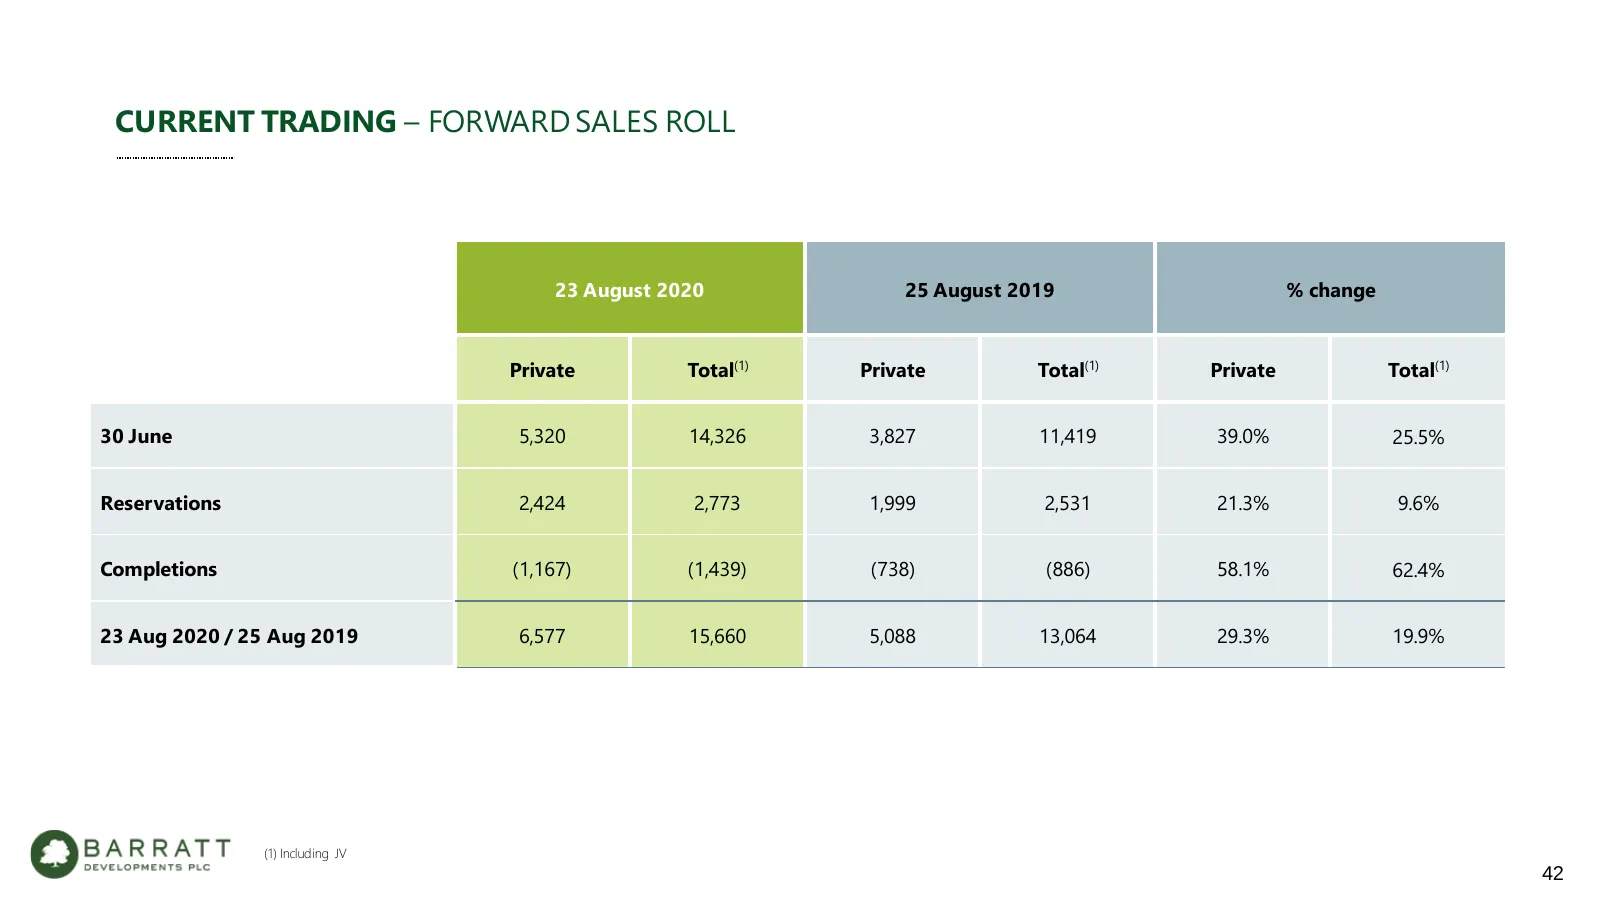
CURRENT TRADING – FORWARD SALES ROLL 23 August 2020 25 August 2019 % change Private Total(1) Private Total(1) Private Total(1) 30 June 5,320 14,326 3,827 11,419 39.0% 25.5% Reservations 2,424 2,773 1,999 2,531 21.3% 9.6% Completions (1,167) (1,439) (738) (886) 58.1% 62.4% 23 Aug 2020 / 25 Aug 2019 6
Slide 43: Full P&L
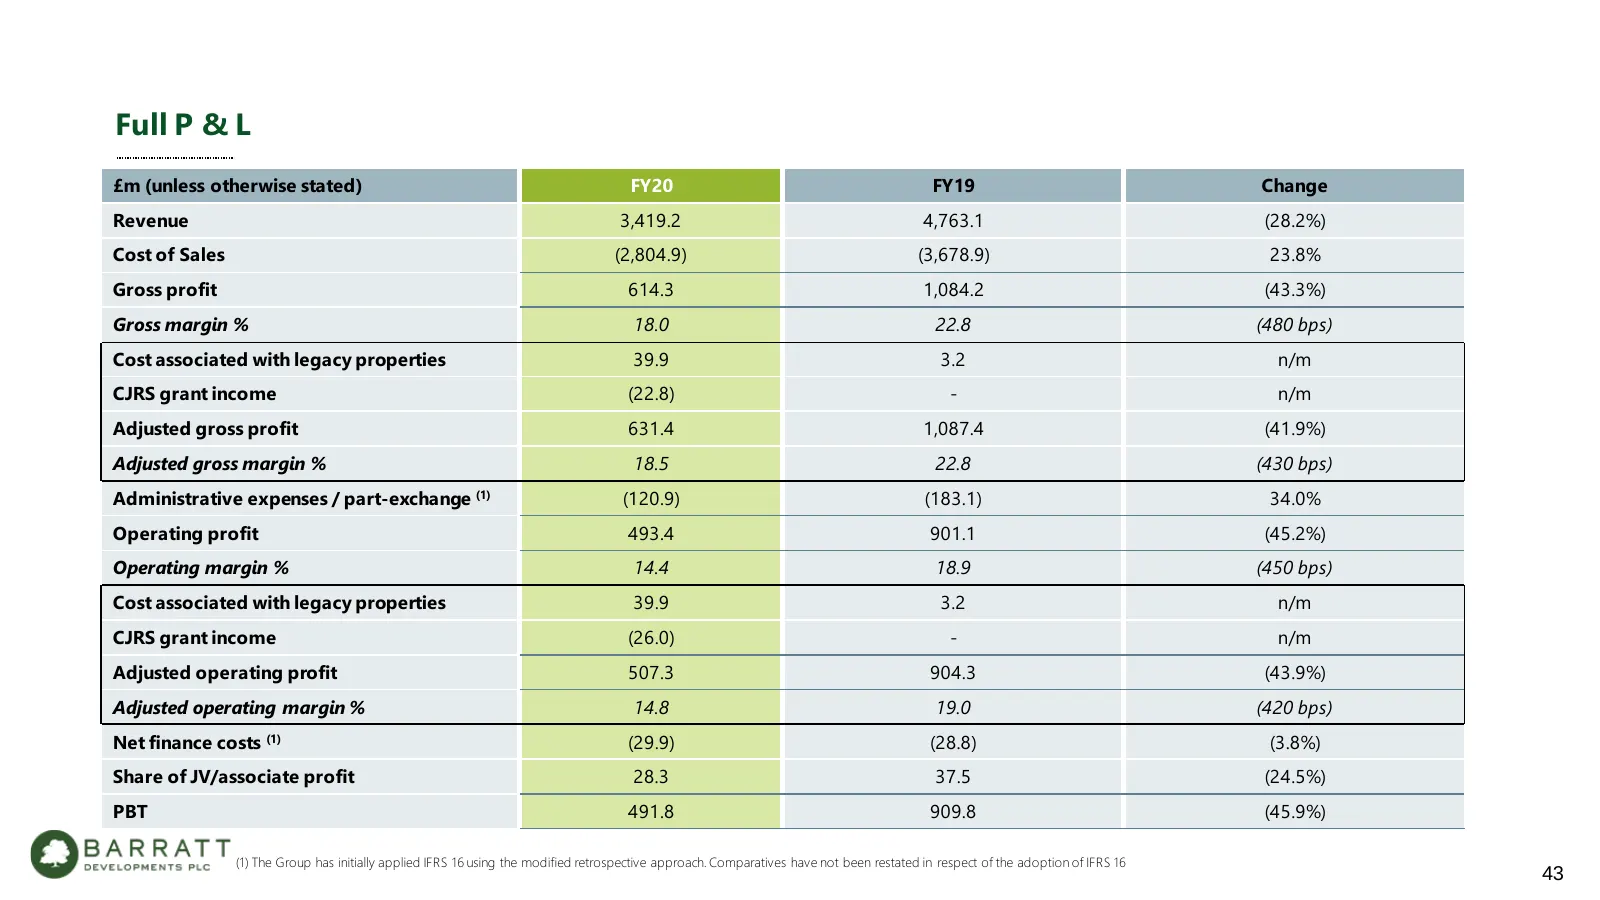
Full P & L £m (unless otherwise stated) FY20 FY19 Change Revenue 3,419.2 4,763.1 (28.2%) Cost of Sales (2,804.9) (3,678.9) 23.8% Gross profit 614.3 1,084.2 (43.3%) Gross margin % 18.0 22.8 (480 bps) Cost associated with legacy properties 39.9 3.2 n/m CJRS grant income (22.8) - n/m Adjusted gross pro
Slide 44: Calendarised P&L
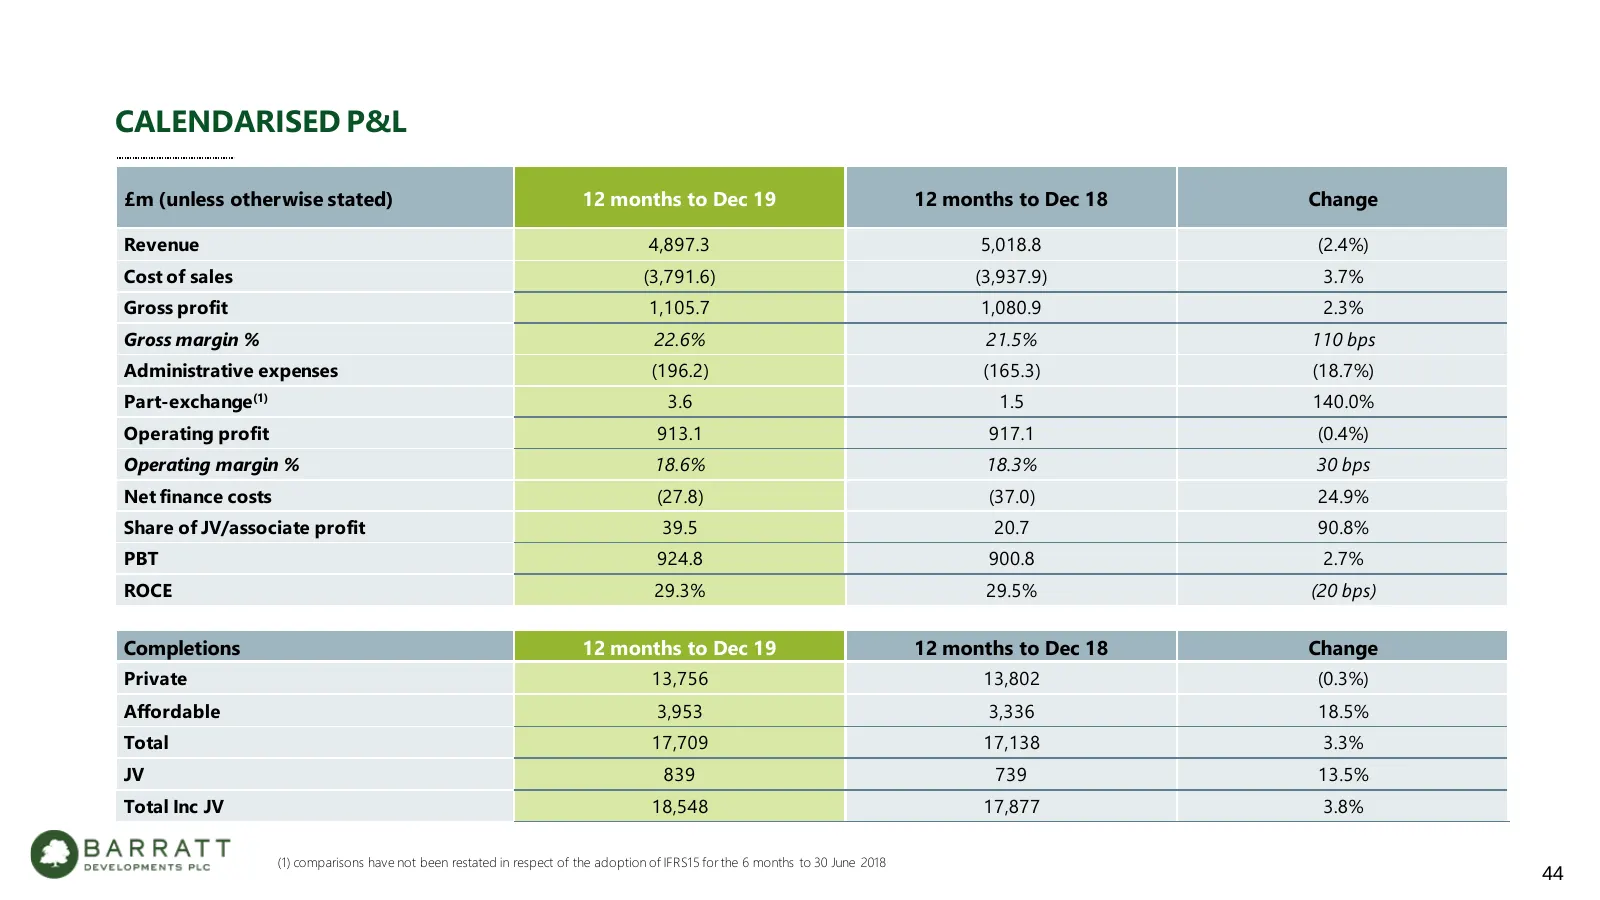
CALENDARISED P&L £m (unless otherwise stated) 12 months to Dec 19 12 months to Dec 18 Change Revenue 4,897.3 5,018.8 (2.4%) Cost of sales (3,791.6) (3,937.9) 3.7% Gross profit 1,105.7 1,080.9 2.3% Gross margin % 22.6% 21.5% 110 bps Administrative expenses (196.2) (165.3) (18.7%) Part-exchange (1) 3.
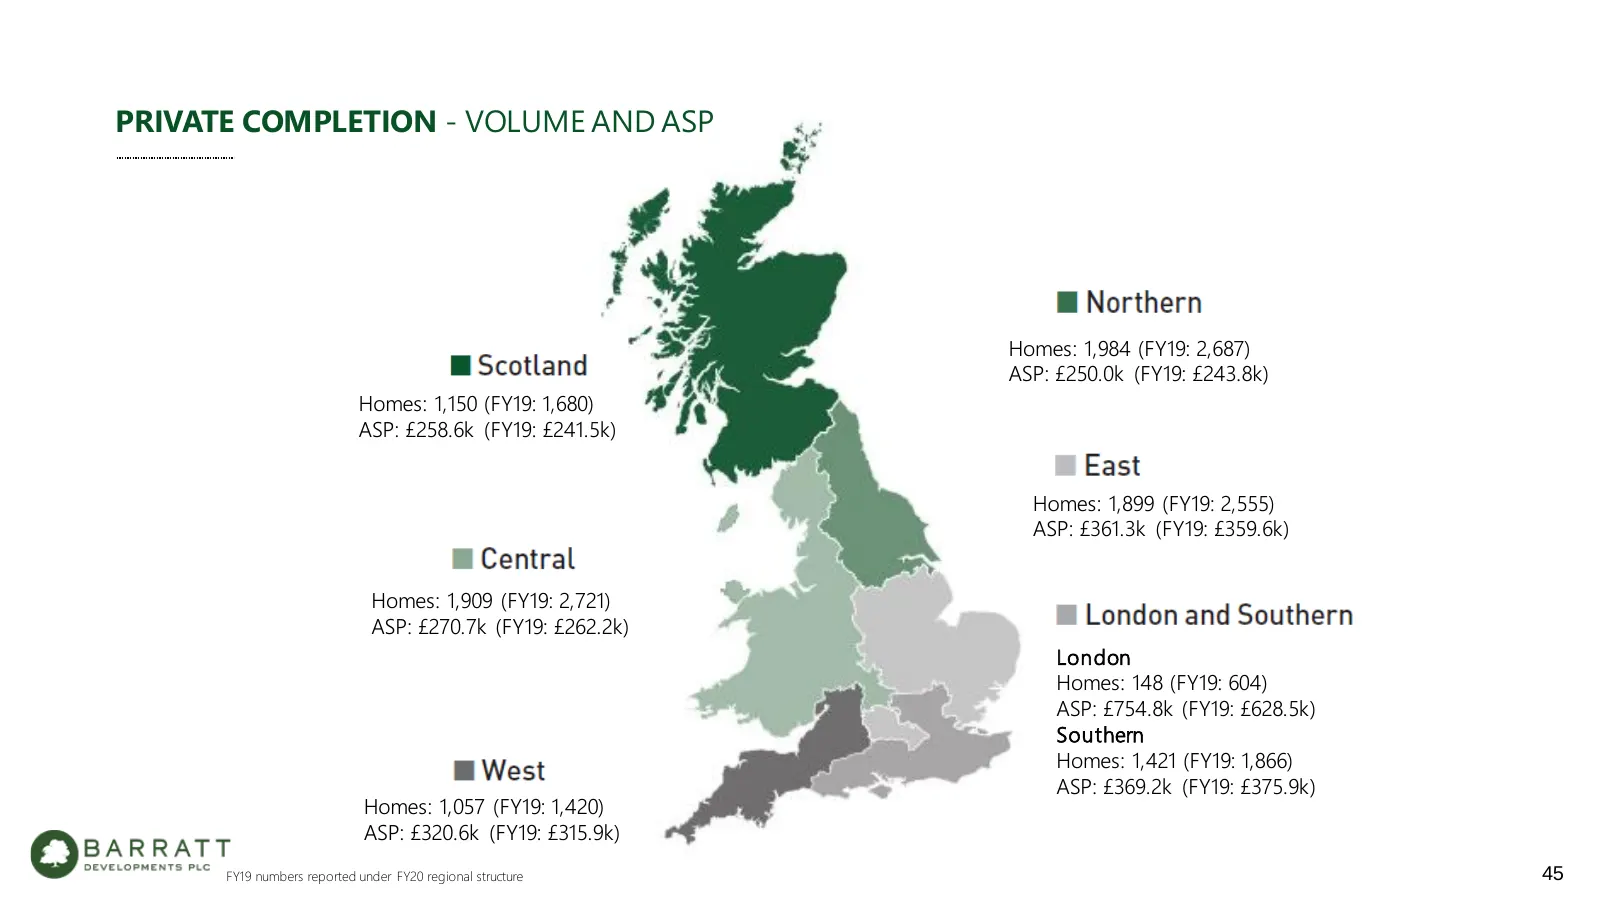
Slide 45: Private Completion - Volume and ASP
PRIVATE COMPLETION - VOLUME AND ASP Homes: 1,984 (FY19: 2,687) ASP: £250.0k (FY19: £243.8k) Homes: 1,150 (FY19: 1,680) ASP: £258.6k (FY19: £241.5k) Homes: 1,899 (FY19: 2,555) ASP: £361.3k (FY19: £359.6k) Homes: 1,909 (FY19: 2,721) ASP: £270.7k (FY19: £262.2k) London Homes: 148 (FY19: 604) ASP: £754.
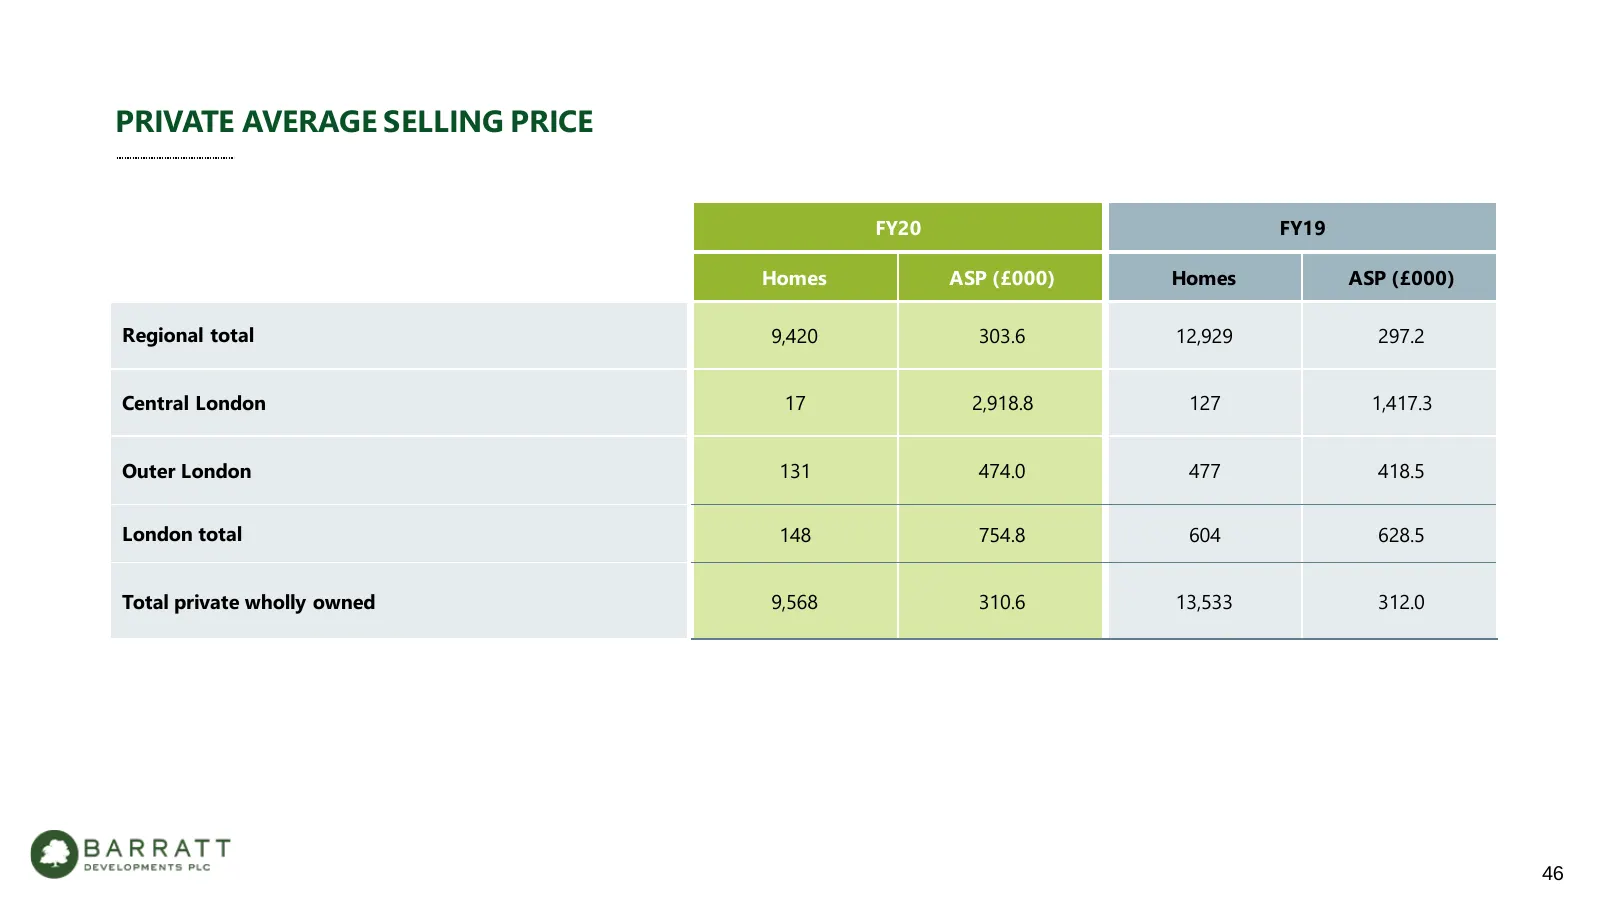
Slide 46: Private Average Selling Price
PRIVATE AVERAGE SELLING PRICE FY20 FY19 Homes ASP (£000) Homes ASP (£000) Regional total 9,420 303.6 12,929 297.2 Central London 17 2,918.8 127 1,417.3 Outer London 131 474.0 477 418.5 London total 148 754.8 604 628.5 Total private wholly owned 9,568 310.6 13,533 312.0 46
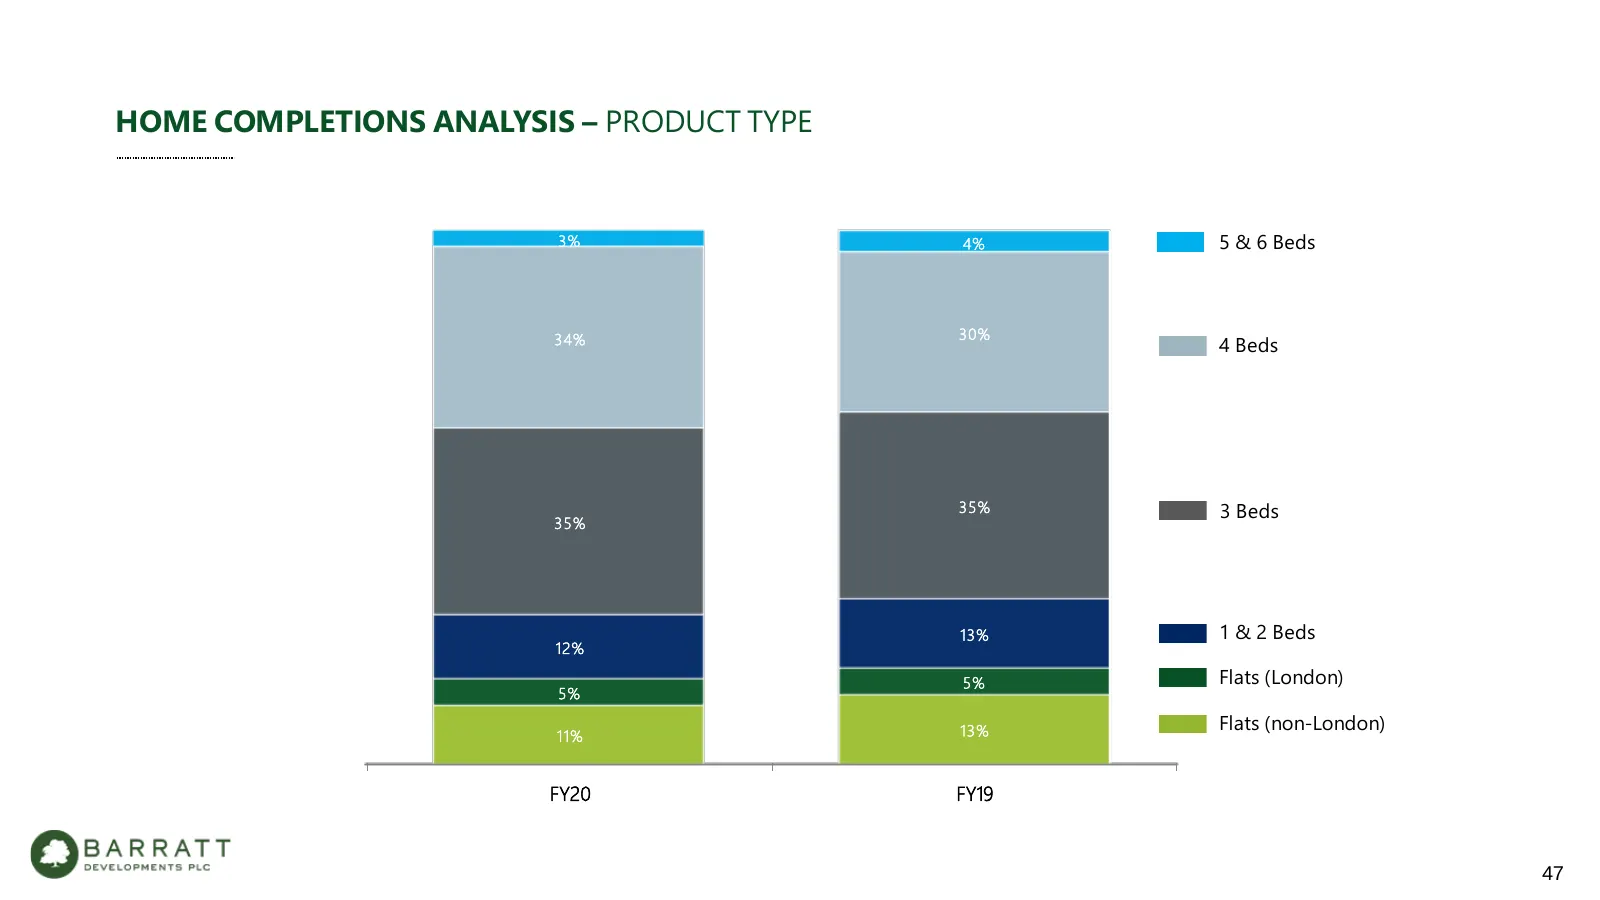
Slide 47: Home Completions Analysis – Product Type
HOME COMPLETIONS ANALYSIS – PRODUCT TYPE 3% 4% 5 & 6 Beds 34% 30% 4 Beds 35% 3 Beds 35% 13% 1 & 2 Beds 12% 5% Flats (London) 5% 13% Flats (non-London) 11% FY20 FY19 47
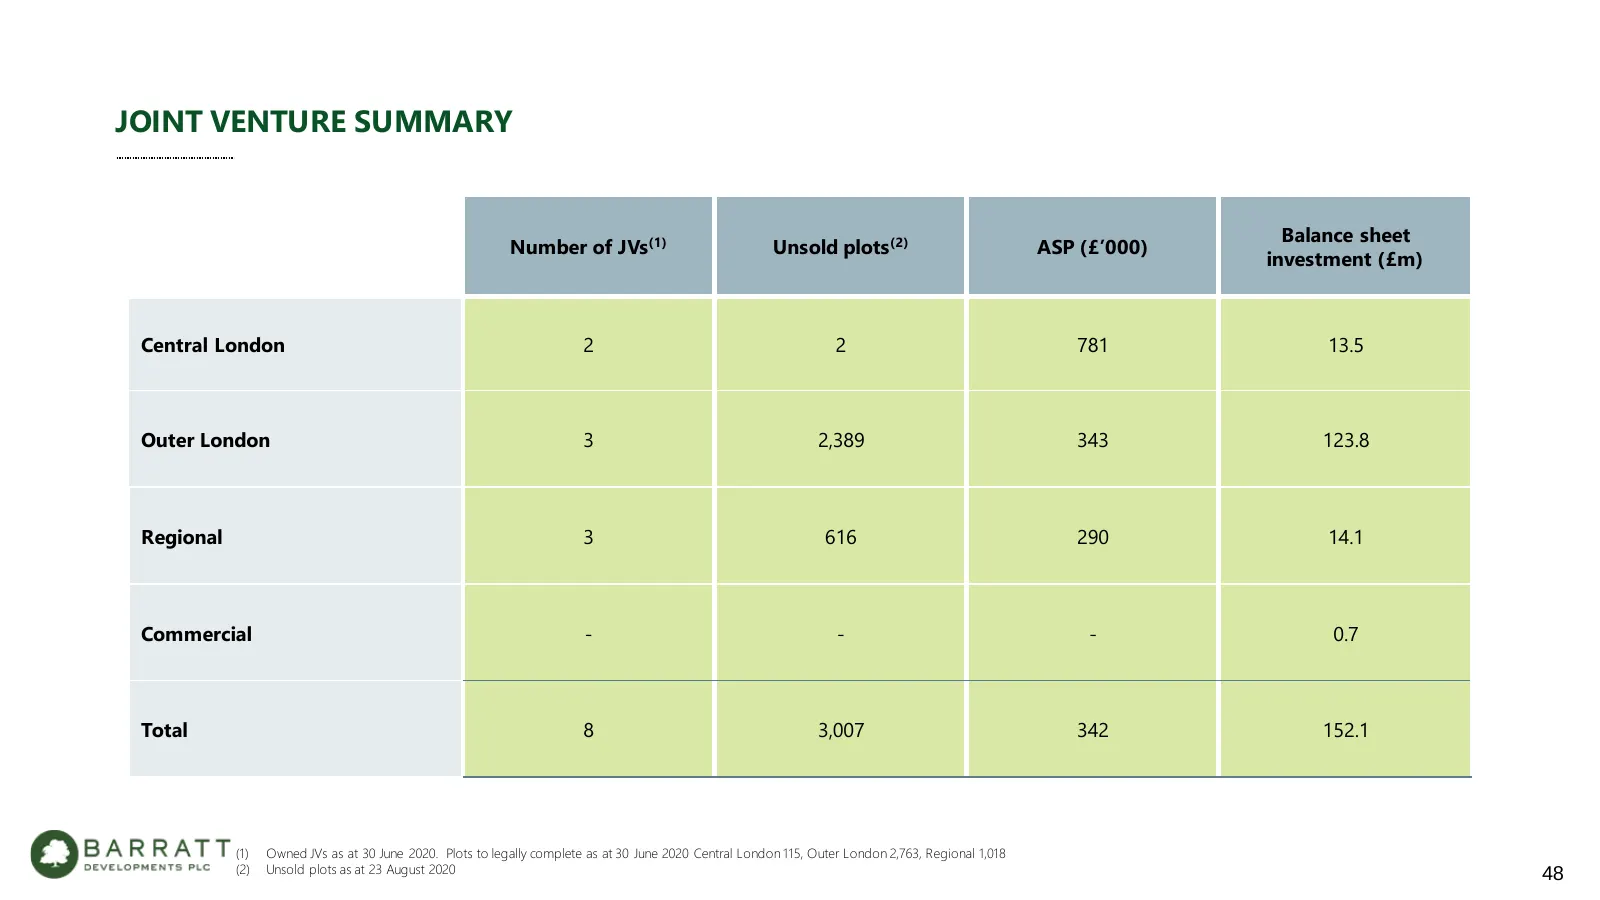
Slide 48: Joint Venture Summary
JOINT VENTURE SUMMARY Balance sheet Number of JVs(1) Unsold plots (2) ASP (£’000) investment (£m) Central London 2 2 781 13.5 Outer London 3 2,389 343 123.8 Regional 3 616 290 14.1 Commercial - - - 0.7 Total 8 3,007 342 152.1 (1) Owned JVs as at 30 June 2020. Plots to legally complete as at 30 June
Slide 49: Net Interest Charge Analysis
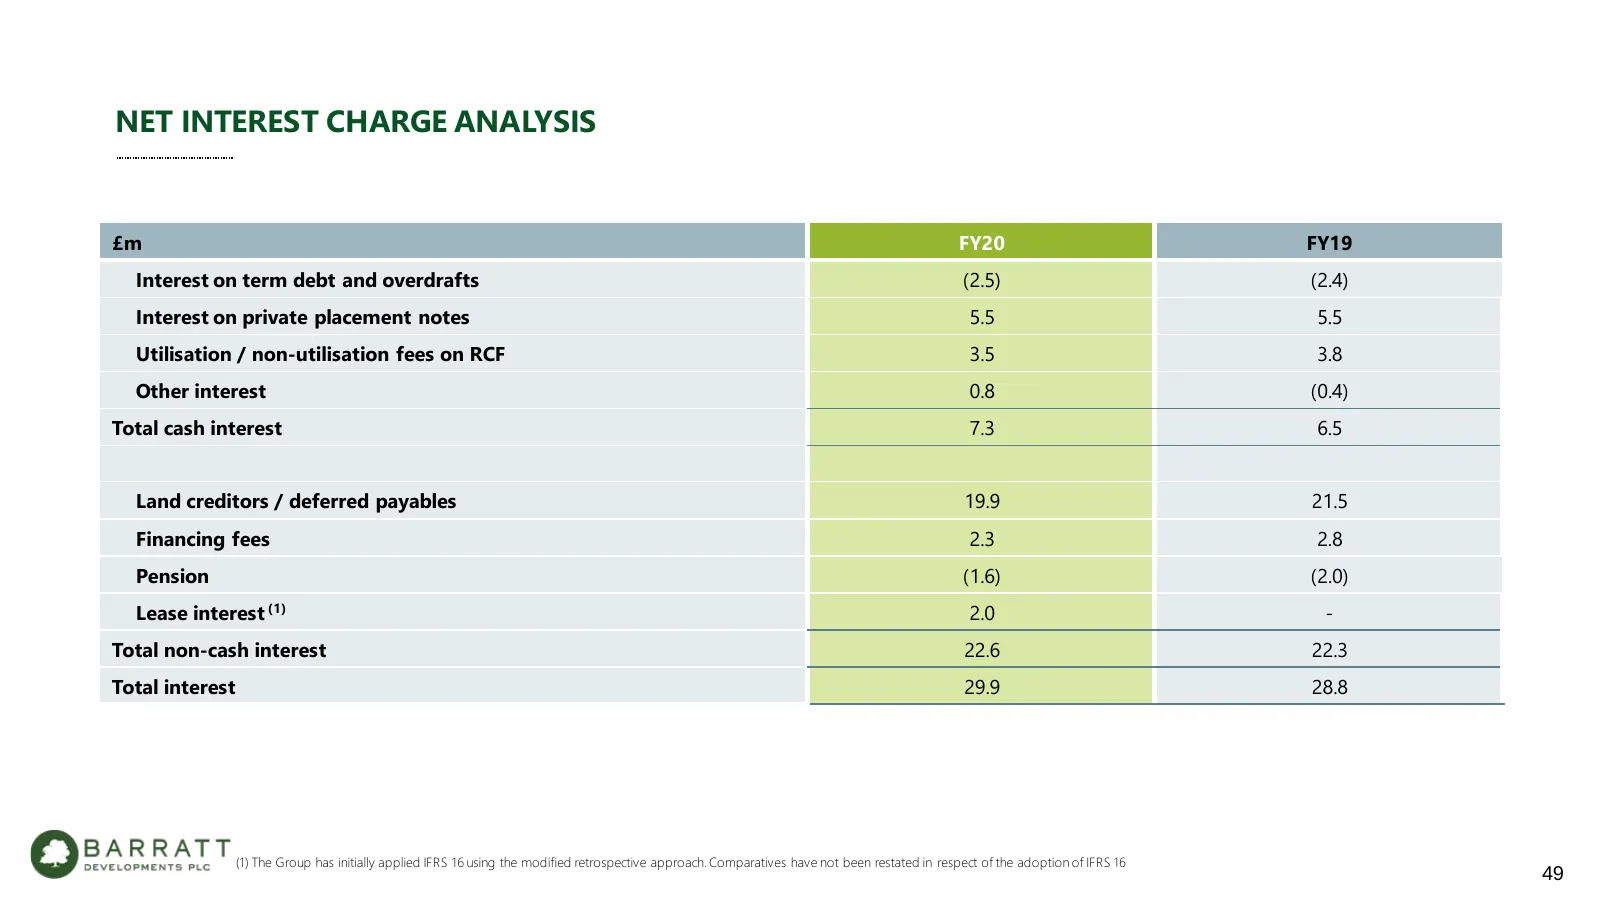
NET INTEREST CHARGE ANALYSIS £m FY20 FY19 Interest on term debt and overdrafts (2.5) (2.4) Interest on private placement notes 5.5 5.5 Utilisation / non-utilisation fees on RCF 3.5 3.8 Other interest 0.8 (0.4) Total cash interest 7.3 6.5 Land creditors / deferred payables 19.9 21.5 Financing fees 2.
Slide 50: Future Financing Arrangements
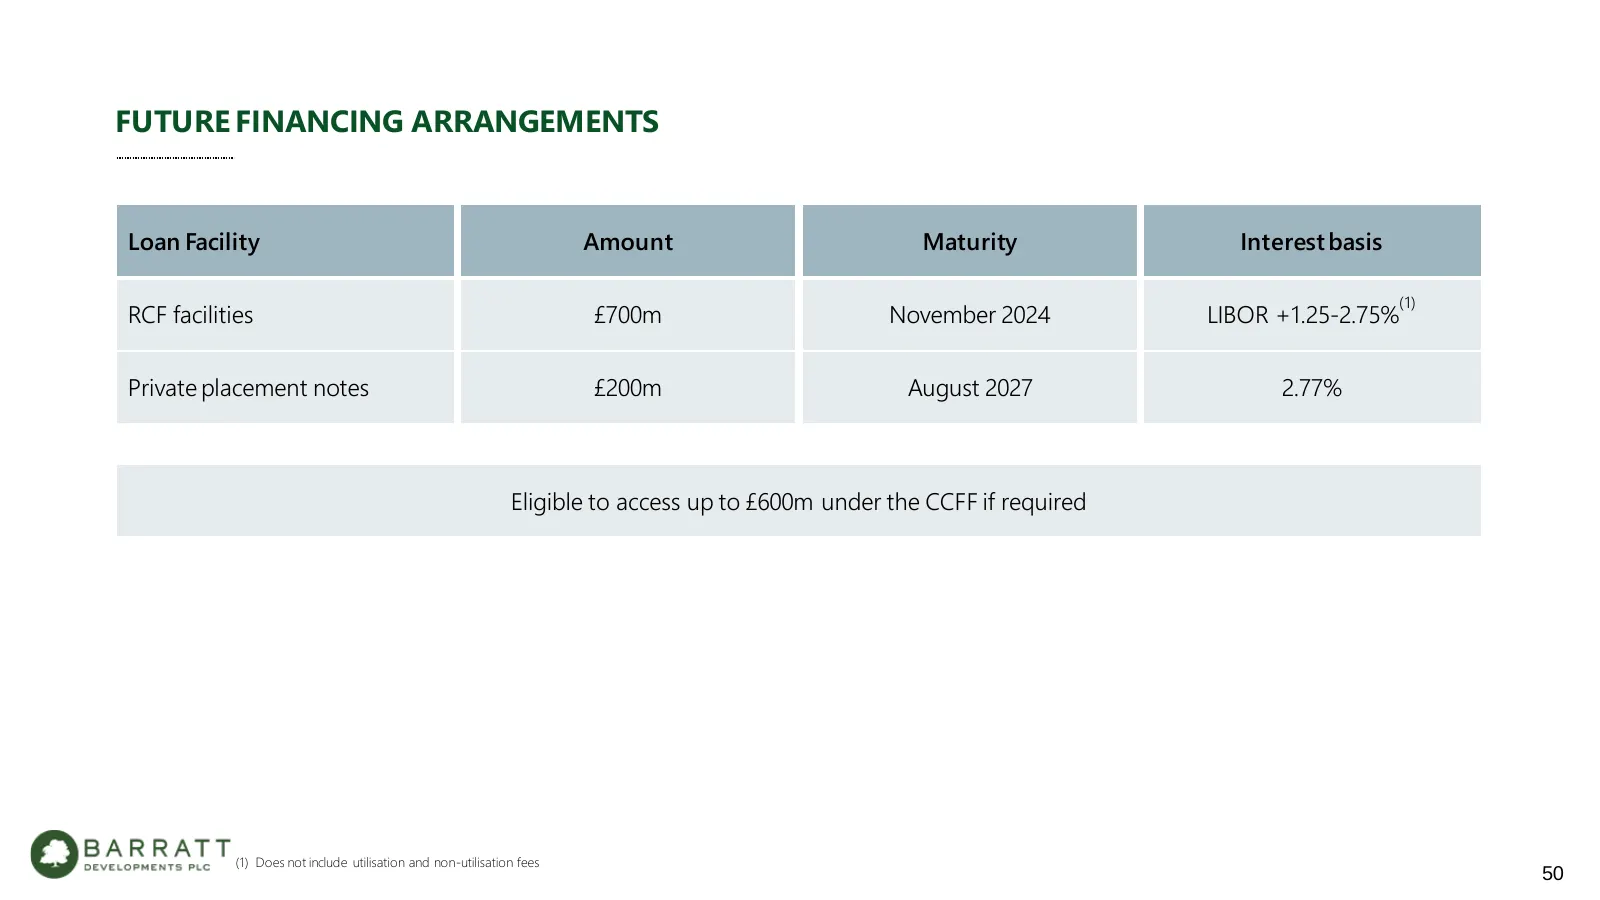
FUTURE FINANCING ARRANGEMENTS Loan Facility Amount Maturity Interest basis (1) RCF facilities £700m November 2024 LIBOR +1.25-2.75% Private placement notes £200m August 2027 2.77% Eligible to access up to £600m under the CCFF if required (1) Does not include utilisation and non-utilisation fees 50
Slide 51: Balance Sheet – Land Bank
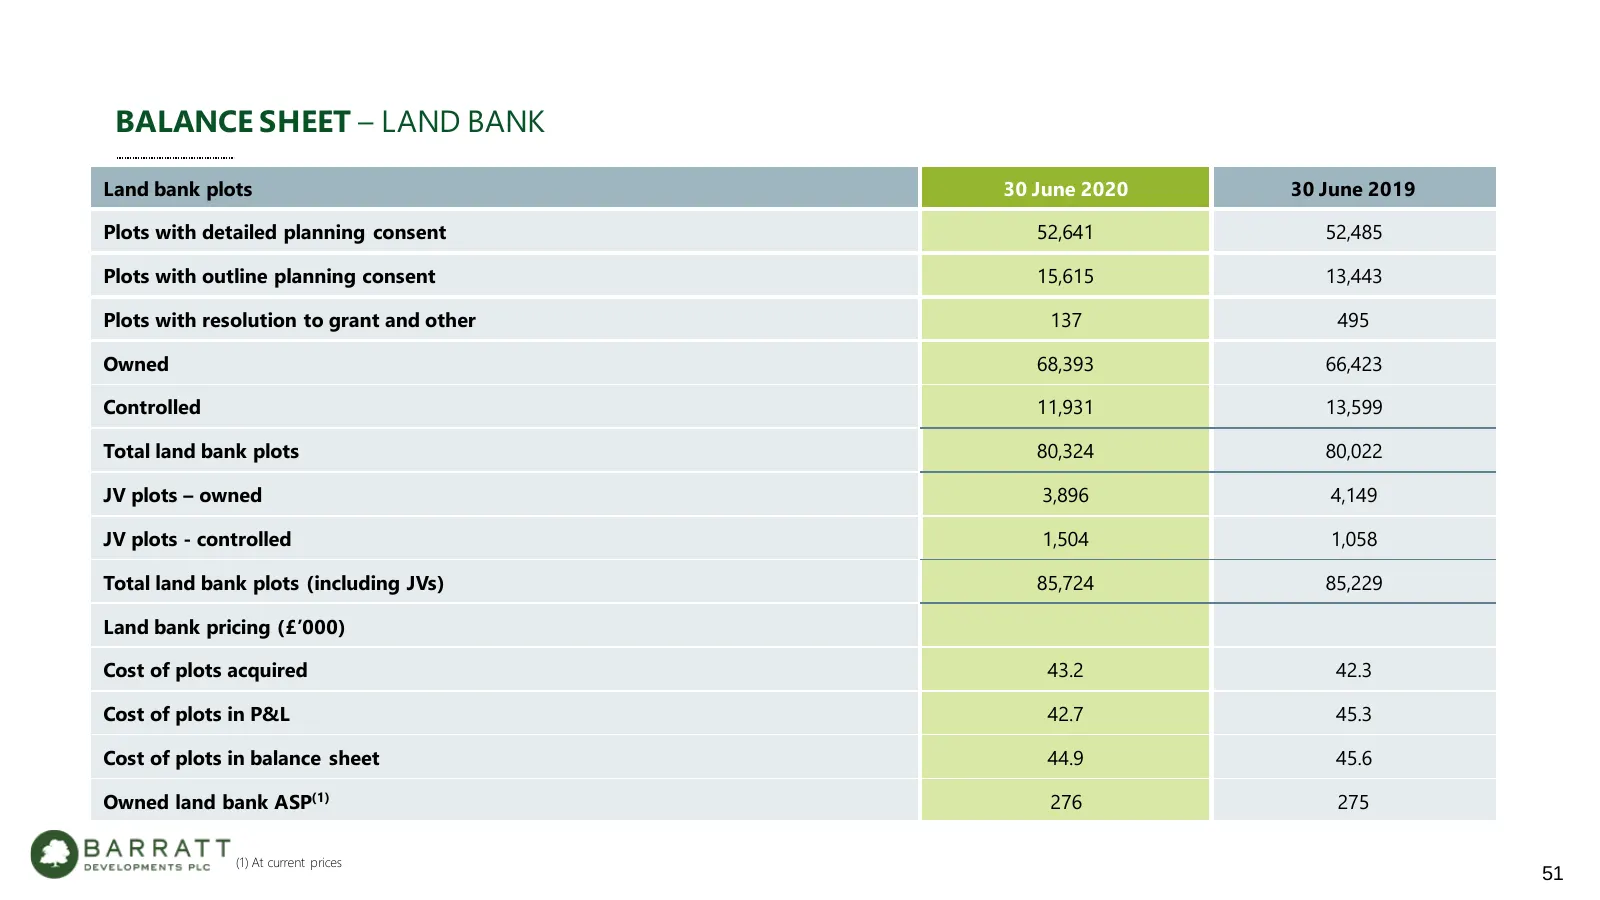
BALANCE SHEET – LAND BANK Land bank plots 30 June 2020 30 June 2019 Plots with detailed planning consent 52,641 52,485 Plots with outline planning consent 15,615 13,443 Plots with resolution to grant and other 137 495 Owned 68,393 66,423 Controlled 11,931 13,599 Total land bank plots 80,324 80,022 J
Slide 52: Land Creditors Payment Profile
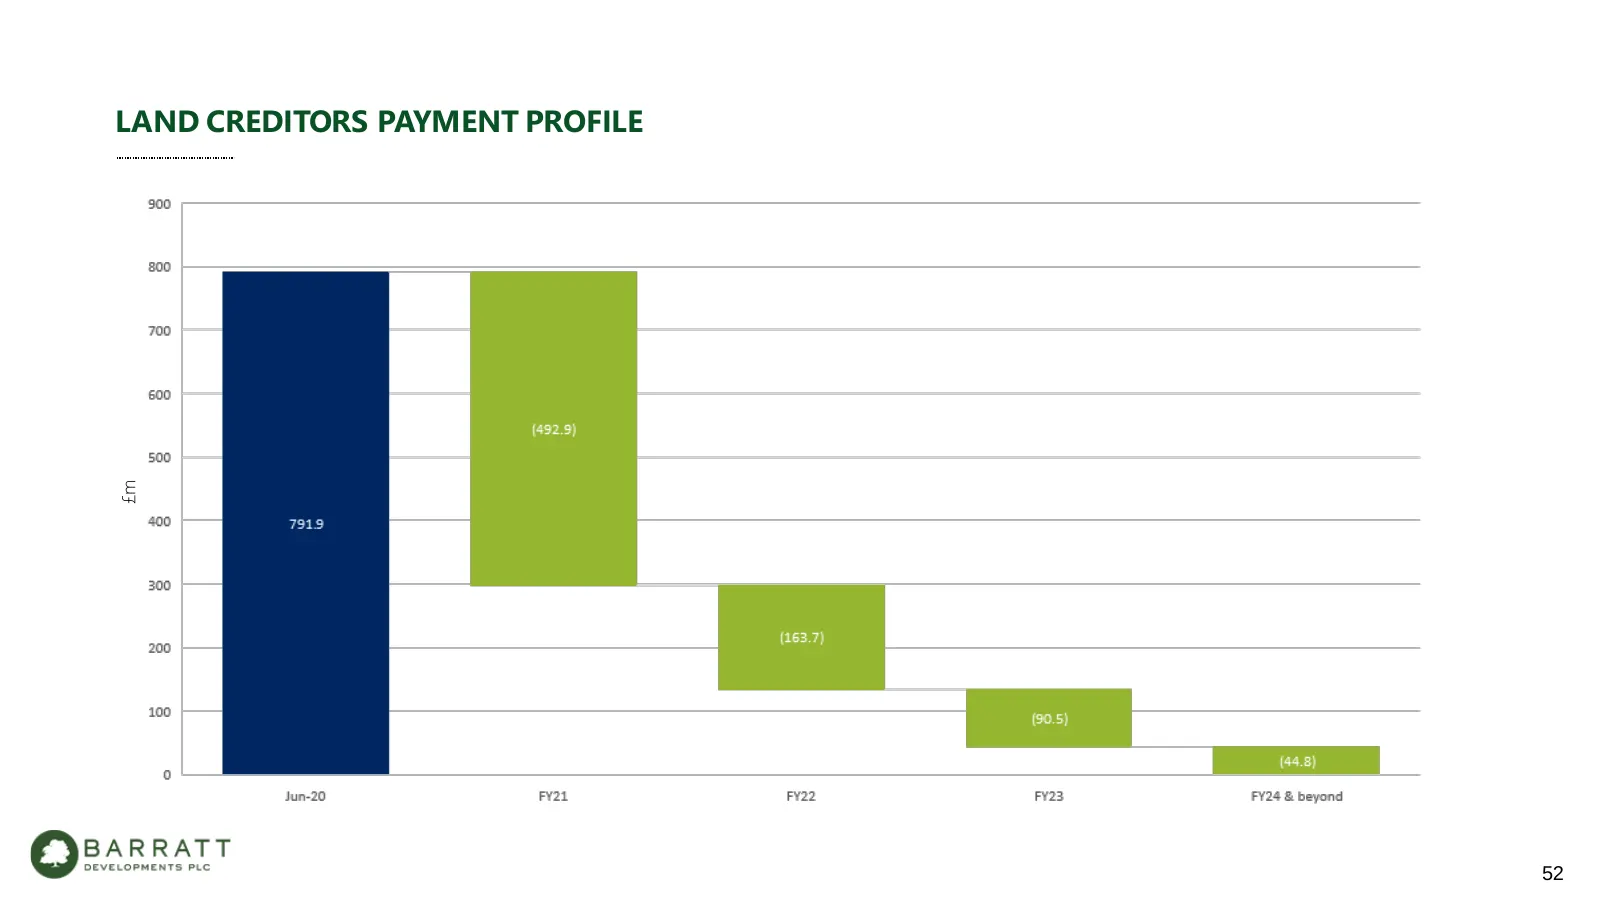
LAND CREDITORS PAYMENT PROFILE £m 52
Slide 53: Land Prices versus House Price Inflation
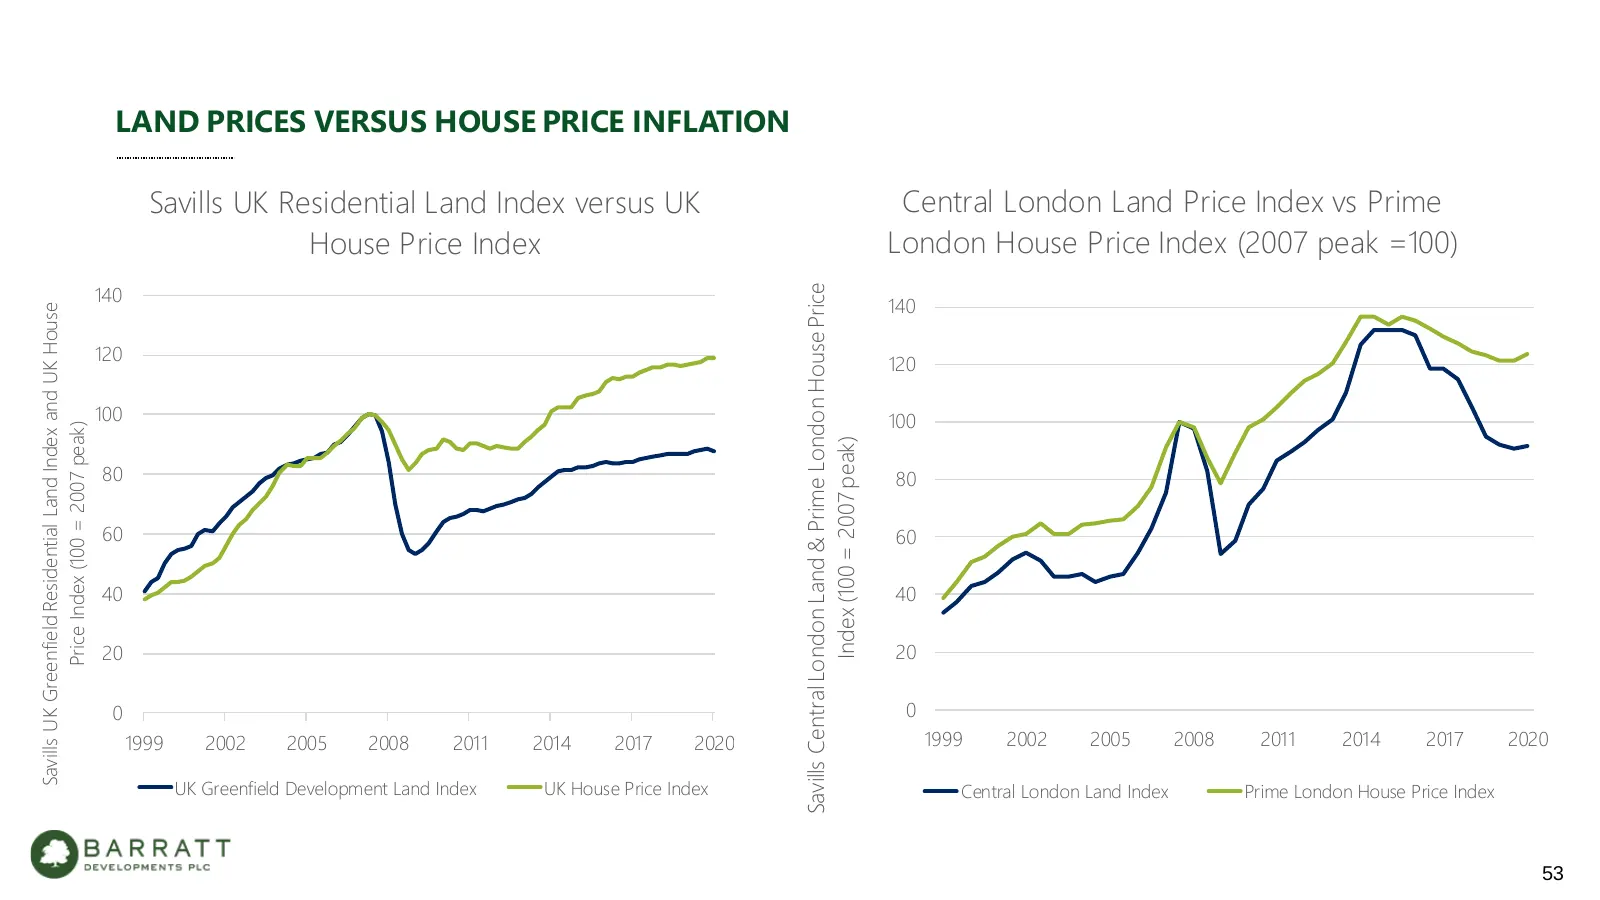
LAND PRICES VERSUS HOUSE PRICE INFLATION Savills UK Residential Land Index versus UK Central London Land Price Index vs Prime House Price Index London House Price Index (2007 peak =100) 140 Savills Central London Land & Prime London House Price 140 Savills UK Greenfield Residential Land Index and UK
Slide 54: Investing in Our People
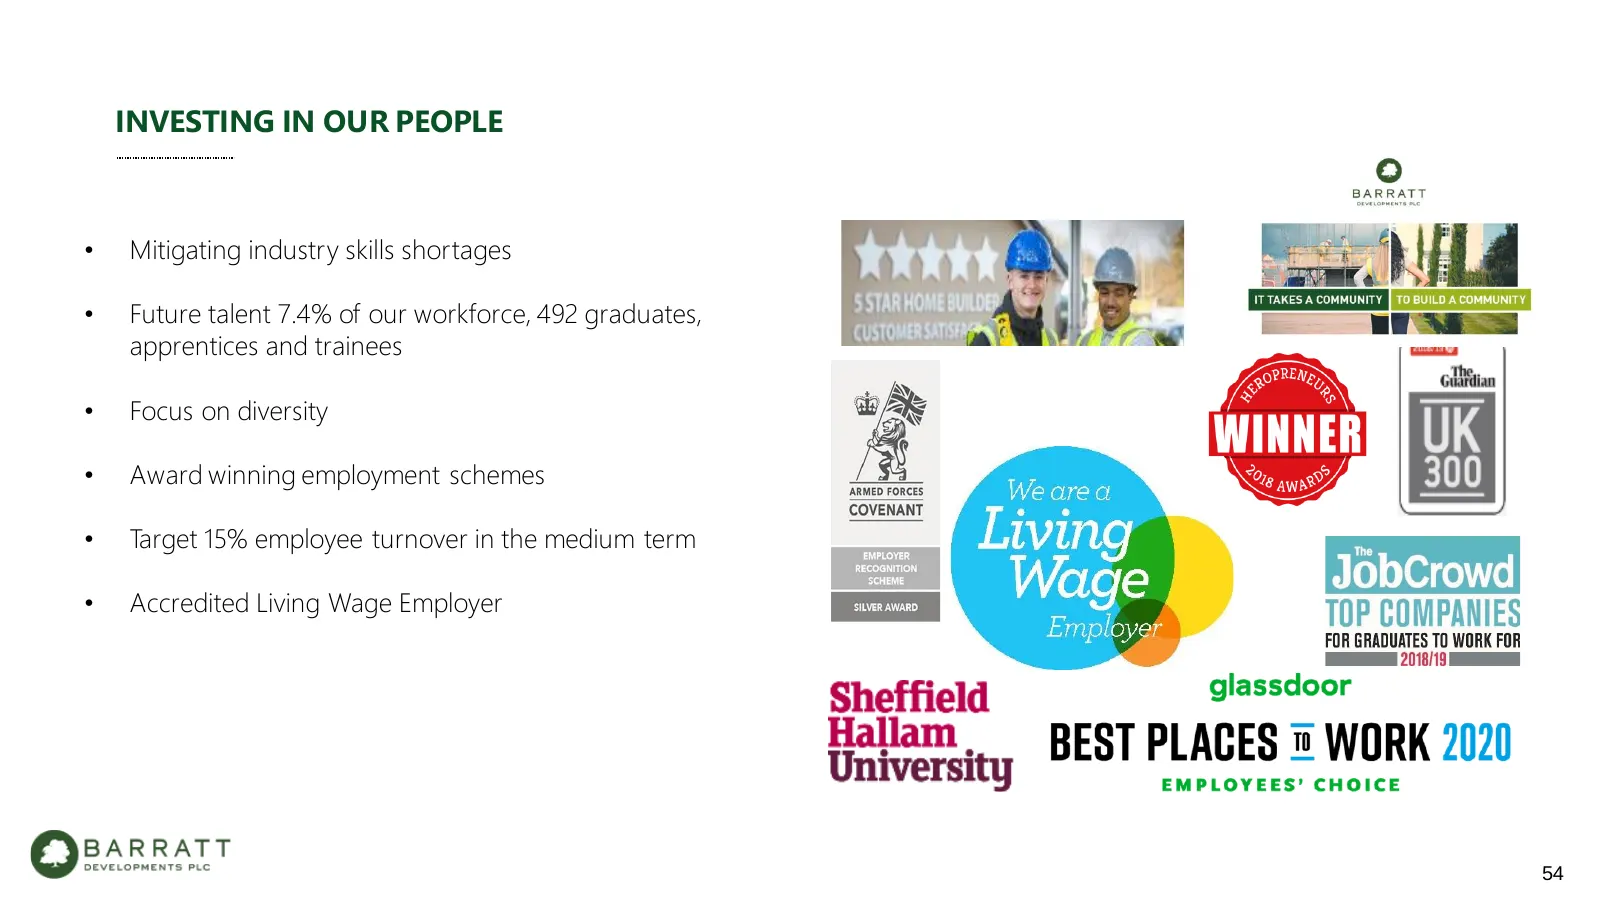
INVESTING IN OUR PEOPLE • Mitigating industry skills shortages • Future talent 7.4% of our workforce, 492 graduates, apprentices and trainees • Focus on diversity • Award winning employment schemes • Target 15% employee turnover in the medium term • Accredited Living Wage Employer 54
Slide 55: External Benchmarks
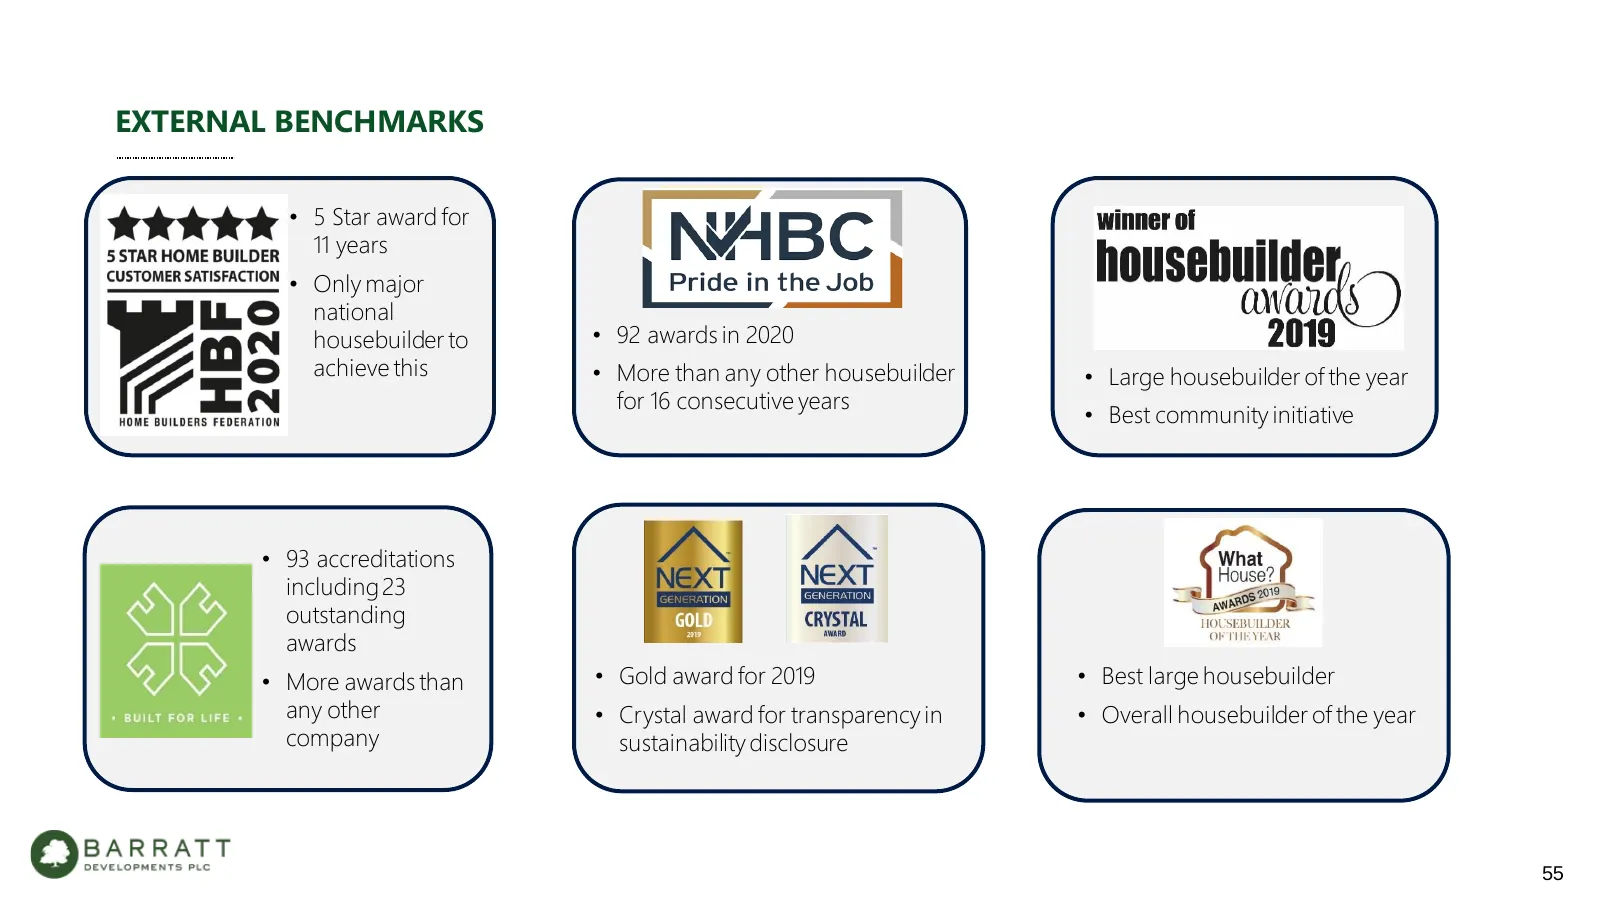
EXTERNAL BENCHMARKS • 5 Star award for 11 years • Only major national housebuilder to • 92 awards in 2020 achieve this • More than any other housebuilder • Large housebuilder of the year for 16 consecutive years • Best community initiative • 93 accreditations including 23 outstanding awards • More a

Slide 56: Disclaimer
DISCLAIMER This document has been prepared by Barratt Developments PLC (the “Company”) solely for use at a presentation in connection with the Company‘s Final Results Announcement in respect of the year ended 30 June 2020. For the purposes of this notice, the presentation (the “Presentation”) shall
Source: Internet Archive copy of barrattdevelopments.co.uk
More decks from Barratt Redrow plc
 FY2026 Earnings Presentation59 slides · Sep 16, 2026
 HY26 Earnings Presentation59 slides · Feb 11, 2026
 FY2025 Earnings Presentation60 slides · Sep 17, 2025
 Corporate Update (May 2025)30 slides · May 1, 2025
 Investor Day (February 2025)40 slides · Feb 12, 2025
 HY25 Earnings Presentation51 slides · Feb 12, 2025