US BioEnergy — Q2 2007 Earnings Presentation
11 slides from US BioEnergy's earnings presentation, Aug 13, 2007
Slide 1: Second Quarter 2007 Financial Results
Second Quarter 2007 Financial Results August 13, 2007
Slide 2: Forward-looking Statements
Forward-looking Statements Certain matters discussed in this presentation are "forward-looking statements." The Private Securities Litigation Reform Act of 1995 has established that these statements qualify for safe harbors from liability. Forward-looking statements may include words like "believe,"
Slide 3: Additional Information About the Millennium Ethanol Merger
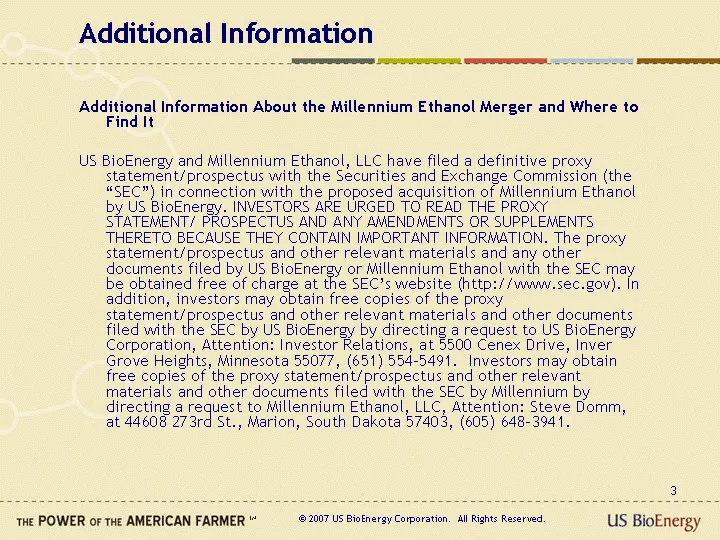
Additional Information Additional Information About the Millennium Ethanol Merger and Where to Find It US BioEnergy and Millennium Ethanol, LLC have filed a definitive proxy statement/prospectus with the Securities and Exchange Commission (the "SEC") in connection with the proposed acquisition of Mi
Slide 4: Key strategic and operating highlights
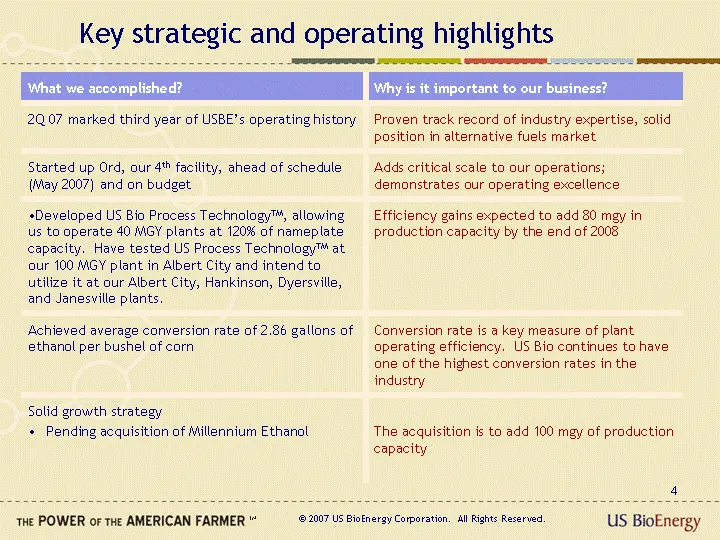
Key strategic and operating highlights What we accomplished? Why is it important to our business? 2Q 07 marked third year of USBE's operating history Proven track record of industry expertise, solid position in alternative fuels market Started up Ord, our 4th facility, ahead of schedule (May 2007) a
Slide 5: US Bio Process Technology
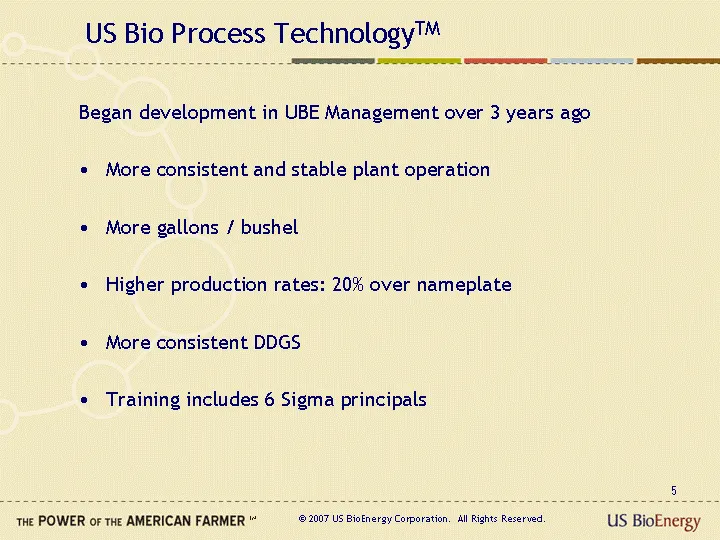
US Bio Process TechnologyTM Began development in UBE Management over 3 years ago More consistent and stable plant operation More gallons / bushel Higher production rates: 20% over nameplate More consistent DDGS Training includes 6 Sigma principals
Slide 6: Growth & Scale
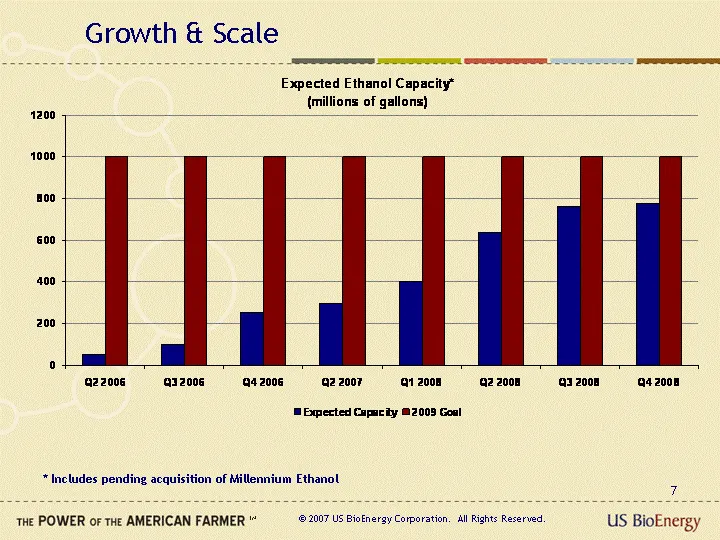
* Includes pending acquisition of Millennium Ethanol Growth & Scale
Slide 7: Construction Progress
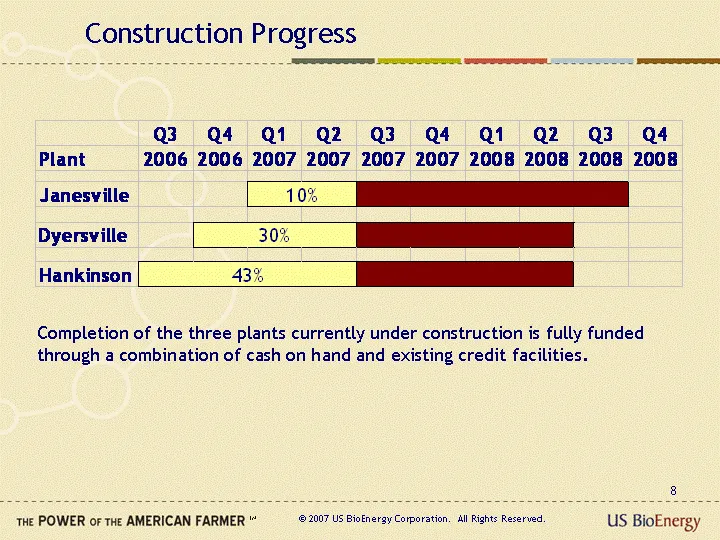
Construction Progress Completion of the three plants currently under construction is fully funded through a combination of cash on hand and existing credit facilities.
Slide 8: Our Financial Performance
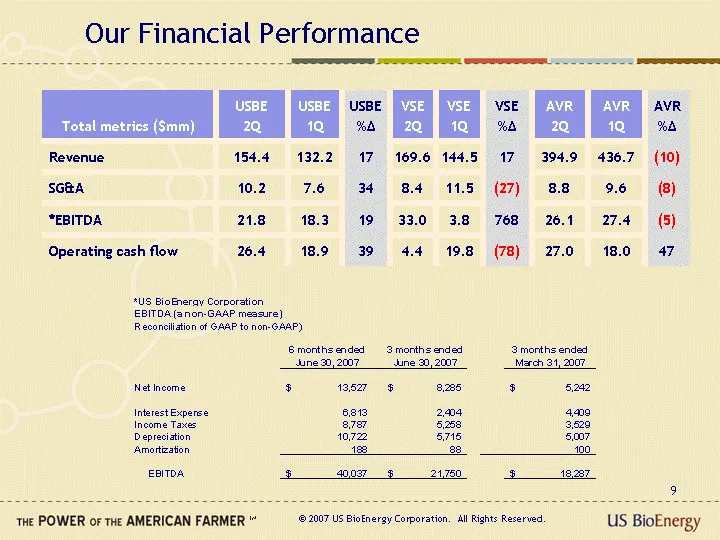
Our Financial Performance Total metrics ($mm) USBE 2Q USBE 1Q USBE %^ VSE 2Q VSE 1Q VSE %^ AVR 2Q AVR 1Q AVR %^ Revenue 154.4 132.2 17 169.6 144.5 17 394.9 436.7 (10) SG&A 10.2 7.6 34 8.4 11.5 (27) 8.8 9.6 (8) *EBITDA 21.8 18.3 19 33.0 3.8 768 26.1 27.4 (5) Operating cash flow 26.4 18.9 39 4.4 19.8
Slide 9: Our operations report card
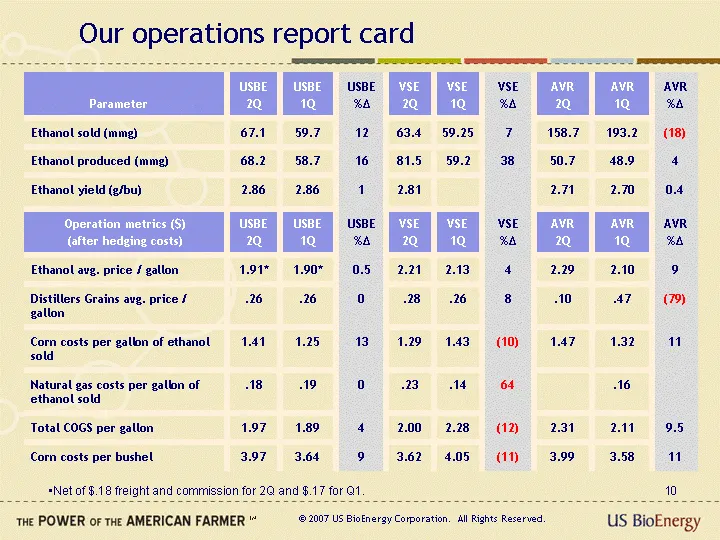
Our operations report card Parameter USBE 2Q USBE 1Q USBE %^ VSE 2Q VSE 1Q VSE %^ AVR 2Q AVR 1Q AVR %^ Ethanol sold (mmg) 67.1 59.7 12 63.4 59.25 7 158.7 193.2 (18) Ethanol produced (mmg) 68.2 58.7 16 81.5 59.2 38 50.7 48.9 4 Ethanol yield (g/bu) 2.86 2.86 1 2.81 2.71 2.70 0.4 Operation metrics ($)
Slide 10: Our liquidity update
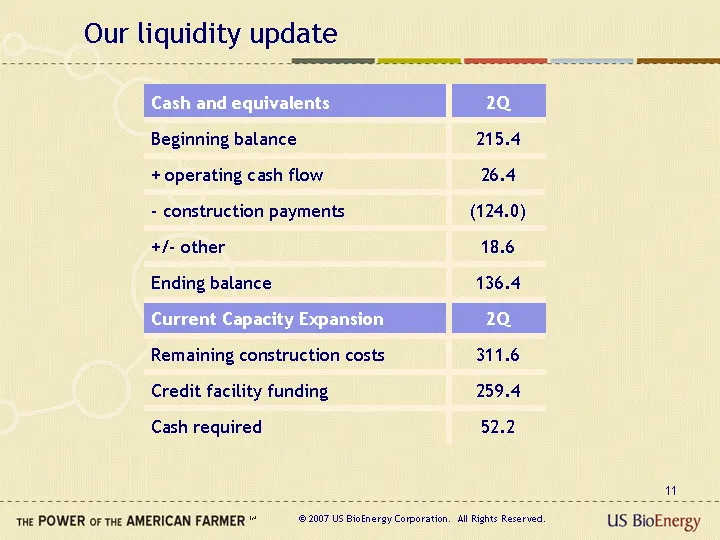
Our liquidity update Cash and equivalents 2Q Beginning balance 215.4 + operating cash flow 26.4 - construction payments (124.0) +/- other 18.6 Ending balance 136.4 Current Capacity Expansion 2Q Remaining construction costs 311.6 Credit facility funding 259.4 Cash required 52.2
Slide 11: Conclusion
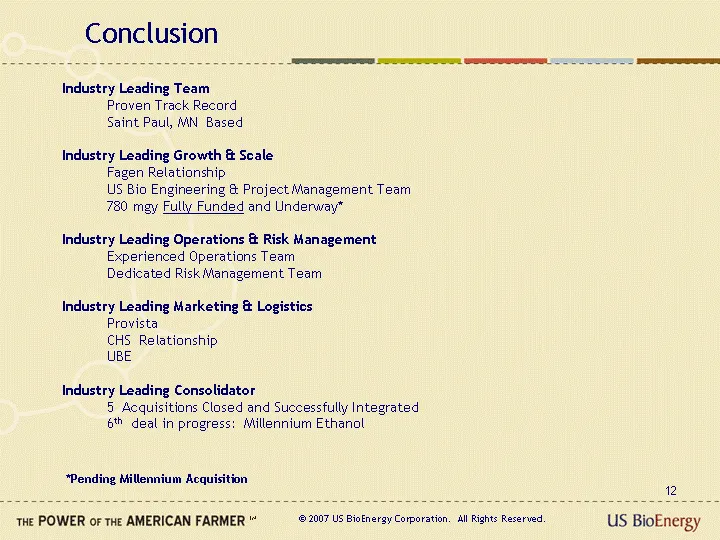
Conclusion Industry Leading Team Proven Track Record Saint Paul, MN Based Industry Leading Growth & Scale Fagen Relationship US Bio Engineering & Project Management Team 780 mgy Fully Funded and Underway* Industry Leading Operations & Risk Management Experienced Operations Team Dedicated Risk Manage
Source: SEC EDGAR · 8-K filed Aug 13, 2007