Sun Healthcare — Merger or Acquisition (May 2010)
38 slides from Sun Healthcare's merger presentation, May 27, 2010

Slide 1: Sun Healthcare: Caring is the Key in Life
\ HEALTHCARE Caring is the Key in Life
Slide 2: Forward-looking statements
Statements made in this presentation that are not historical facts are "forward-looking" statements (as defined in the Private Securities Litigation Reform Act of 1995) that involve risks and uncertainties and are subject to change at any time. These forward-looking statements may include, but are n
Slide 3: Non-GAAP financial measures: EBITDA, EBITDAR and FFO
References are made in this presentation to EBITDA, EBITDA margin, EBITDAR, EBITDAR margin and FFO, which are non-GAAP financial measures. These non-GAAP financial measures are reconciled to the corresponding GAAP financial measures in the Appendices included at the end of this presentation. EBITDA

Slide 4: Additional information on the restructuring transaction
In connection with the restructuring transaction described in this presentation, SHG Services, Inc. (“Operating Company”) has filed with the SEC a Registration Statement on Form S-1 and Sabra Health Care REIT, Inc. has filed with the SEC a Registration Statement on Form S-4, each containing an ident

Slide 5: Recent Developments / Restructuring Transactions
Recent Developments / Restructuring Transactions
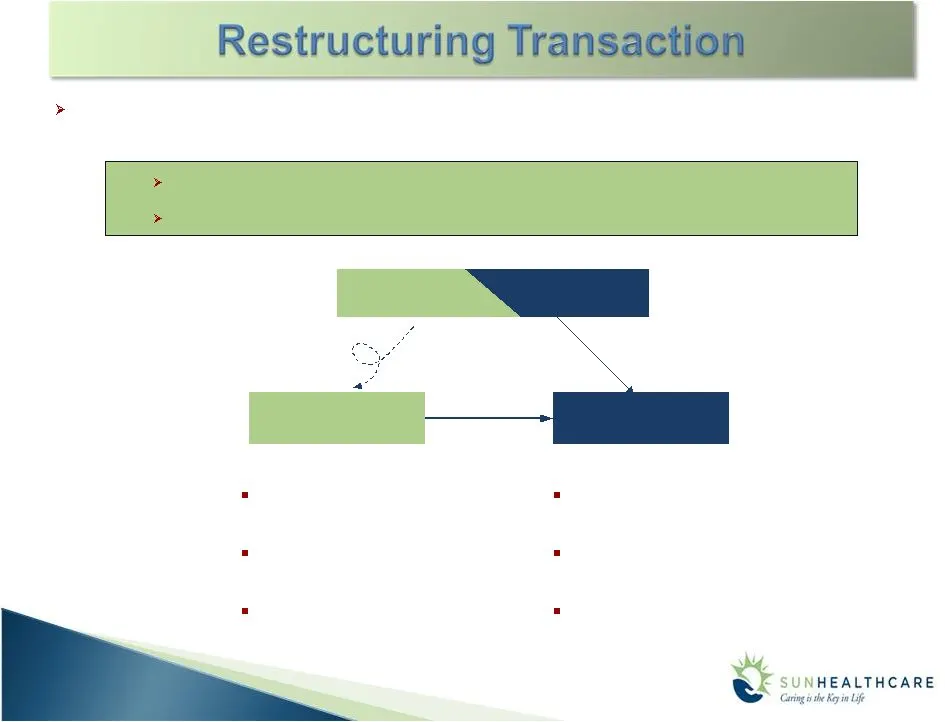
Slide 6: Plan to separate into two publicly traded companies
Operations Operating Company REIT Real Estate Sun Healthcare Group On 05/24/10 Sun Healthcare announced plans to separate into two separate publicly traded companies Will own Sun’s operating subsidiaries Will continue to service all of its 205 centers Will manage and grow ancillary services Will own
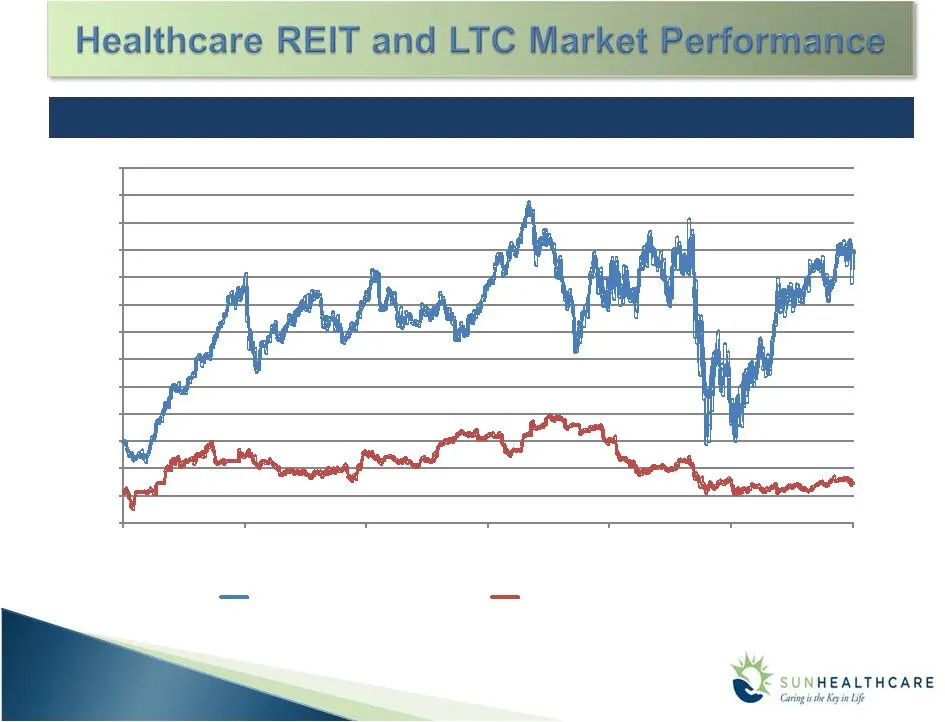
Slide 7: Forward FFO Multiple and Forward EBITDAR Multiple 2003-2010 YTD
Forward FFO Multiple and Forward EBITDAR Multiple – 2003-2010 YTD 6.5x 15.0x Source: CapitalIQ as of 5/16/10 Long Term Care Index: EXE, SKH, ENSG, KND, SUNH, Manor Care, Genesis HC REIT Index: VTR, NHP, HR, HCP, HCN, LTC, SNH, OHI 5.0x 6.0x 7.0x 8.0x 9.0x 10.0x 11.0x 12.0x 13.0x 14.0x 15.0x 16.0x 17
Slide 8: Operating Company and REIT
Operating Company REIT Attractive geographic diversity with national footprint Proven operating platform focused on high acuity patients Product diversification Stable and reliable cash flows Strong balance sheet Considerable growth opportunities in higher margin hospice sector Strong relationships
Slide 9: Focused Organization Positioned for Optimal Operating Execution
Focused Organization Positioned for Optimal Operating Execution High Quality Portfolio and Premium Assets Geographically diversified with strong operating metrics Proven track record of public company performance Ability to manage higher acuity patients and drive better margins Attractive Financial
Slide 10: REIT Focused on Diverse Expansion in the Health Care Sector
REIT Focused on Diverse Expansion in the Health Care Sector Establishes Industry Focused REIT Well Positioned to Build a Broad-based Healthcare Real Estate Portfolio Healthcare has proven to be a stable asset class vs. other property types Healthcare REITs have meaningfully outperformed the overall
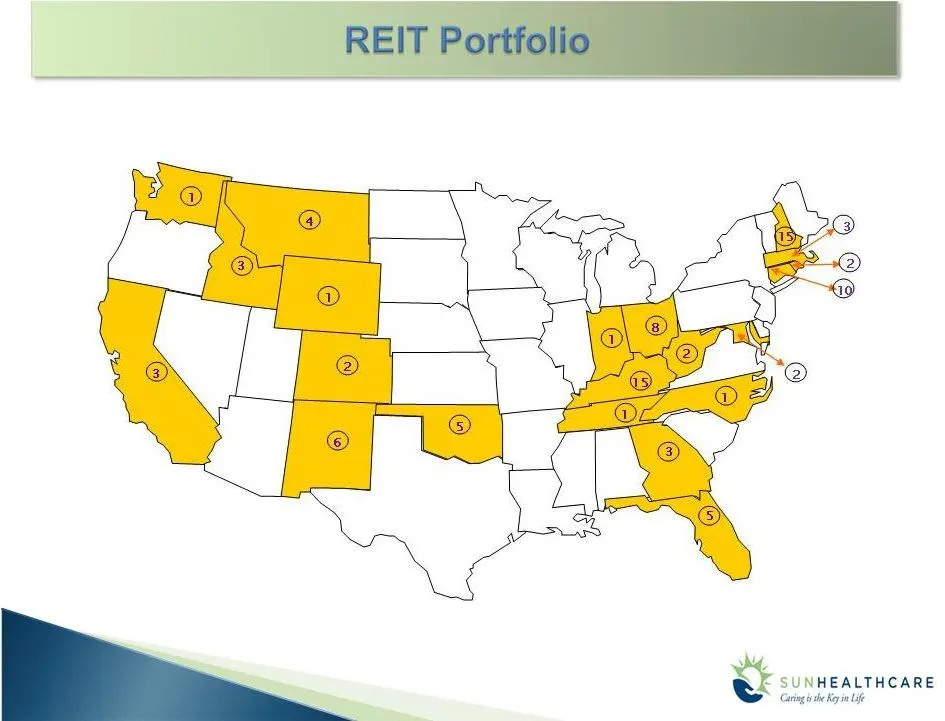
Slide 11: Licensed Beds in States
9,934 Licensed Beds in 21 States 9,586 Available Beds 93 Facilities (82 Skilled, 9 AL/IL, 2 Mental Health)
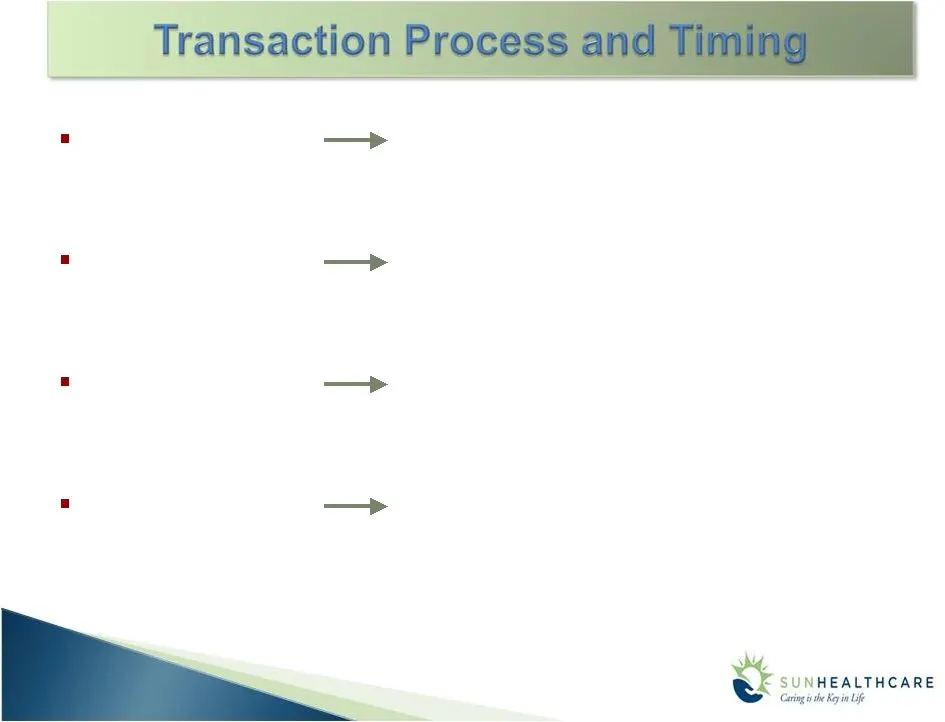
Slide 12: Transaction timeline
May 24 July – August October – November December Announce Transaction Equity Offering (Proceeds Used to Reduce Debt) Refinance Debt at New Sun and Sabra Separation
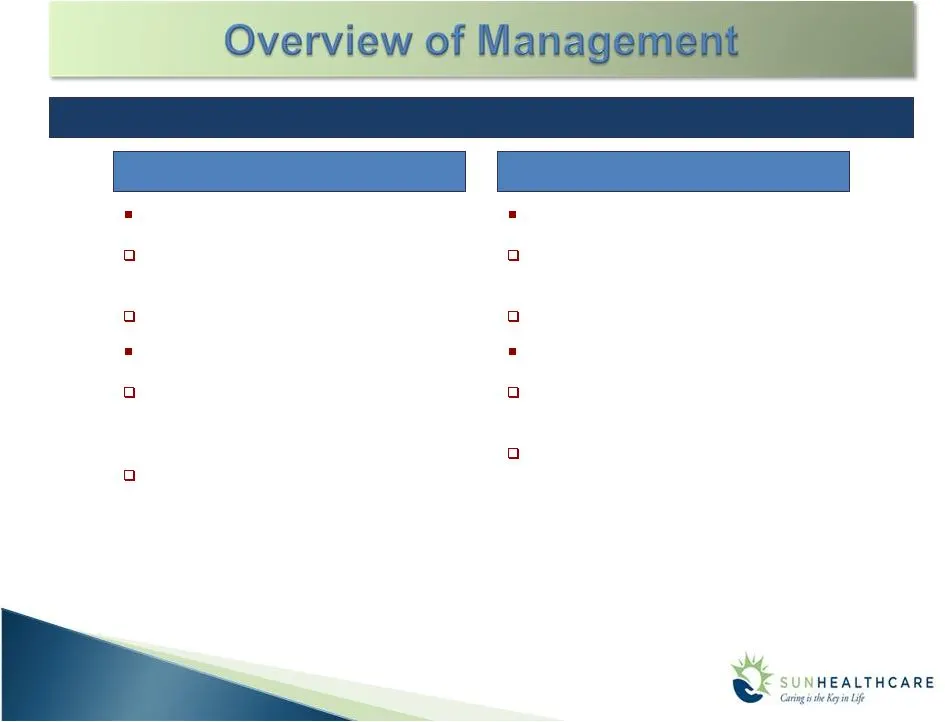
Slide 13: Transaction Provides Continuity of Sun Healthcare Leadership
New Sun Healthcare Group, Inc. Sabra Health Care REIT, Inc. Transaction Provides Continuity of Sun Healthcare Leadership Management Bill Mathies, CEO and Chairman Designate No other management changes Bill Mathies President of SunBridge Healthcare Corp. since 2002 and COO since 2006 of all operating

Slide 14: Transaction Pro Forma
Transaction Pro Forma Transaction Pro Forma
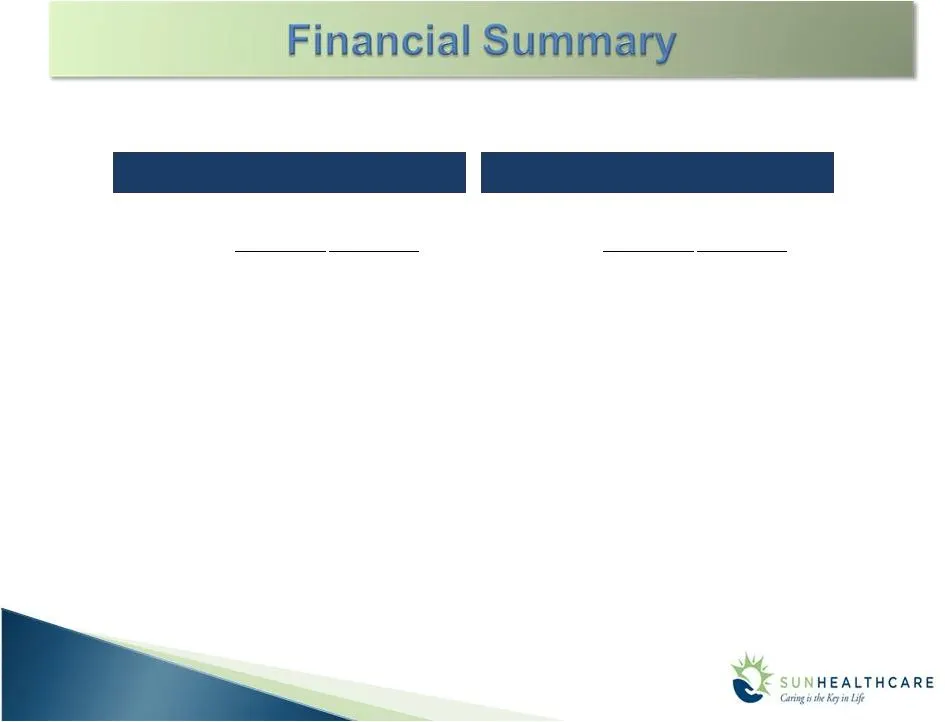
Slide 15: Pro Forma New Sun and Sabra
New Sun Healthcare Group, Inc. Sabra Health Care REIT, Inc. Pro Forma (Dollars in millions) (1) Adjusted for one-time expenses related to net restructuring costs and net loss on sale of assets. (2) Calculated in accordance with NAREIT’s definition of FFO except that there are no adjustments for gain
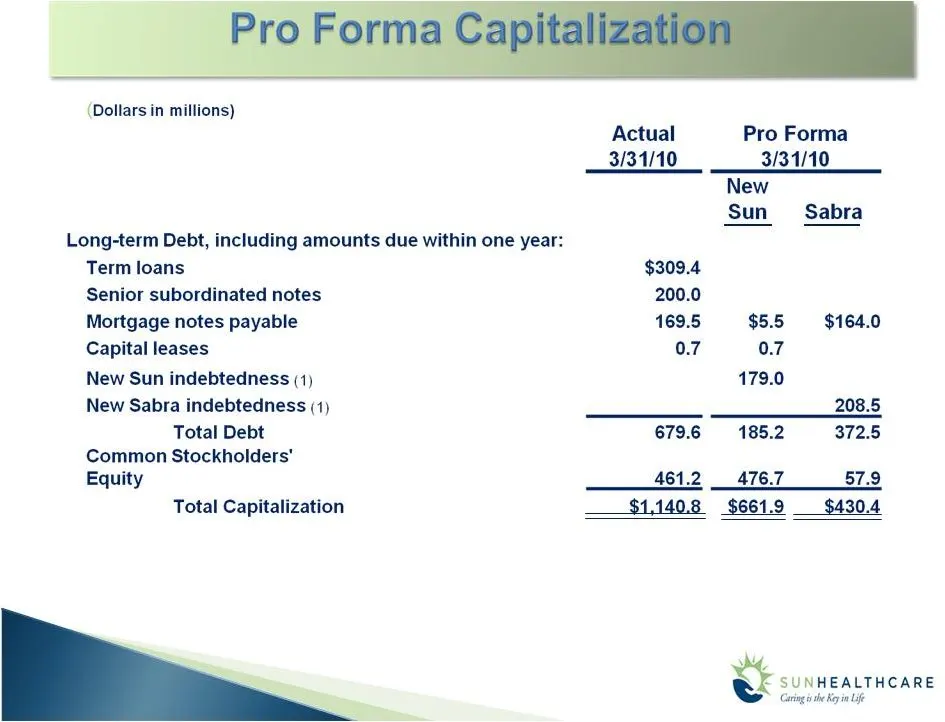
Slide 16: Pro forma indebtedness
The actual amount of the New Sun and/or New Sabra indebtedness may be less than the amount shown above if cash collections from operation s between March 31, 2010 and the date of the Separation are received in accordance with Sun's projections. (1)

Slide 17: Sun Healthcare
SUNHEALTHCARE Caring yin Life

Slide 18: Sun 1st Quarter 2010 Results
(dollars in thousands, except per share data) Revenue $473,255 $468,129 Depreciation and amortization 12,446 10,723 Interest expense, net 11,977 12,726 EBITDAR $ 60,770 $ 61,473 Margin – EBITDAR 12.8% 13.1% EBITDA $ 42,218 $ 43,110 Margin – EBITDA 8.9% 9.2% Income from continuing operations 10,499 1

Slide 19: Debt Table March 2010
Interest Rate 9.1% 4.5% 6.5% 10.0% 6.4% 5.2% ($ in millions) 309.4 Term Loans $ --- Revolving Credit Facility – $50 million $ 679.6 200.0 479.6 0.7 169.5 $ 102.5 Total Debt Subordinated Debt Senior Secured Debt Capital Leases Mort g a ge Debt Debt: Cash Debt Debt Table – March 2010
Slide 20: Net Debt and Leverage
$644 $606 $683 3.9x 3.4x 4.9x 3.3x Q4 ‘07 Q4 ‘08 Q4 ‘09 $587 Q1 ‘10 Q4 ‘09 Q4 ‘08 Q4 ‘07 Q1 ‘10 Net Debt Leverage Net Debt /EBITDA
Slide 21: First Quarter 2010 Free Cash Flow
First Quarter 2010 Strong Free Cash Flow ($ in millions) Cash flow from operations $38.1 Capital expenditures (17.1) Free cash flow $21.0 FYE 2010 $50 to $55

Slide 22: Appendix
APPENDIX

Slide 23: Non GAAP Reconciliation
NON GAAP RECONCILIATION

Slide 24

Slide 25: Reconciliation to Reported EBITDA and EBITDAR
As Reported Reconciliation Section (Dollars in millions) For the Three For the Three Months Ended Months Ended March 31, 2010 March 31, 2009 Revenue 473.3 $ 468.1 $ Income from continuing operations 10.5 11.6 Add: Income tax expense 7.3 8.1 D&A 12.4 10.7 Interest 12.0 12.7 EBITDA 42.2 $ 43.1 $ Margi
Slide 26

Slide 27: Reconciliation to Pro Forma EBITDA and EBITDAR
(Dollars in millions) Proforma Proforma For the Twelve For the Three Months Ended Months Ended December 31, 2009 March 31, 2010 Revenue 1,881.8 $ 473.3 $ Net income from continuing operations 36.7 8.8 Add: Income tax expense 25.5 6.1 D&A 24.6 7.2 Interest 10.7 2.7 Restructuring costs and net loss on

Slide 28: Sabra Reconciliation to Pro Forma FFO and EBITDA
Pro Forma Reconciliation Section (Dollars in millions) Proforma Proforma For the Twelve For the Three Months Ended Months Ended December 31, 2009 March 31, 2010 Revenue 71.9 $ 18.0 $ Net income 25.5 6.4 Add: D&A 20.9 5.2 FFO 46.4 $ 11.6 $ Add: Interest 23.1 5.8 EBITDA 69.5 $ 17.4 $ Sabra Health Care

Slide 29: Q1 Operating Metrics
Q1 Operating Metrics
Slide 30: Revenue by business unit and payor mix
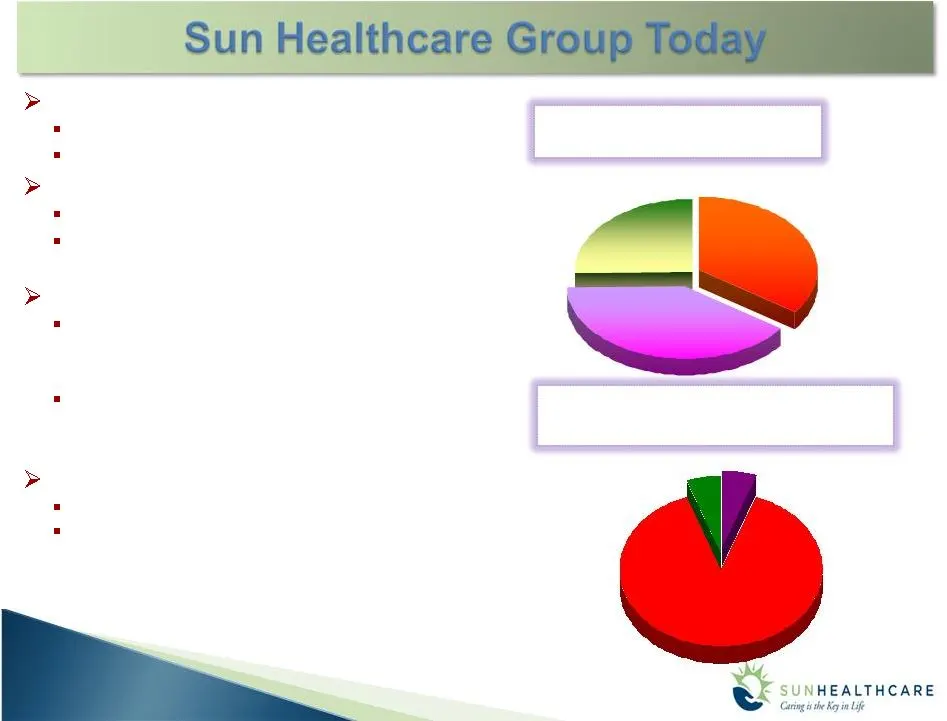
Inpatient 89.1% SunBridge 205 inpatient facilities 19,700 patients/residents SunDance 460+ contracts/330 non-affiliated Contract services, rehab agency, mana g ement services CareerStaff More than 50% of business is in hospital settin g s (also serves SNFs, schools, prisons) More than 50% of billing
Slide 31: Medicare and Medicaid reimbursement
Medicare Implementation of Resource Utilization Group (RUG) system to RUG-IV 13 new RUG categories focused on medically complex RUGS-IV and elimination of lookback and concurrent effective 10/1/10 Medicaid Guidance assumes flat rates – over States continue to have budgetary issues that may effect ra
Slide 32: Enhance our clinical product and service delivery
Enhance our clinical product and service delivery Focus on specialty services –Solana/Rehab Recovery Suites ® Expanding services for clinically complex patients Continue to execute modernization of the centers - Pulmonary Disease Management - Neurological and Neurovascular Management - Cardiac Disea
Slide 33: SunBridge Performance Metrics
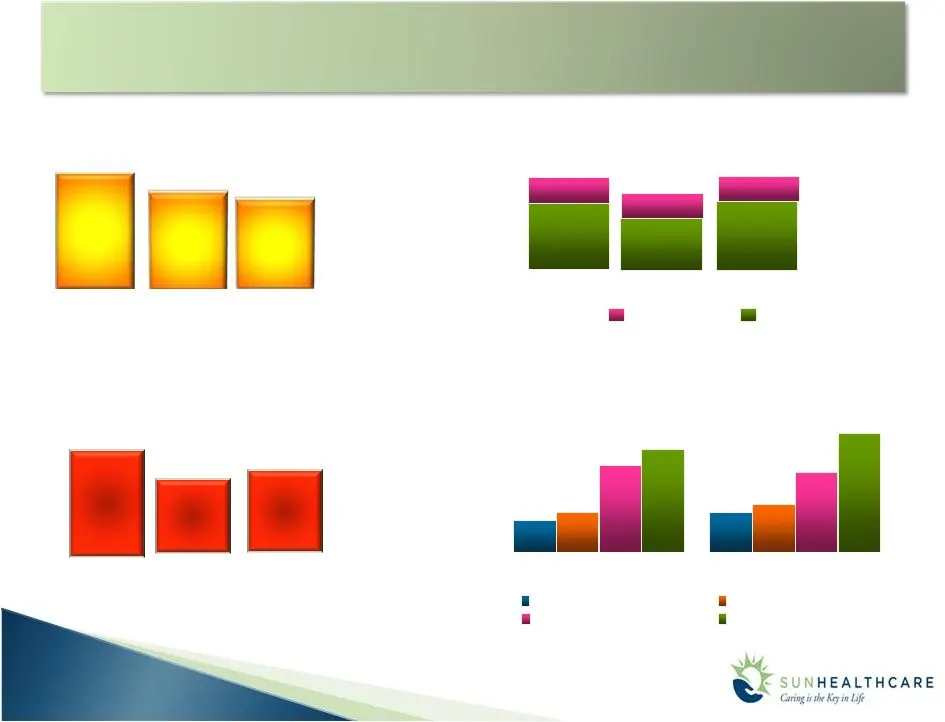
3.0% 5.1% 3.5% 33.9% 6.7 % 31.1% 6.3% 6.1% 32.5% Occupancy (3) Quality mix includes all non-Medicaid inpatient revenues Inpatient Revenue Quality Mix $173 $177 $373 $466 Inpatient Revenue Per Patient Day $450 $ 364 $168 Medicaid Private and Other (Percentages represent change from prior period) Q1 ‘
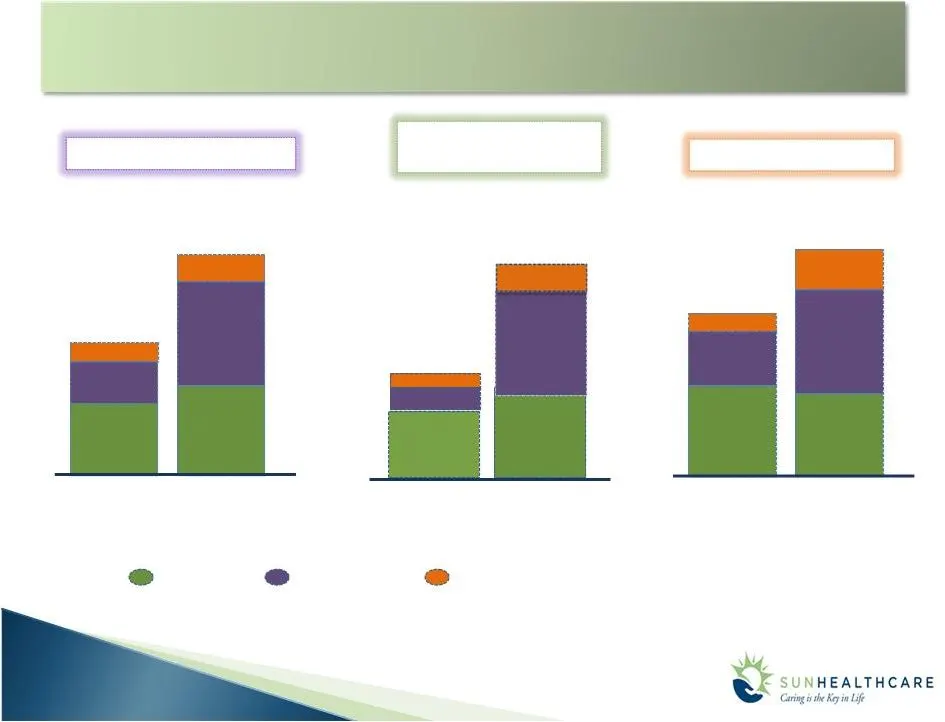
Slide 34: Product Differentiation: RRS and Solana
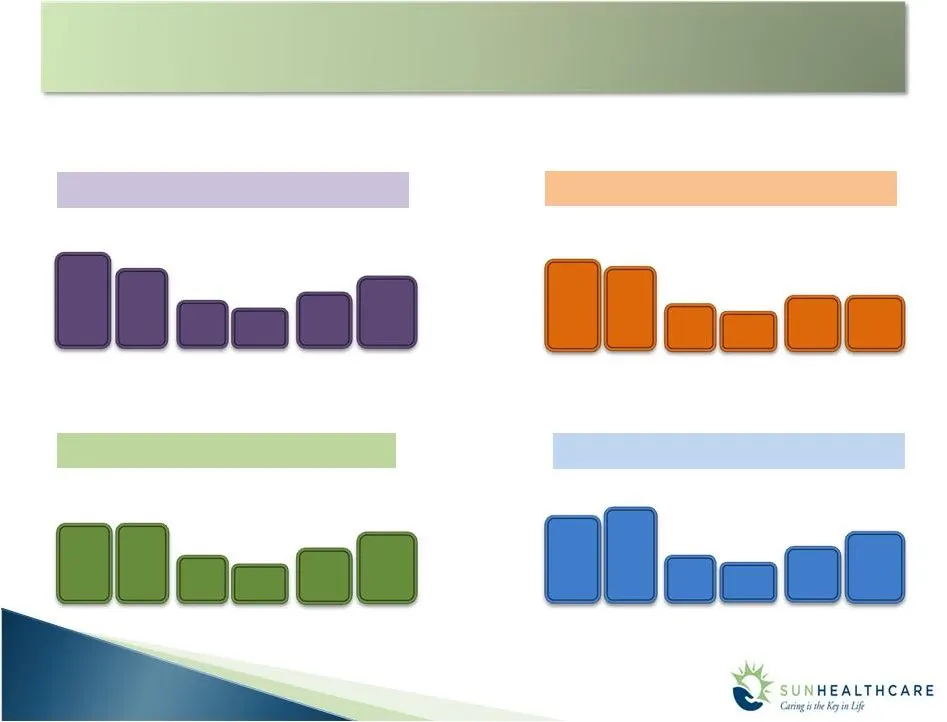
Product Differentiation RRS and Solana (Same Store Basis) Q1 ‘09 Q1 ‘10 90.4 % 87.7 % 26.6 % 25.4 % 262.26 267.92 Q1 ‘09 Q1 ‘10 Q1 ‘09 Q1 ‘10 Occupancy Rates Q1 ‘09 Q1 ‘10 Q1 ‘09 Q1 ‘10 Q1 ‘09 Q1 ‘10 90.5 % 89.0 % 17.2 % 15.8 % 230.73 230.30 Occupancy Skilled Mix % Rates Q1 ‘09 Q1 ‘10 86.6 86.6 % 19
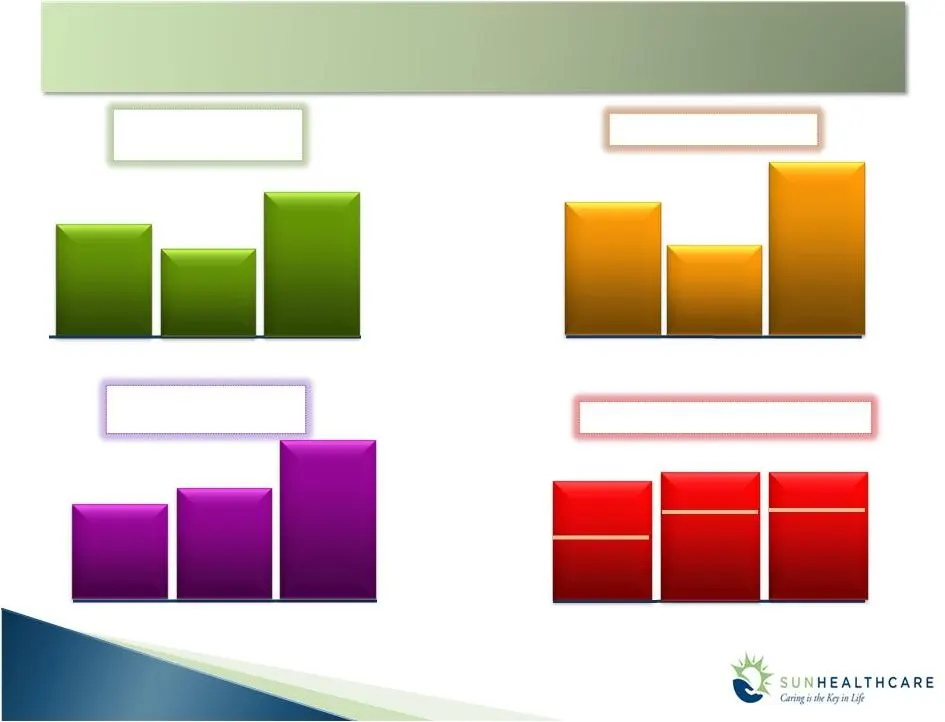
Slide 35: SolAmor Performance Metrics
$3.4 $4.0 283 321 19.7% 19.5% Revenue ($ in millions) EBITDA Margin SolAmor Performance Metrics ADC Q1 ‘10 Q1 ‘09 $1.7 $0.7 $5.7 $1.3 $11.0 $5.8 Q1 ‘09 Q1 ‘10 Q1 ‘09 Q1 ‘10 17.7% 20.3% 14.9% 14.1% 19.4% : Legacy : Acquisition : DeNovo
Slide 36: SunDance Performance Metrics
$43.7 $46.3 6.9% 5.7% 8.0% $97.0 $99.8 Revenue / Contract ($ in thousands) EBITDA Margin Non-Affiliated Contracts SunDance Performance Metrics Revenue ($ in millions) Q1 ‘09 Q4 ‘09 $50.5 Q1 ‘10 Q1 ‘09 Q4 ‘09 Q1 ‘10 Q1 ‘09 Q4 ‘09 Q1 ‘10 $ 107.9 Q1 ‘09 SNF ALF/Other Q4 ‘09 SNF ALF/Other ALF/Other Q1 ‘
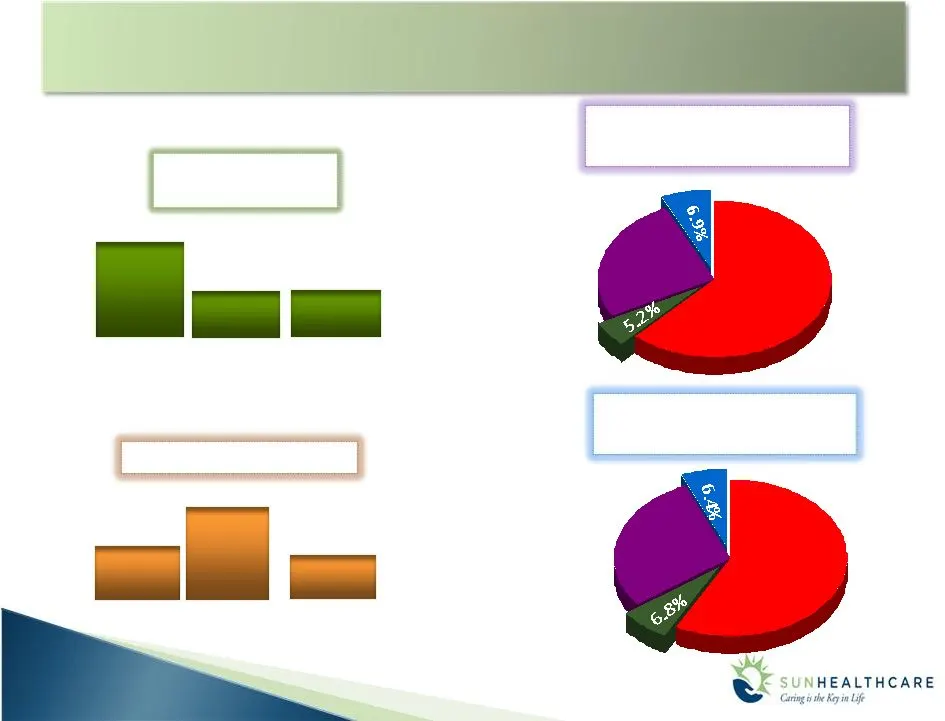
Slide 37: CareerStaff Unlimited Performance Metrics
61.9% 25.9% Allied Nursing $27.9 $23.6 $23.5 7.9% 10.1% 7.1% 57.9% 28.9% Allied Nursing Pharmacy Physician Services EBITDA Margin Q1 ‘09 Q4 ‘09 Q1 ‘10 Q1 ‘09 Q4 ‘09 Q1 ‘10 Pharmacy Physician Services Revenue ($ in millions) Q1 ’10 Revenue By Type Q1 ’09 Revenue By Type CareerStaff Unlimited Performa

Slide 38: Sun's Commitment to Quality
p. 2 Letter from Our CEO p. 3 Our Public Commitments to Quality Improvement p. 7 About Our Nursing Centers p. 9 Our Approach to Quality and its Measurement p. 10 Quality Information p. Enhancing the Quality of Our Residents’ Lives p. 20 About Our Employees p. 22 Employee Spirit and Achievement p. 24
Source: SEC EDGAR · 425 filed May 27, 2010
More decks from Sun Healthcare Group Inc
 Jefferies 2012 Global Healthcare Conference17 slides · Jun 6, 2012
 J.P. Morgan Healthcare Conference 201219 slides · Jan 10, 2012
 Investor Presentation (March 2011)36 slides · Mar 29, 2011
 JPMorgan Healthcare Conference (January 2011)27 slides · Jan 10, 2011
 Non-Deal Roadshow (July 2010)33 slides · Jul 12, 2010
 Wells Fargo Securities 2010 Healthcare Conference25 slides · Jun 24, 2010