Hudson City Bancorp — FBR 2005 Investor Conference
25 slides from Hudson City Bancorp's conference presentation, Nov 28, 2005

Slide 1: FBR 2005 Investor Conference
FBR 2005 Investor Conference November 29
Slide 2: Forward-Looking Statement
This presentation may contain "forward-looking statements," which may be identified by the use of such words as "may," "believe," "expect," "anticipate," "should," "plan," "estimate," "predict," "continue" and "potential" or the negative of these terms or other comparable terminology. Examples of fo

Slide 3: Overview & Strategy
oe Se eee Overview & Strategy
Slide 4: Overview
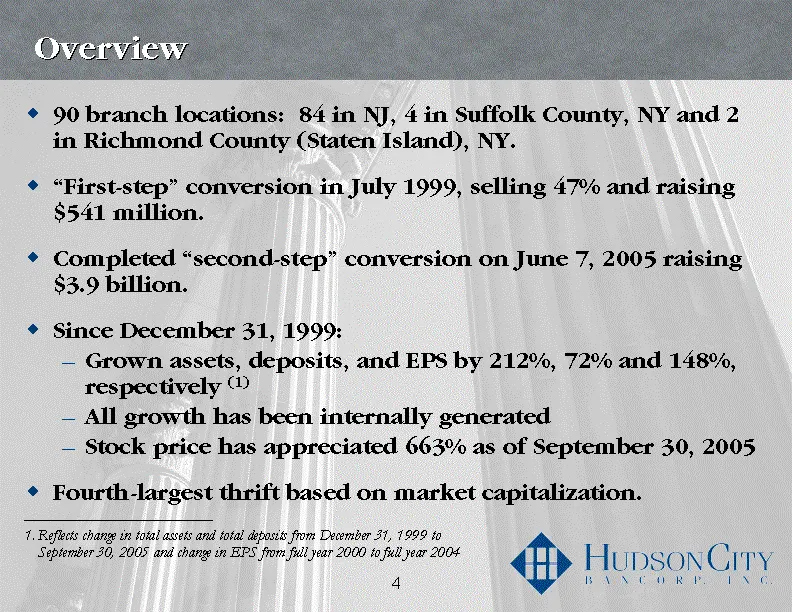
Overview 90 branch locations: 84 in NJ, 4 in Suffolk County, NY and 2 in Richmond County (Staten Island), NY. "First-step" conversion in July 1999, selling 47% and raising $541 million. Completed "second-step" conversion on June 7, 2005 raising $3.9 billion. Since December 31, 1999: Grown assets, de
Slide 5: Operating Model
Operating Model Simple, consistent operating model Originate and purchase single family mortgage loans A jumbo originator and purchaser Retain all loans originated Outstanding Credit Quality Fund lending and investing activities with retail deposits and borrowings Compete on the basis of effective c
Slide 6: Operating Model (continued)
Operating Model (continued) Mortgage Loans Prime Products Only (Jumbo) No Option Arms or Neg-Am Multiple Distribution Channels Retail - Our Own Agents Retail - Mortgage Brokers and Bankers Wholesale - Geographic Diversity Cross Selling Initiatives and Incentives
Slide 7: Large, Affluent Markets
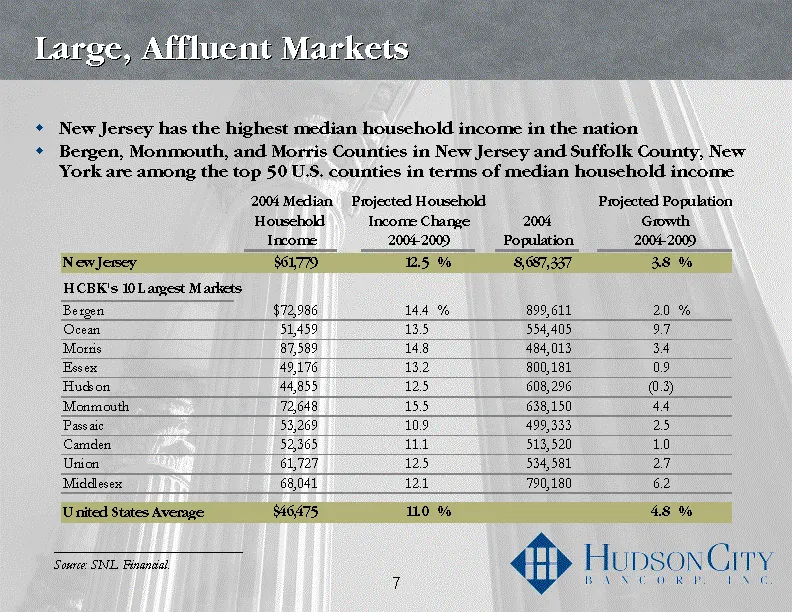
Large, Affluent Markets New Jersey has the highest median household income in the nation Bergen, Monmouth, and Morris Counties in New Jersey and Suffolk County, New York are among the top 50 U.S. counties in terms of median household income ___________________________ Source: SNL Financial.
Slide 8: Strong Market Position
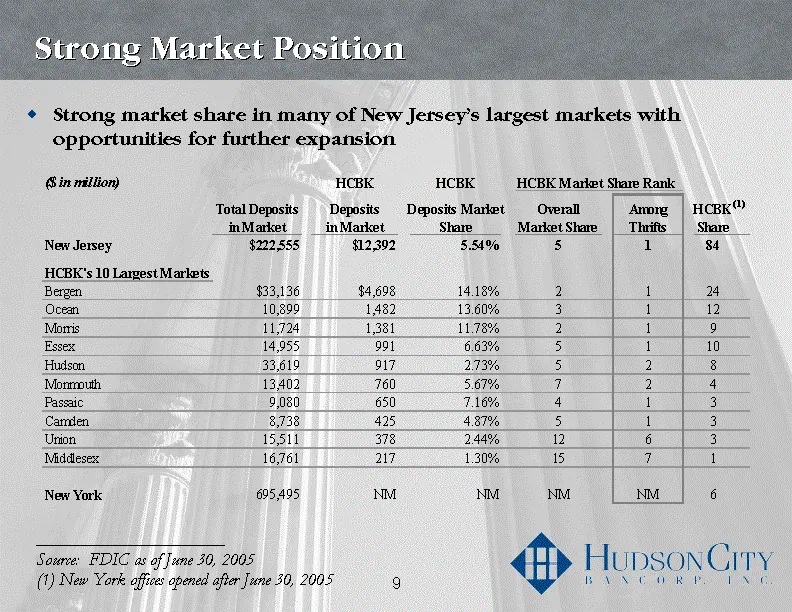
Strong Market Position ___________________________ Source: FDIC as of June 30, 2005 (1) New York offices opened after June 30, 2005 Strong market share in many of New Jersey's largest markets with opportunities for further expansion
Slide 9: Second-step Conversion
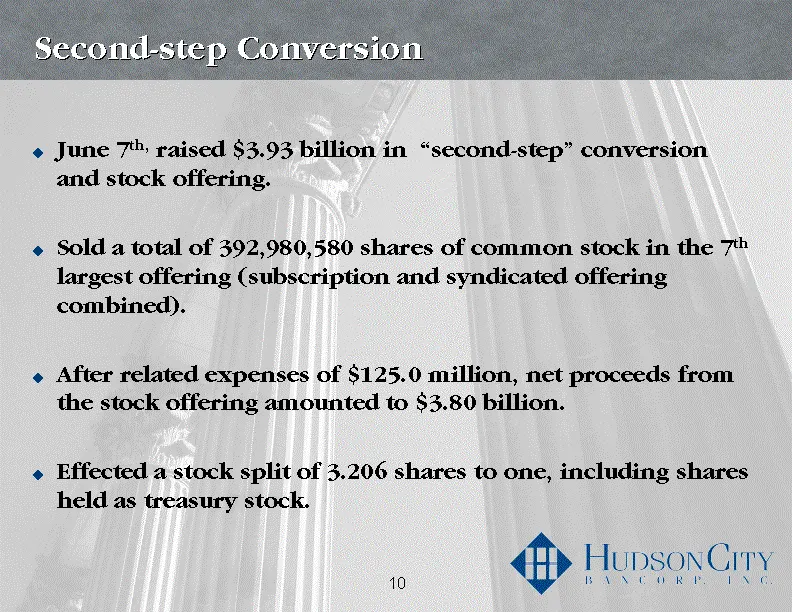
Second-step Conversion June 7th, raised $3.93 billion in "second-step" conversion and stock offering. Sold a total of 392,980,580 shares of common stock in the 7th largest offering (subscription and syndicated offering combined). After related expenses of $125.0 million, net proceeds from the stock
Slide 10: Capital Deployment
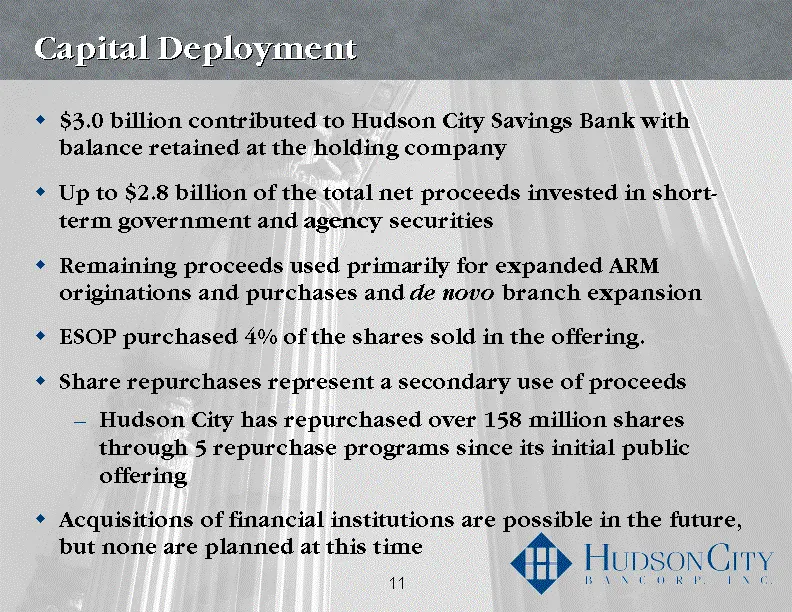
Capital Deployment $3.0 billion contributed to Hudson City Savings Bank with balance retained at the holding company Up to $2.8 billion of the total net proceeds invested in short-term government and agency securities Remaining proceeds used primarily for expanded ARM originations and purchases and
Slide 11: Strategy: Focused Growth
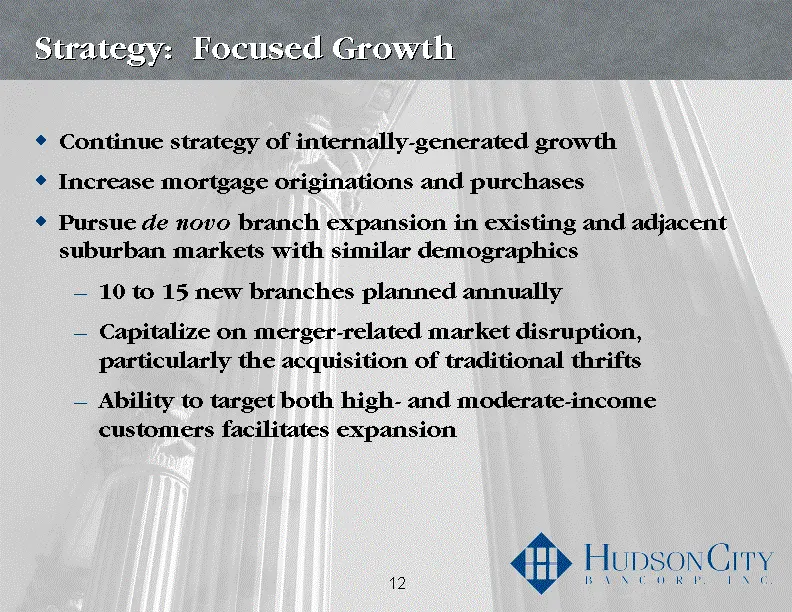
Strategy: Focused Growth Continue strategy of internally-generated growth Increase mortgage originations and purchases Pursue de novo branch expansion in existing and adjacent suburban markets with similar demographics 10 to 15 new branches planned annually Capitalize on merger-related market disrup
Slide 12: Operational and Financial Review
Operational and Financial Review 25
Slide 13: Financial Snapshot
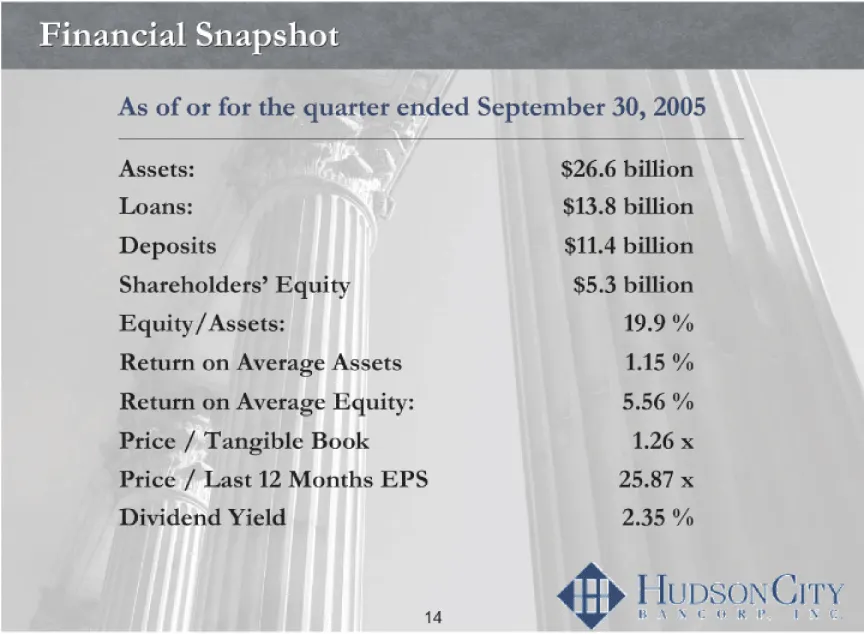
Financial Snapshot Assets: $26.6 billion Loans: $13.8 billion Deposits $11.4 billion Shareholders' Equity $5.3 billion Equity/Assets: 19.9 % Return on Average Assets 1.15 % Return on Average Equity: 5.56 % Price / Tangible Book 1.26 x Price / Last 12 Months EPS 25.87 x Dividend Yield 2.35 % As of or
Slide 14: Quarterly Earnings
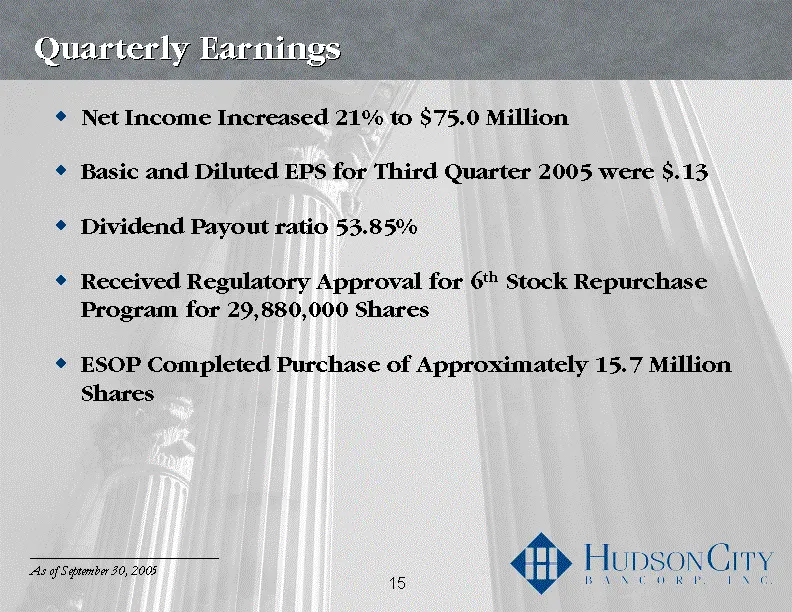
Quarterly Earnings Net Income Increased 21% to $75.0 Million Basic and Diluted EPS for Third Quarter 2005 were $.13 Dividend Payout ratio 53.85% Received Regulatory Approval for 6th Stock Repurchase Program for 29,880,000 Shares ESOP Completed Purchase of Approximately 15.7 Million Shares __________
Slide 15: Strong Asset Growth (CAGR)
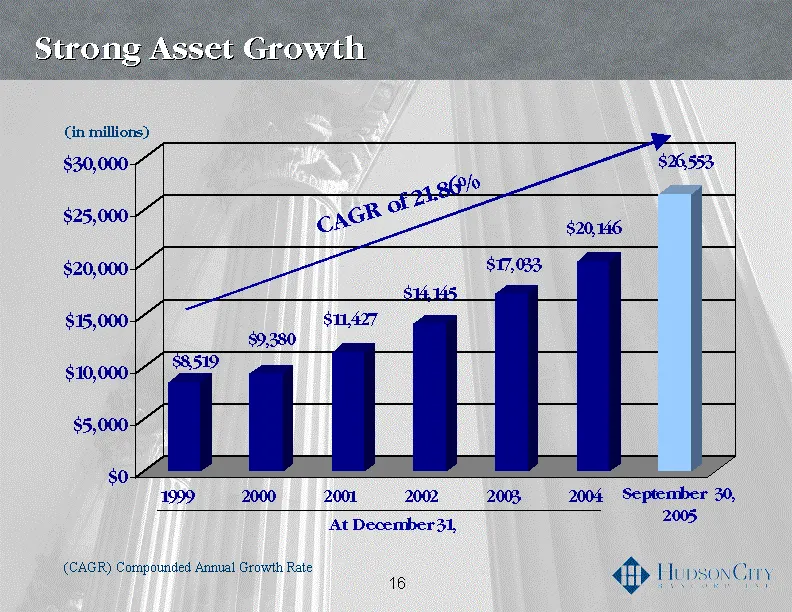
Strong Asset Growth (CAGR) Compounded Annual Growth Rate 31
Slide 16: Residential Mortgage Lending Growth
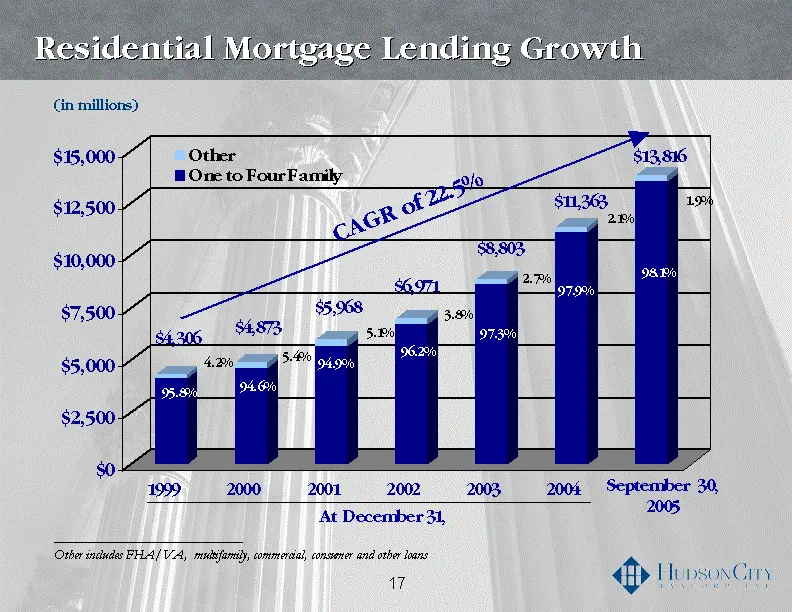
Residential Mortgage Lending Growth ___________________________ Other includes FHA/VA, multifamily, commercial, consumer and other loans 33
Slide 17: Consistently Superior Credit Quality
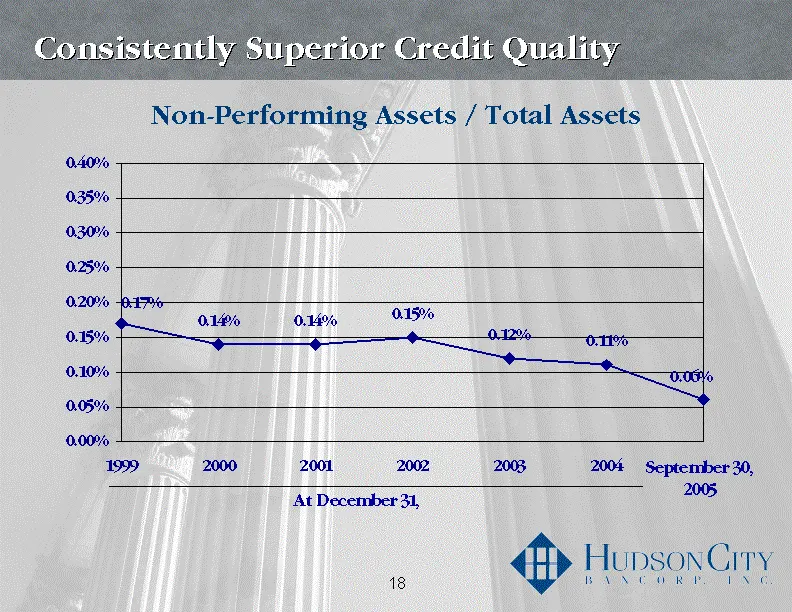
Consistently Superior Credit Quality Non-Performing Assets / Total Assets
Slide 18: Consistently Superior Credit Quality (continued)
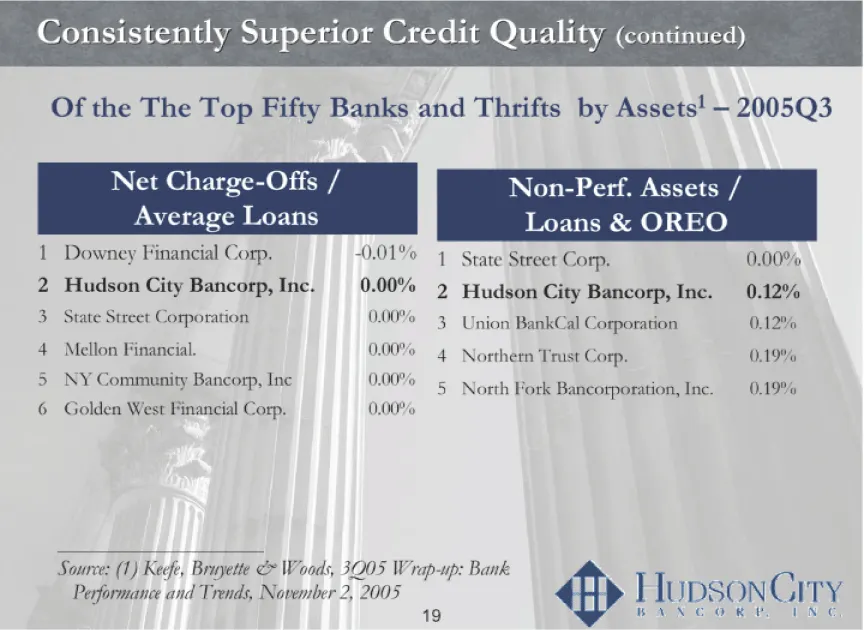
___________________________ Source: (1) Keefe, Bruyette & Woods, 3Q05 Wrap- up: Bank Performance and Trends, November 2, 2005 Of the The Top Fifty Banks and Thrifts by Assets1 - 2005Q3 Consistently Superior Credit Quality (continued) Net Charge-Offs / Average Loans Net Charge-Offs / Average Loans Ne
Slide 19: Industry-Leading Operational Efficiency
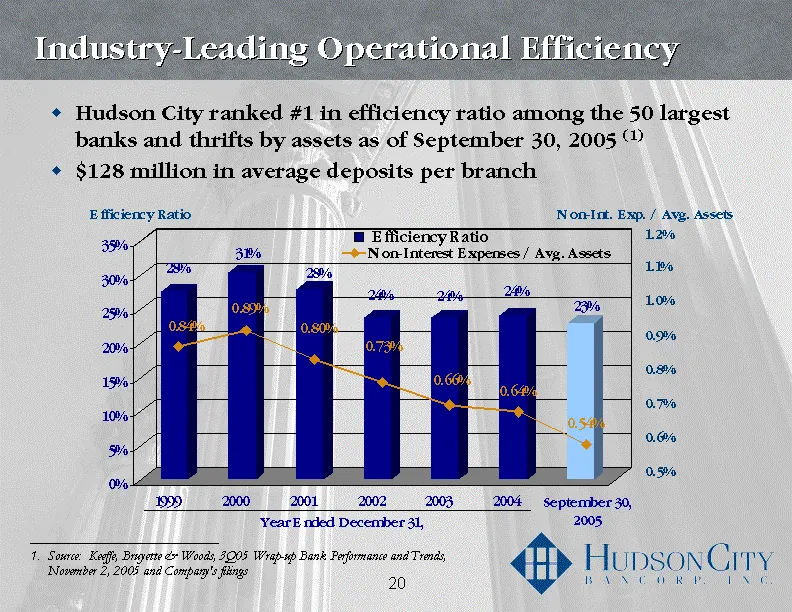
Industry-Leading Operational Efficiency Hudson City ranked #1 in efficiency ratio among the 50 largest banks and thrifts by assets as of September 30, 2005 (1) $128 million in average deposits per branch ___________________________ Source: Keeffe, Bruyette & Woods, 3Q05 Wrap-up Bank Performance and
Slide 20: Winning Formula
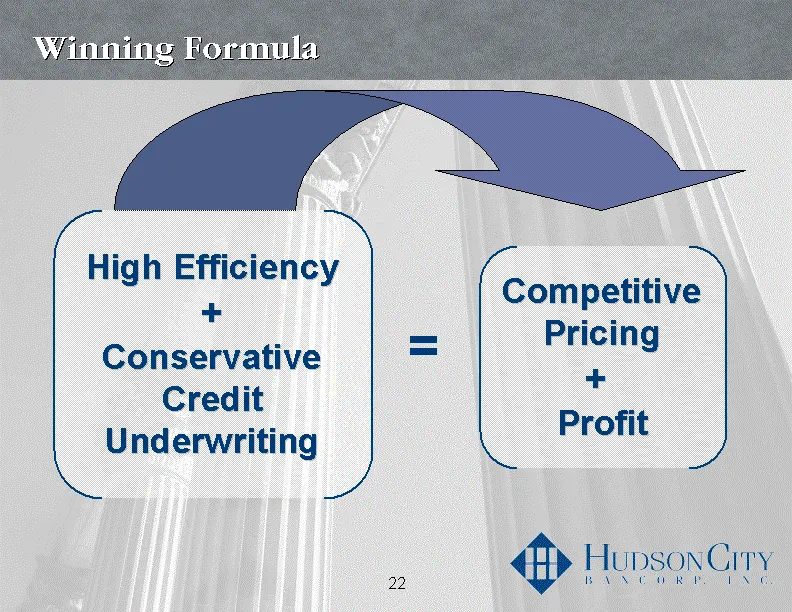
Winning Formula Competitive Pricing + Profit = High Efficiency + Conservative Credit Underwriting
Slide 21: Earnings and Dividend Growth
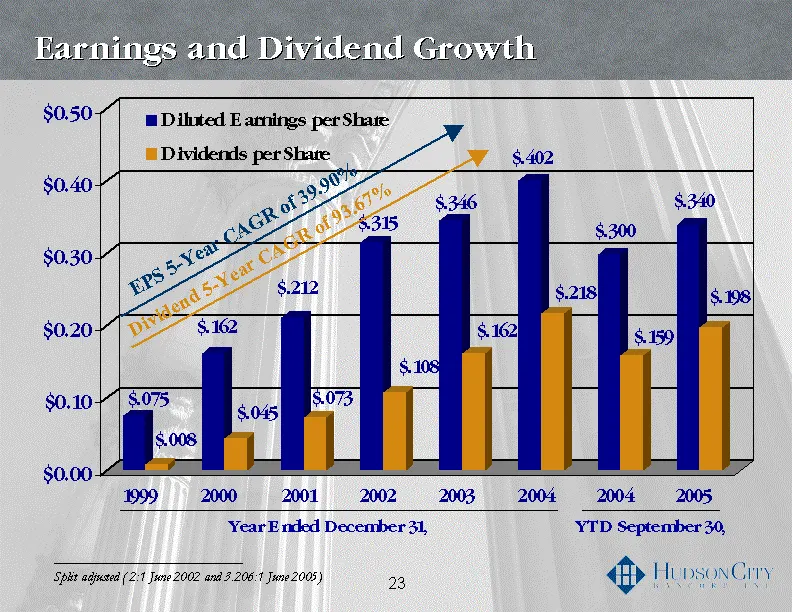
Earnings and Dividend Growth ___________________________ Split adjusted ( 2:1 June 2002 and 3.206:1 June 2005) 45
Slide 22: Consistent Profitability
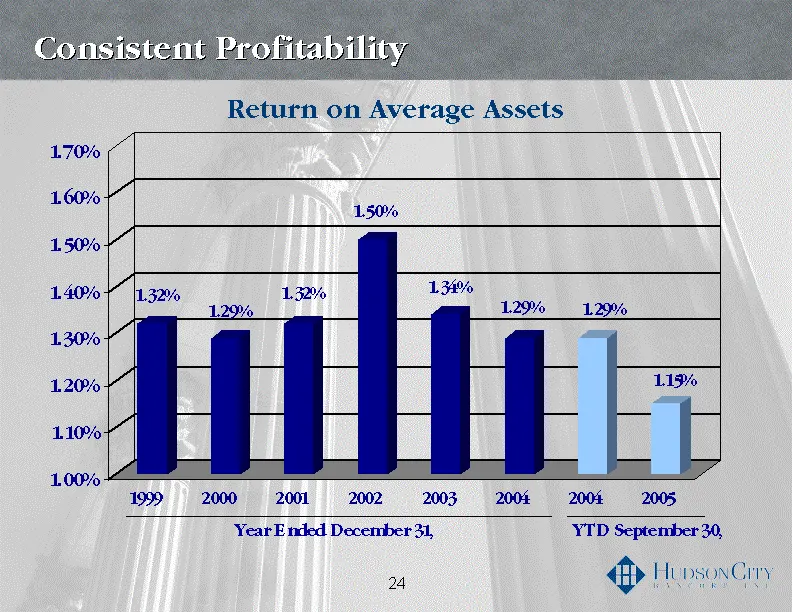
Consistent Profitability Return on Average Assets 47
Slide 23: Superior Stock Price Performance
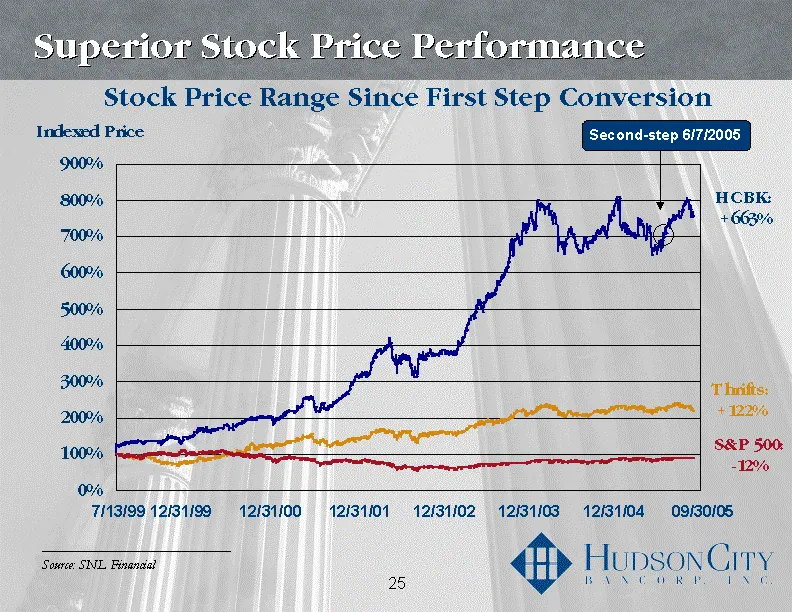
Superior Stock Price Performance ___________________________ Source: SNL Financial Stock Price Range Since First Step Conversion
Slide 24: Highlights
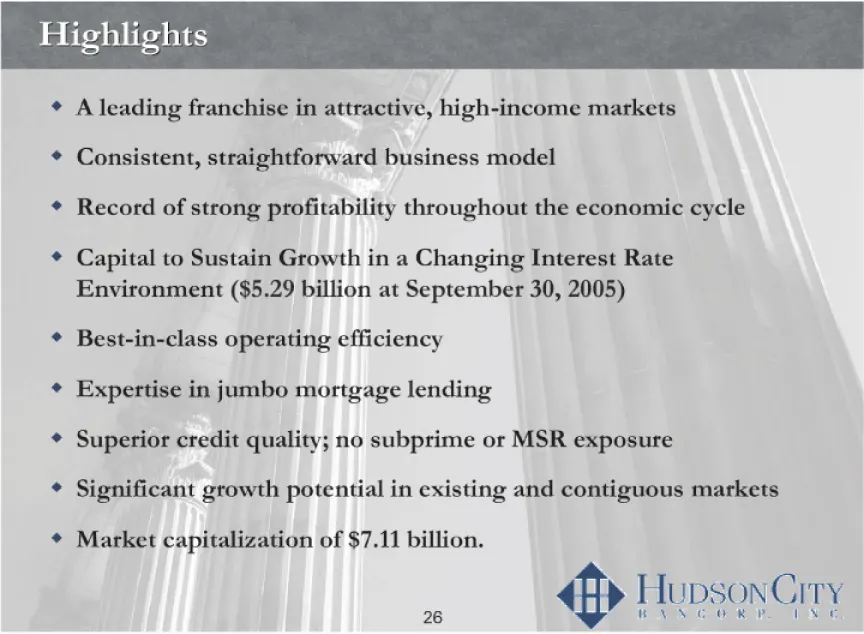
Highlights A leading franchise in attractive, high-income markets Consistent, straightforward business model Record of strong profitability throughout the economic cycle Capital to Sustain Growth in a Changing Interest Rate Environment ($5.29 billion at September 30, 2005) Best-in-class operating ef

Slide 25: oe Se eee
oe Se eee HupsonCiry NC OR FP, Sat oo
Source: SEC EDGAR · 8-K filed Nov 28, 2005
More decks from Hudson City Bancorp Inc
 Citigroup 2013 US Financial Services Conference30 slides · Mar 6, 2013
 BancAnalysts Association of Boston Conference 201229 slides · Nov 2, 2012
 Barclays Global Financial Services Conference 201234 slides · Sep 10, 2012
 Merger or Acquisition (August 2012)32 slides · Aug 27, 2012
 Shareholder Meeting (April 2012)20 slides · Apr 25, 2012
 Shareholder Meeting (April 2011)38 slides · Apr 19, 2011