Seche Environnement SA · EURONEXT:SCHP
Seche Environnement SA — FY2017 Earnings Presentation
38 slides from Seche Environnement SA's earnings presentation, Mar 6, 2018

Slide 1: Séché Environnement 2017 Consolidated results
Séché Environnement 2017 Consolidated results Meeting of March 6, 2018
Slide 2: 2017: Financial returns and strategic achievements
Joël Séché Chairman and CEO 2017: FINANCIAL RETURNS AND STRATEGIC ACHIEVEMENTS Consolidated results 2017 - Meeting of March 6, 2018 2
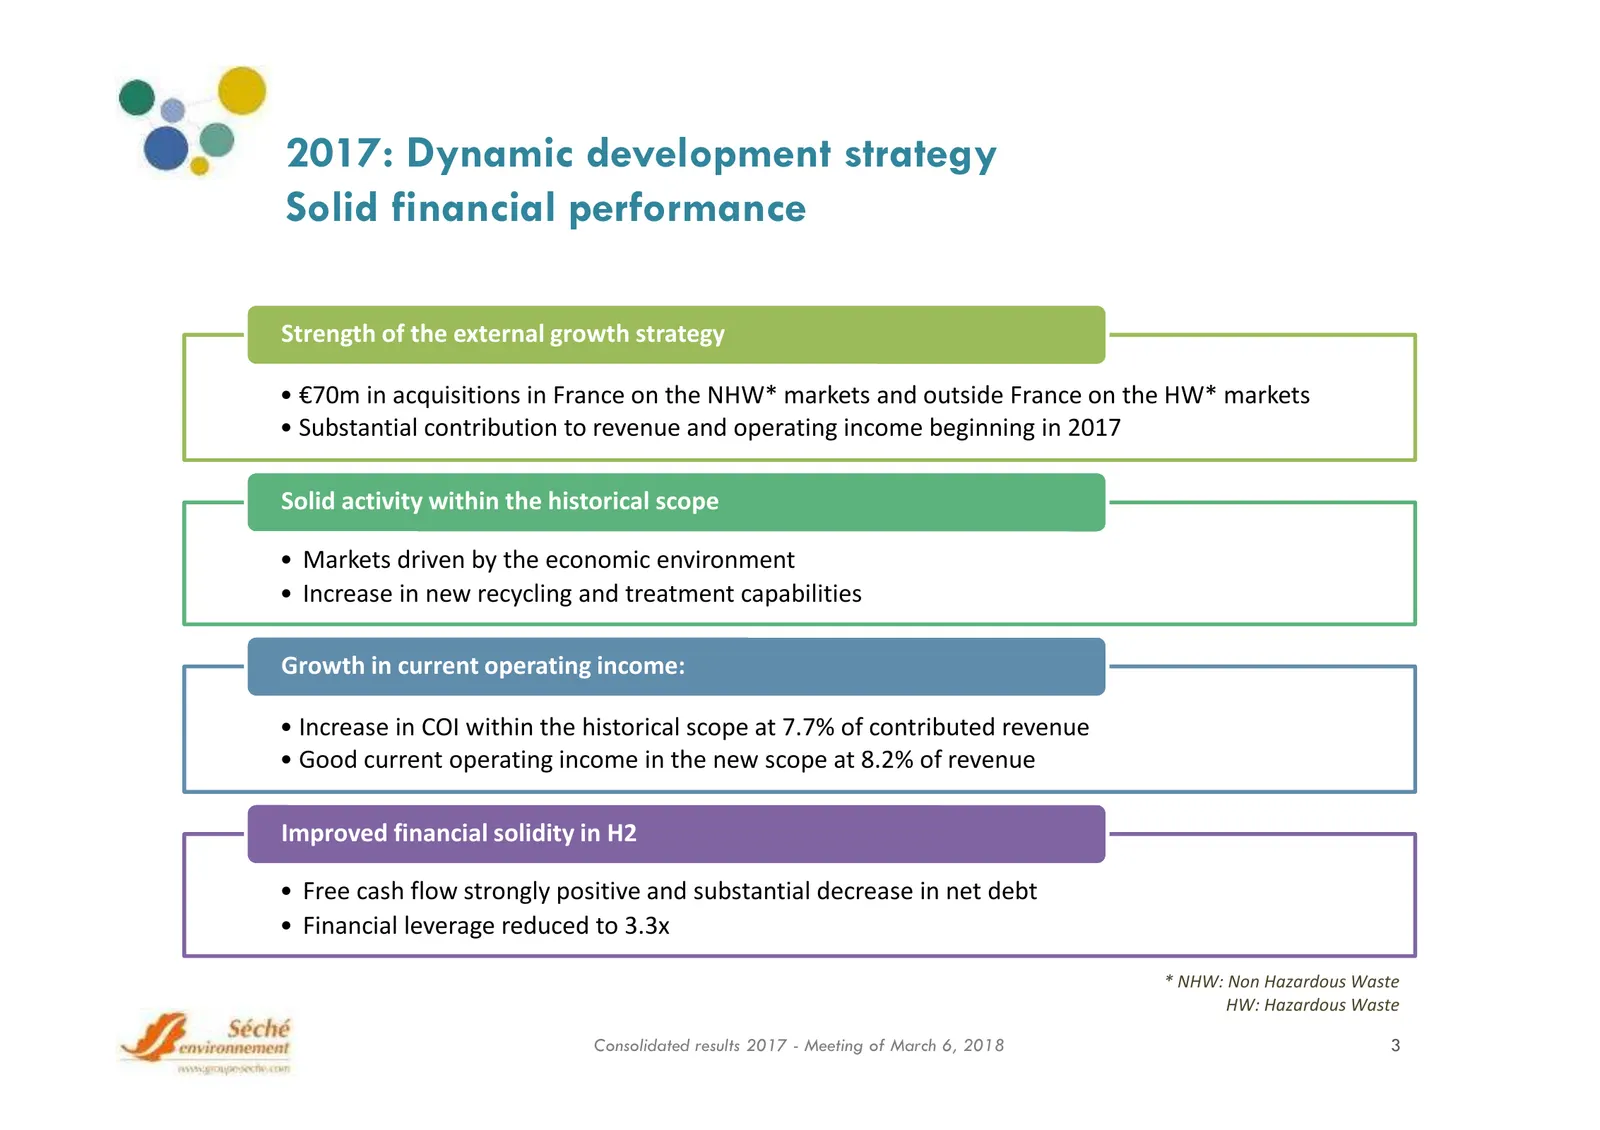
Slide 3: 2017: Dynamic development strategy, solid financial performance
2017: Dynamic development strategy Solid financial performance Strength of the external growth strategy • €70m in acquisitions in France on the NHW* markets and outside France on the HW* markets • Substantial contribution to revenue and operating income beginning in 2017 Solid activity within the hi
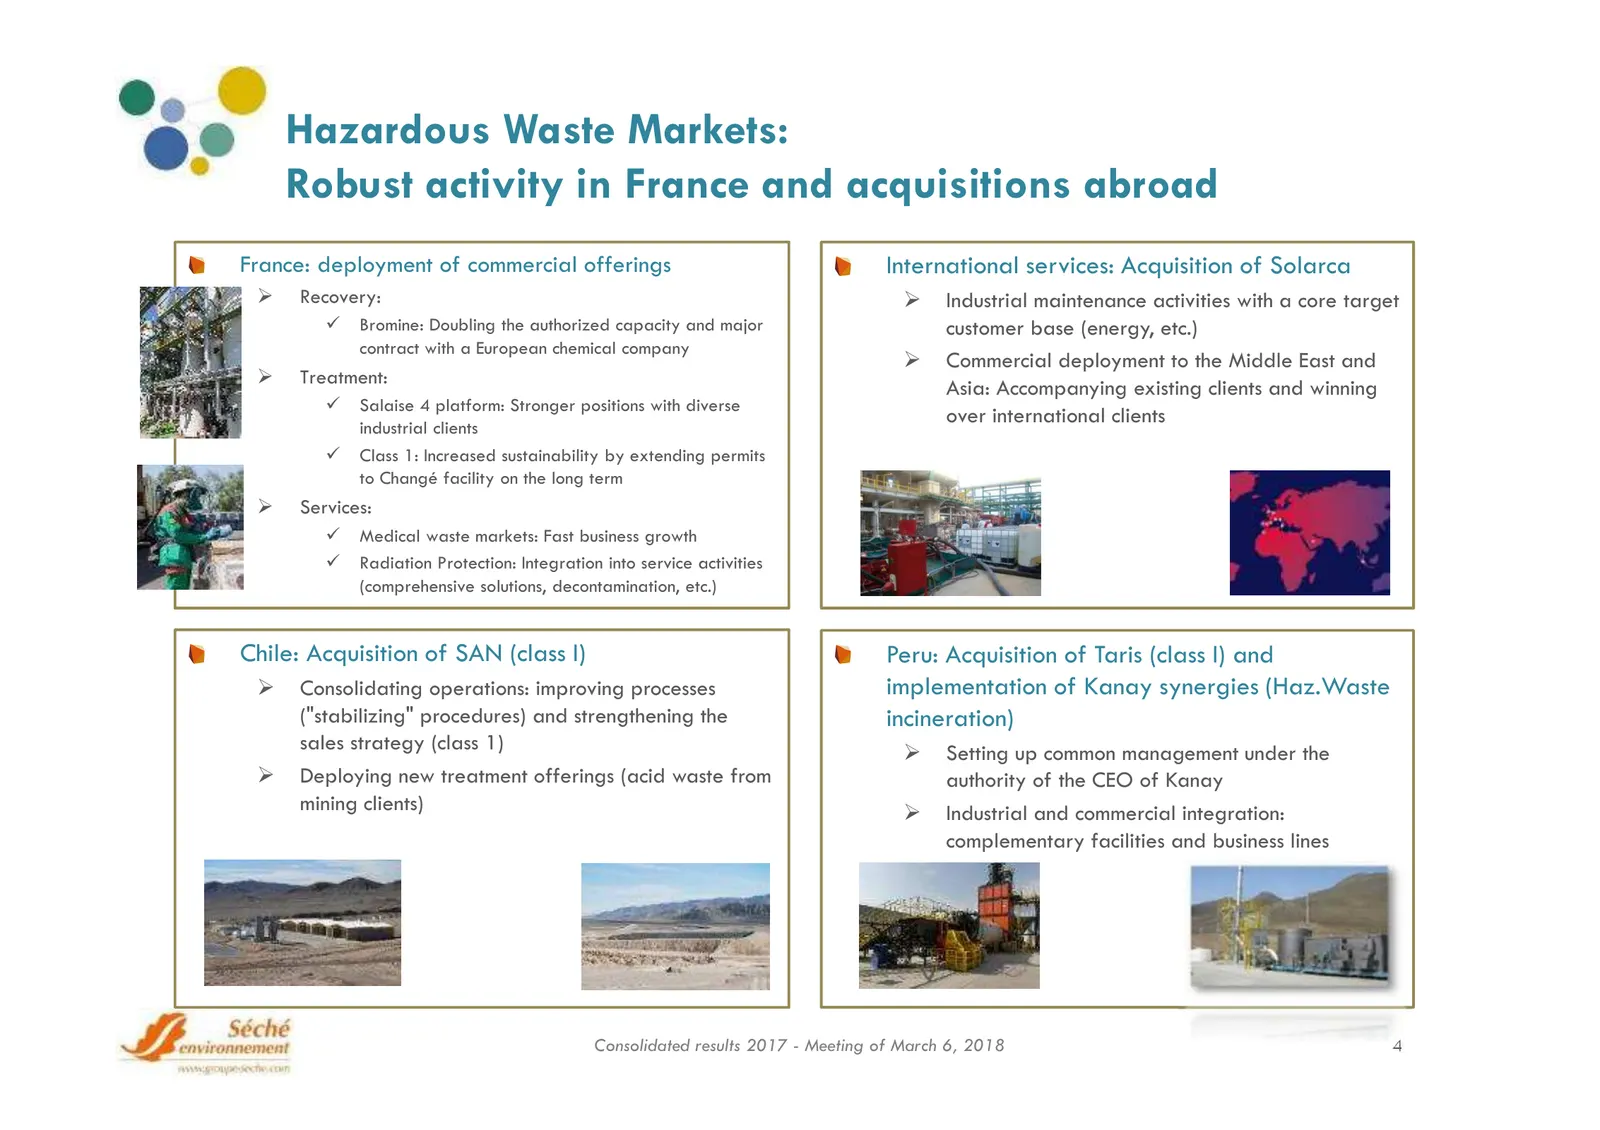
Slide 4: Hazardous Waste Markets: Robust activity in France and acquisitions abroad
Hazardous Waste Markets: Robust activity in France and acquisitions abroad France: deployment of commercial offerings International services: Acquisition of Solarca Recovery: Industrial maintenance activities with a core target Bromine: Doubling the authorized capacity and major customer base (energ
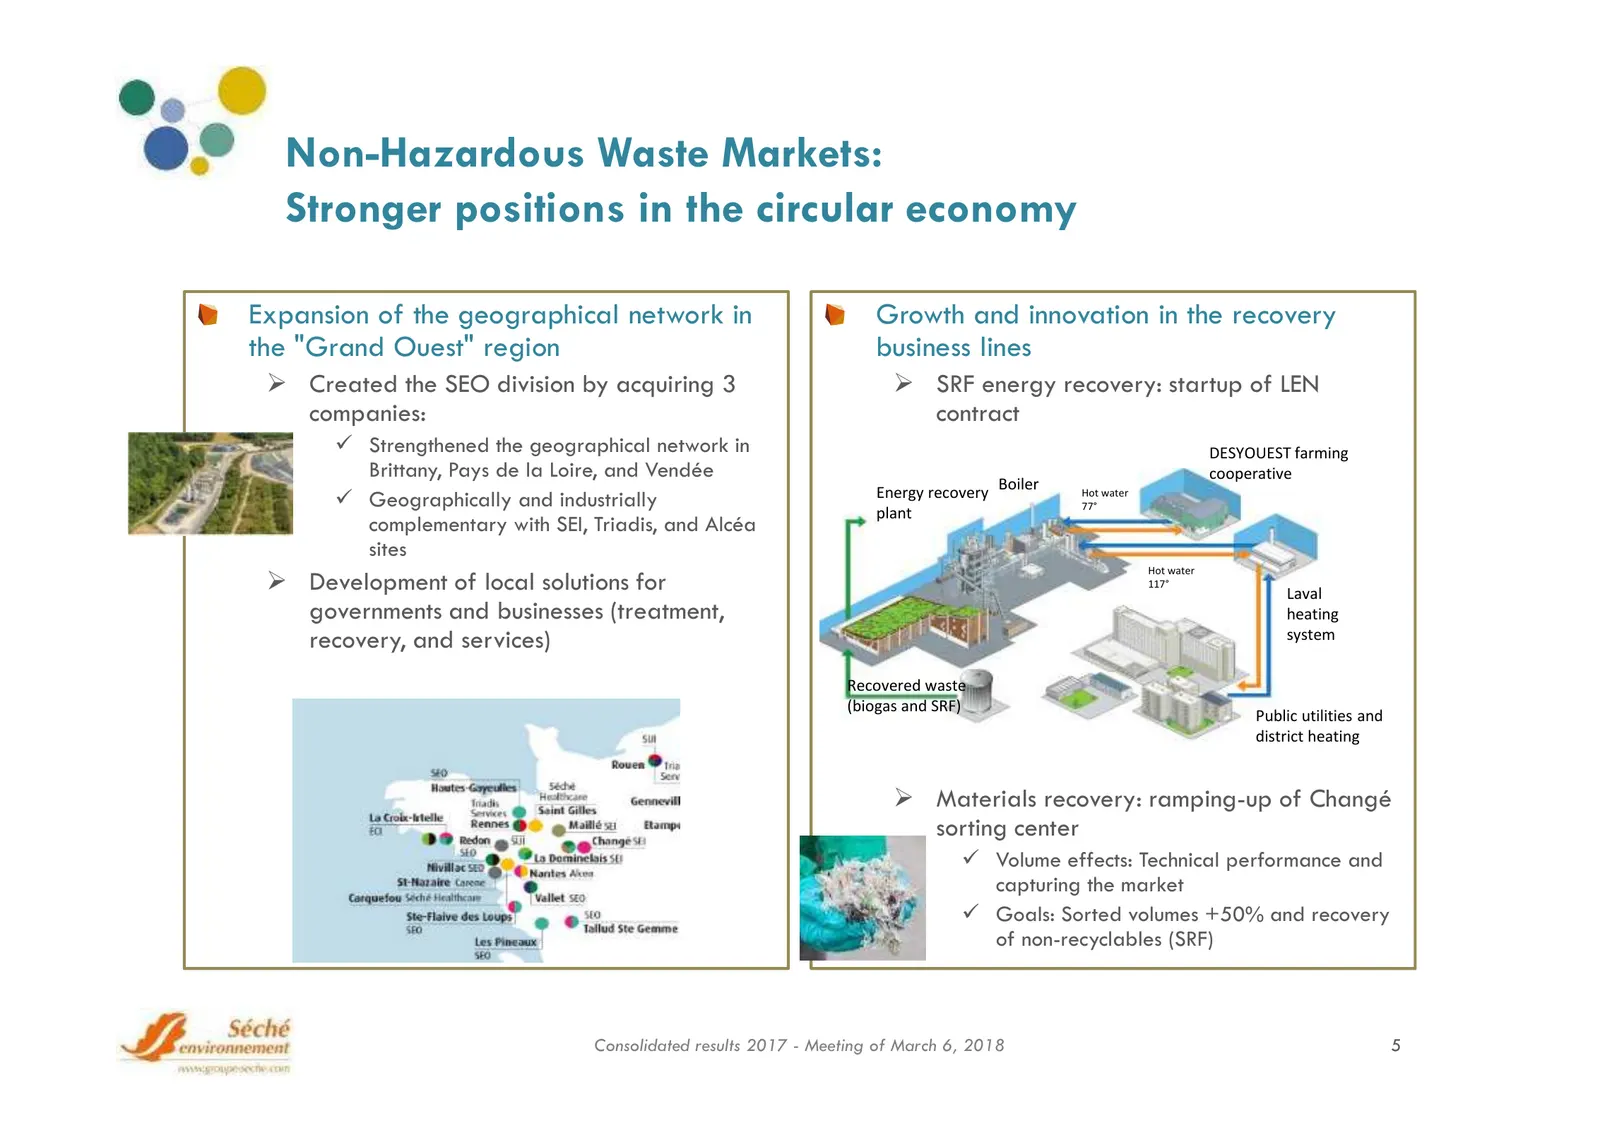
Slide 5: Non-Hazardous Waste Markets: Stronger positions in the circular economy
Non-Hazardous Waste Markets: Stronger positions in the circular economy Expansion of the geographical network in Growth and innovation in the recovery the "Grand Ouest" region business lines Created the SEO division by acquiring 3 SRF energy recovery: startup of LEN companies: contract Strengthened
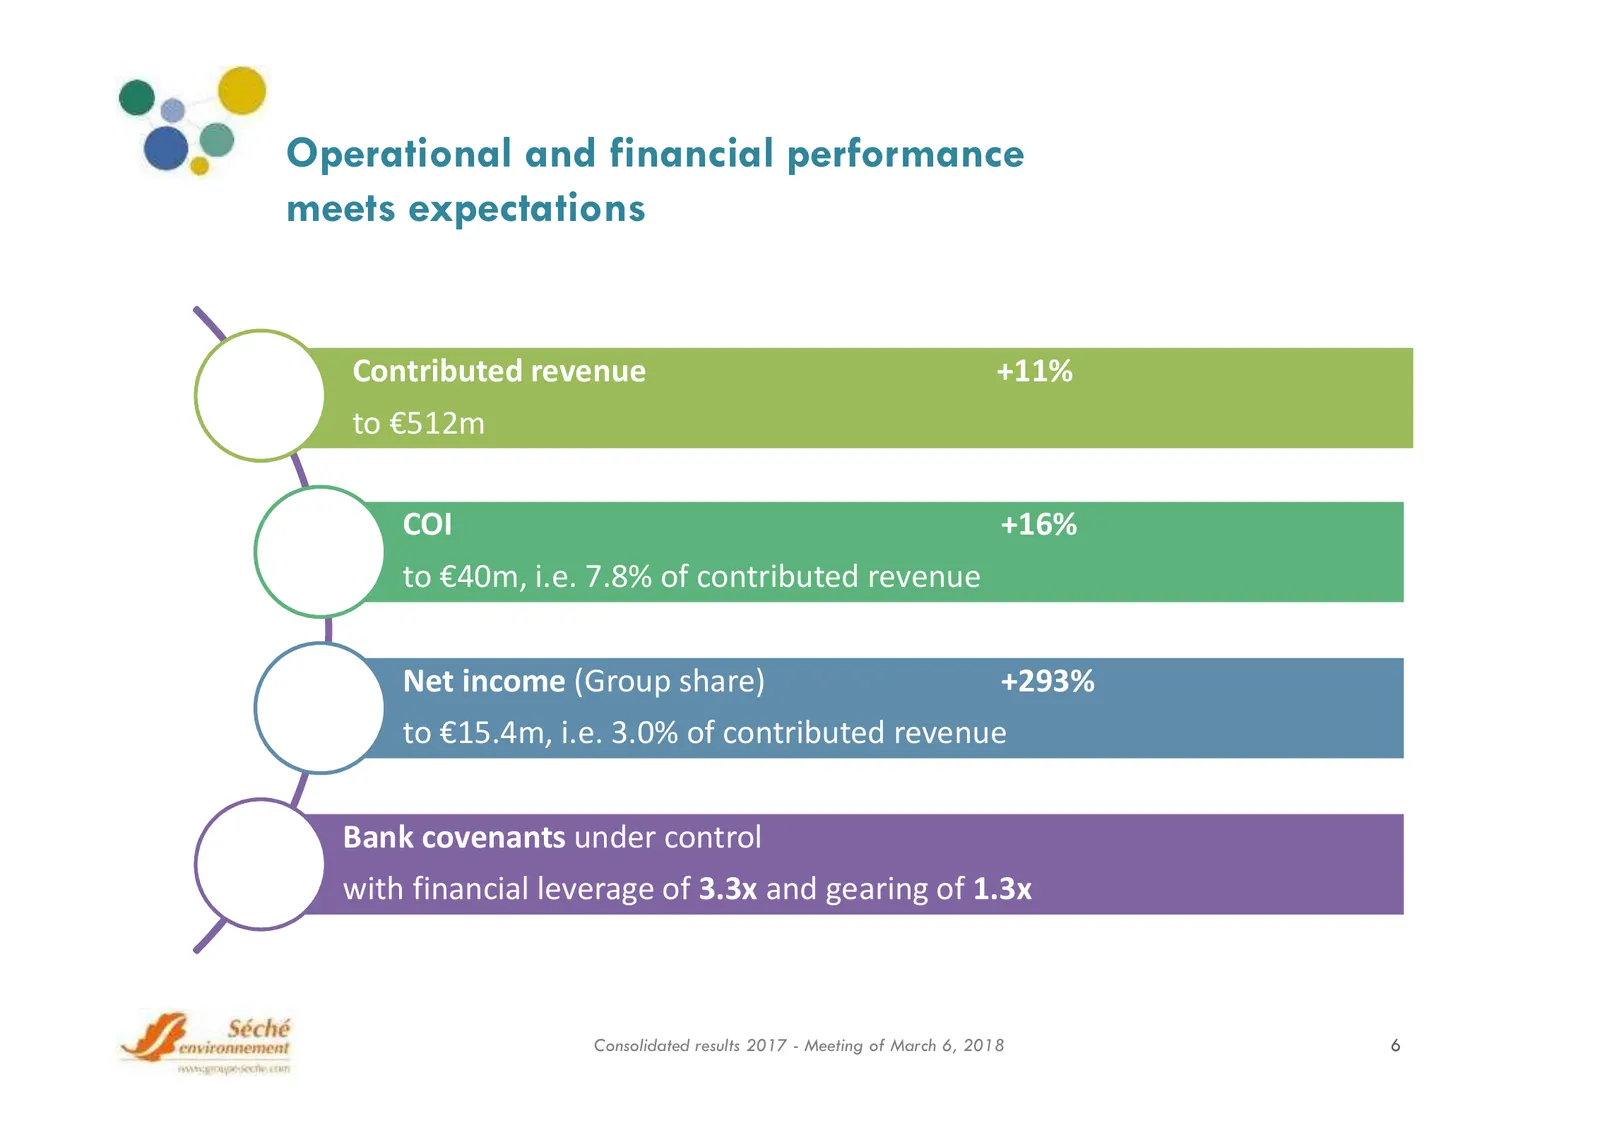
Slide 6: Operational and financial performance meets expectations
Operational and financial performance meets expectations Contributed revenue +11% to €512m COI +16% to €40m, i.e. 7.8% of contributed revenue Net income (Group share) +293% to €15.4m, i.e. 3.0% of contributed revenue Bank covenants under control with financial leverage of 3.3x and gearing of 1.3x Co
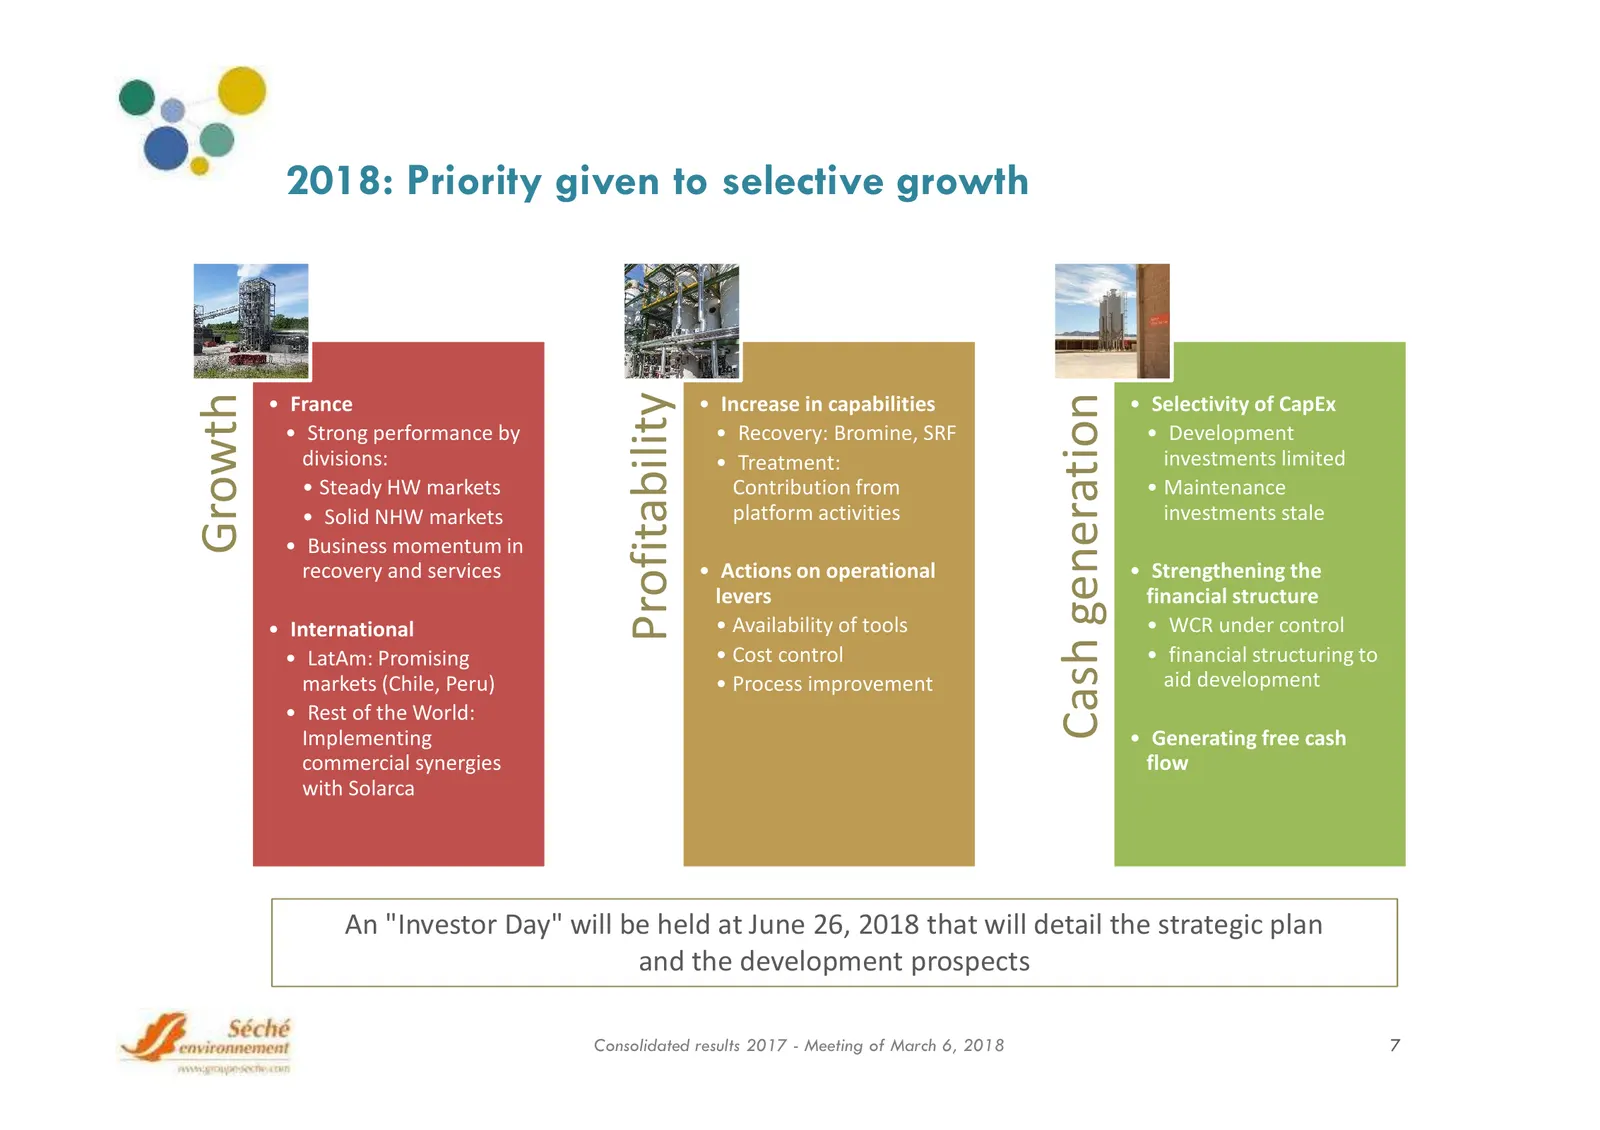
Slide 7: 2018: Priority given to selective growth
2018: Priority given to selective growth Profitability Growth Cash generation • France • Increase in capabilities • Selectivity of CapEx • Strong performance by • Recovery: Bromine, SRF • Development divisions: • Treatment: investments limited • Steady HW markets Contribution from • Maintenance • So
Slide 8: Economic and financial performance in 2017
Baptiste Janiaud Chief Administrative and Financial Officer ECONOMIC AND FINANCIAL PERFORMANCE IN 2017 Consolidated results 2017 - Meeting of March 6, 2018 8
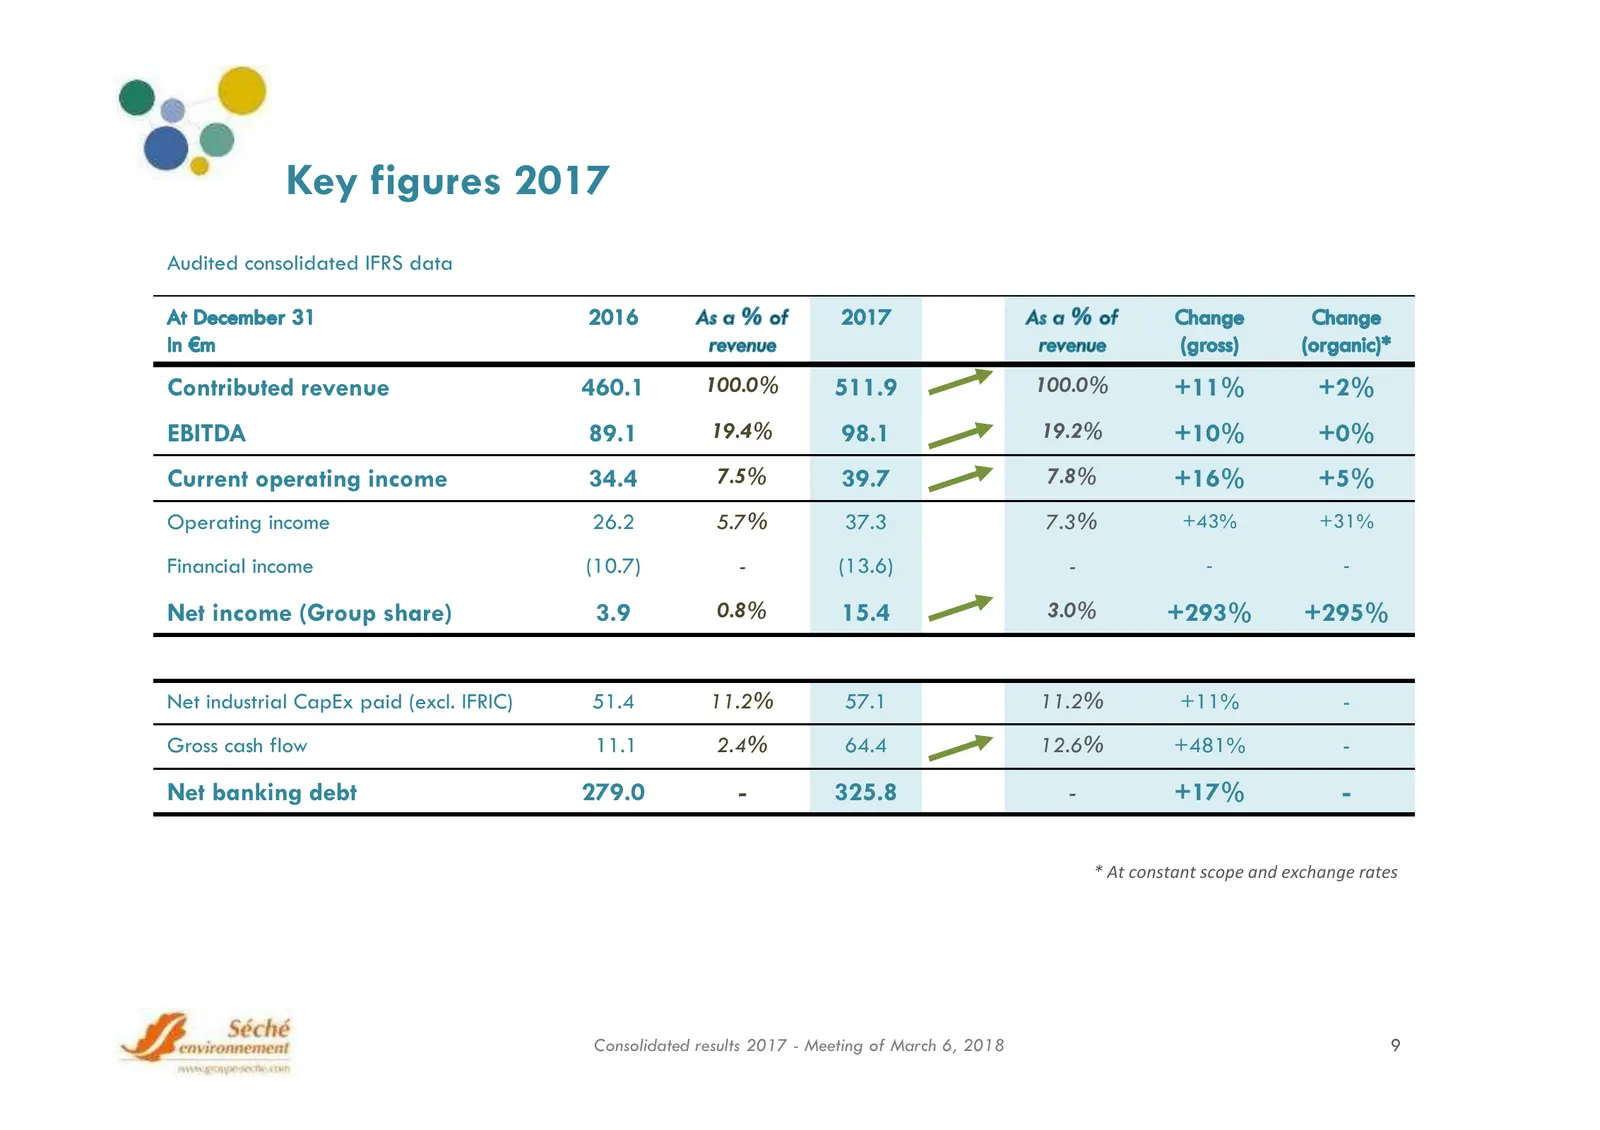
Slide 9: Key figures 2017
Key figures 2017 Audited consolidated IFRS data Contributed revenue 460.1 100.0% 511.9 100.0% +11% +2% EBITDA 89.1 19.4% 98.1 19.2% +10% +0% Current operating income 34.4 7.5% 39.7 7.8% +16% +5% Operating income 26.2 5.7% 37.3 7.3% +43% +31% Financial income (10.7) - (13.6) - - - Net income (Group s
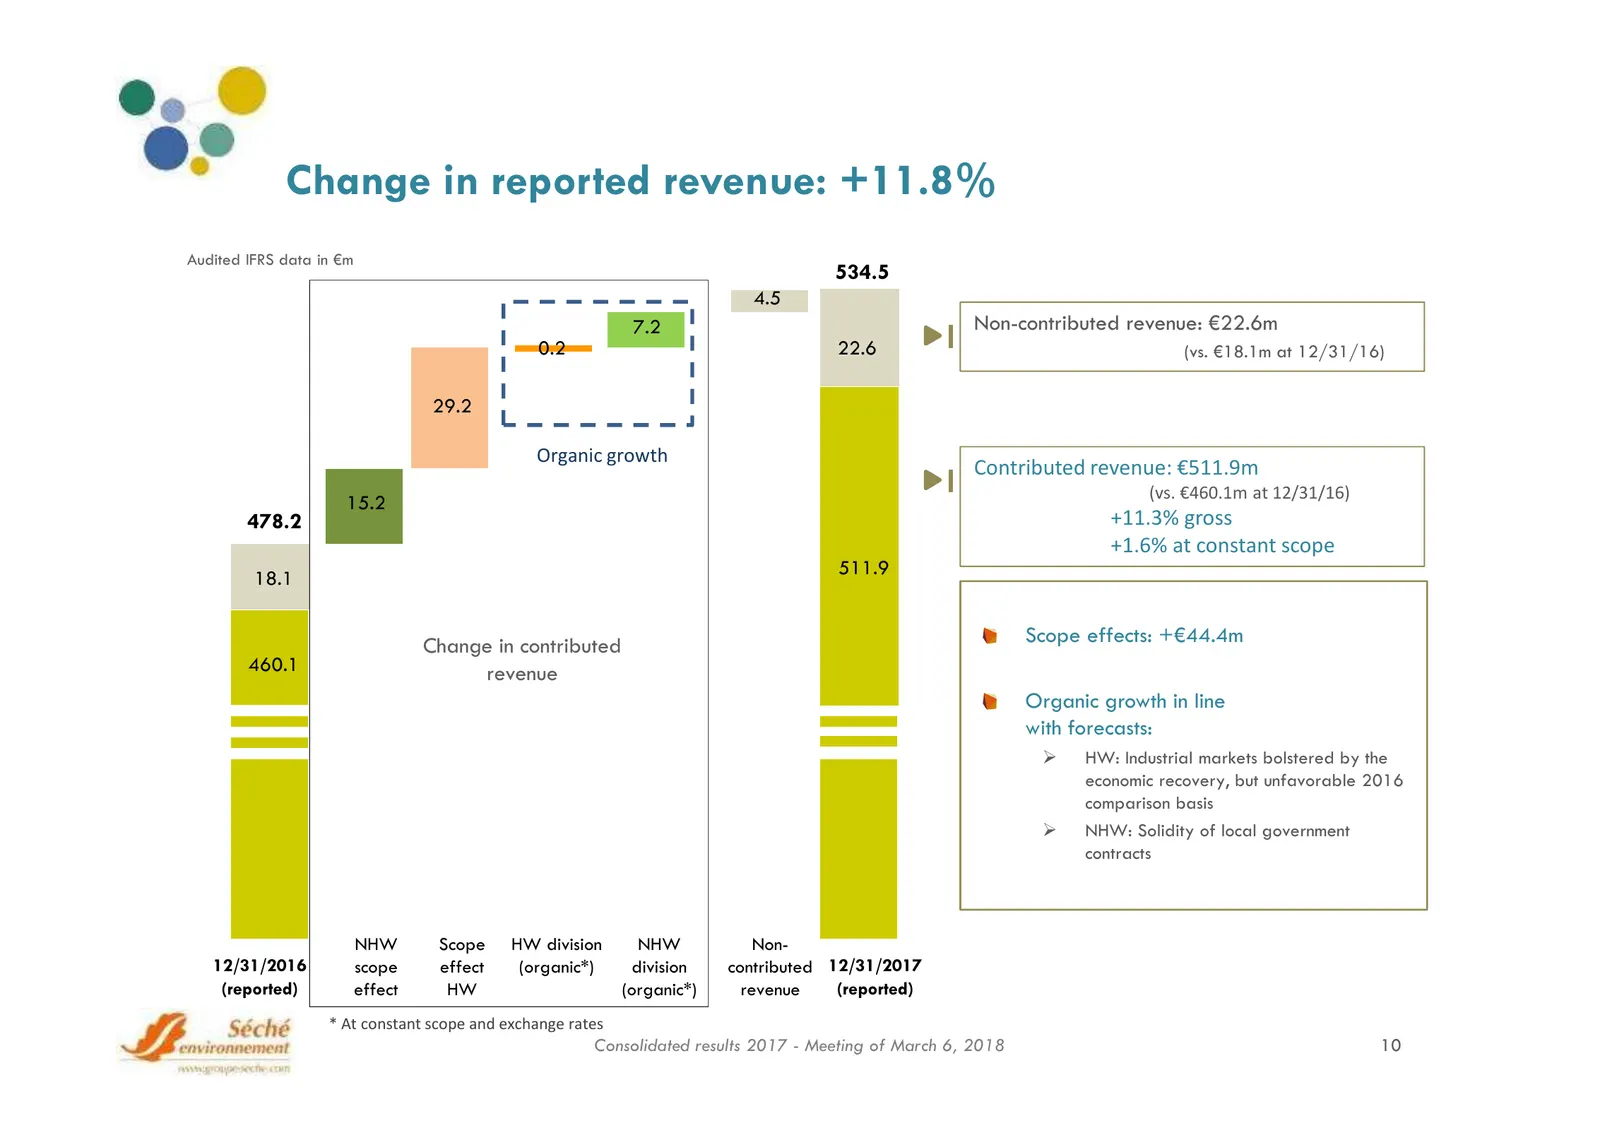
Slide 10: Change in reported revenue: +11.8%
Change in reported revenue: +11.8% Audited IFRS data in €m 534.5 4.5 7.2 Non-contributed revenue: €22.6m 0.2 22.6 (vs. €18.1m at 12/31/16) 29.2 Organic growth Contributed revenue: €511.9m (vs. €460.1m at 12/31/16) 15.2 478.2 +11.3% gross +1.6% at constant scope 511.9 18.1 Change in contributed Scope
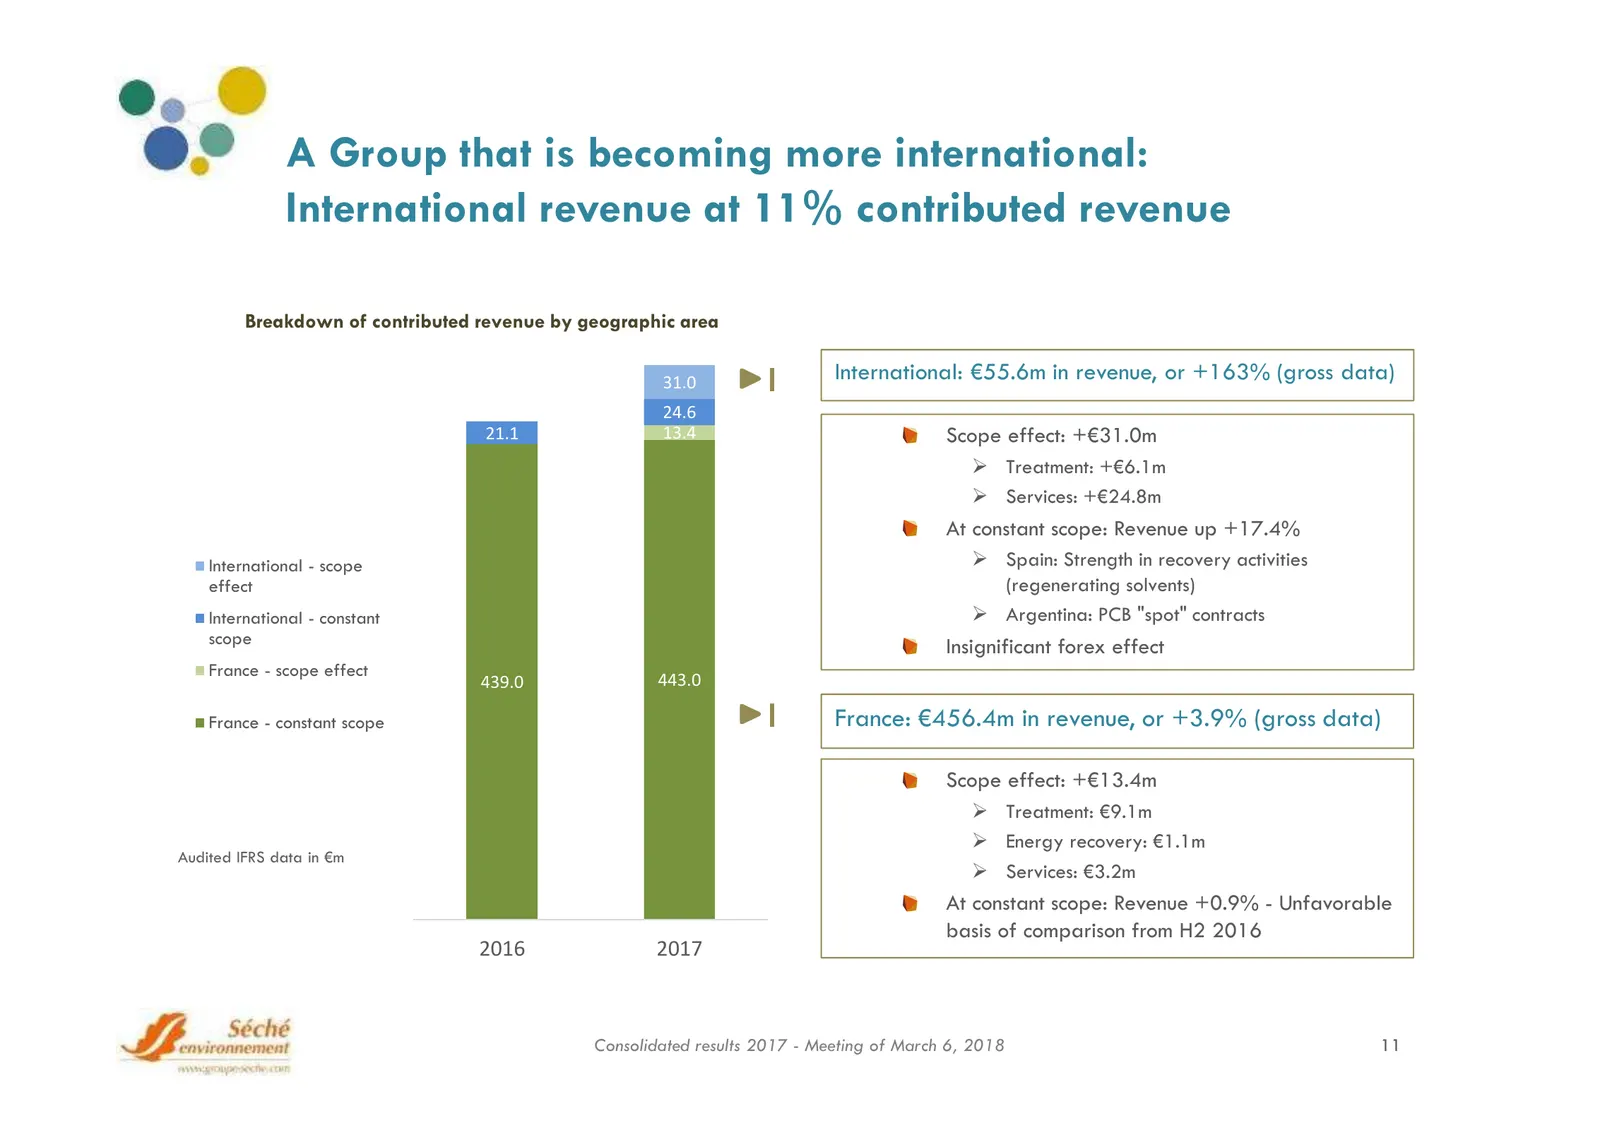
Slide 11: A Group that is becoming more international
A Group that is becoming more international: International revenue at 11% contributed revenue Breakdown of contributed revenue by geographic area 31.0 International: €55.6m in revenue, or +163% (gross data) 24.6 21.1 13.4 Scope effect: +€31.0m Treatment: +€6.1m Services: +€24.8m At constant scope: R
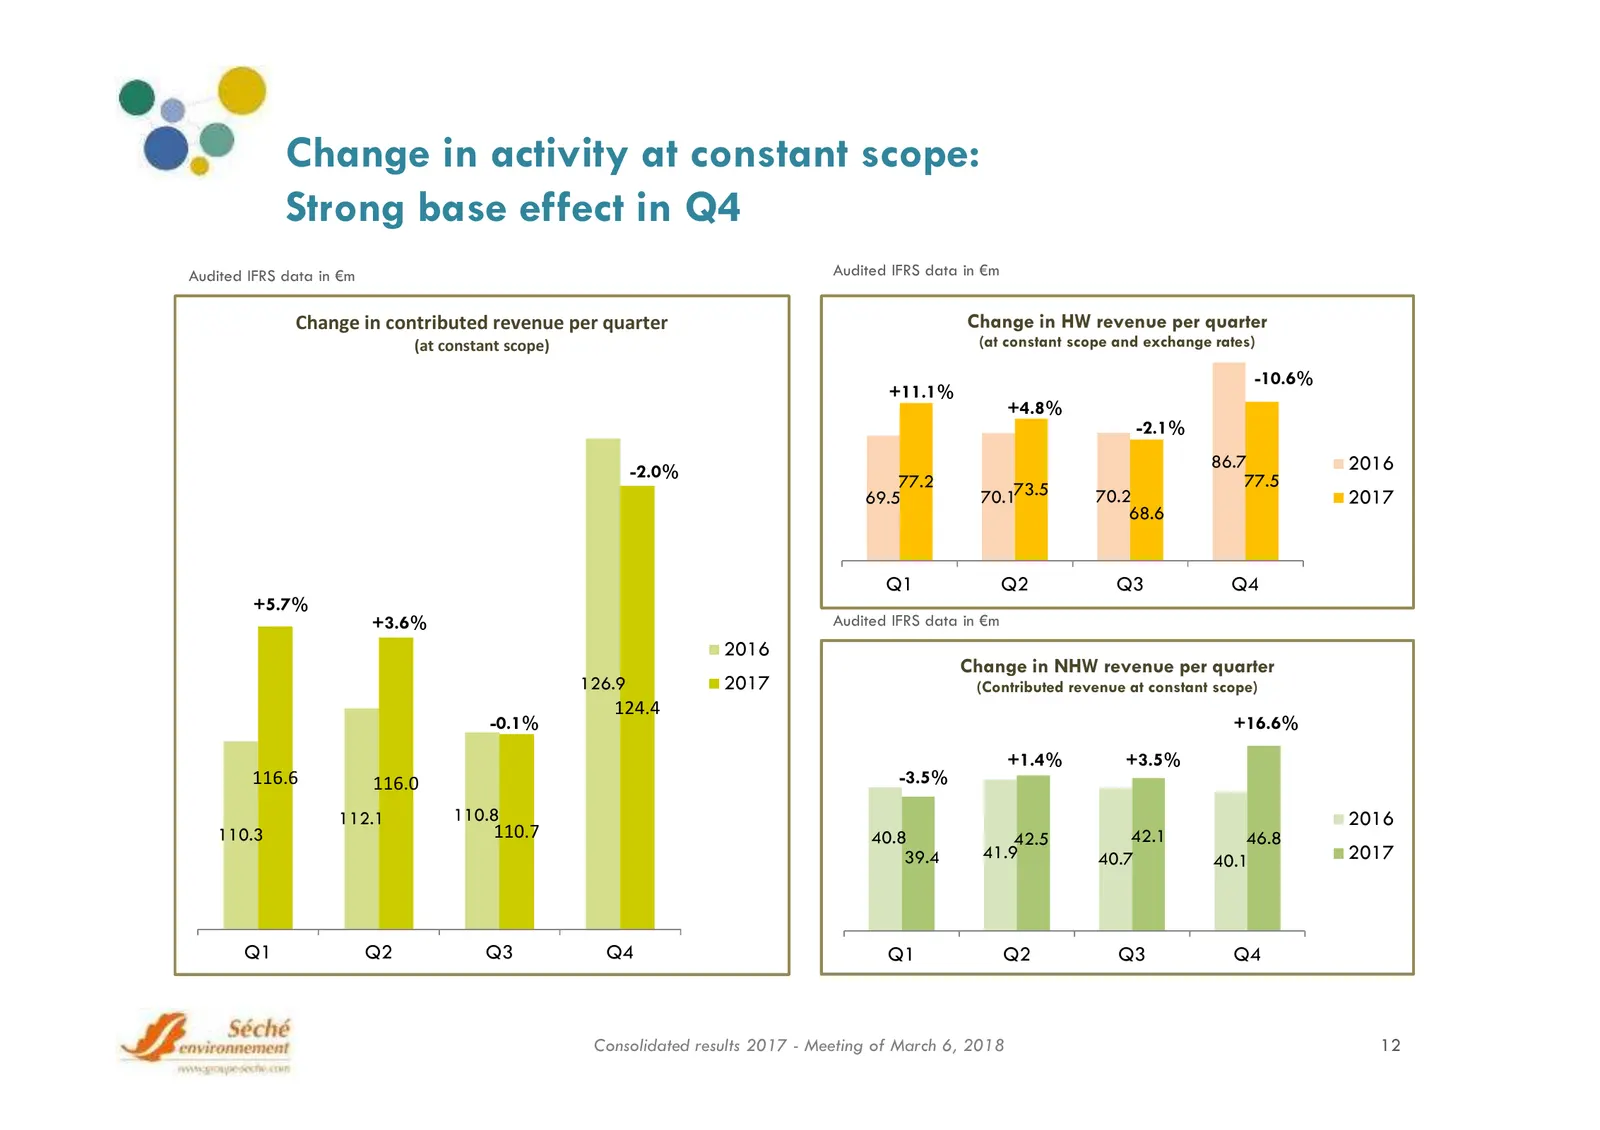
Slide 12: Change in activity at constant scope: Strong base effect in Q4
Change in activity at constant scope: Strong base effect in Q4 Audited IFRS data in €m Audited IFRS data in €m Change in contributed revenue per quarter Change in HW revenue per quarter (at constant scope) (at constant scope and exchange rates) -10.6% +11.1% +4.8% -2.1% 86.7 2016 -2.0% 77.2 77.5 69.
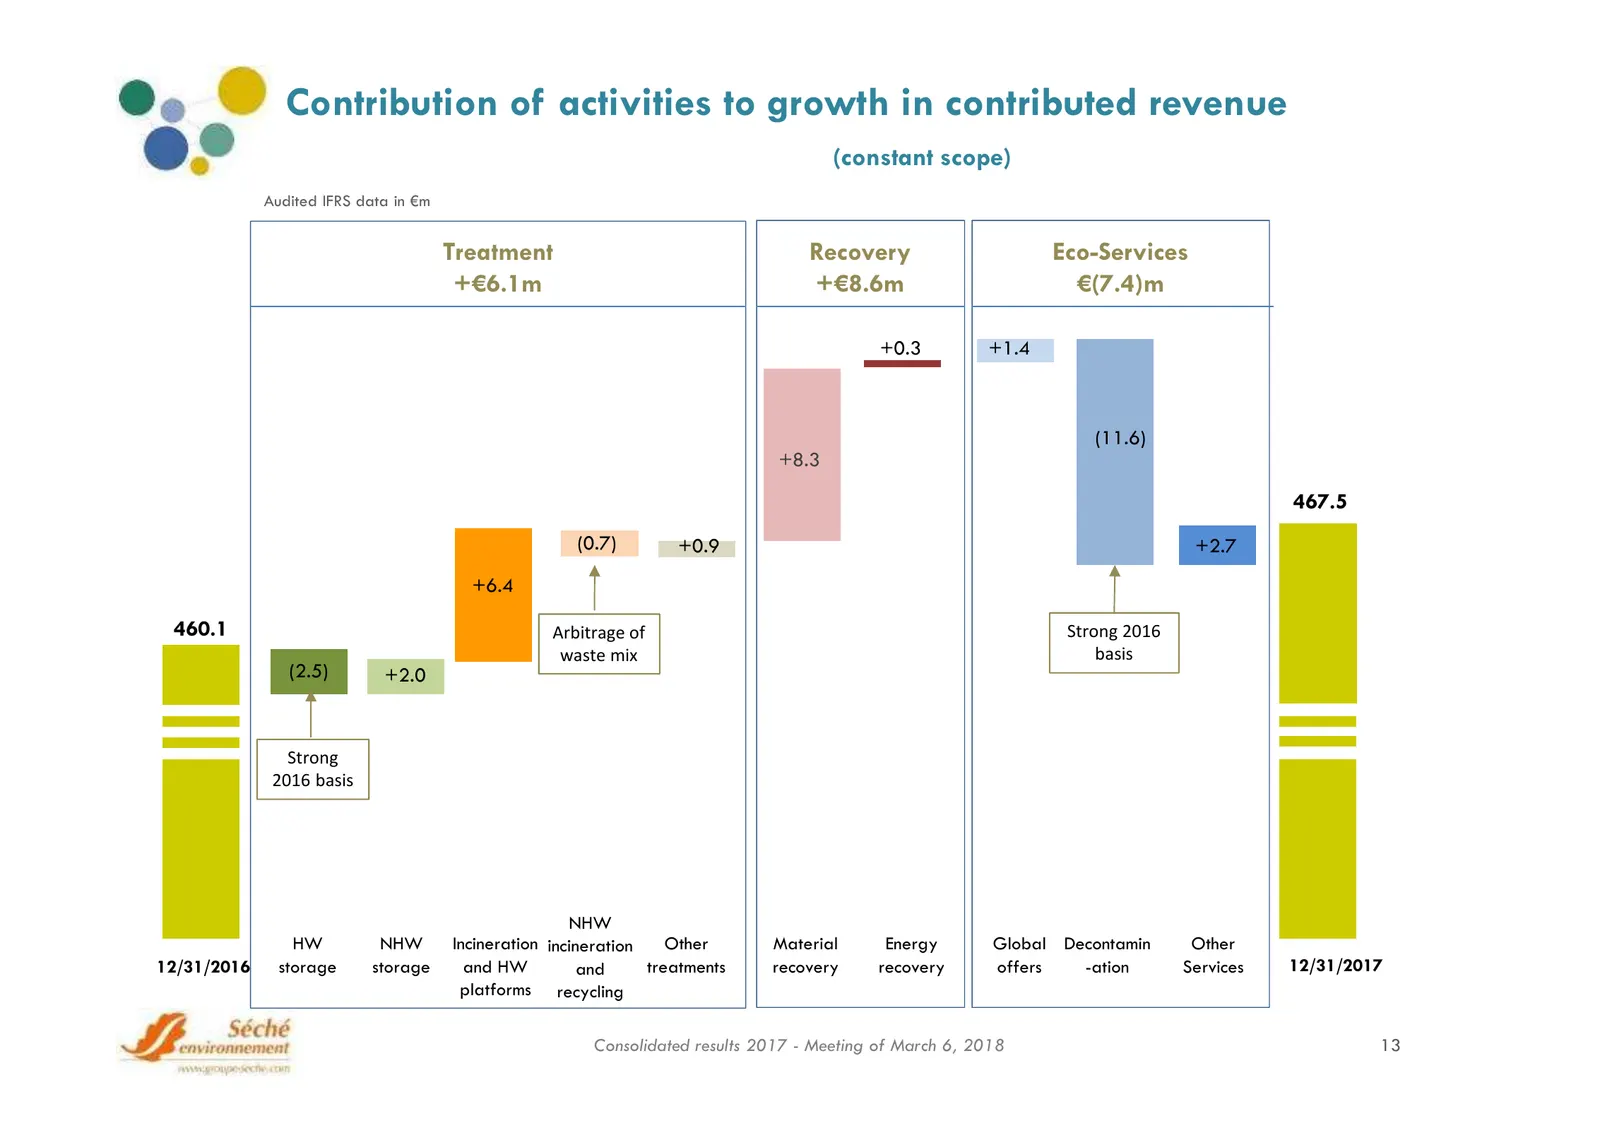
Slide 13: Contribution of activities to growth in contributed revenue
Contribution of activities to growth in contributed revenue (constant scope) Audited IFRS data in €m Treatment Recovery Eco-Services +€6.1m +€8.6m €(7.4)m +0.3 +1.4 (11.6) +8.3 467.5 (0.7) +0.9 +2.7 +6.4 460.1 Arbitrage of Strong 2016 waste mix basis (2.5) +2.0 Strong 2016 basis NHW HW NHW Incinerat
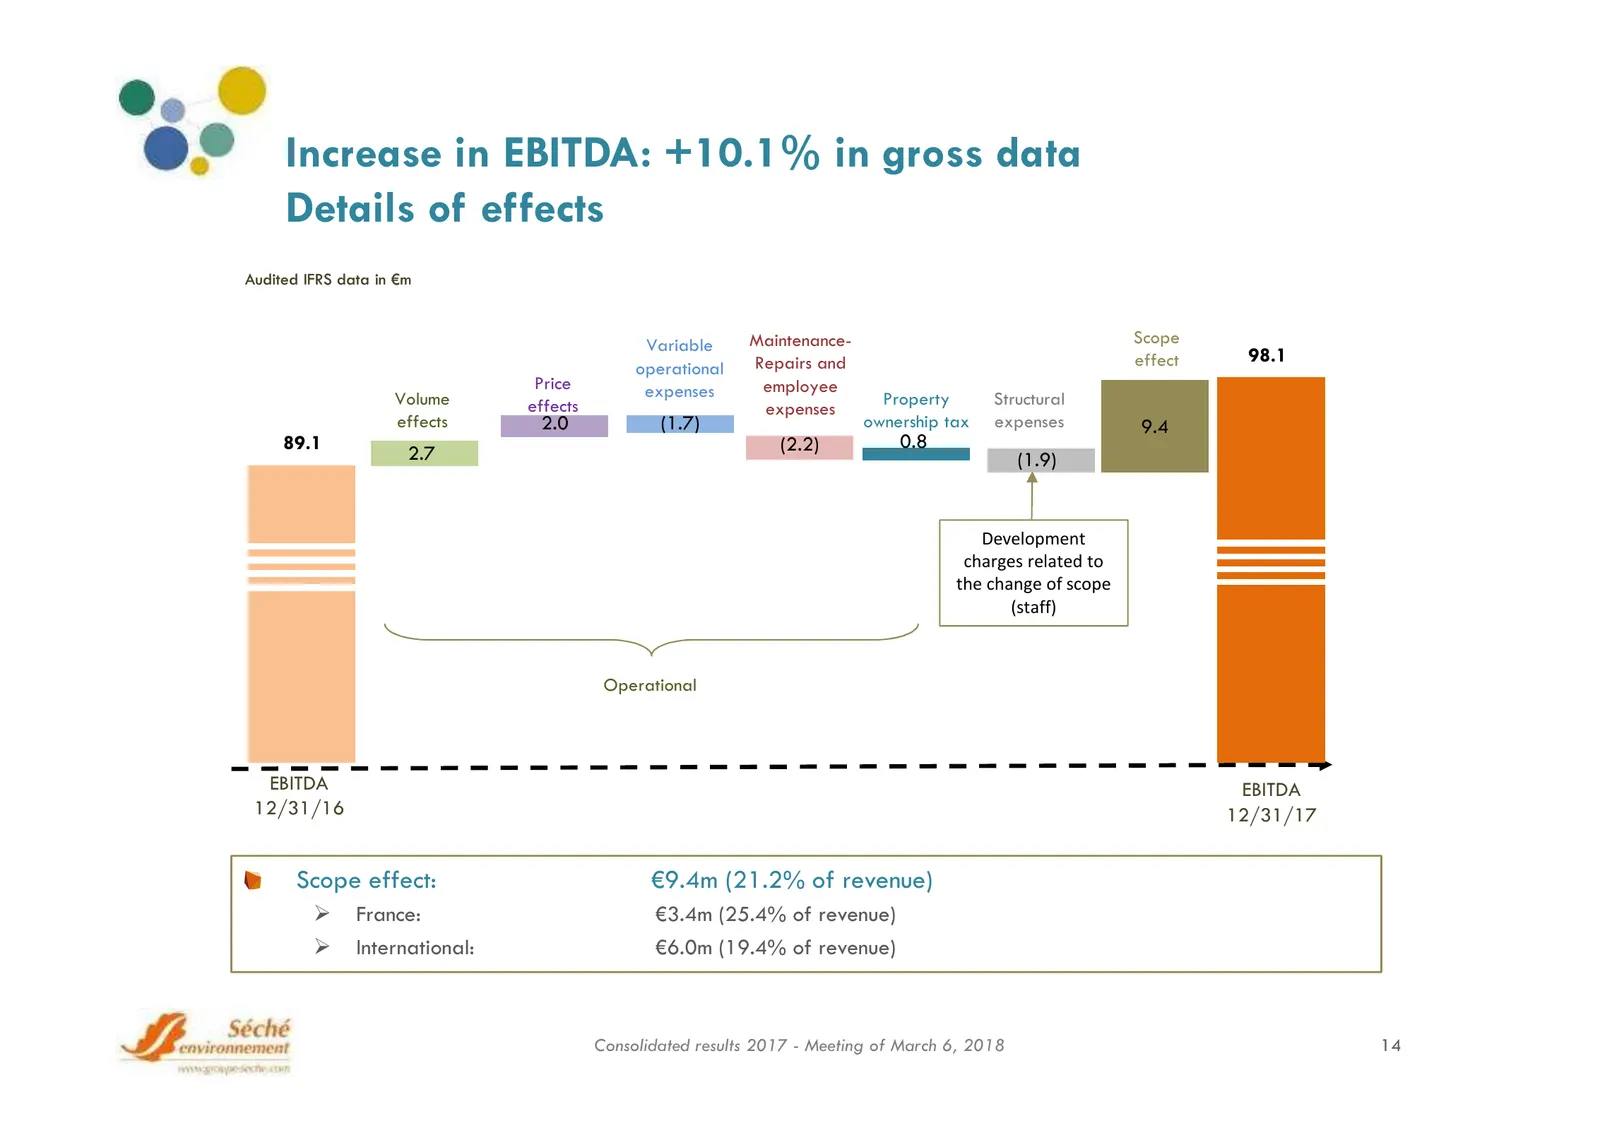
Slide 14: Increase in EBITDA: +10.1% in gross data
Increase in EBITDA: +10.1% in gross data Details of effects Audited IFRS data in €m Variable Maintenance- Scope Repairs and effect 98.1 operational Price expenses employee Volume effects Property Structural expenses effects 2.0 (1.7) ownership tax expenses 9.4 89.1 (2.2) 0.8 2.7 (1.9) Development ch
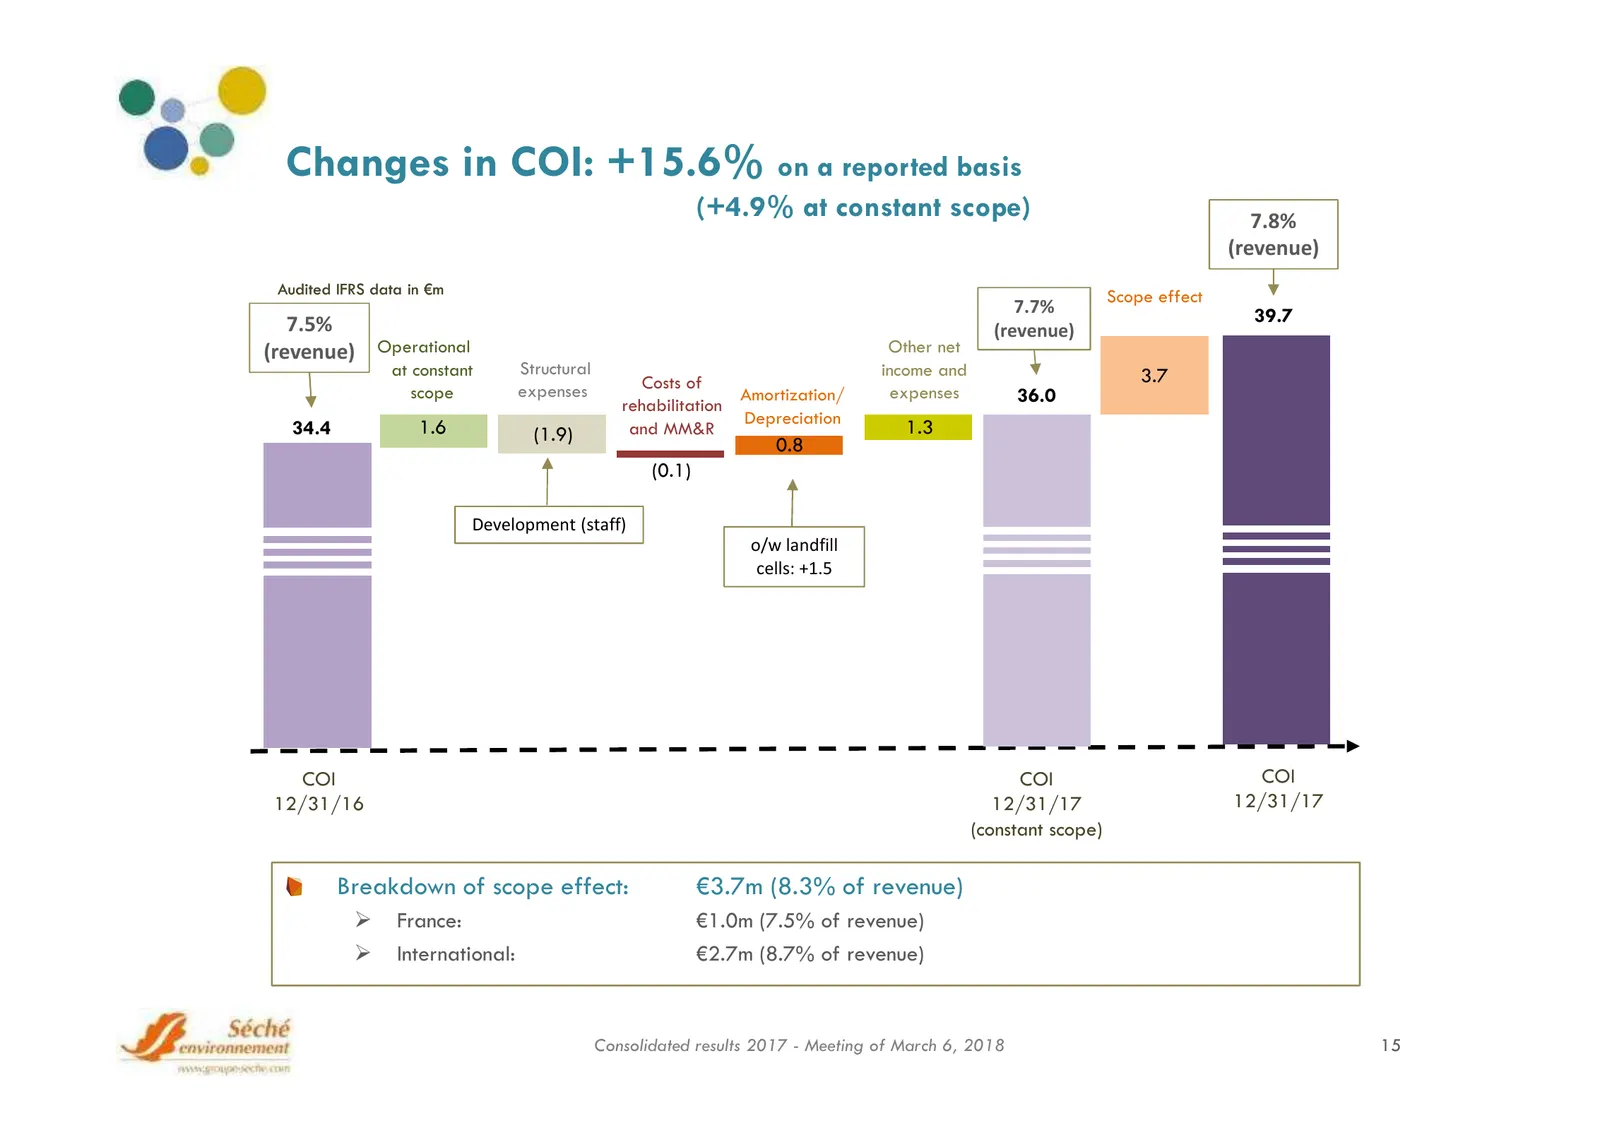
Slide 15: Changes in COI: +15.6% on a reported basis
Changes in COI: +15.6% on a reported basis (+4.9% at constant scope) 7.8% (revenue) Audited IFRS data in €m Scope effect 7.7% 39.7 7.5% (revenue) (revenue) Operational ∆ Other net at constant Structural income and 3.7 expenses Costs of scope Amortization/ expenses 36.0 rehabilitation Depreciation 34
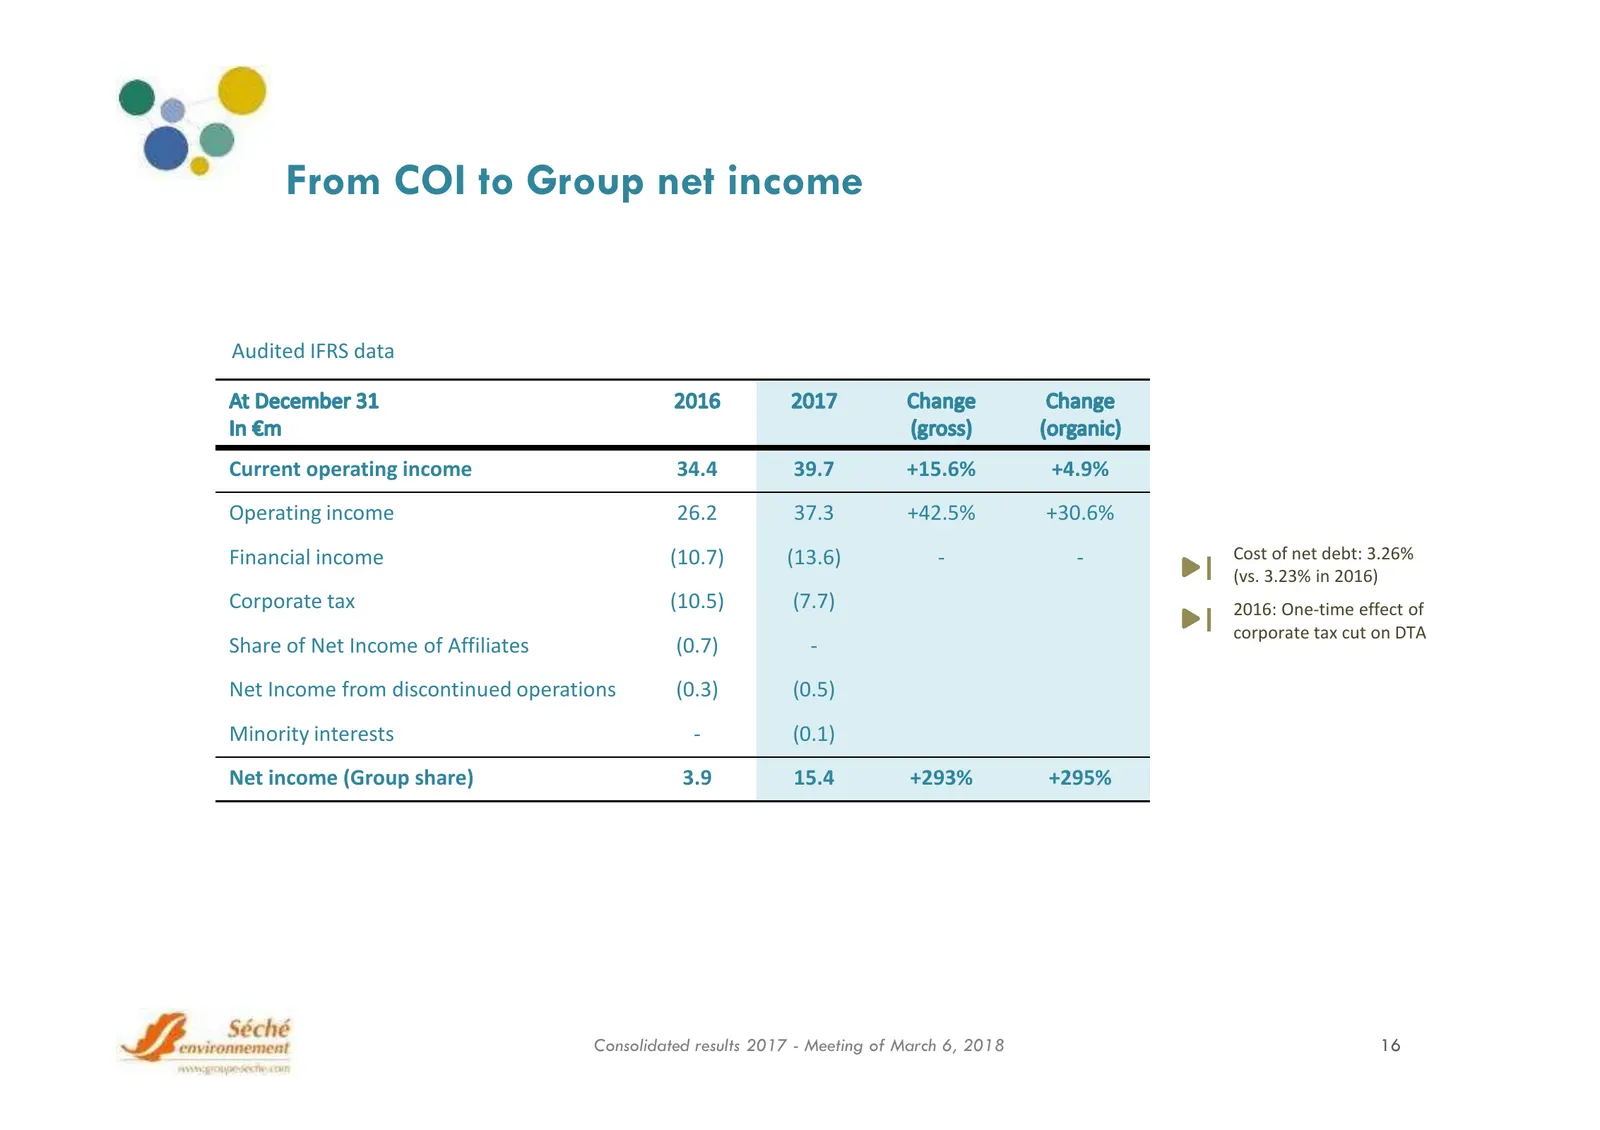
Slide 16: From COI to Group net income
From COI to Group net income Audited IFRS data Current operating income 34.4 39.7 +15.6% +4.9% Operating income 26.2 37.3 +42.5% +30.6% Financial income (10.7) (13.6) - - Cost of net debt: 3.26% (vs. 3.23% in 2016) Corporate tax (10.5) (7.7) 2016: One-time effect of corporate tax cut on DTA Share of
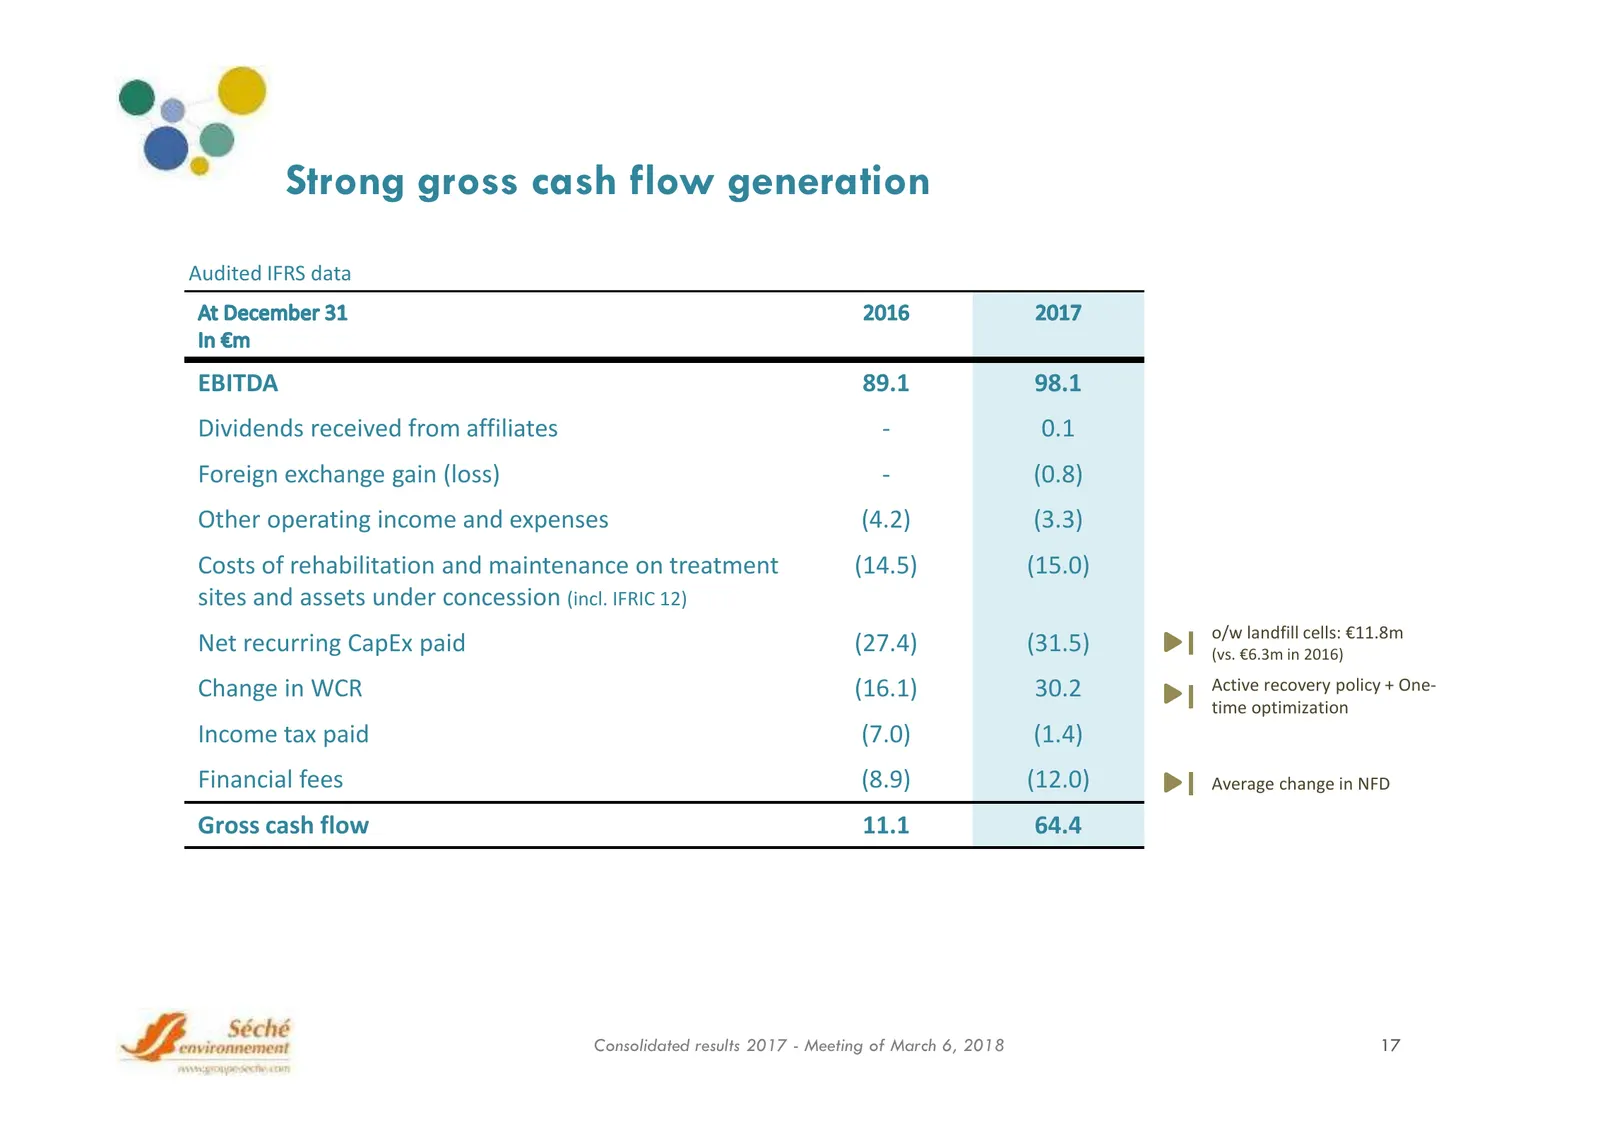
Slide 17: Strong gross cash flow generation
Strong gross cash flow generation Audited IFRS data EBITDA 89.1 98.1 Dividends received from affiliates - 0.1 Foreign exchange gain (loss) - (0.8) Other operating income and expenses (4.2) (3.3) Costs of rehabilitation and maintenance on treatment (14.5) (15.0) sites and assets under concession (inc
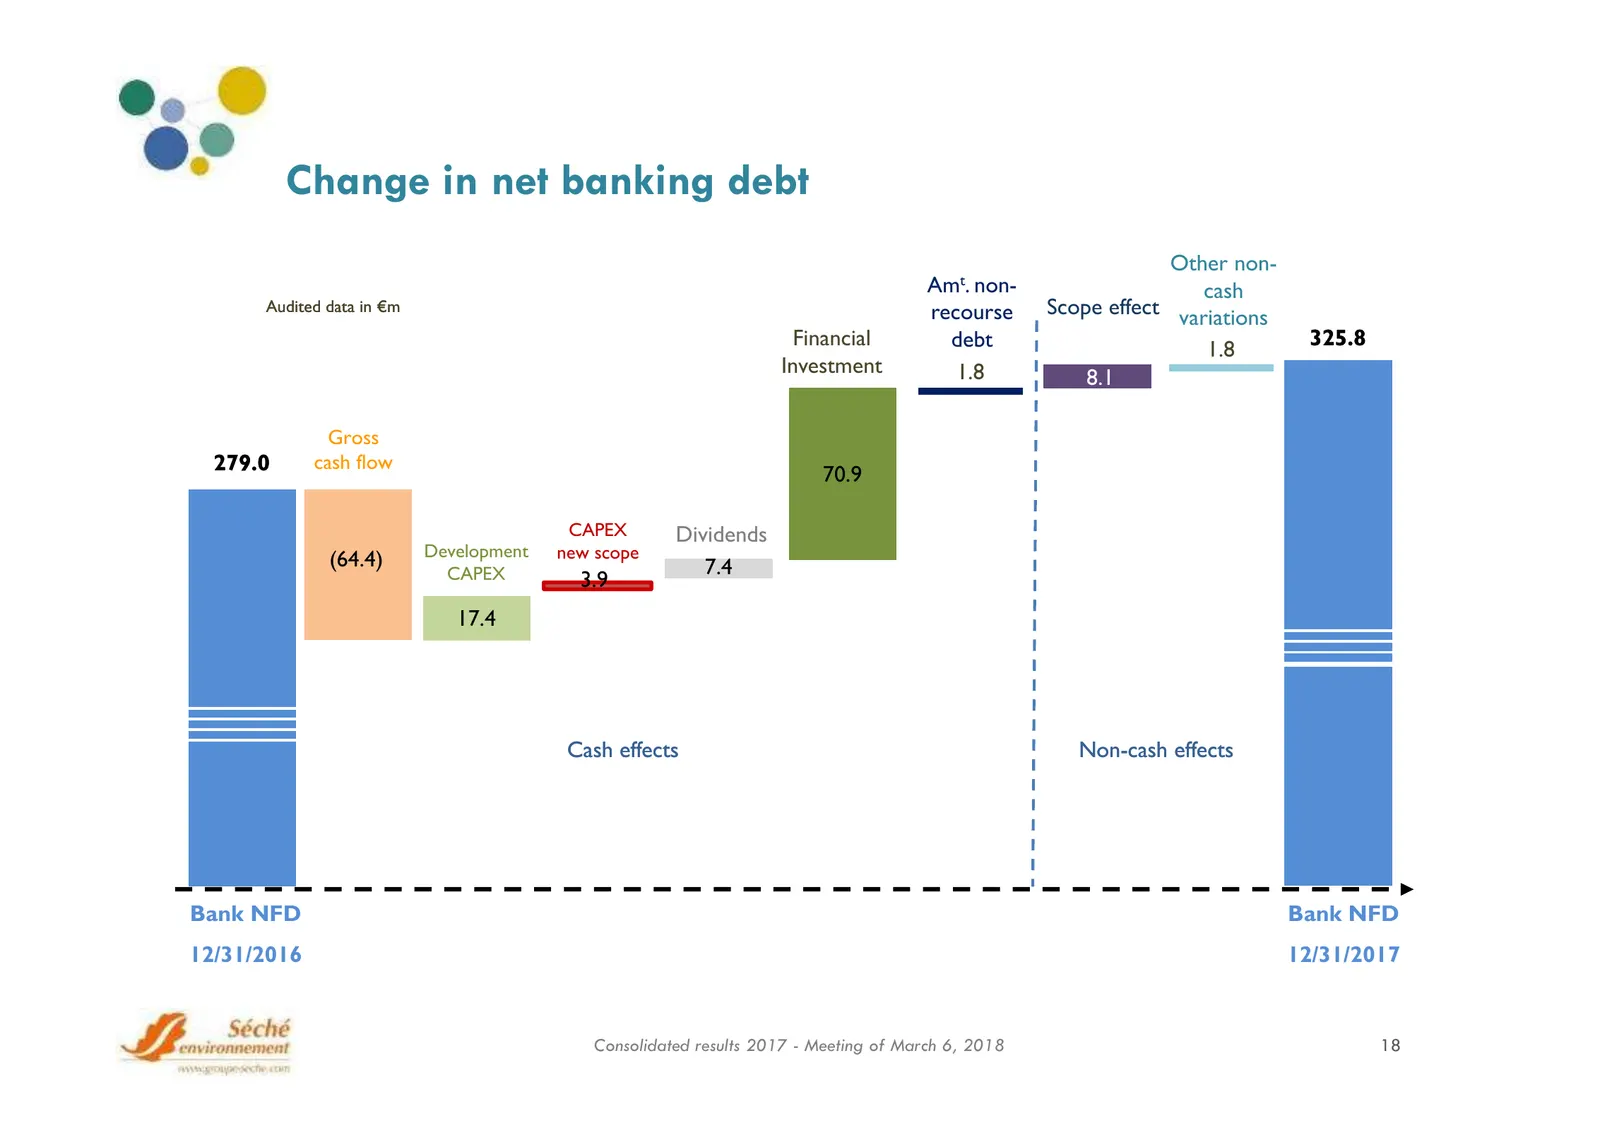
Slide 18: Change in net banking debt
Change in net banking debt Other non- Amt. non- cash Audited data in €m recourse Scope effect variations Financial debt 1.8 325.8 Investment 1.8 8.1 s Gross 279.0 cash flow 70.9 CAPEX Dividends (64.4) Development new scope CAPEX 7.4 3.9 17.4 Cash effects Non-cash effects Bank NFD Bank NFD 12/31/2016
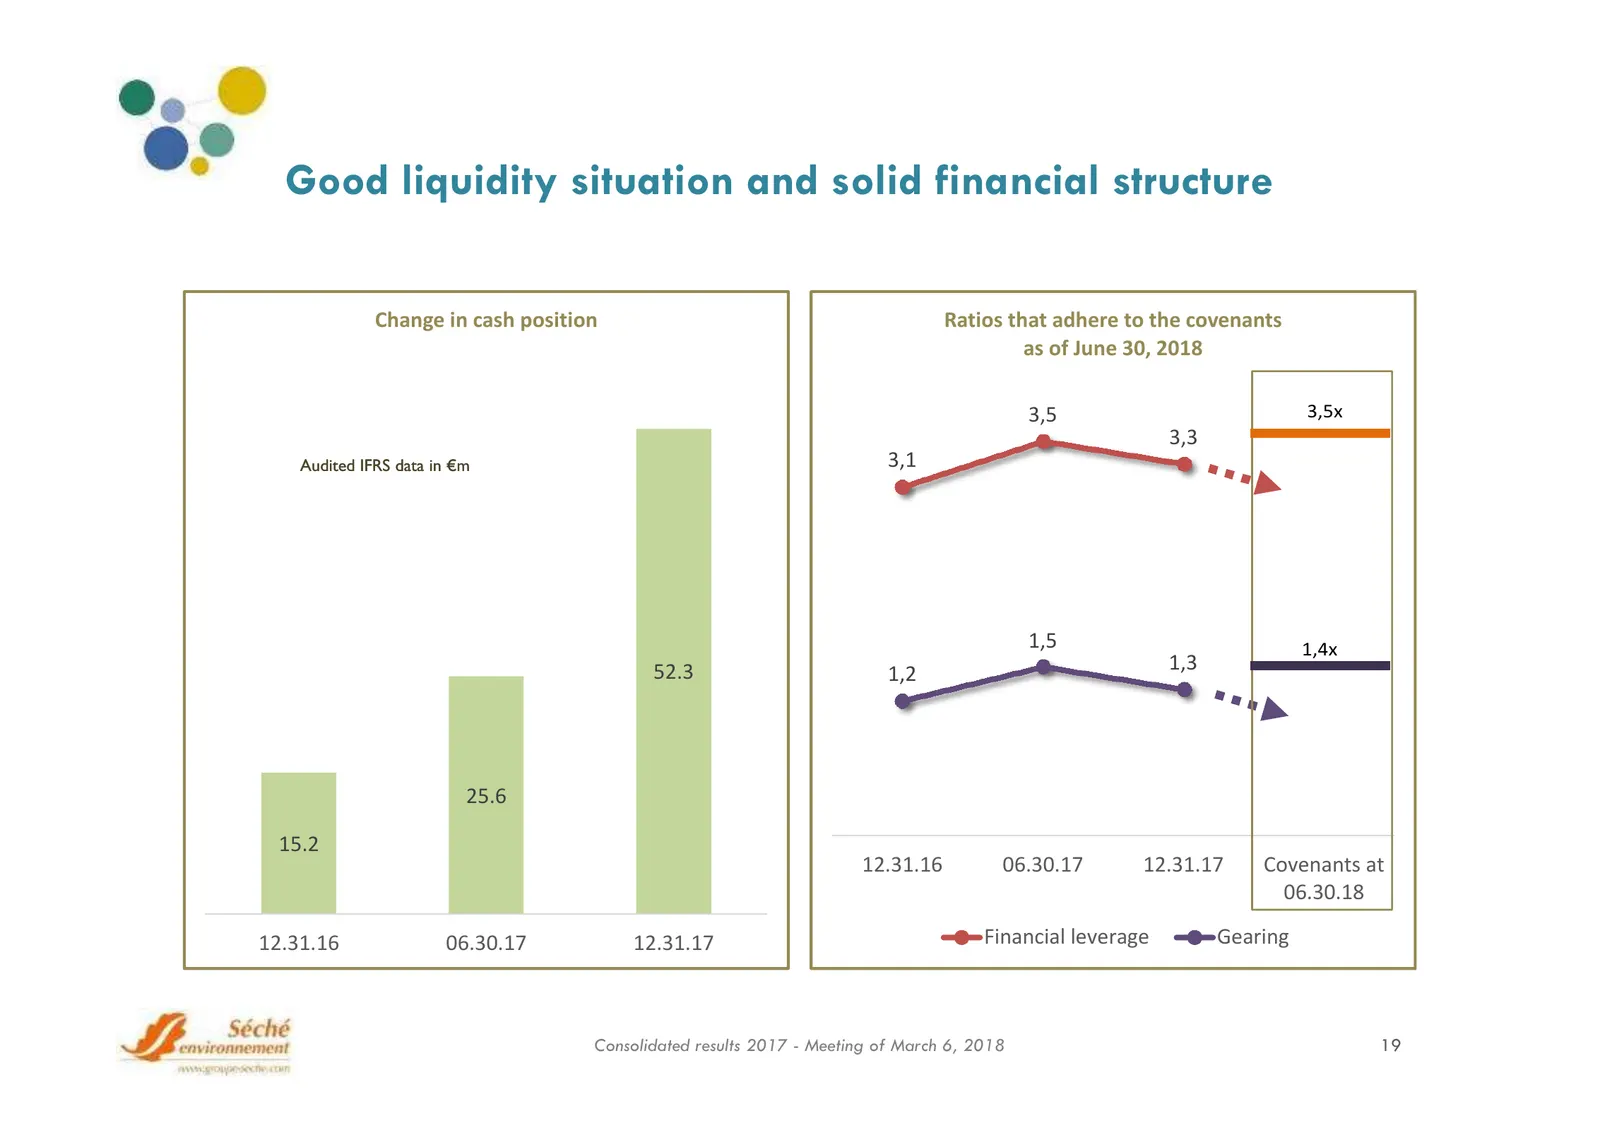
Slide 19: Good liquidity situation and solid financial structure
Good liquidity situation and solid financial structure Change in cash position Ratios that adhere to the covenants as of June 30, 2018 3,5 3,5x 3,3 Audited IFRS data in €m 3,1 1,5 1,4x 52.3 1,3 1,2 25.6 15.2 12.31.16 06.30.17 12.31.17 Covenants at 06.30.18 12.31.16 06.30.17 12.31.17 Financial levera
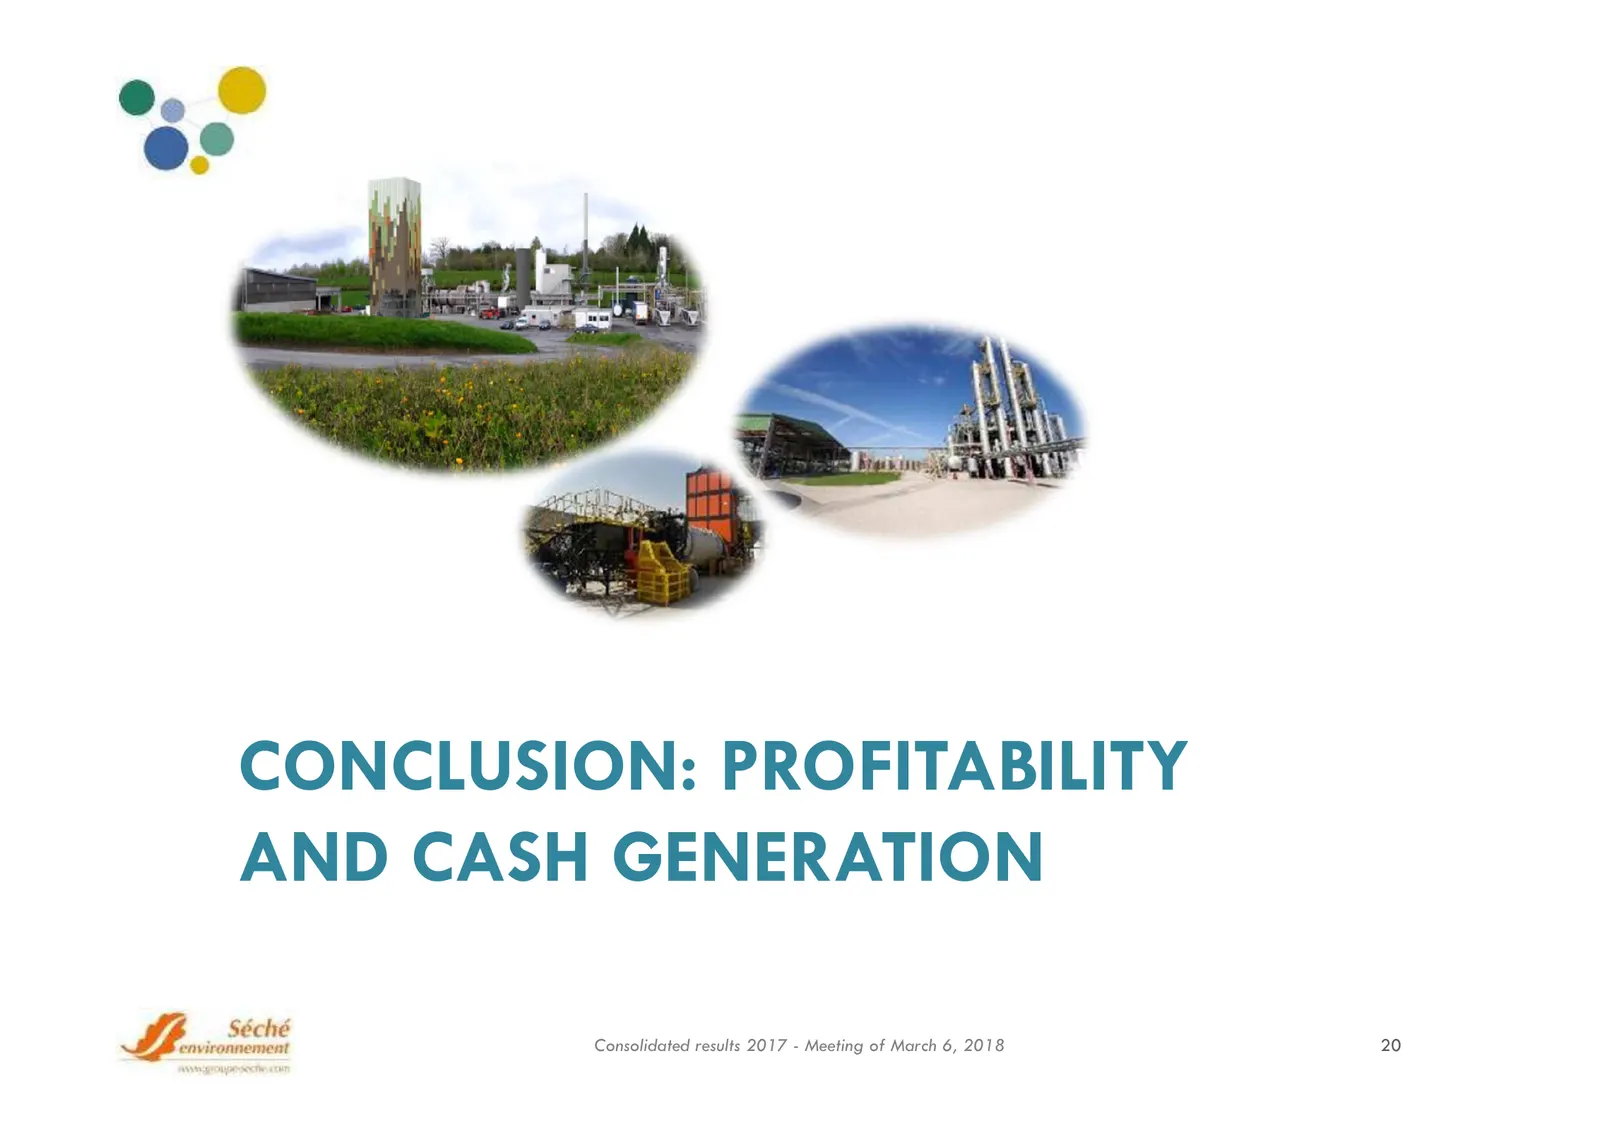
Slide 20: Conclusion: Profitability and cash generation
CONCLUSION: PROFITABILITY AND CASH GENERATION Consolidated results 2017 - Meeting of March 6, 2018 20
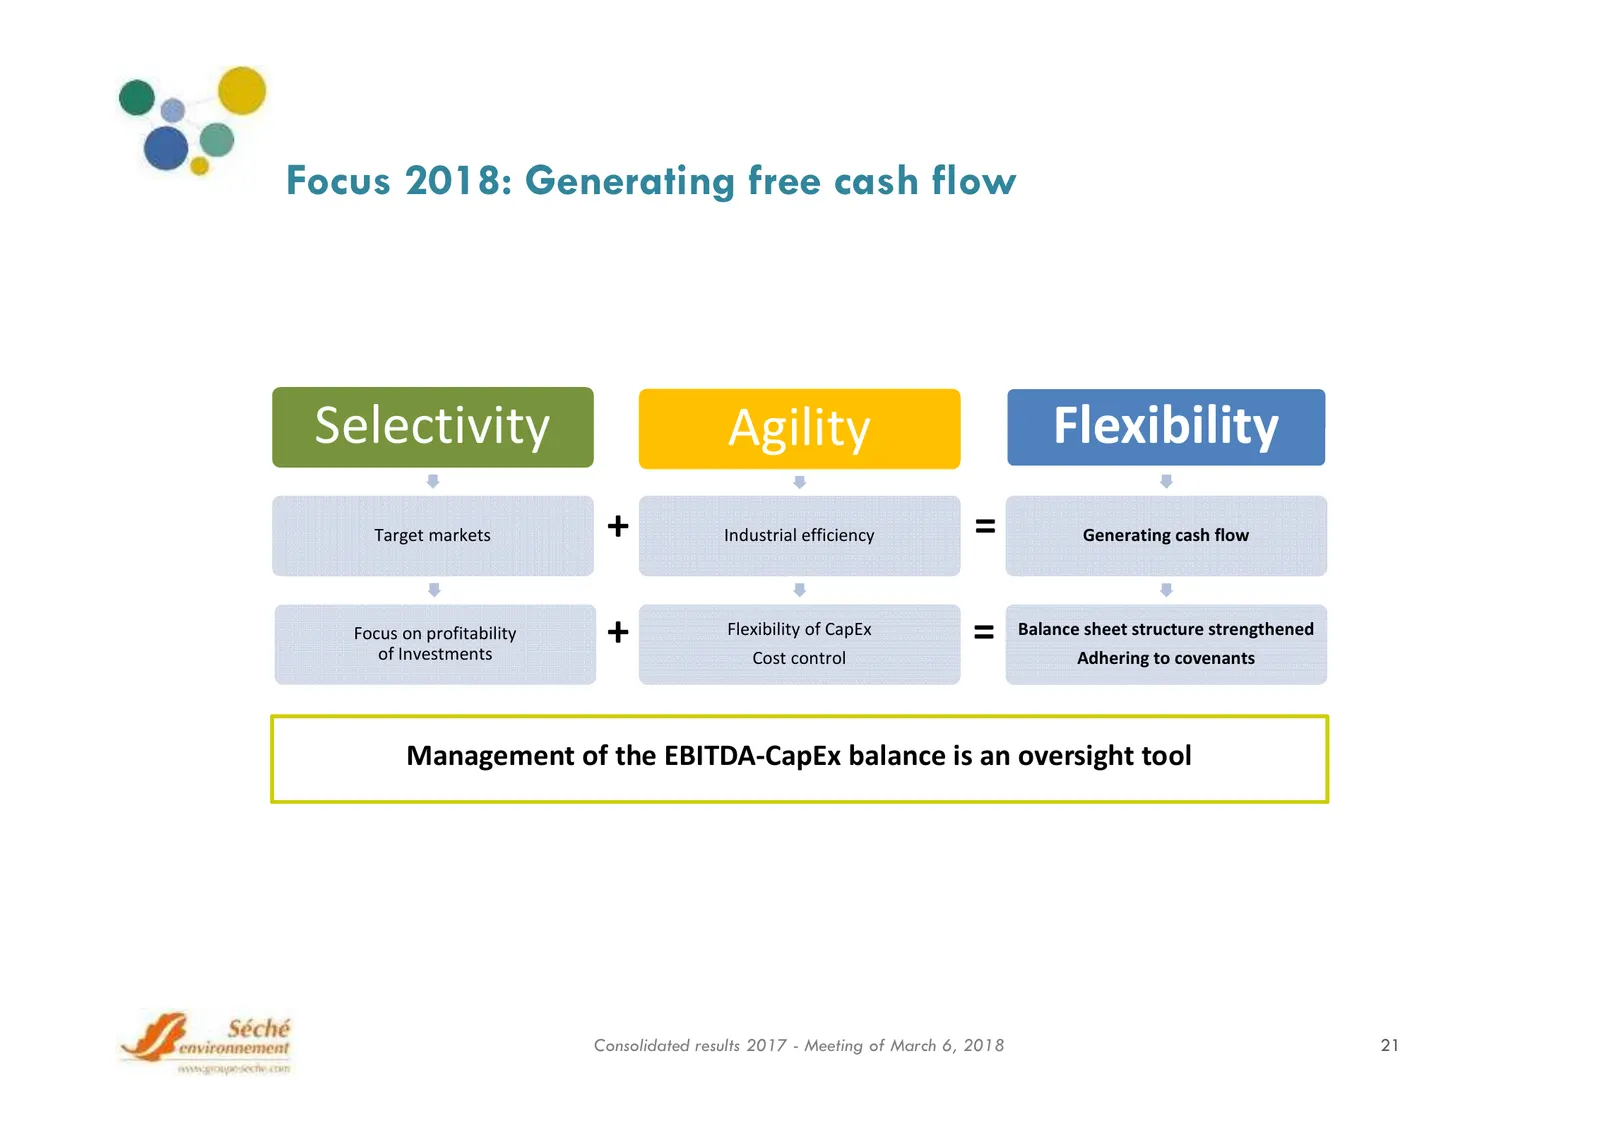
Slide 21: Focus 2018: Generating free cash flow
Focus 2018: Generating free cash flow Selectivity Agility Flexibility Target markets + Industrial efficiency = Generating cash flow Focus on profitability of Investments + Flexibility of CapEx Cost control = BalanceAdhering sheet structure strengthened to covenants Management of the EBITDA-CapEx bal
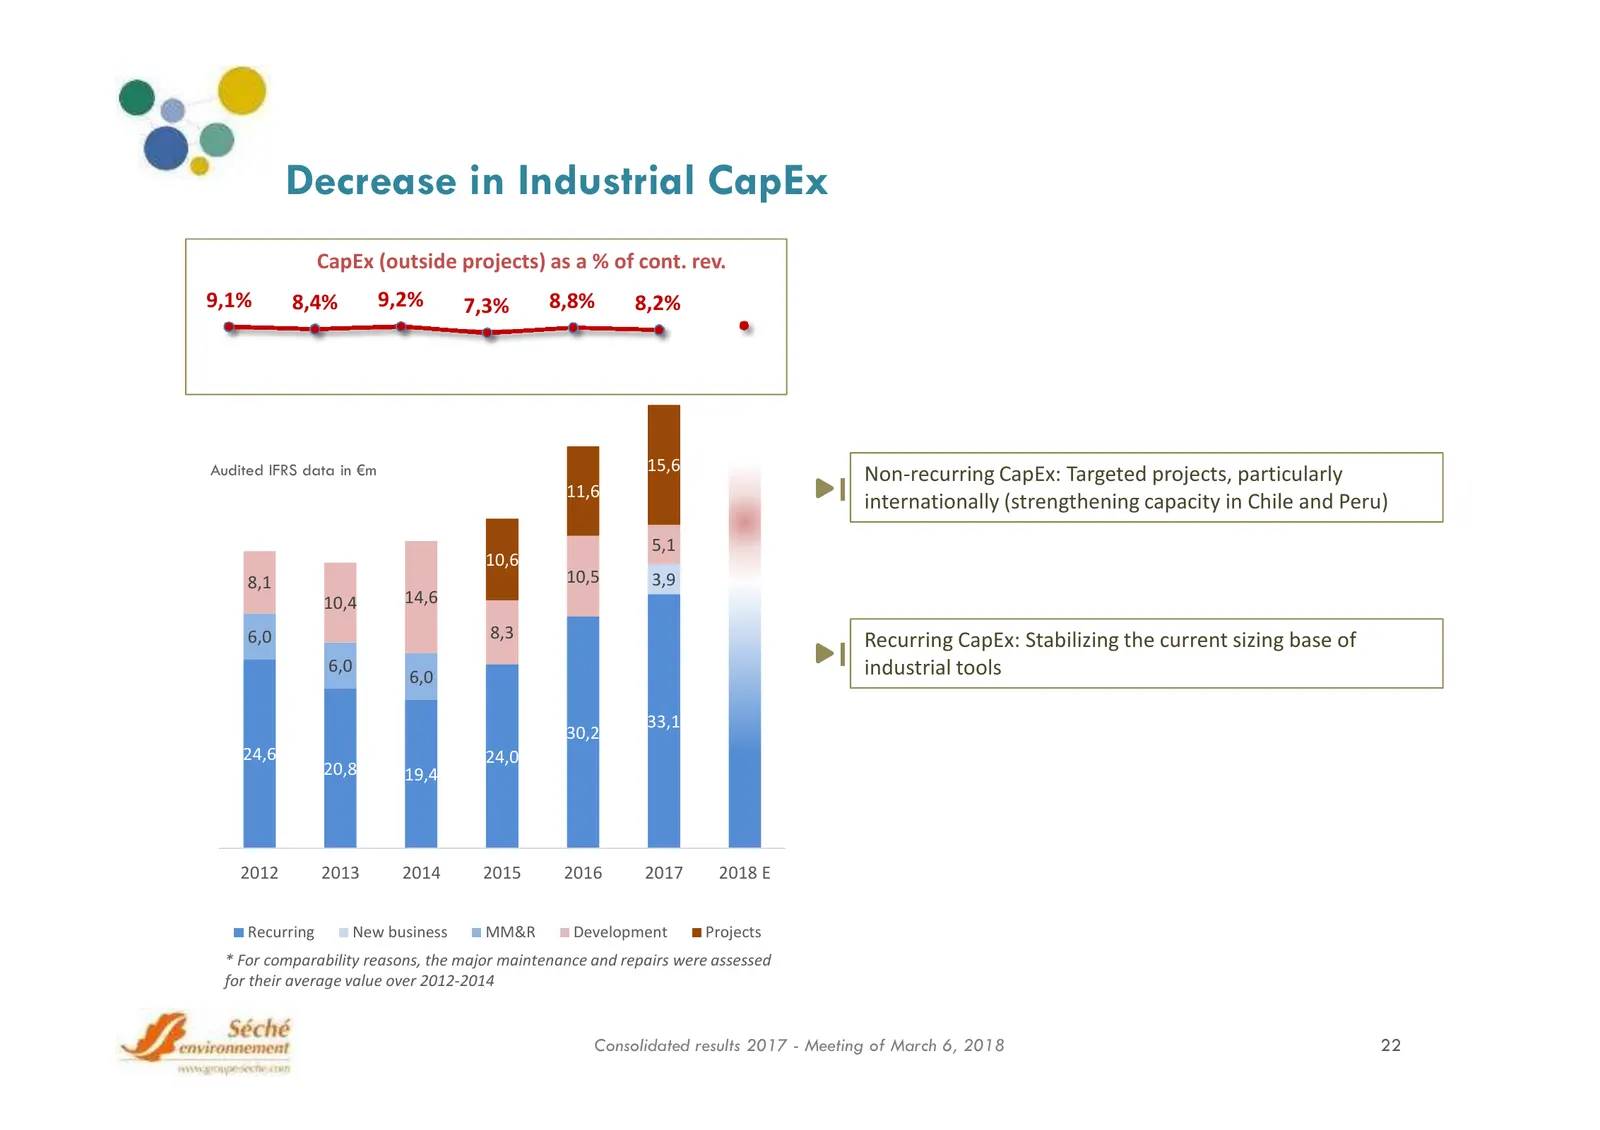
Slide 22: Decrease in Industrial CapEx
Decrease in Industrial CapEx CapEx (outside projects) as a % of cont. rev. 9,1% 8,4% 9,2% 7,3% 8,8% 8,2% Audited IFRS data in €m 15,6 Non-recurring CapEx: Targeted projects, particularly 11,6 internationally (strengthening capacity in Chile and Peru) 5,1 10,6 8,1 10,5 3,9 10,4 14,6 6,0 8,3 Recurring
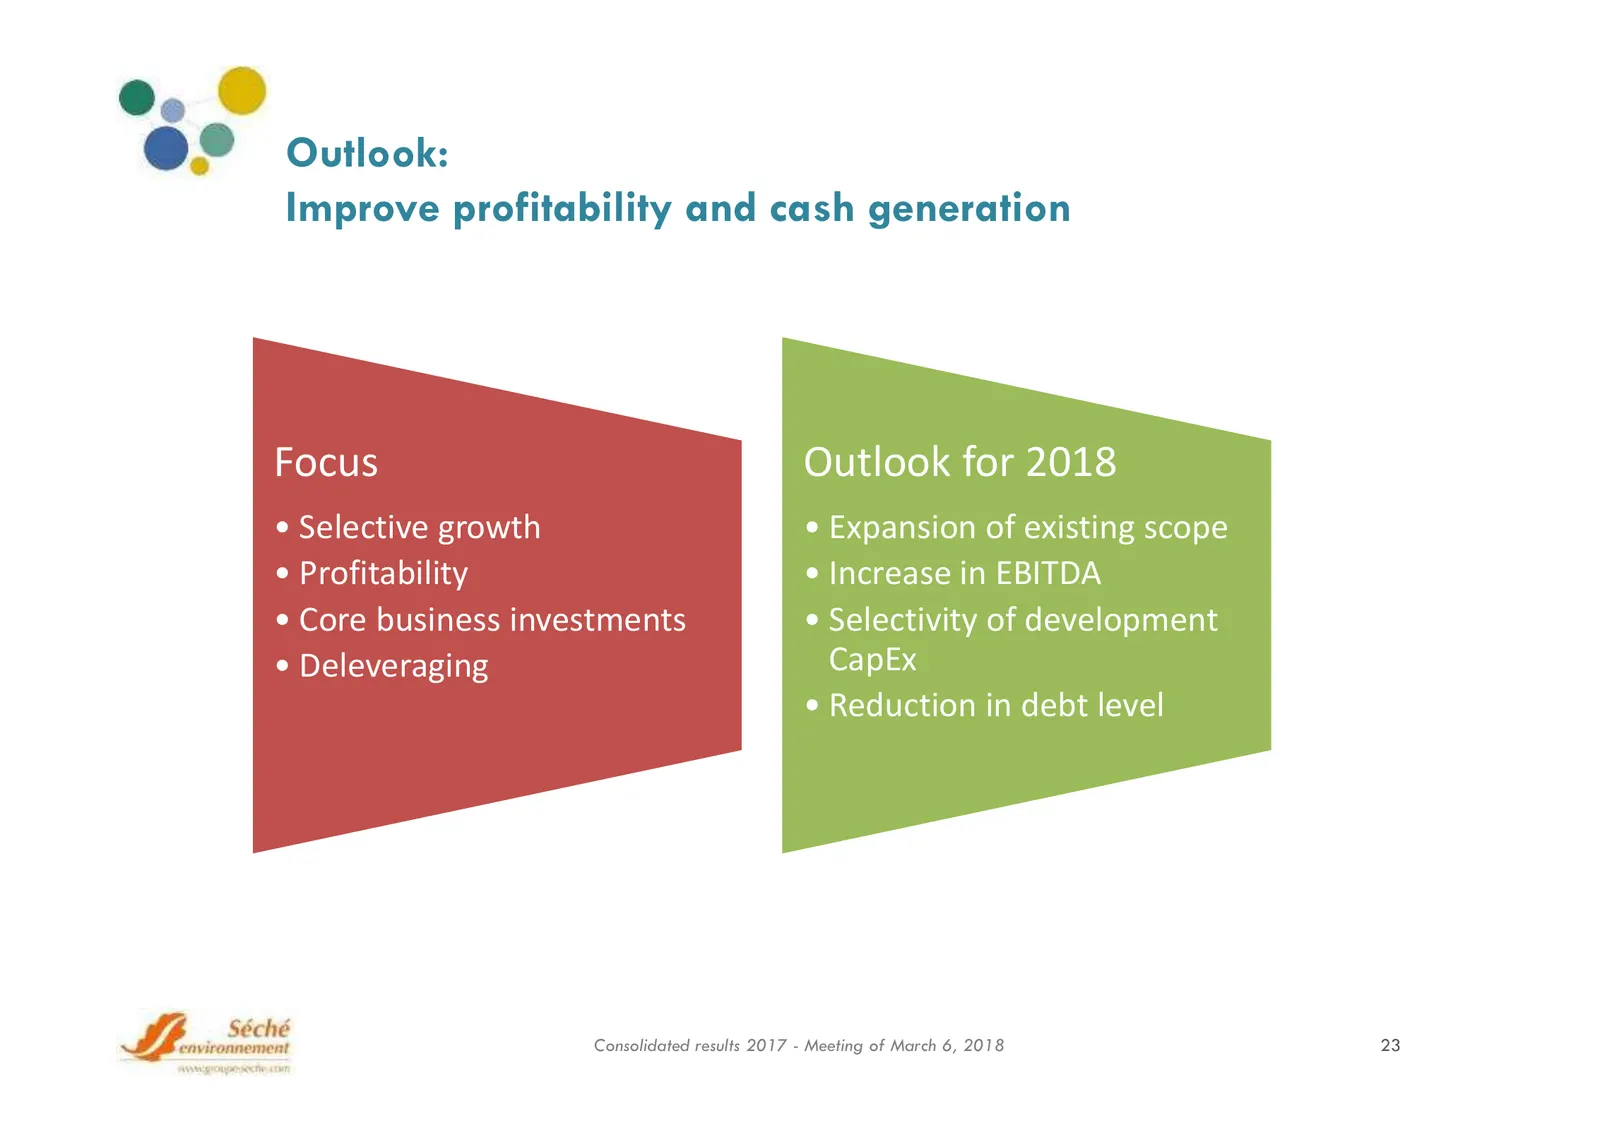
Slide 23: Outlook: Improve profitability and cash generation
Outlook: Improve profitability and cash generation Focus Outlook for 2018 • Selective growth • Expansion of existing scope • Profitability • Increase in EBITDA • Core business investments • Selectivity of development • Deleveraging CapEx • Reduction in debt level Consolidated results 2017 - Meeting
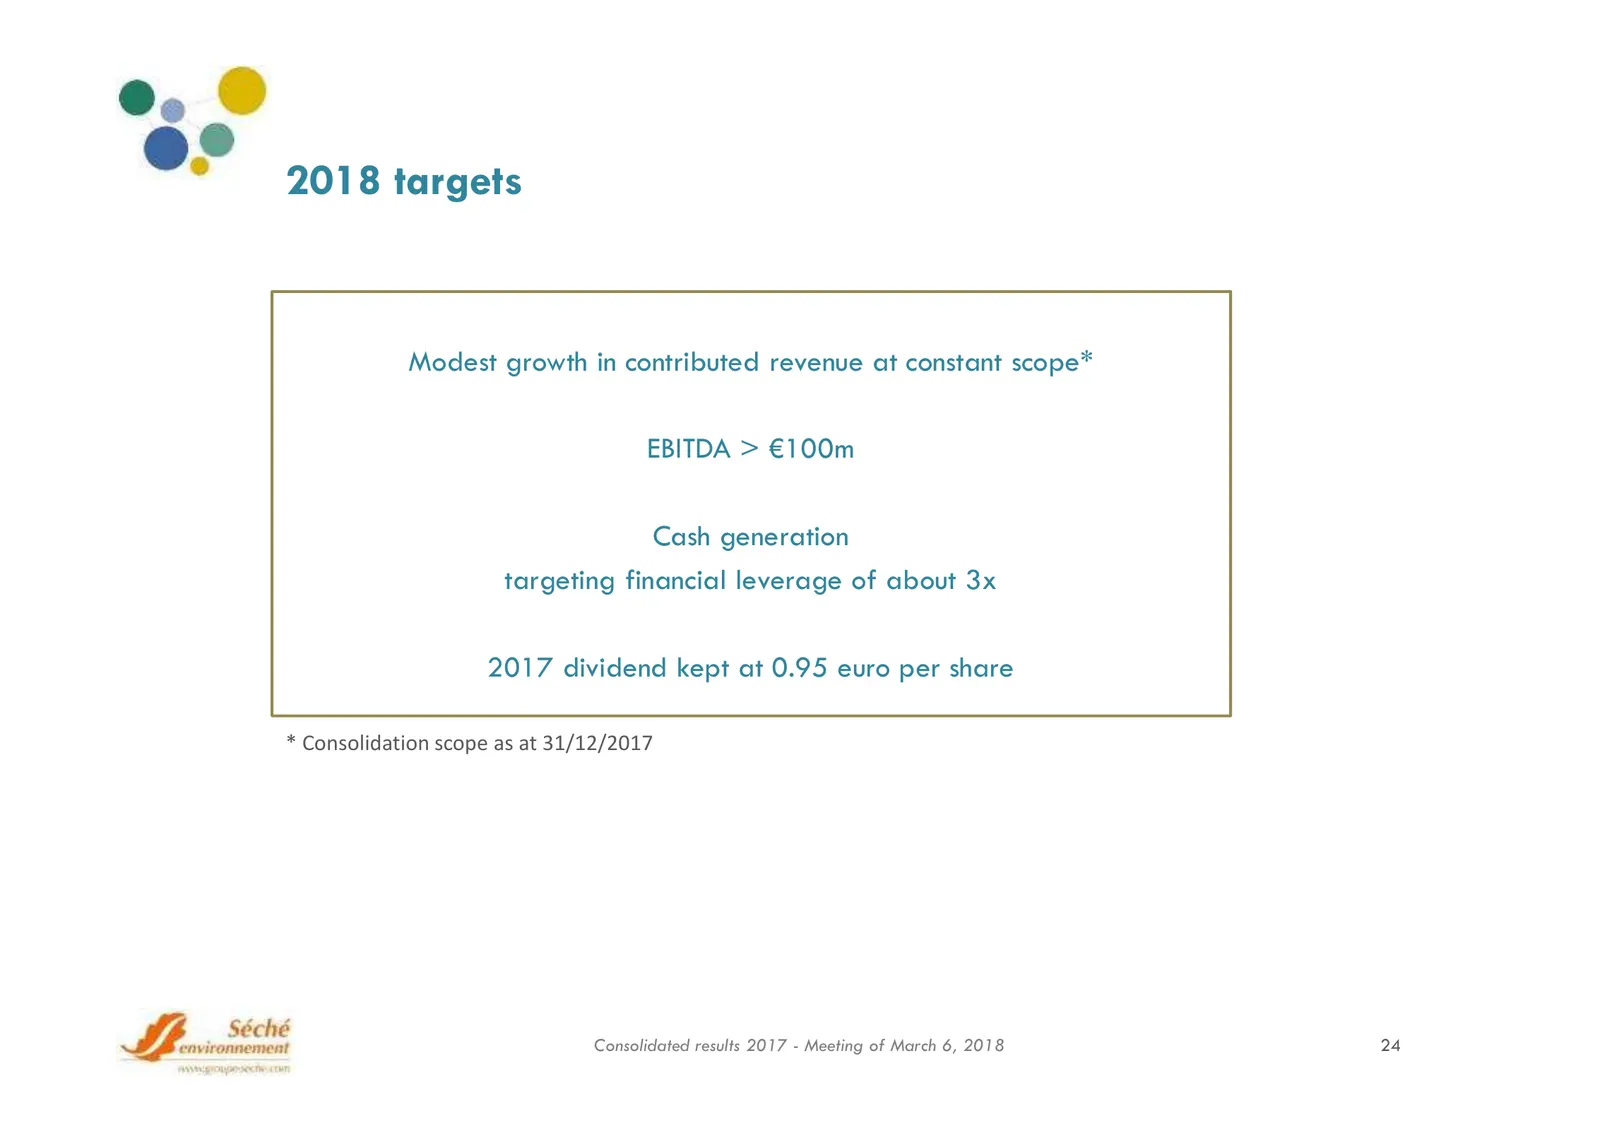
Slide 24: 2018 targets
2018 targets Modest growth in contributed revenue at constant scope* EBITDA > €100m Cash generation targeting financial leverage of about 3x 2017 dividend kept at 0.95 euro per share * Consolidation scope as at 31/12/2017 Consolidated results 2017 - Meeting of March 6, 2018 24
Slide 25: Q&A
Q&A Manuel Andersen Head of Investor Relations m.andersen@groupe-seche.com
Slide 26: Appendices
Appendix 1: Breakdown of contributed revenue by geographical area Appendix 2: Change in contributed revenue by division Appendix 3: Change in contributed revenue by activity APPENDICES Appendix 4: Breakdown of contributed revenue by business line Appendix 5: Breakdown of contributed revenue by clien
Slide 27: Appendix 1: Breakdown in revenue by geographical area
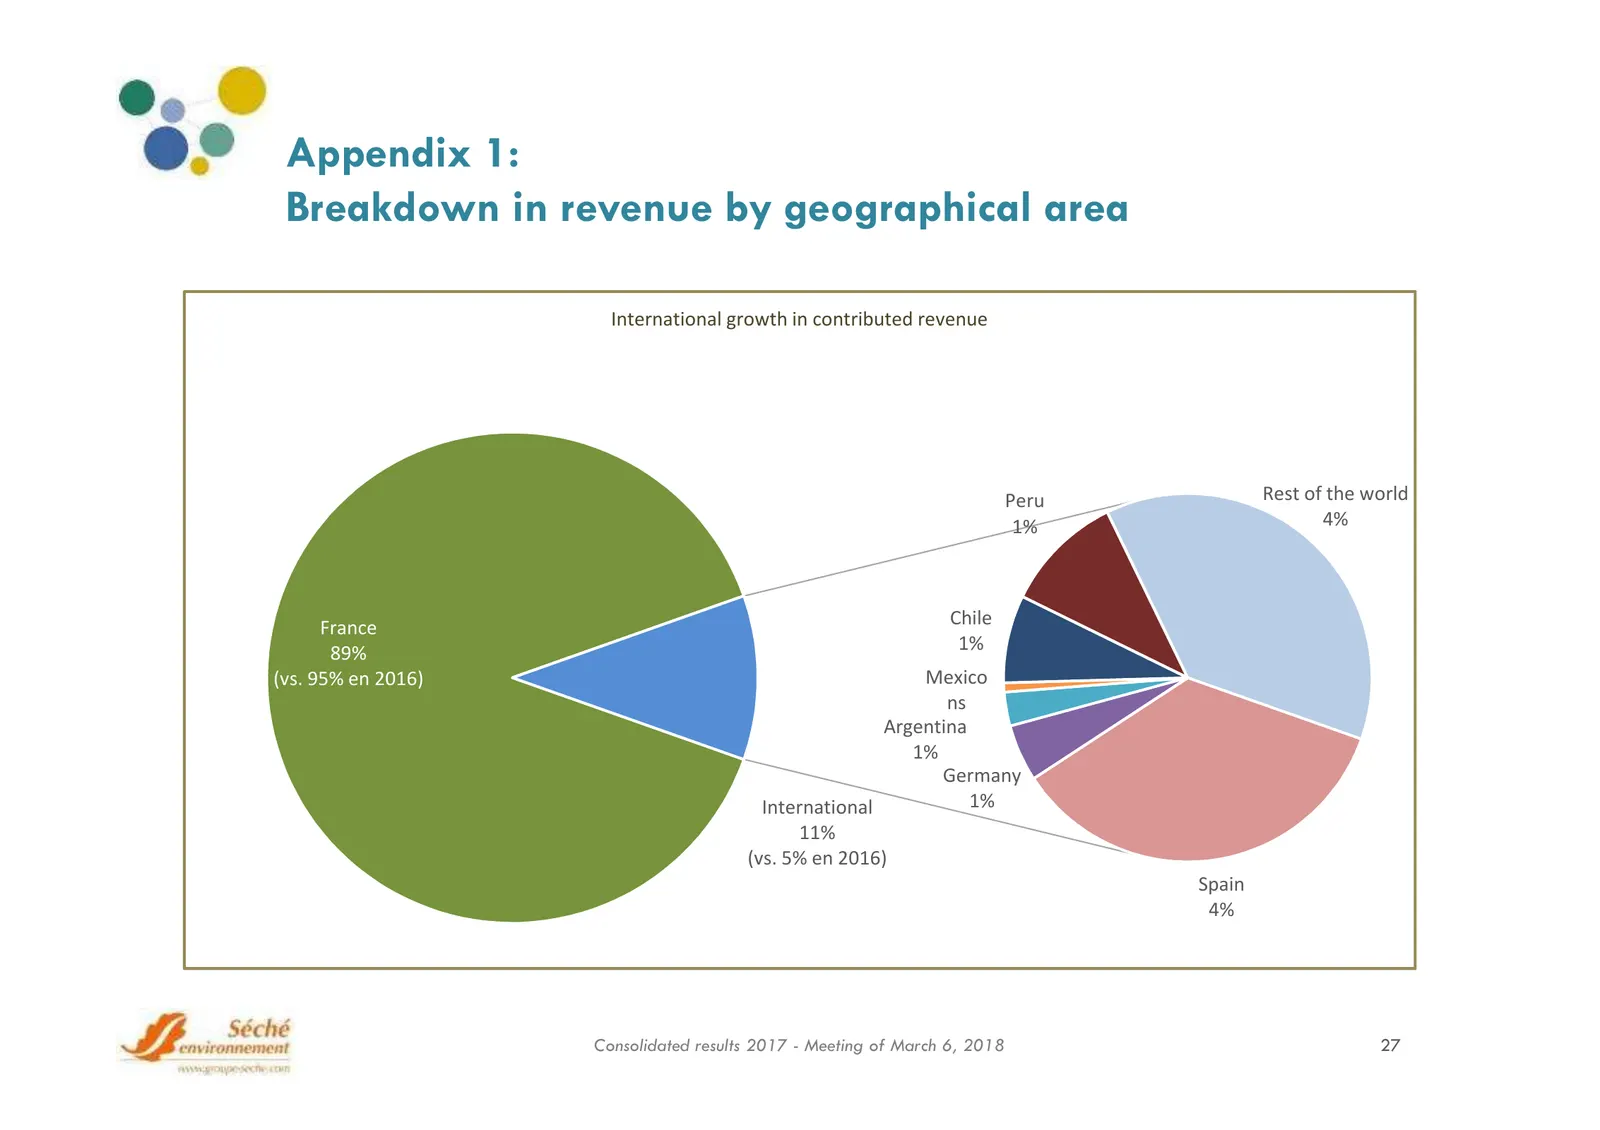
Appendix 1: Breakdown in revenue by geographical area International growth in contributed revenue Peru Rest of the world 1% 4% France Chile 89% 1% (vs. 95% en 2016) Mexico ns Argentina 1% Germany International 1% 11% (vs. 5% en 2016) Spain 4% Consolidated results 2017 - Meeting of March 6, 2018 27
Slide 28: Appendix 2: Change in contributed revenue by division
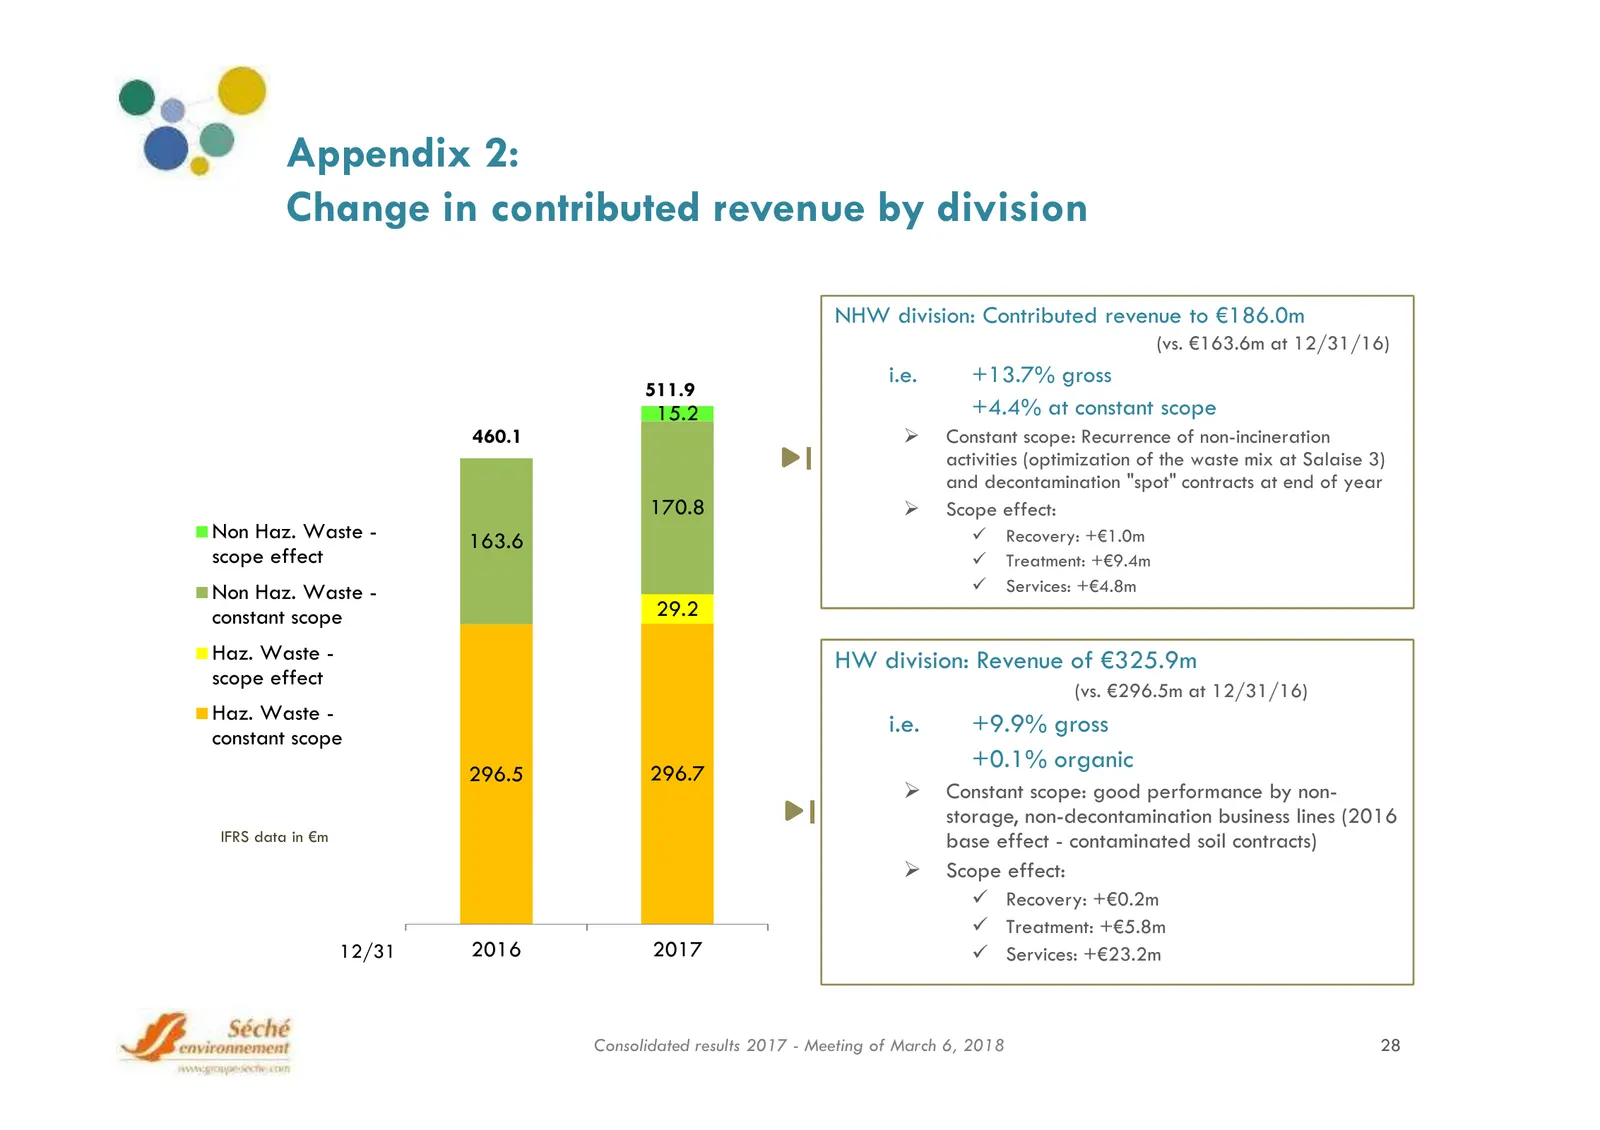
Appendix 2: Change in contributed revenue by division NHW division: Contributed revenue to €186.0m (vs. €163.6m at 12/31/16) i.e. +13.7% gross 511.9 15.2 +4.4% at constant scope 460.1 Constant scope: Recurrence of non-incineration activities (optimization of the waste mix at Salaise 3) and decontami
Slide 29: Appendix 3: Change in contributed revenue by division
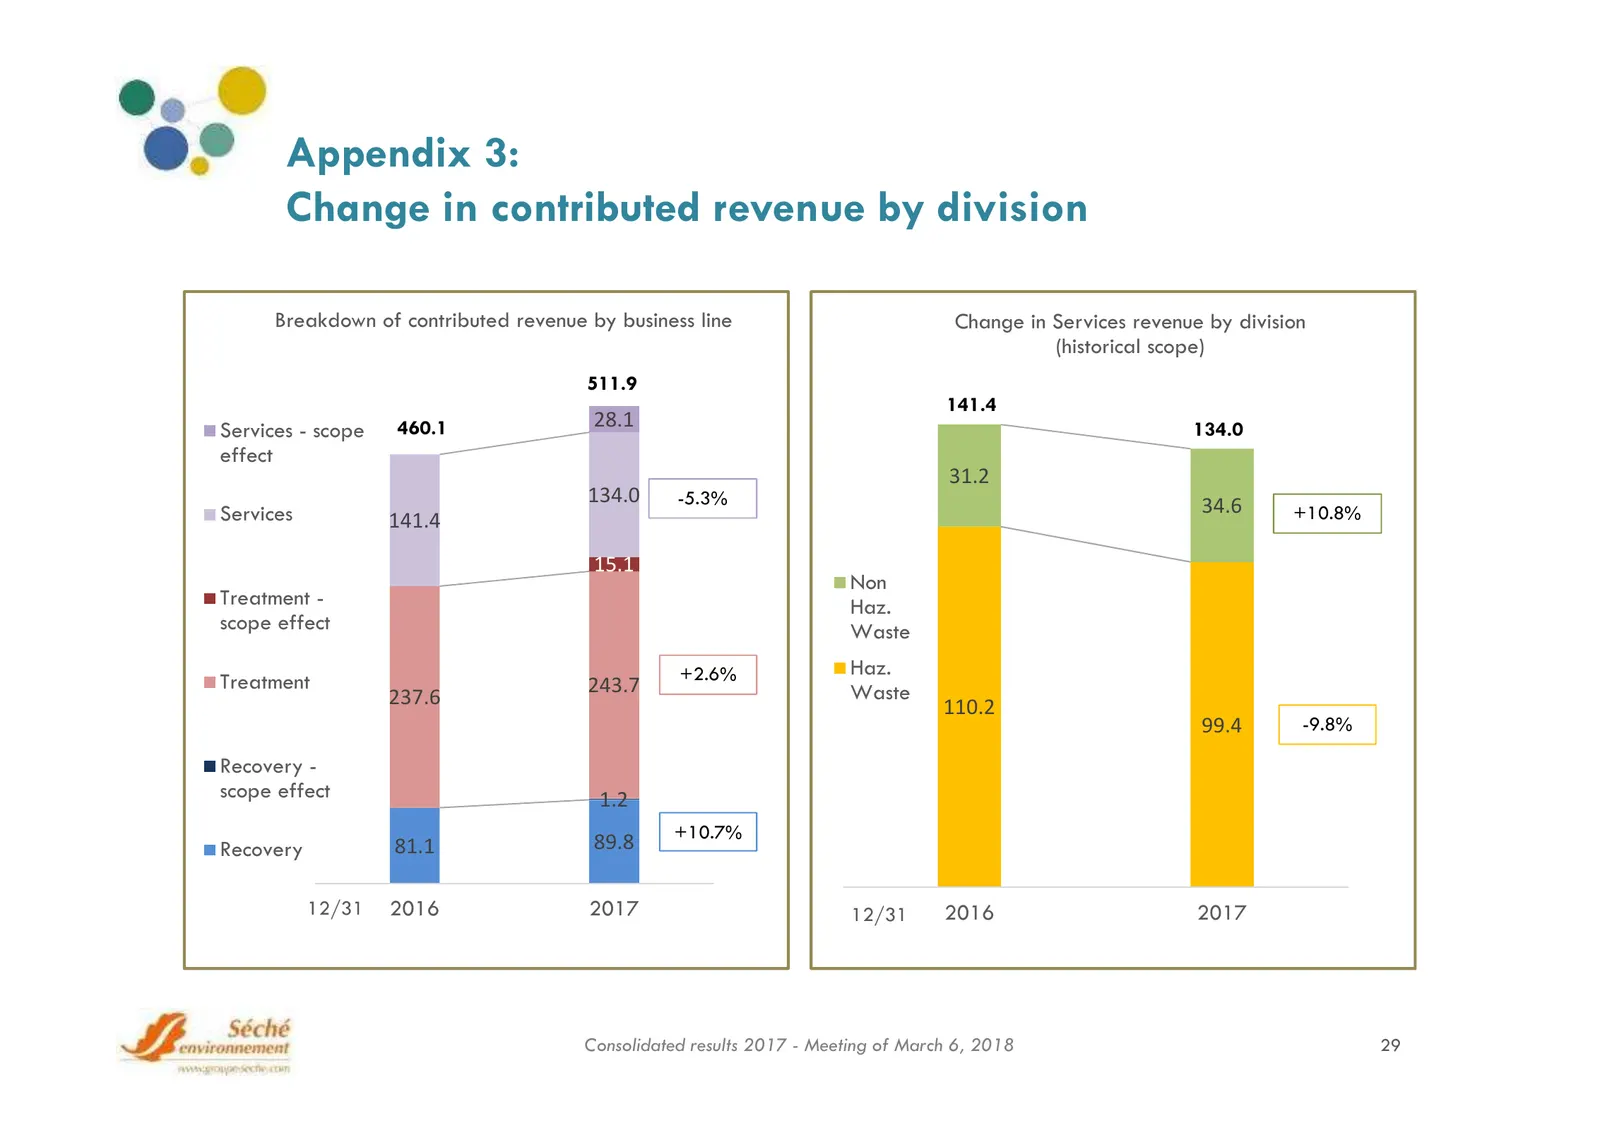
Appendix 3: Change in contributed revenue by division Breakdown of contributed revenue by business line Change in Services revenue by division (historical scope) 511.9 141.4 Services - scope 460.1 28.1 134.0 effect 31.2 134.0 -5.3% 34.6 Services 141.4 +10.8% 15.1 Non Treatment - Haz. scope effect Wa
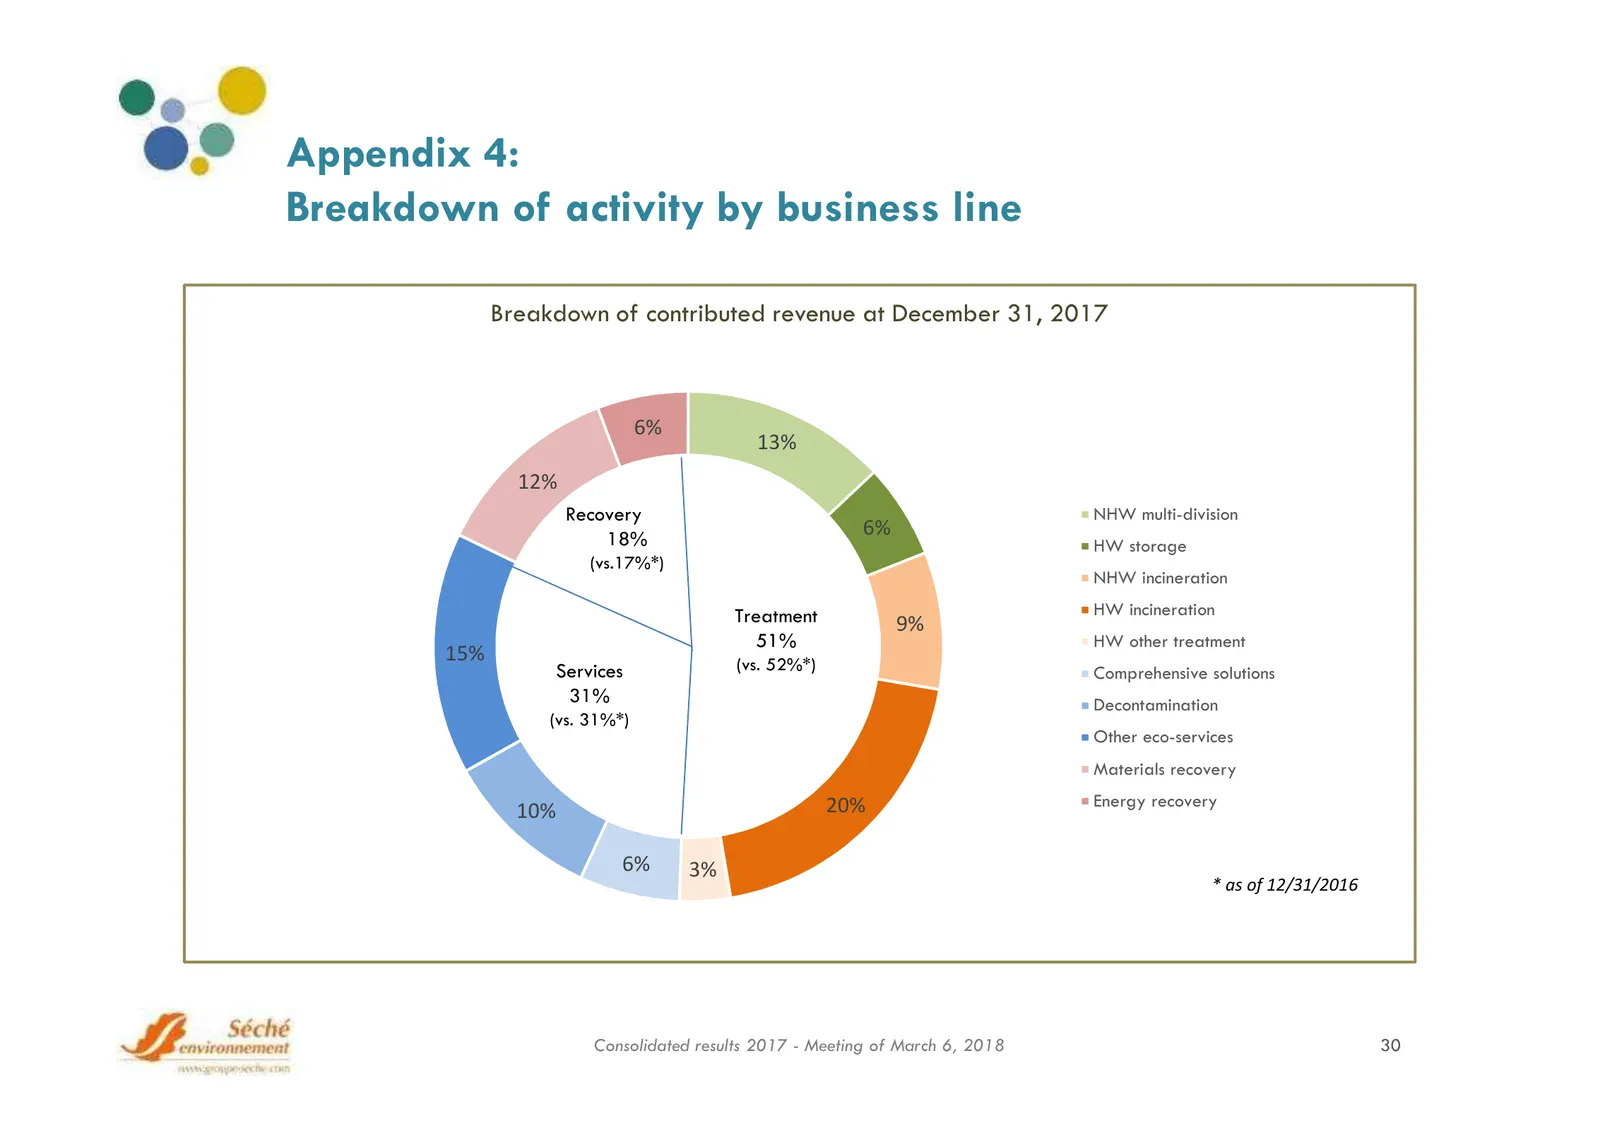
Slide 30: Appendix 4: Breakdown of activity by business line
Appendix 4: Breakdown of activity by business line Breakdown of contributed revenue at December 31, 2017 6% 13% 12% Recovery NHW multi-division 18% 6% HW storage (vs.17%*) NHW incineration Treatment HW incineration 9% 51% HW other treatment 15% (vs. 52%*) Services Comprehensive solutions 31% Deconta
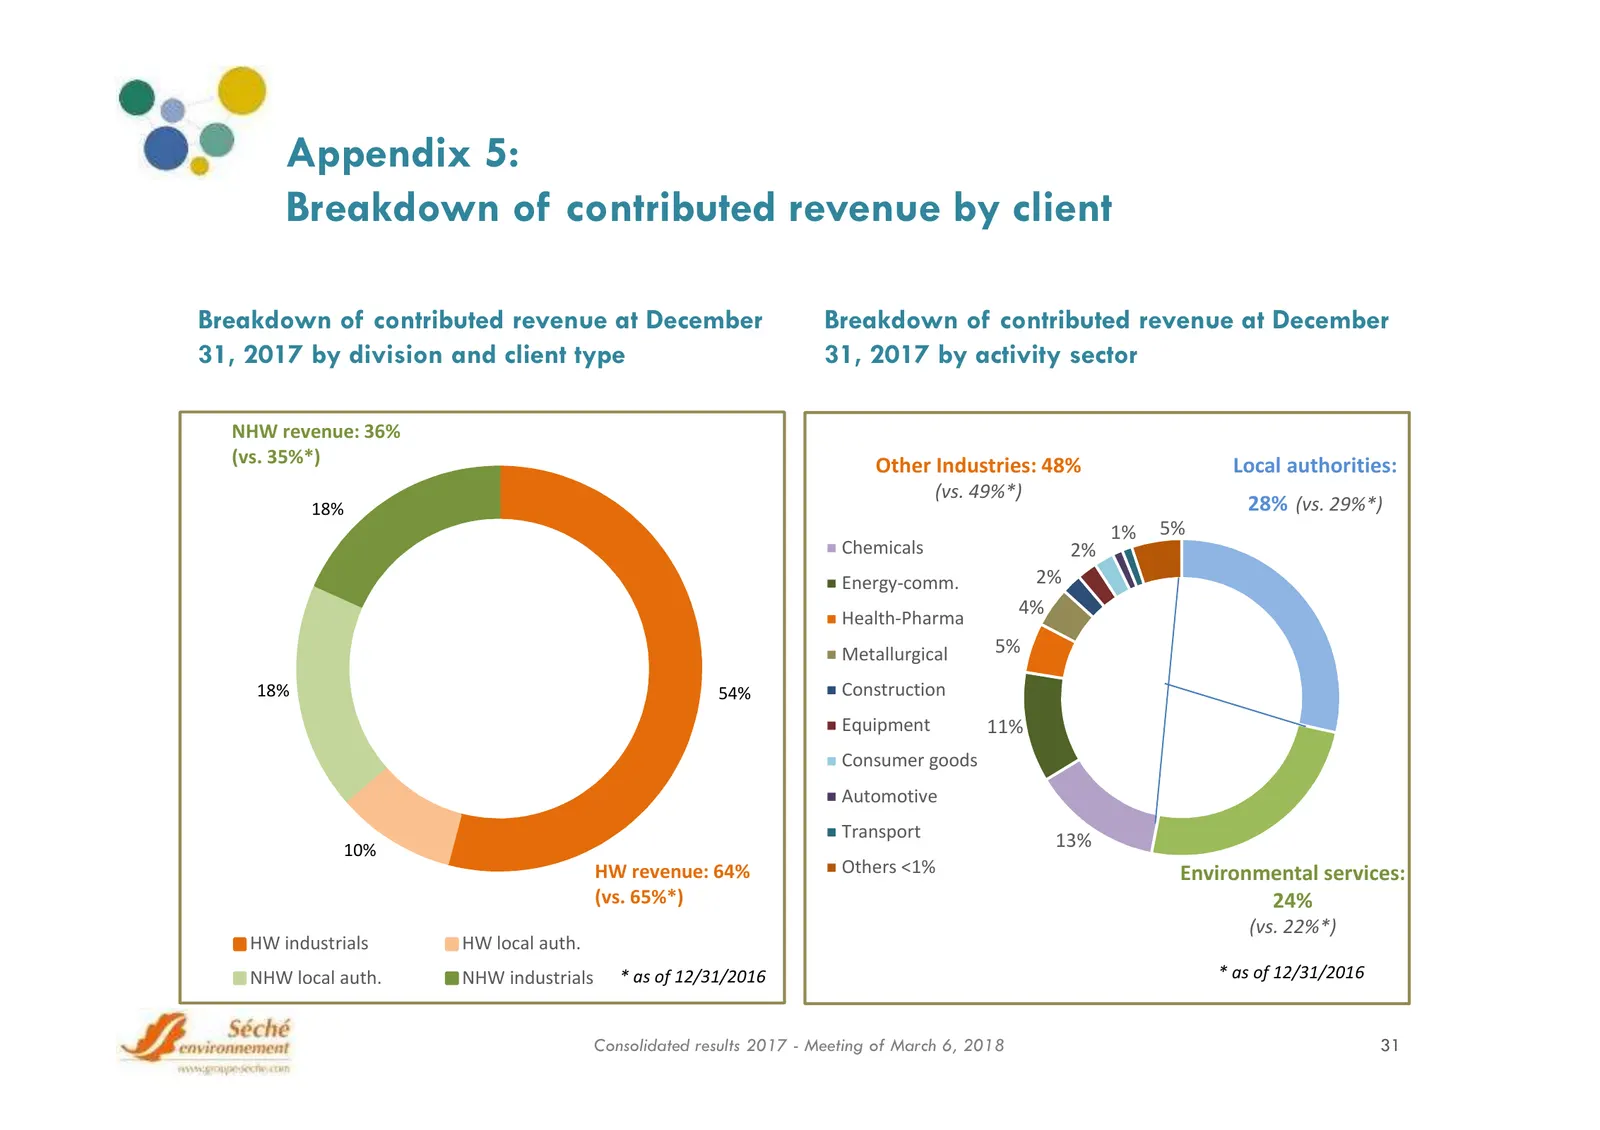
Slide 31: Appendix 5: Breakdown of contributed revenue by client
Appendix 5: Breakdown of contributed revenue by client Breakdown of contributed revenue at December Breakdown of contributed revenue at December 31, 2017 by division and client type 31, 2017 by activity sector NHW revenue: 36% (vs. 35%*) Other Industries: 48% Local authorities: (vs. 49%*) 18% 28% (v
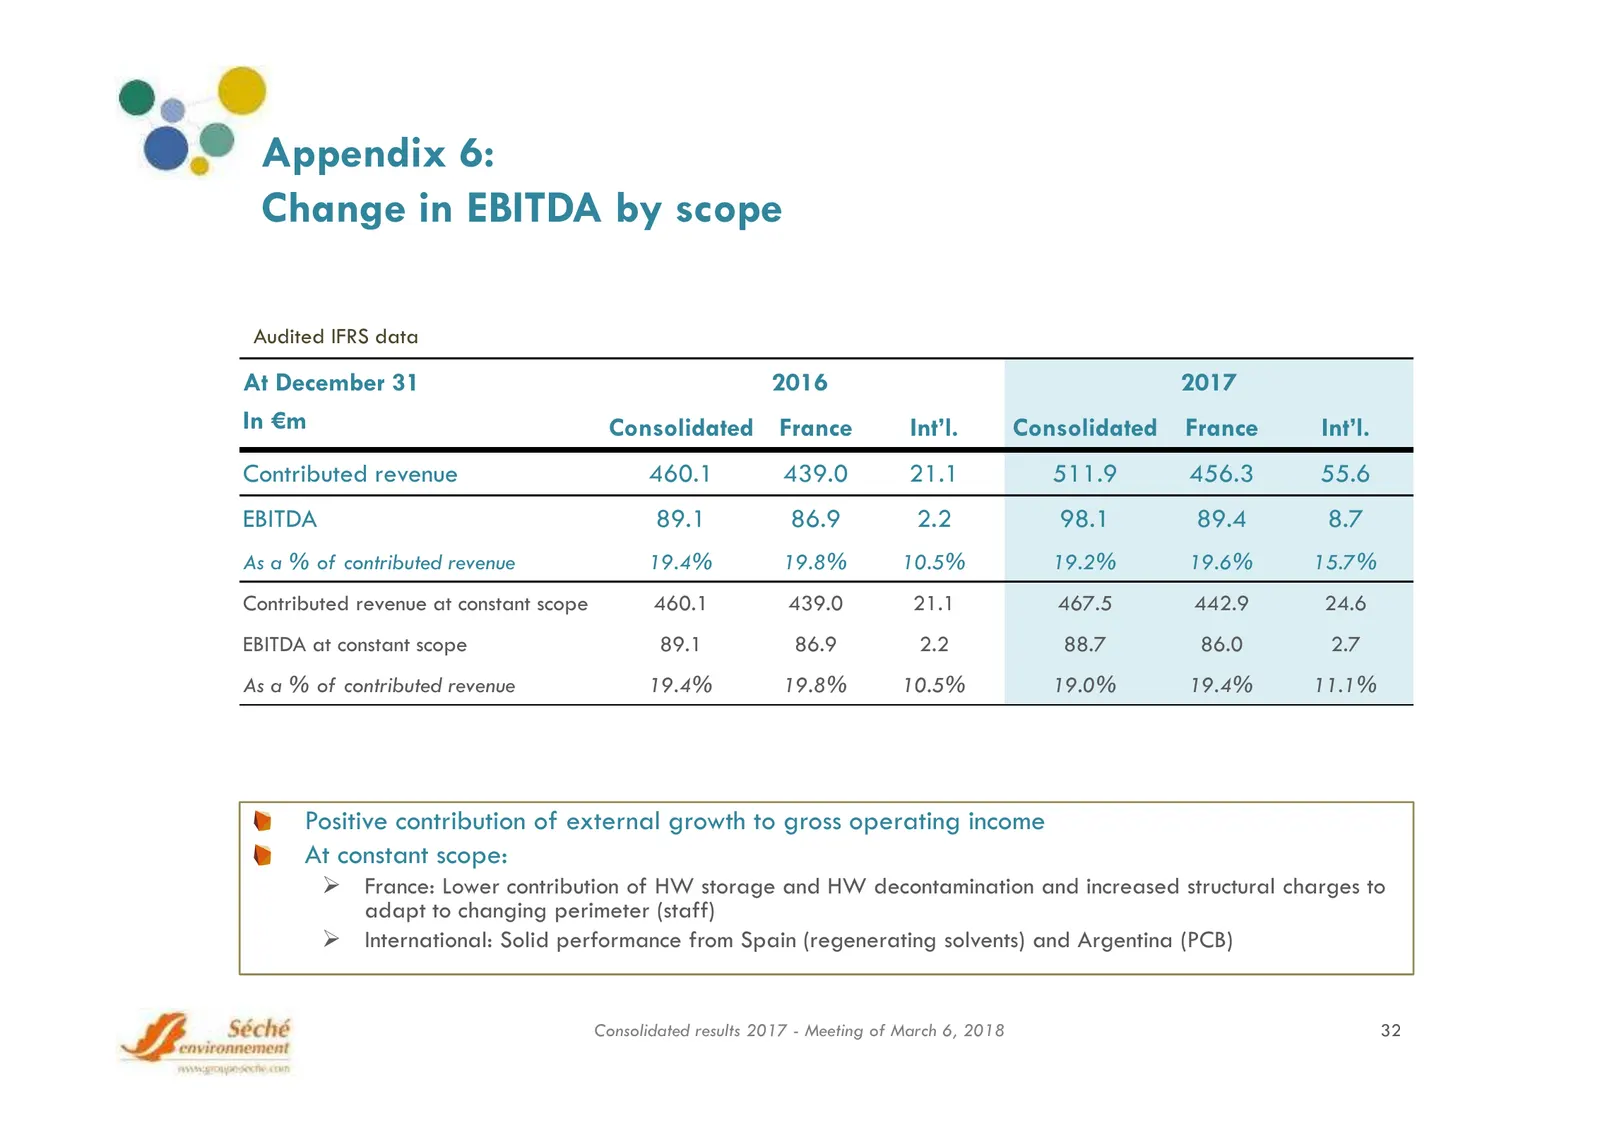
Slide 32: Appendix 6: Change in EBITDA by scope
Appendix 6: Change in EBITDA by scope Audited IFRS data At December 31 2016 2017 In €m Consolidated France Int’l. Consolidated France Int’l. Contributed revenue 460.1 439.0 21.1 511.9 456.3 55.6 EBITDA 89.1 86.9 2.2 98.1 89.4 8.7 As a % of contributed revenue 19.4% 19.8% 10.5% 19.2% 19.6% 15.7% Cont
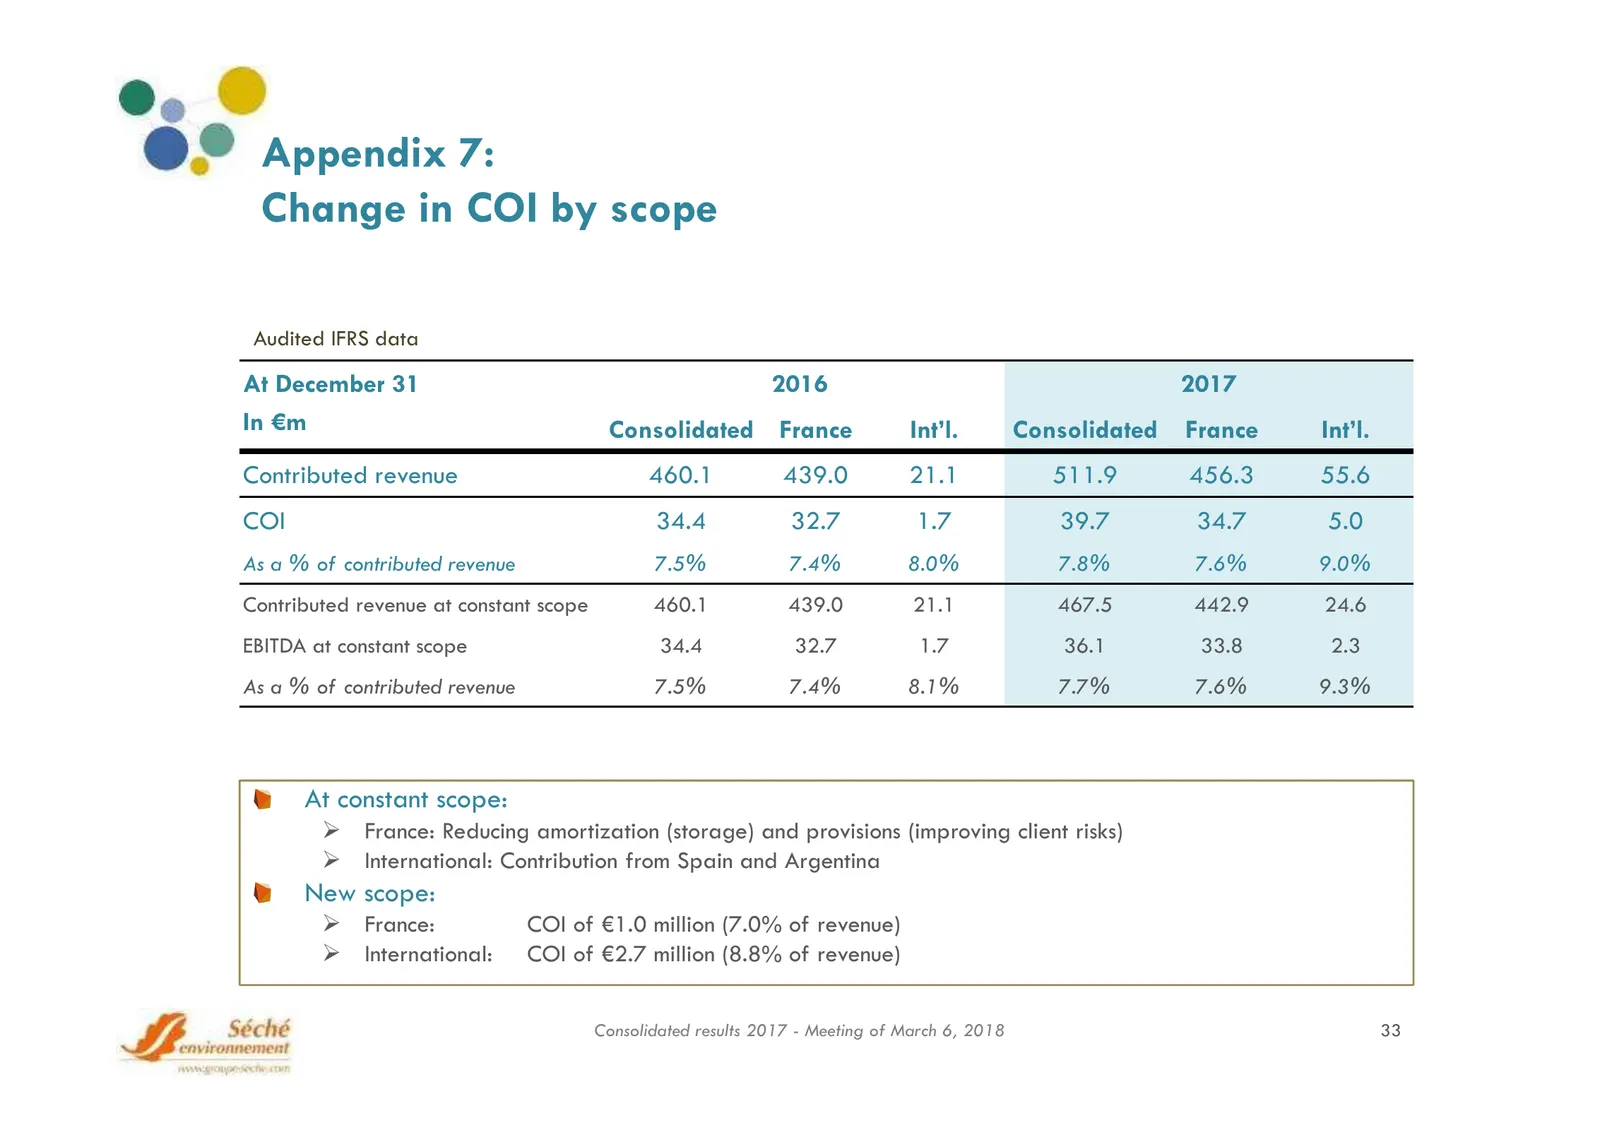
Slide 33: Appendix 7: Change in COI by scope
Appendix 7: Change in COI by scope Audited IFRS data At December 31 2016 2017 In €m Consolidated France Int’l. Consolidated France Int’l. Contributed revenue 460.1 439.0 21.1 511.9 456.3 55.6 COI 34.4 32.7 1.7 39.7 34.7 5.0 As a % of contributed revenue 7.5% 7.4% 8.0% 7.8% 7.6% 9.0% Contributed reve
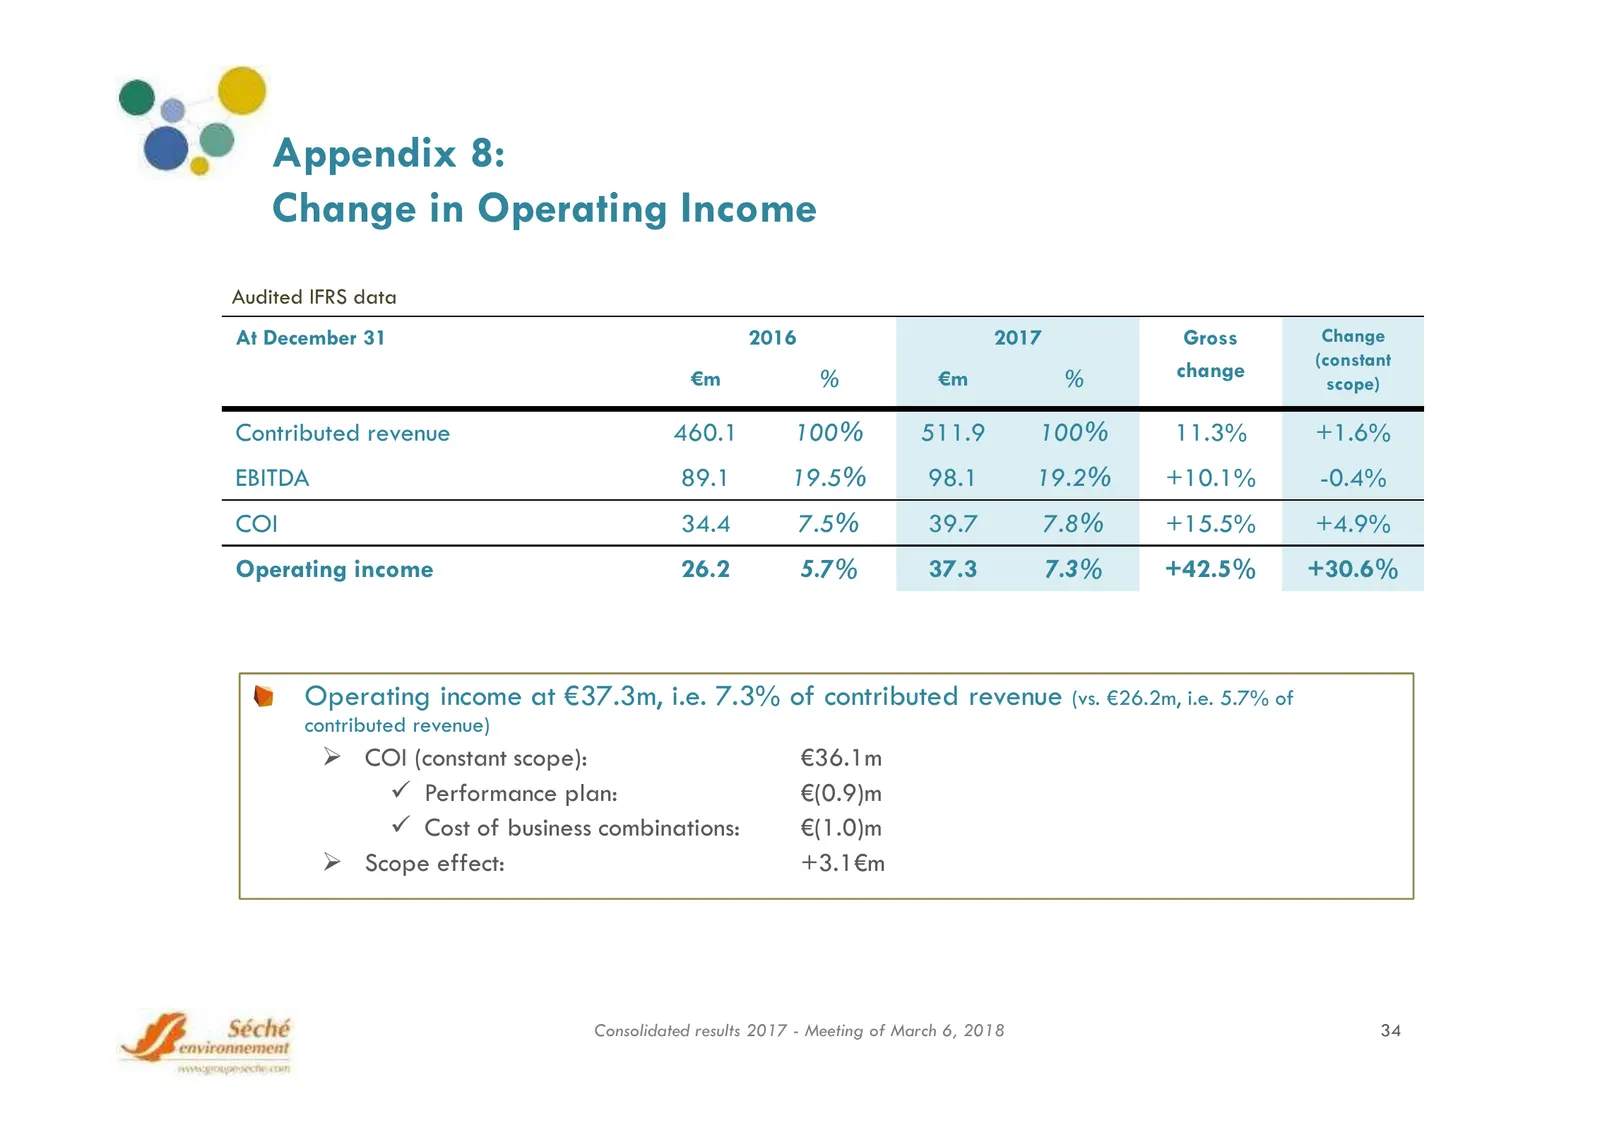
Slide 34: Appendix 8: Change in Operating Income
Appendix 8: Change in Operating Income Audited IFRS data At December 31 2016 2017 Gross Change (constant €m % €m % change scope) Contributed revenue 460.1 100% 511.9 100% 11.3% +1.6% EBITDA 89.1 19.5% 98.1 19.2% +10.1% -0.4% COI 34.4 7.5% 39.7 7.8% +15.5% +4.9% Operating income 26.2 5.7% 37.3 7.3% +
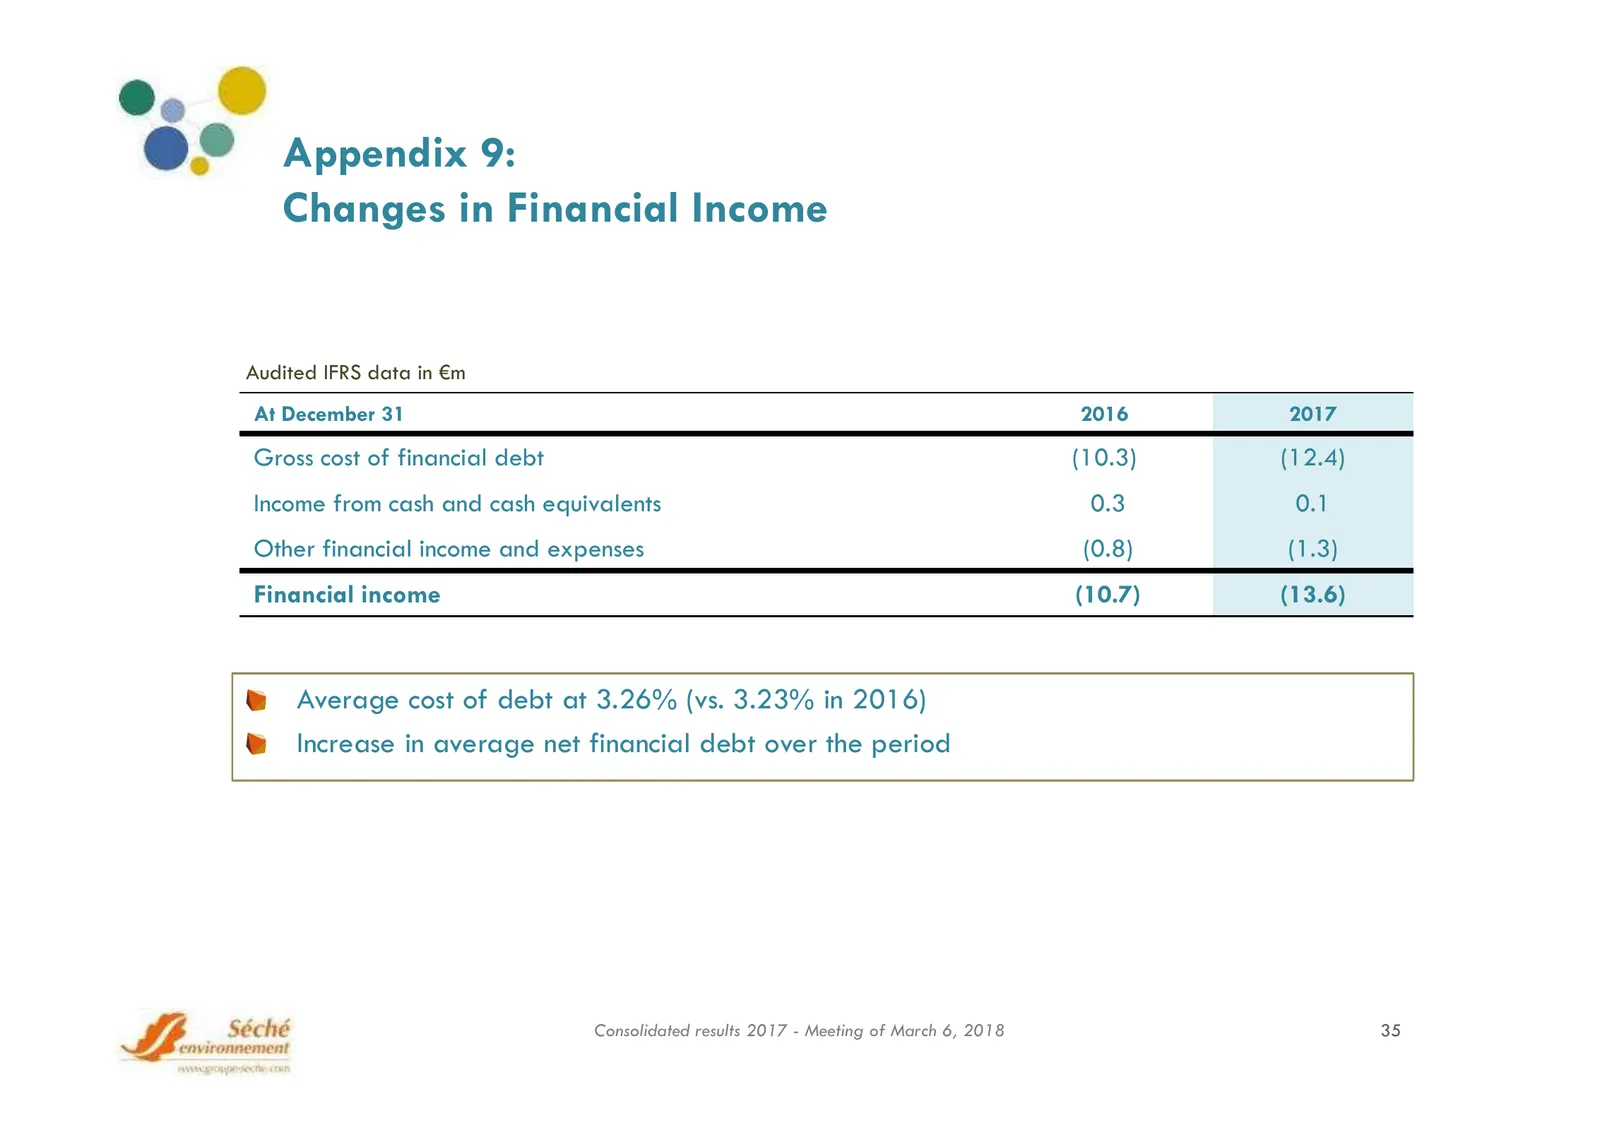
Slide 35: Appendix 9: Changes in Financial Income
Appendix 9: Changes in Financial Income Audited IFRS data in €m At December 31 2016 2017 Gross cost of financial debt (10.3) (12.4) Income from cash and cash equivalents 0.3 0.1 Other financial income and expenses (0.8) (1.3) Financial income (10.7) (13.6) Average cost of debt at 3.26% (vs. 3.23% in
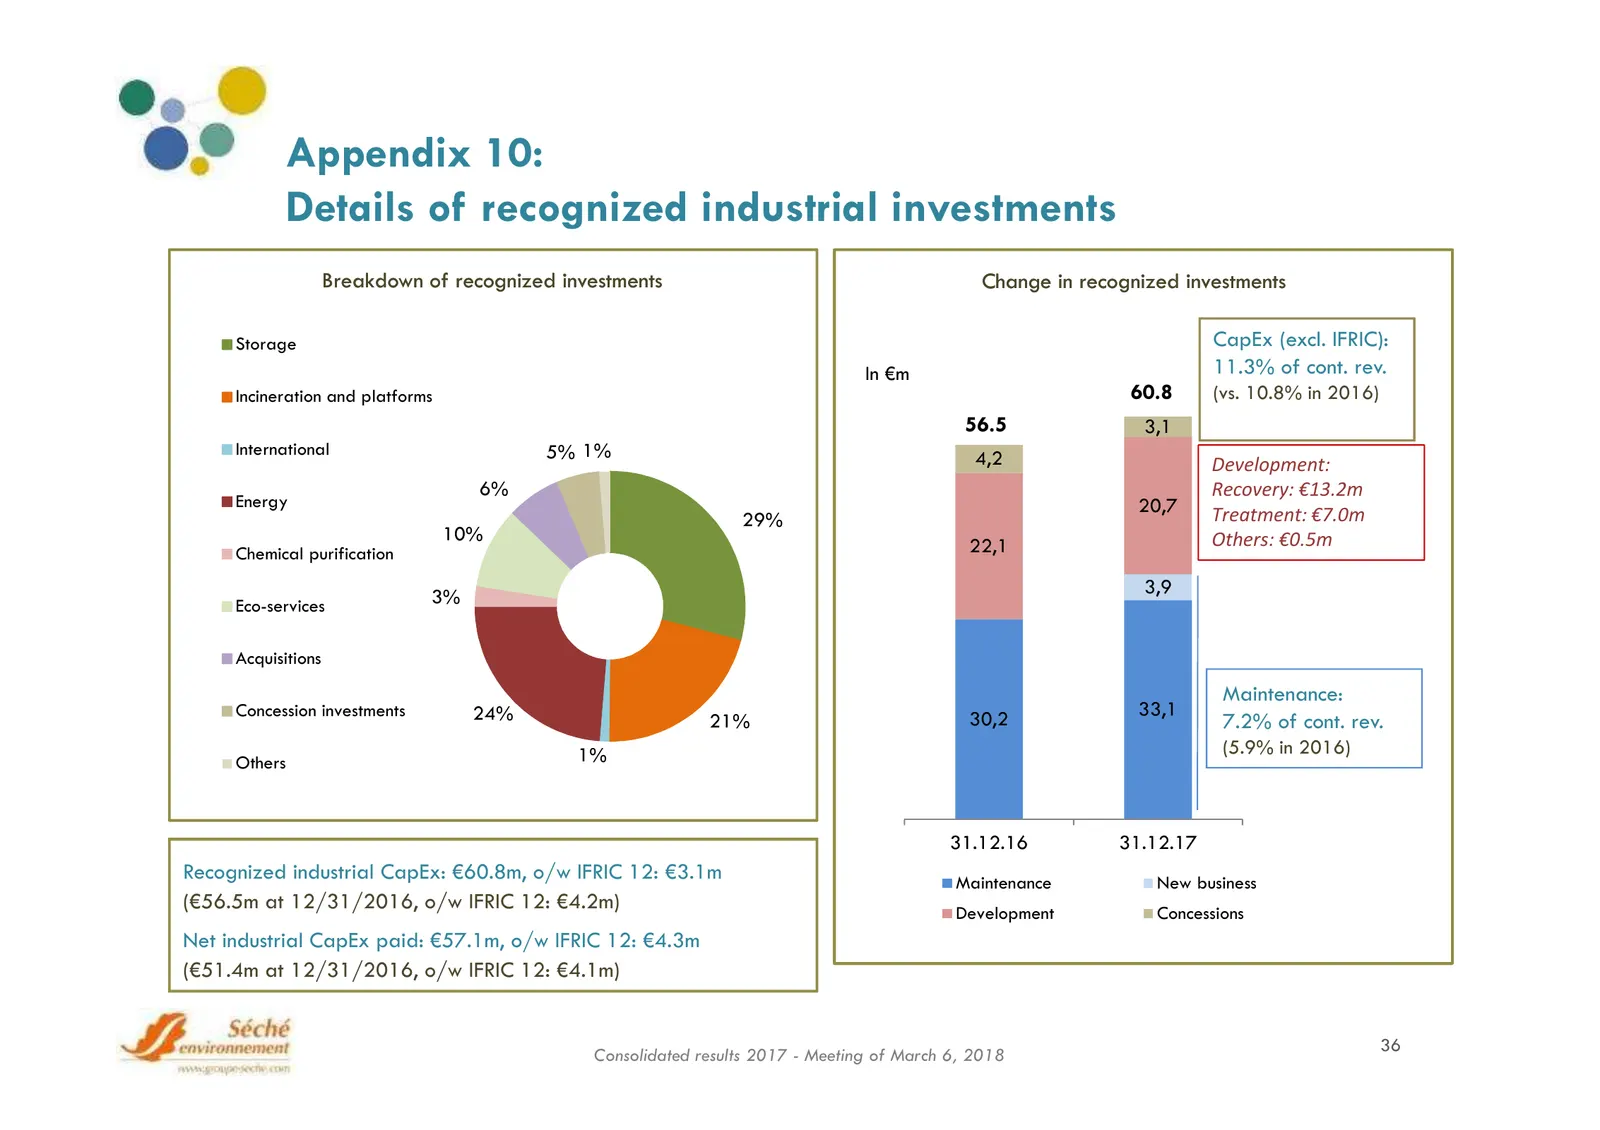
Slide 36: Appendix 10: Details of recognized industrial investments
Appendix 10: Details of recognized industrial investments Breakdown of recognized investments Change in recognized investments Storage CapEx (excl. IFRIC): In €m 11.3% of cont. rev. Incineration and platforms 60.8 (vs. 10.8% in 2016) 56.5 3,1 International 5% 1% 4,2 Development: 6% Recovery: €13.2m
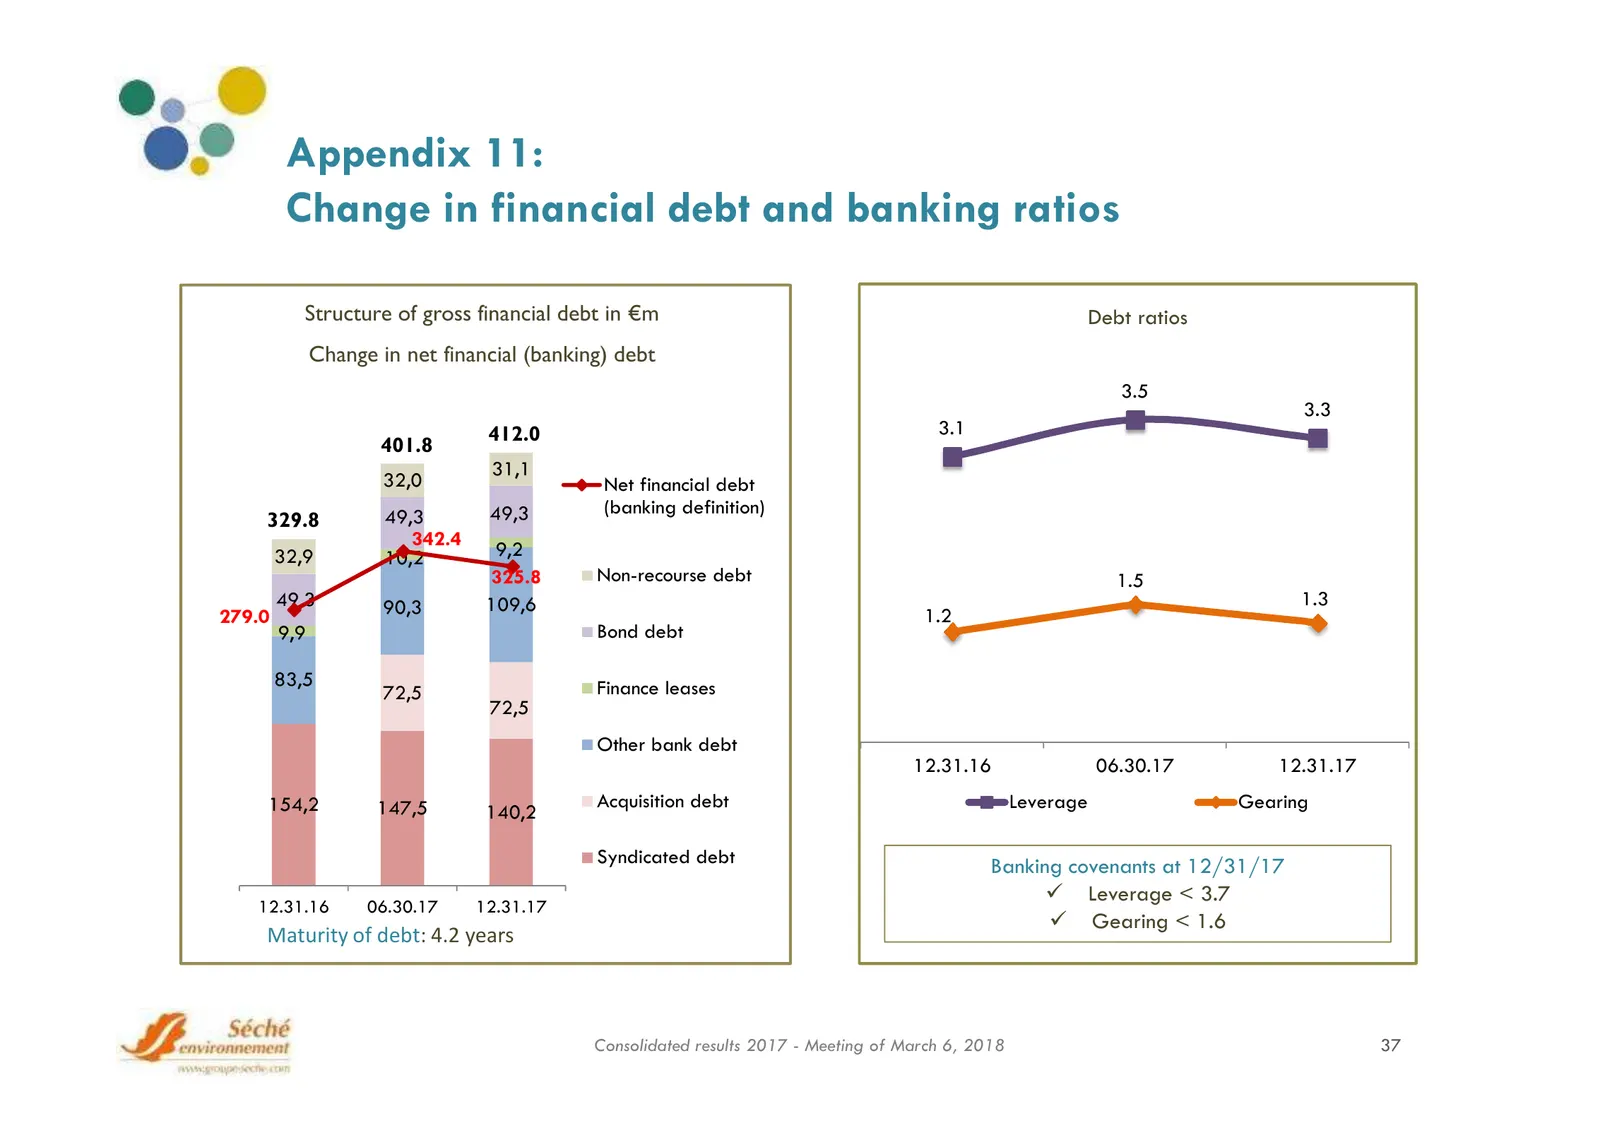
Slide 37: Appendix 11: Change in financial debt and banking ratios
Appendix 11: Change in financial debt and banking ratios Structure of gross financial debt in €m Debt ratios Change in net financial (banking) debt 3.5 3.3 412.0 3.1 401.8 31,1 32,0 Net financial debt 49,3 49,3 (banking definition) 329.8 342.4 32,9 10,2 9,2 325.8 Non-recourse debt 1.5 49,3 90,3 109,
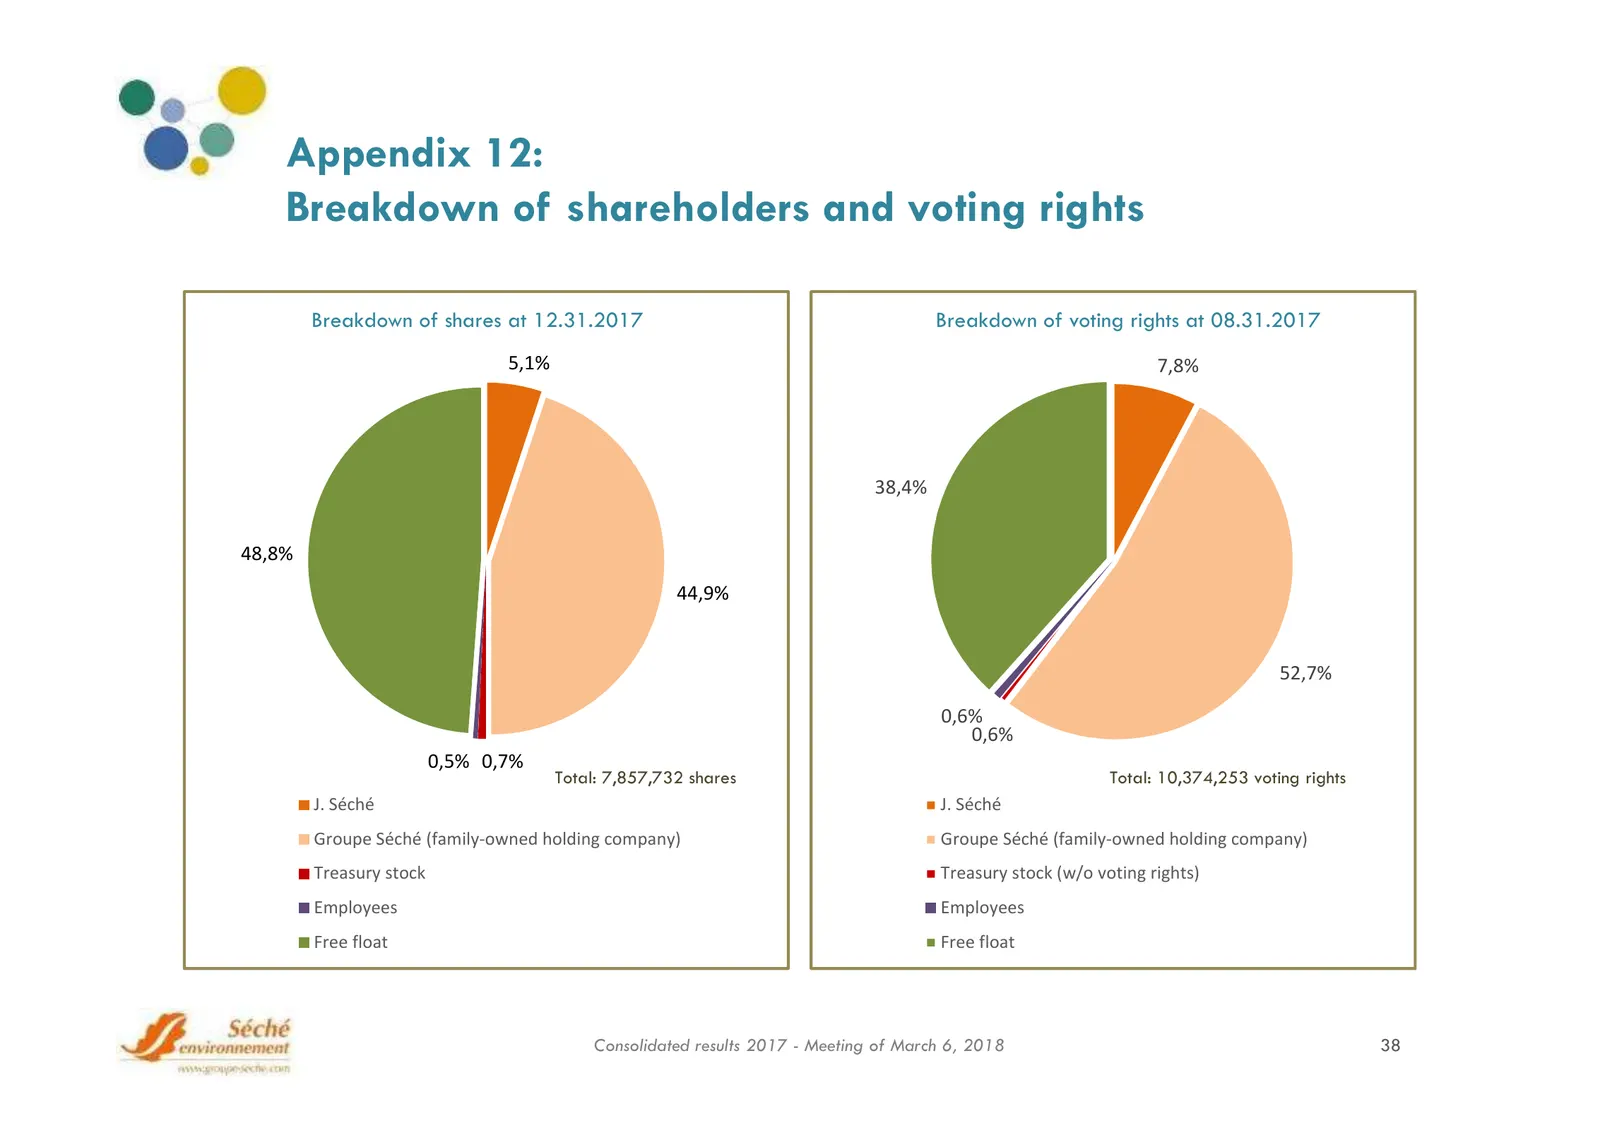
Slide 38: Appendix 12: Breakdown of shareholders and voting rights
Appendix 12: Breakdown of shareholders and voting rights Breakdown of shares at 12.31.2017 Breakdown of voting rights at 08.31.2017 5,1% 7,8% 38,4% 48,8% 44,9% 52,7% 0,6% 0,6% 0,5% 0,7% Total: 7,857,732 shares Total: 10,374,253 voting rights J. Séché J. Séché Groupe Séché (family-owned holding compa
Source: Internet Archive copy of groupe-seche.com
More decks from Seche Environnement SA
 Groupe Séché Environnement — Q3 2026 Earnings Presentation13 slides · Oct 27, 2026
 H1 2026 Earnings Presentation34 slides · Sep 9, 2026
 H1 2026 Earnings Presentation34 slides · Sep 9, 2026
 Q1 2026 Earnings Presentation10 slides · Apr 23, 2026
 FY2025 Earnings Presentation43 slides · Mar 10, 2026
 Q3 2025 Earnings Presentation13 slides · Oct 28, 2025