Fairmount Santrol Holdings Inc
Fairmount Santrol — Investor Presentation (March 2017)
26 slides from Fairmount Santrol's investor presentation, Mar 21, 2017
Slide 1: Investor Presentation
Exhibit 99.1 Investor Presentation MARCH 2017
Slide 2: Forward-Looking Statements
Forward-Looking Statements FORWARD LOOKING INFORMATION This presentation contains forward-looking statements. These statements can be identified by the use of forward-looking terminology including “will,” “may,” “believe,” “expect,” “anticipate,” “estimate,” “continue,” or other similar words. These
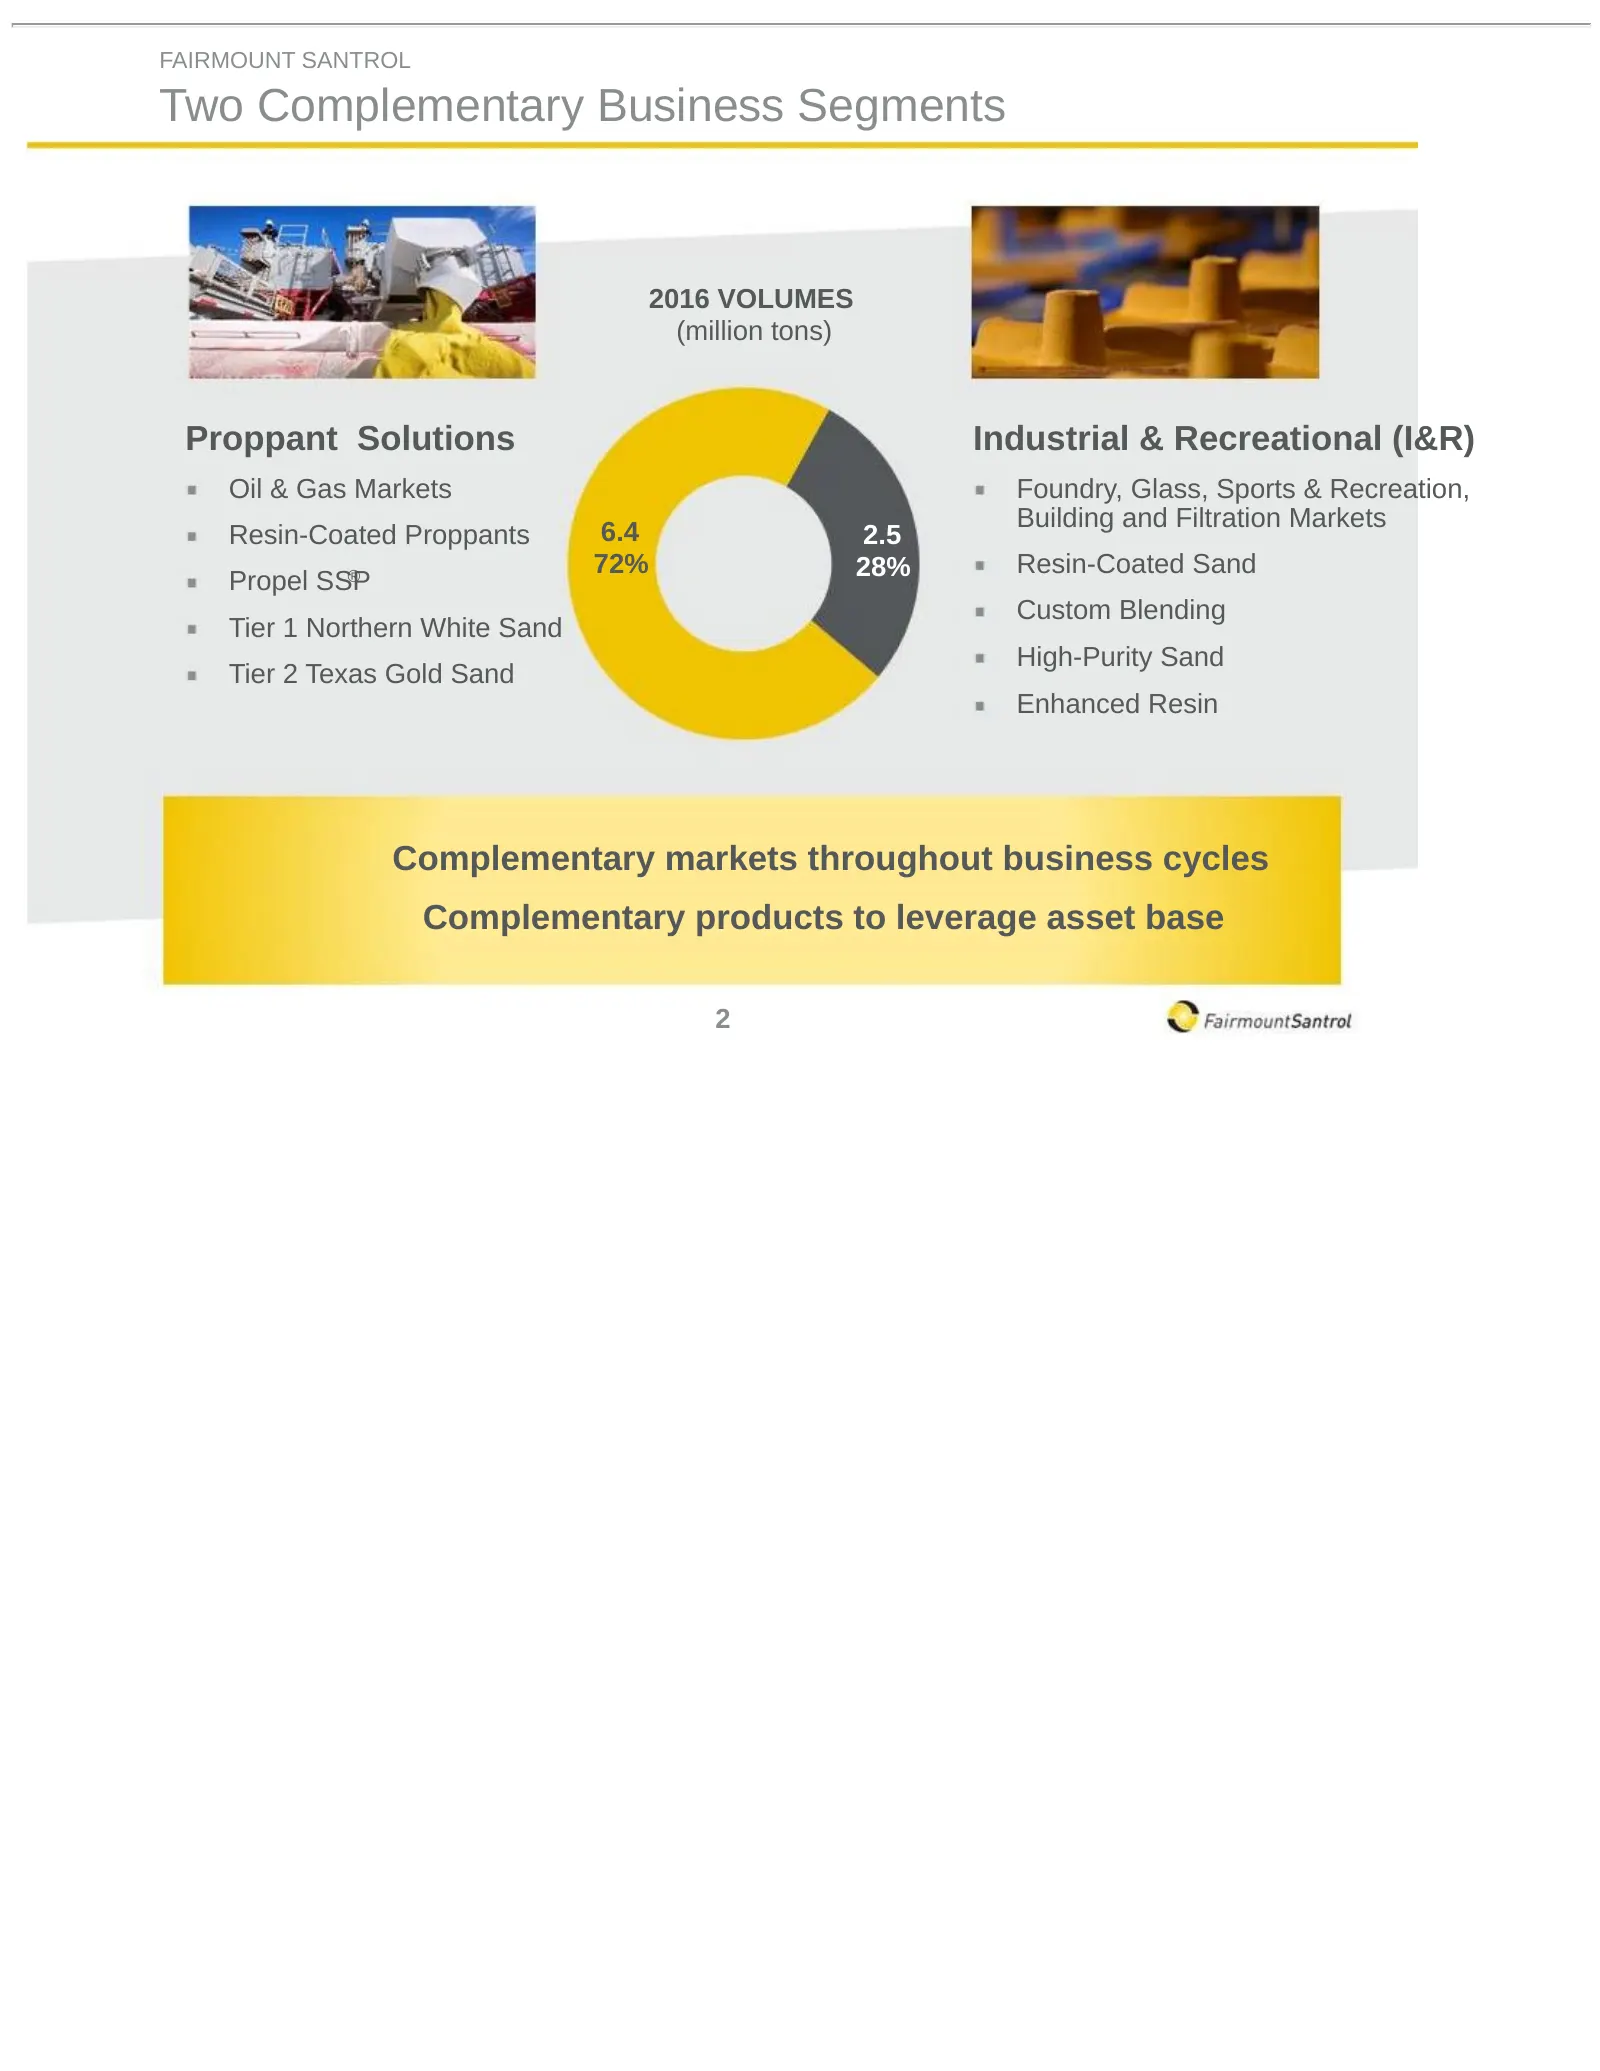
Slide 3: Two Complementary Business Segments
FAIRMOUNT SANTROL Two Complementary Business Segments 2016 VOLUMES (million tons) Proppant Solutions Industrial & Recreational (I&R) Oil & Gas Markets Foundry, Glass, Sports & Recreation, Building and Filtration Markets Resin-Coated Proppants 6.4 2.5 72% 28% Resin-Coated Sand Propel SSP ® Custom Ble
Slide 4: Core Differentiators for Long-Term Value Creation
Core Differentiators for Long-Term Value Creation
Slide 5: Core Differentiators for Long-Term Value Creation
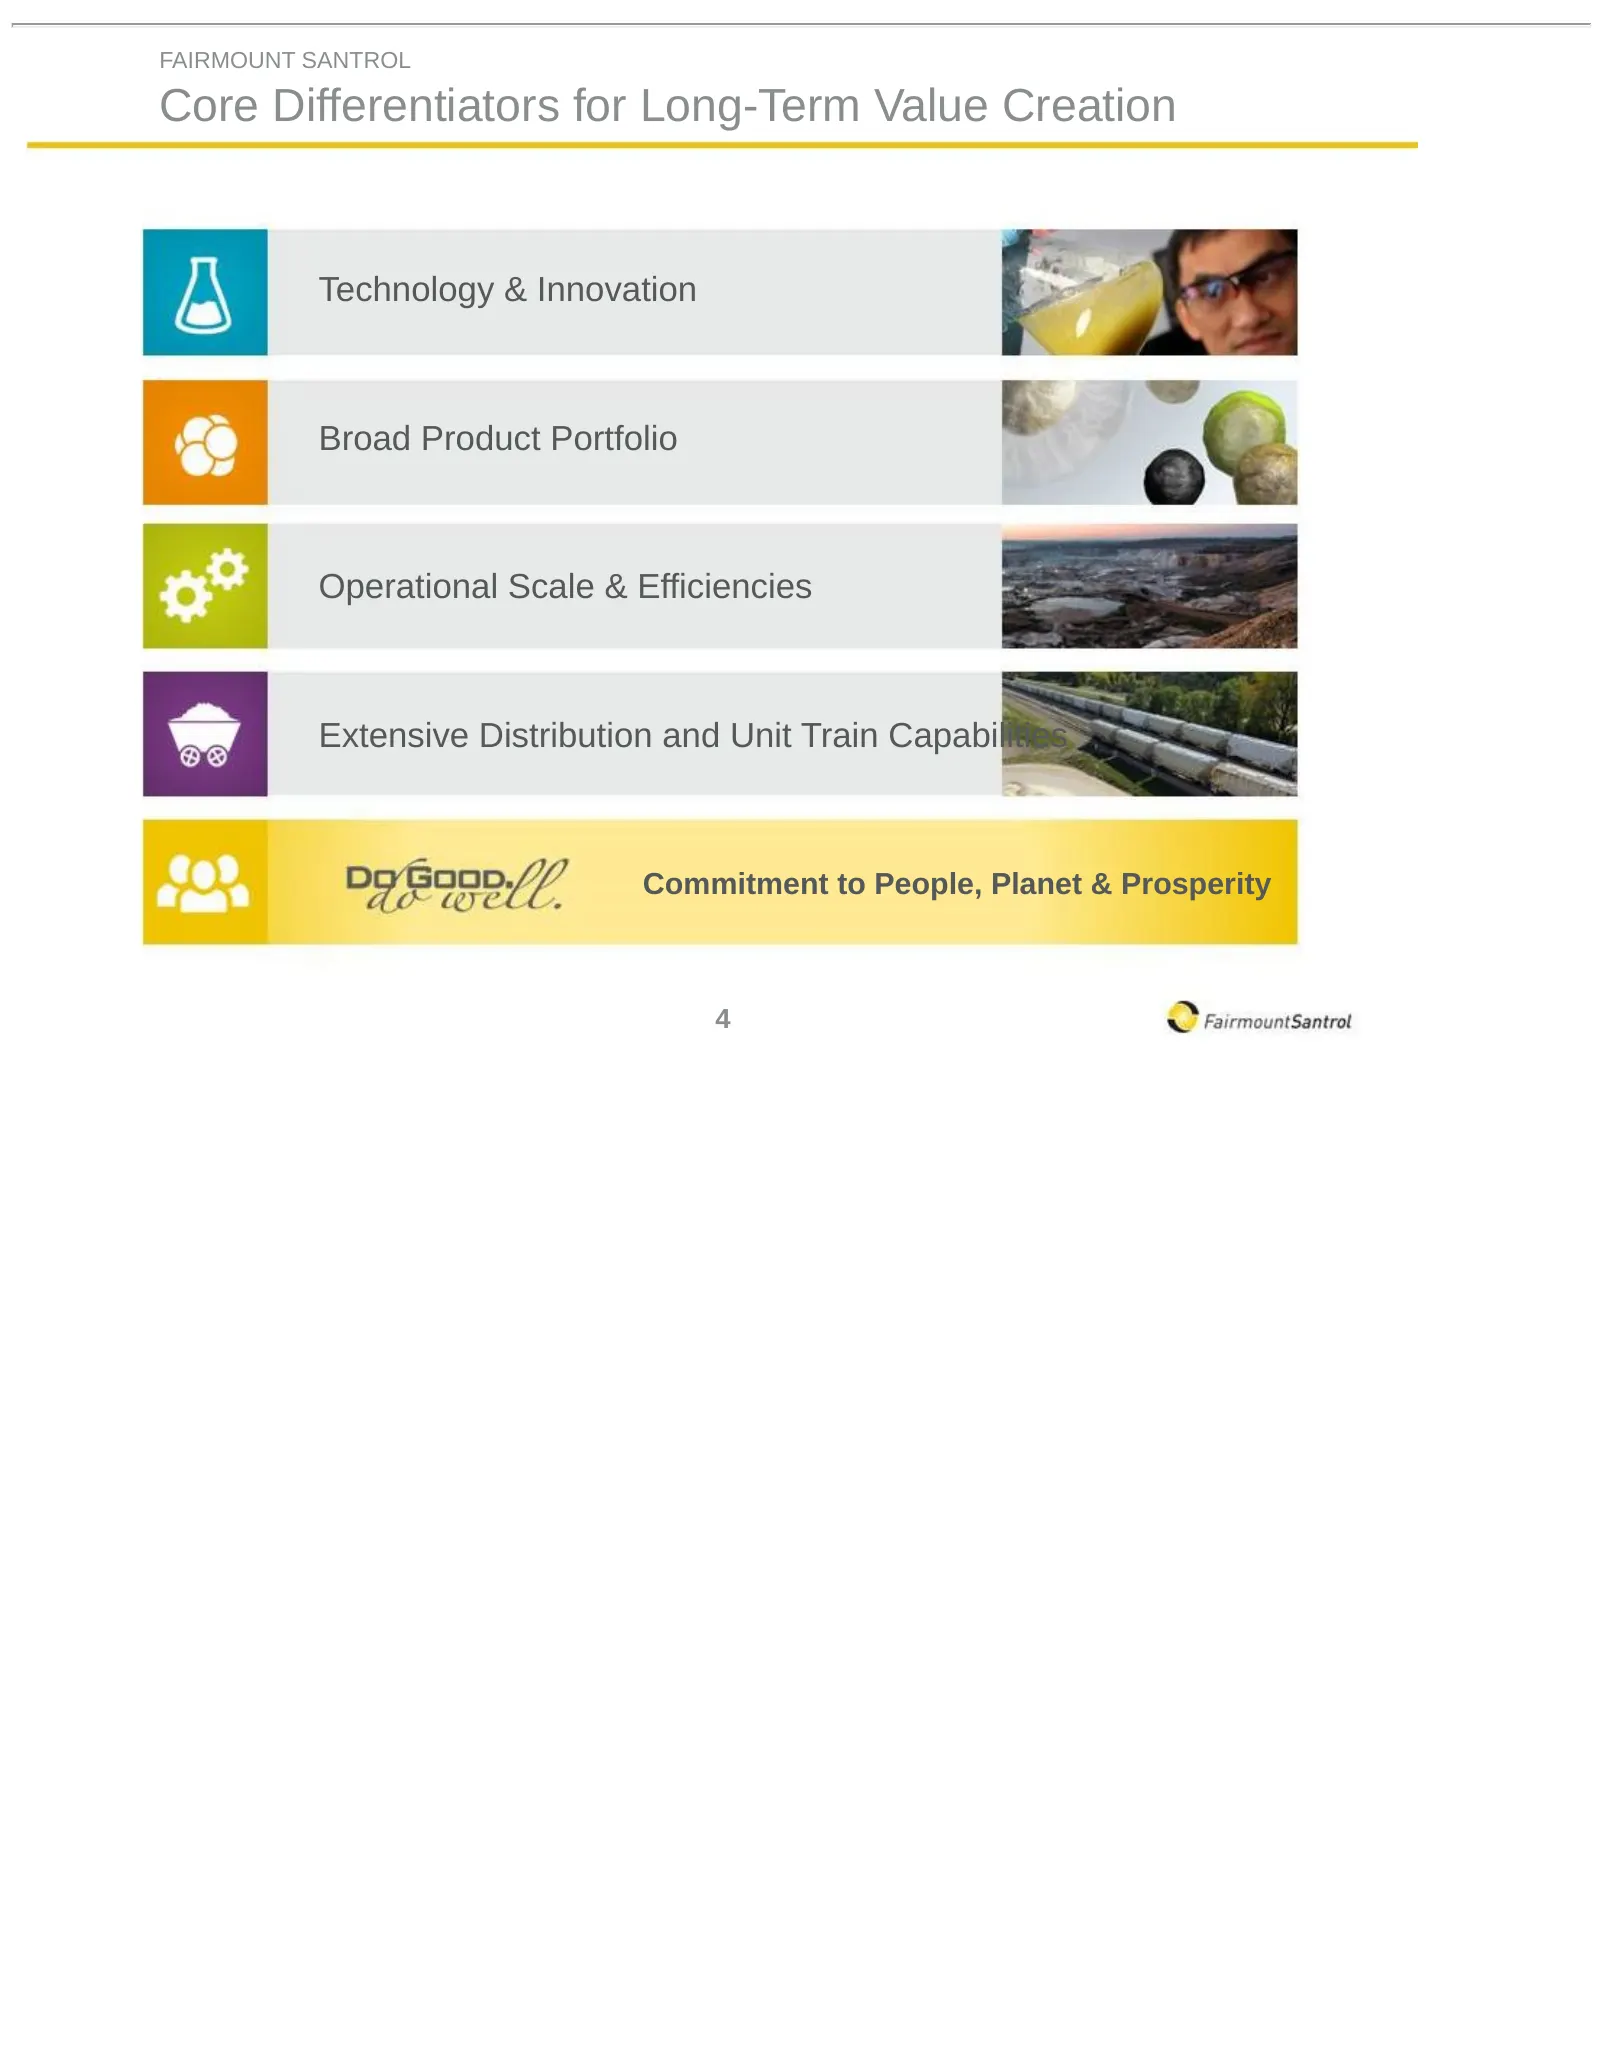
FAIRMOUNT SANTROL Core Differentiators for Long-Term Value Creation Technology & Innovation Broad Product Portfolio Operational Scale & Efficiencies Extensive Distribution and Unit Train Capabilities Commitment to People, Planet & Prosperity 4
Slide 6: "Staying True" to All Pillars of Sustainable Development
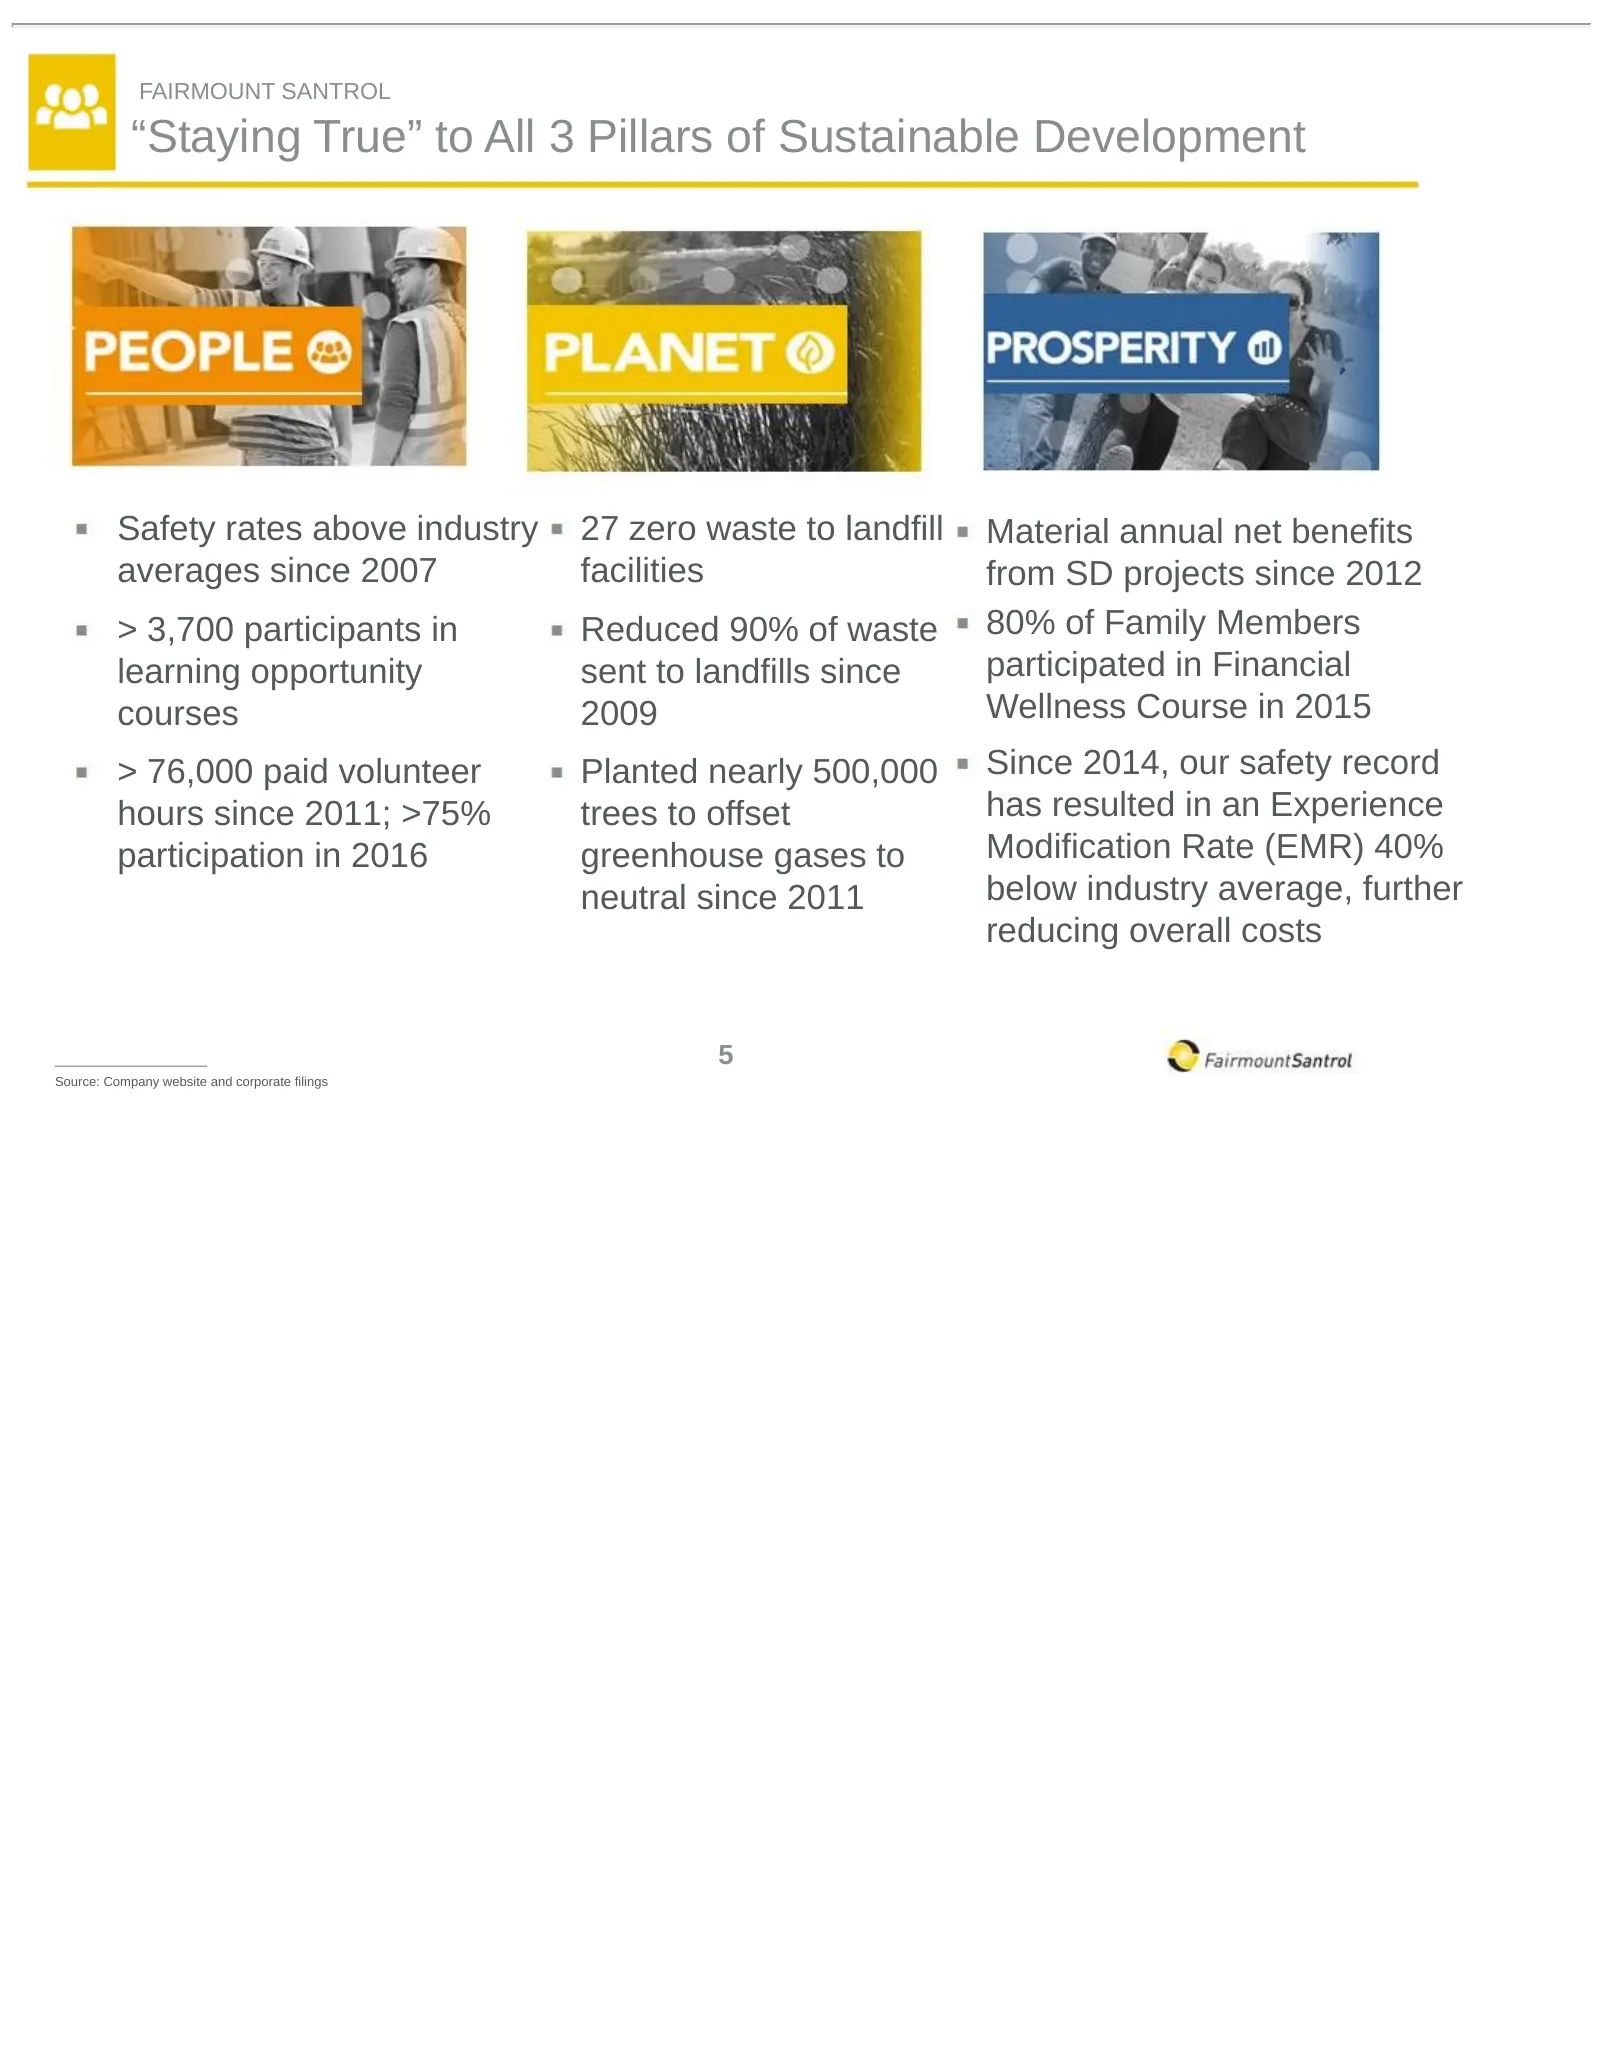
FAIRMOUNT SANTROL “Staying True” to All 3 Pillars of Sustainable Development Safety rates above industry 27 zero waste to landfill Material annual net benefits averages since 2007 facilities from SD projects since 2012 > 3,700 participants in Reduced 90% of waste 80% of Family Members learning oppor
Slide 7: Innovation Throughout Our Organization
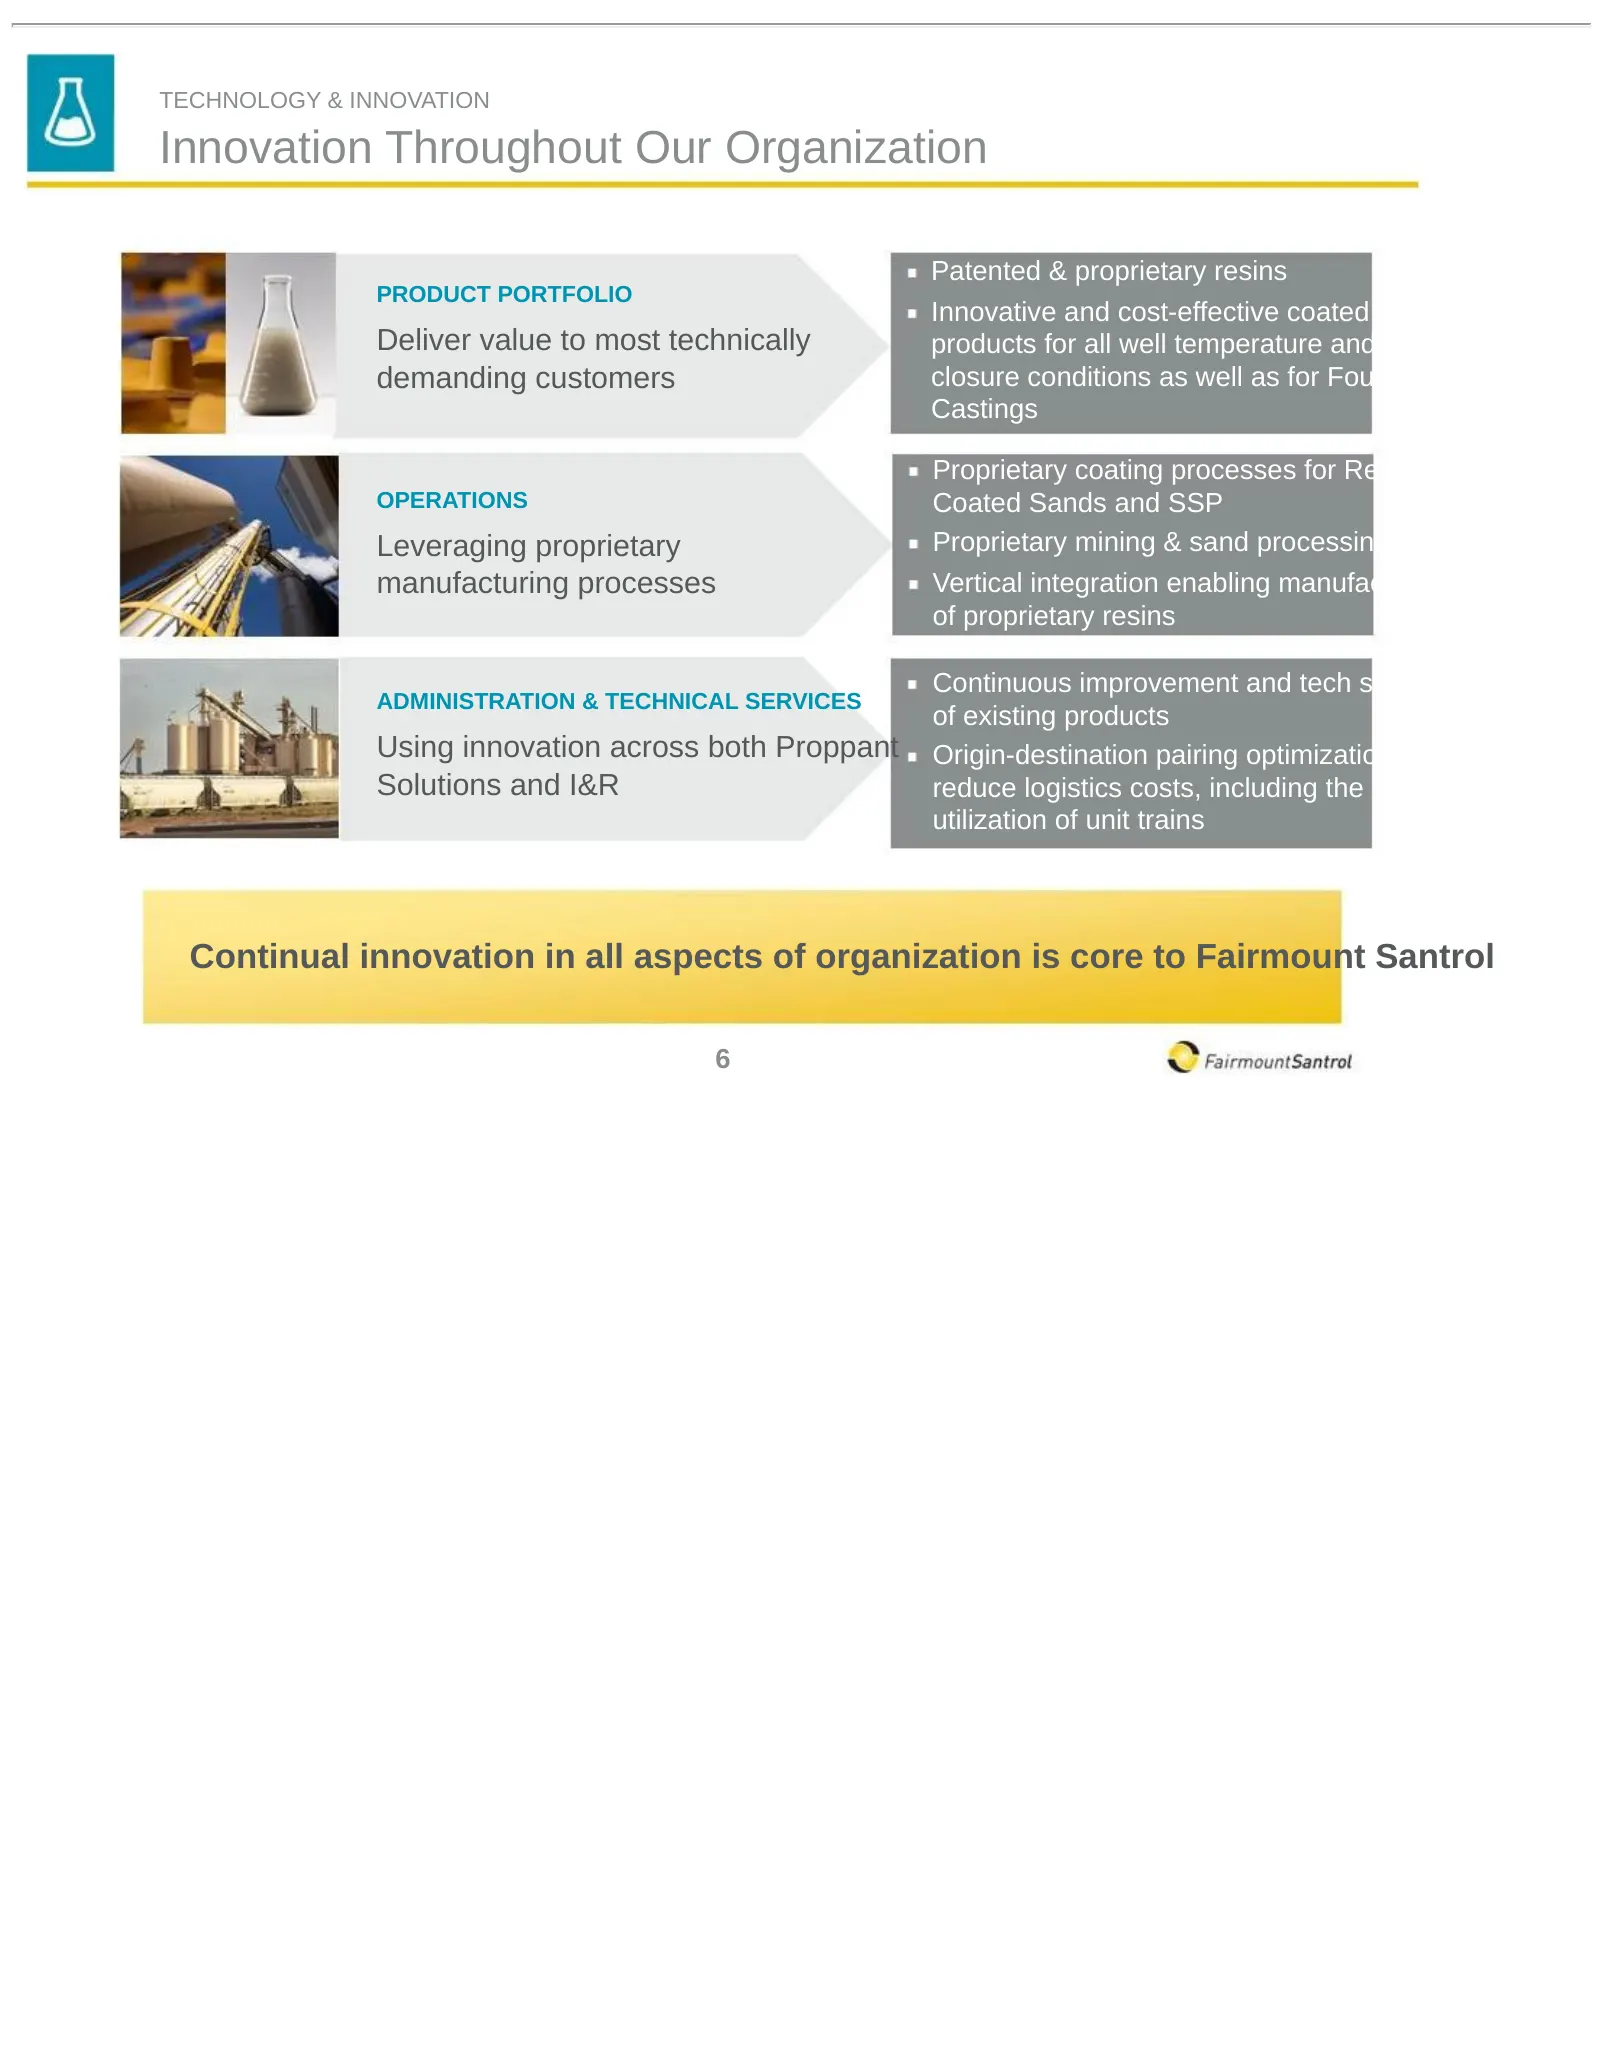
TECHNOLOGY & INNOVATION Innovation Throughout Our Organization Patented & proprietary resins PRODUCT PORTFOLIO Innovative and cost-effective coated Deliver value to most technically products for all well temperature and demanding customers closure conditions as well as for Foundry Castings Proprieta
Slide 8: Propel SSP – Enhanced Productivity Driven by Design Optimization
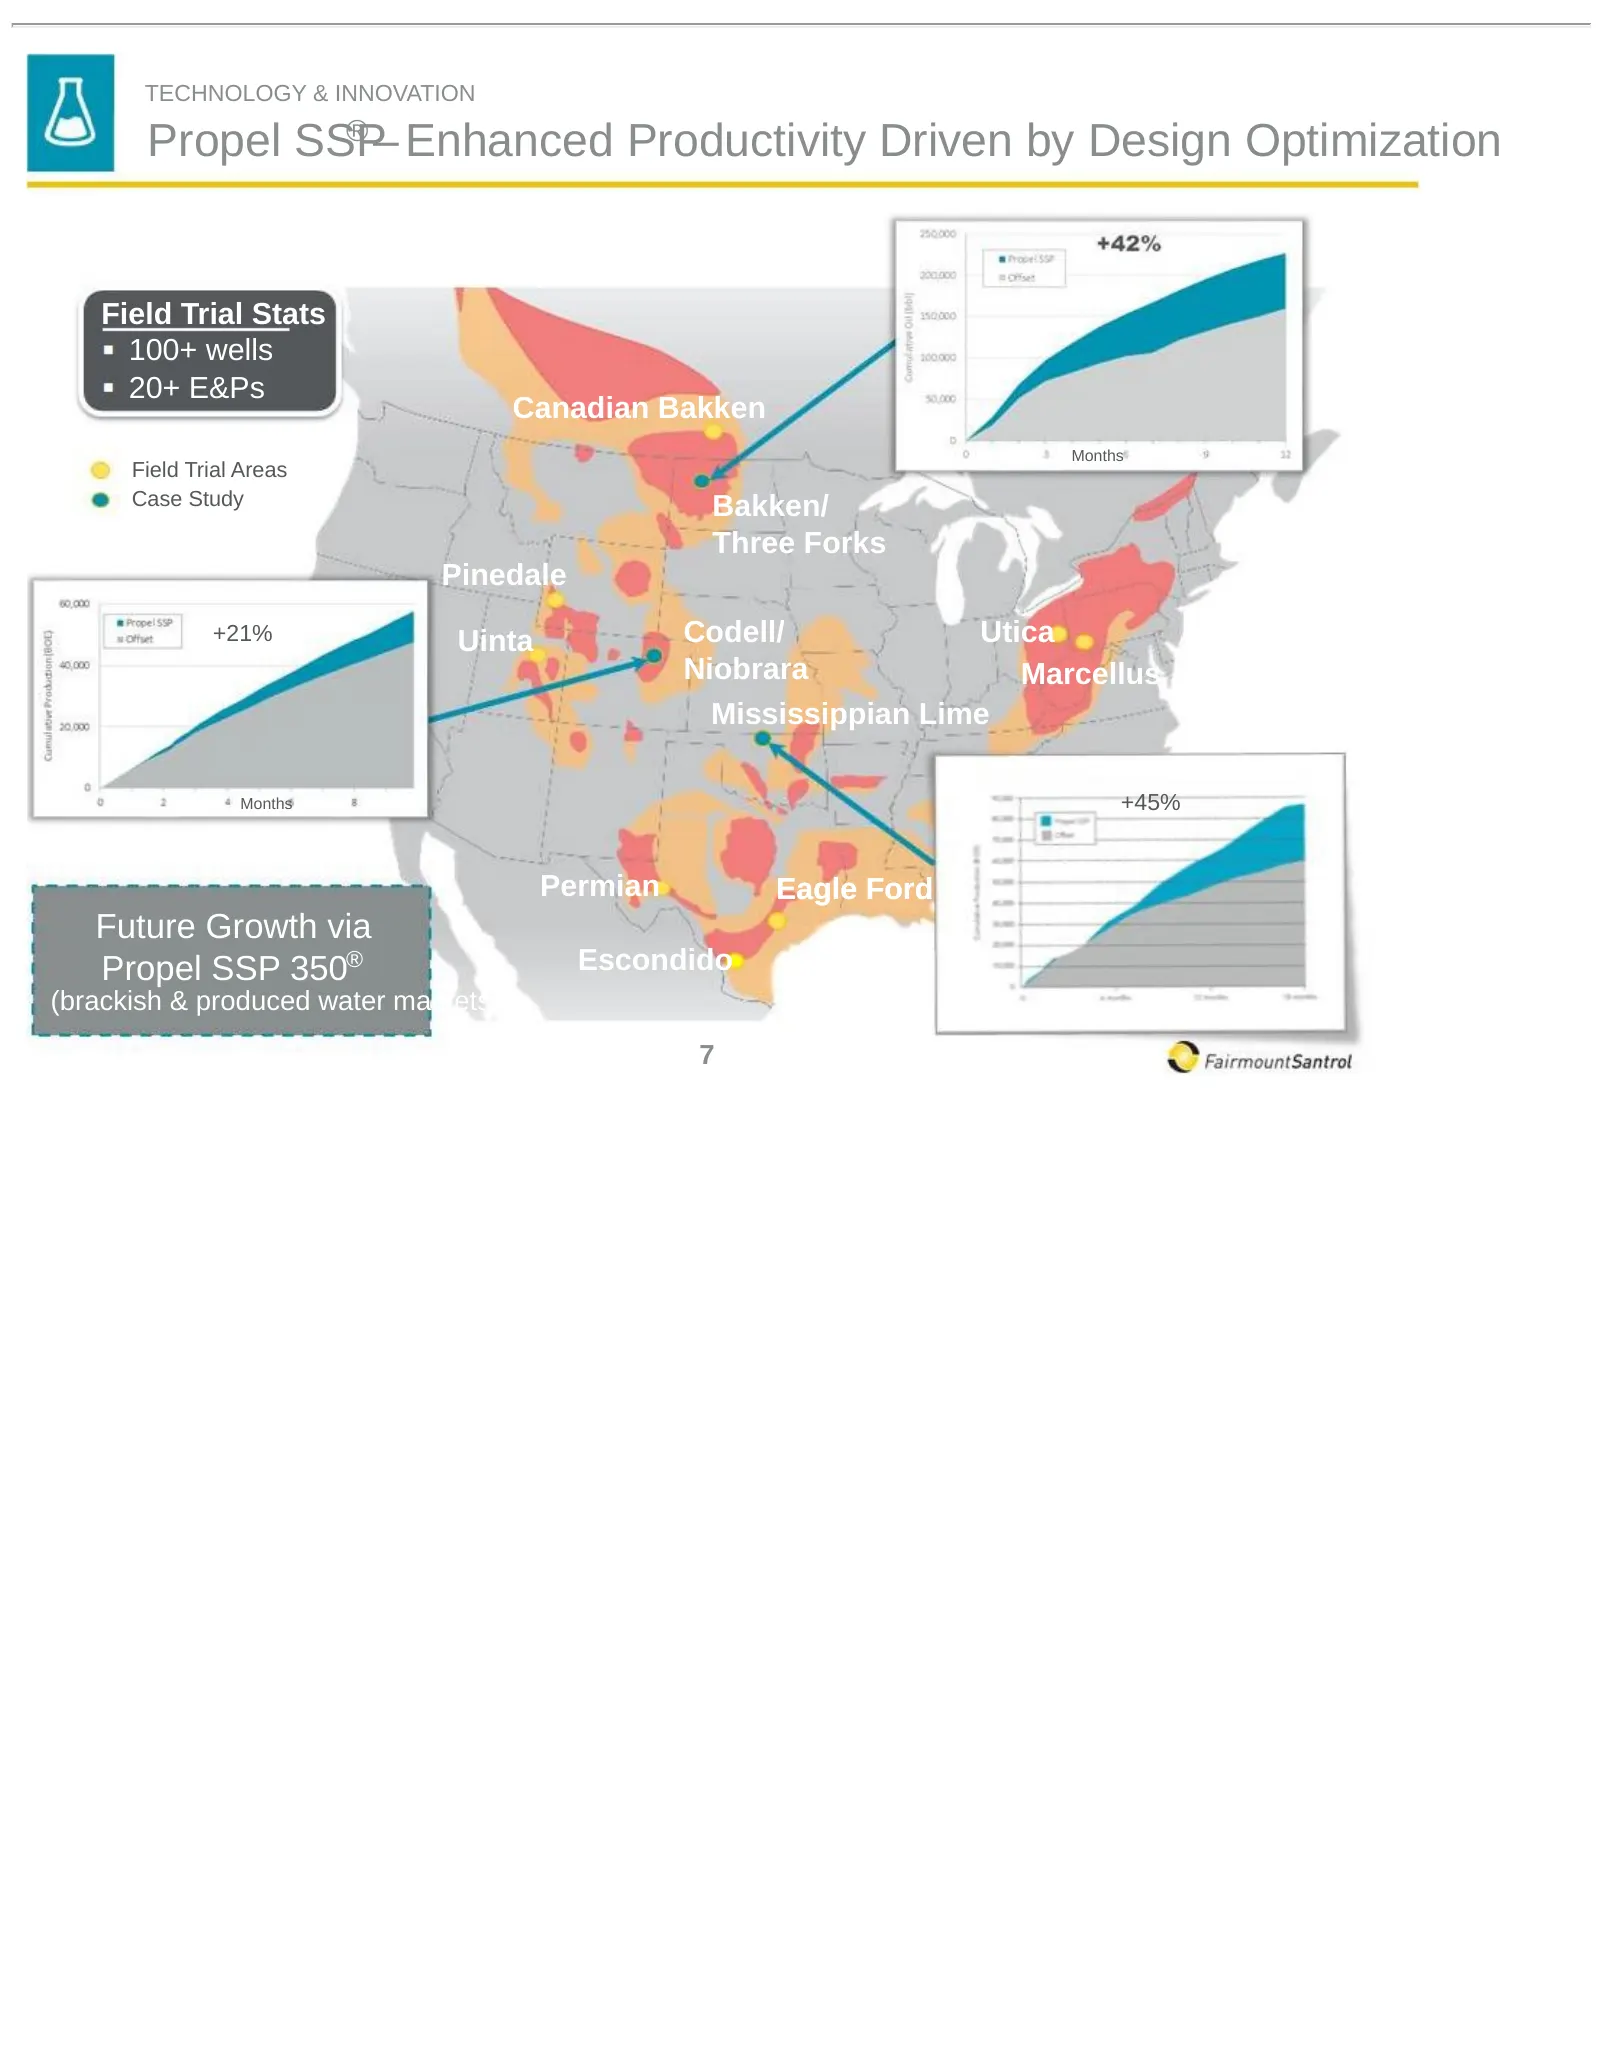
TECHNOLOGY & INNOVATION ® – Enhanced Productivity Driven by Design Optimization Propel SSP Field Trial Stats 100+ wells 20+ E&Ps Canadian Bakken Months Field Trial Areas Case Study Bakken/ Three Forks Pinedale +21% Uinta Codell/ Utica Niobrara Marcellus Mississippian Lime Months +45% Permian Eagle F
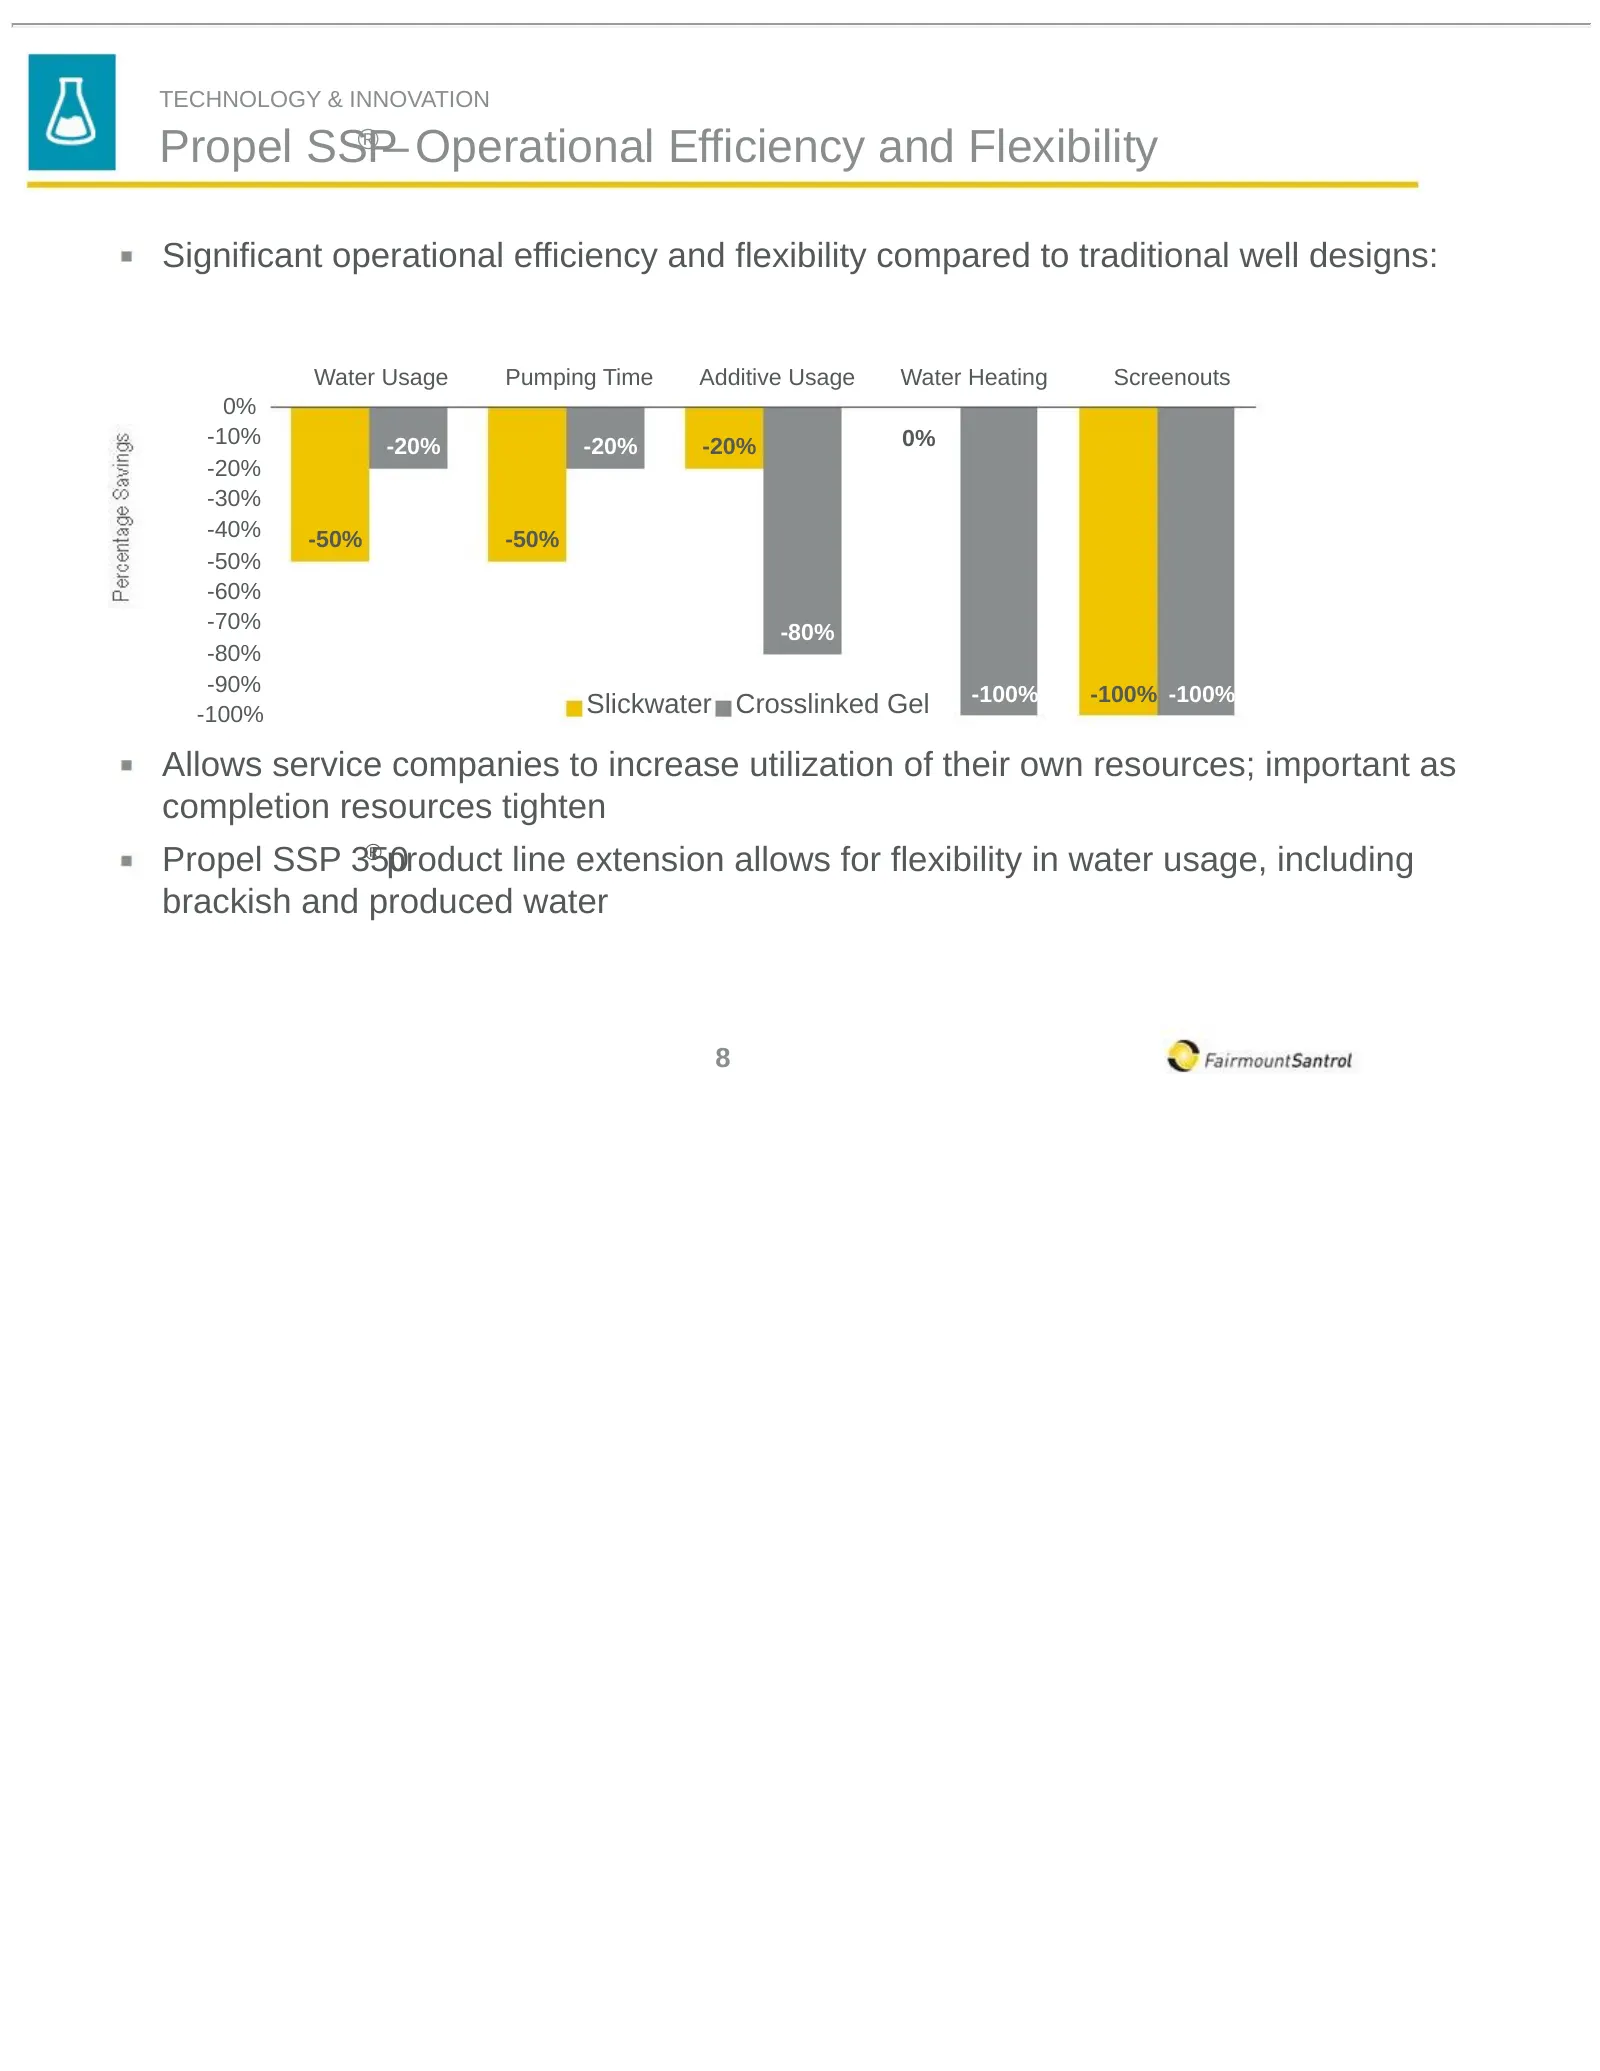
Slide 9: Propel SSP – Operational Efficiency and Flexibility
TECHNOLOGY & INNOVATION Propel SSP ® – Operational Efficiency and Flexibility Significant operational efficiency and flexibility compared to traditional well designs: Water Usage Pumping Time Additive Usage Water Heating Screenouts 0% -10% -20% -20% -20% 0% -20% -30% -40% -50% -50% -50% -60% -70% -8
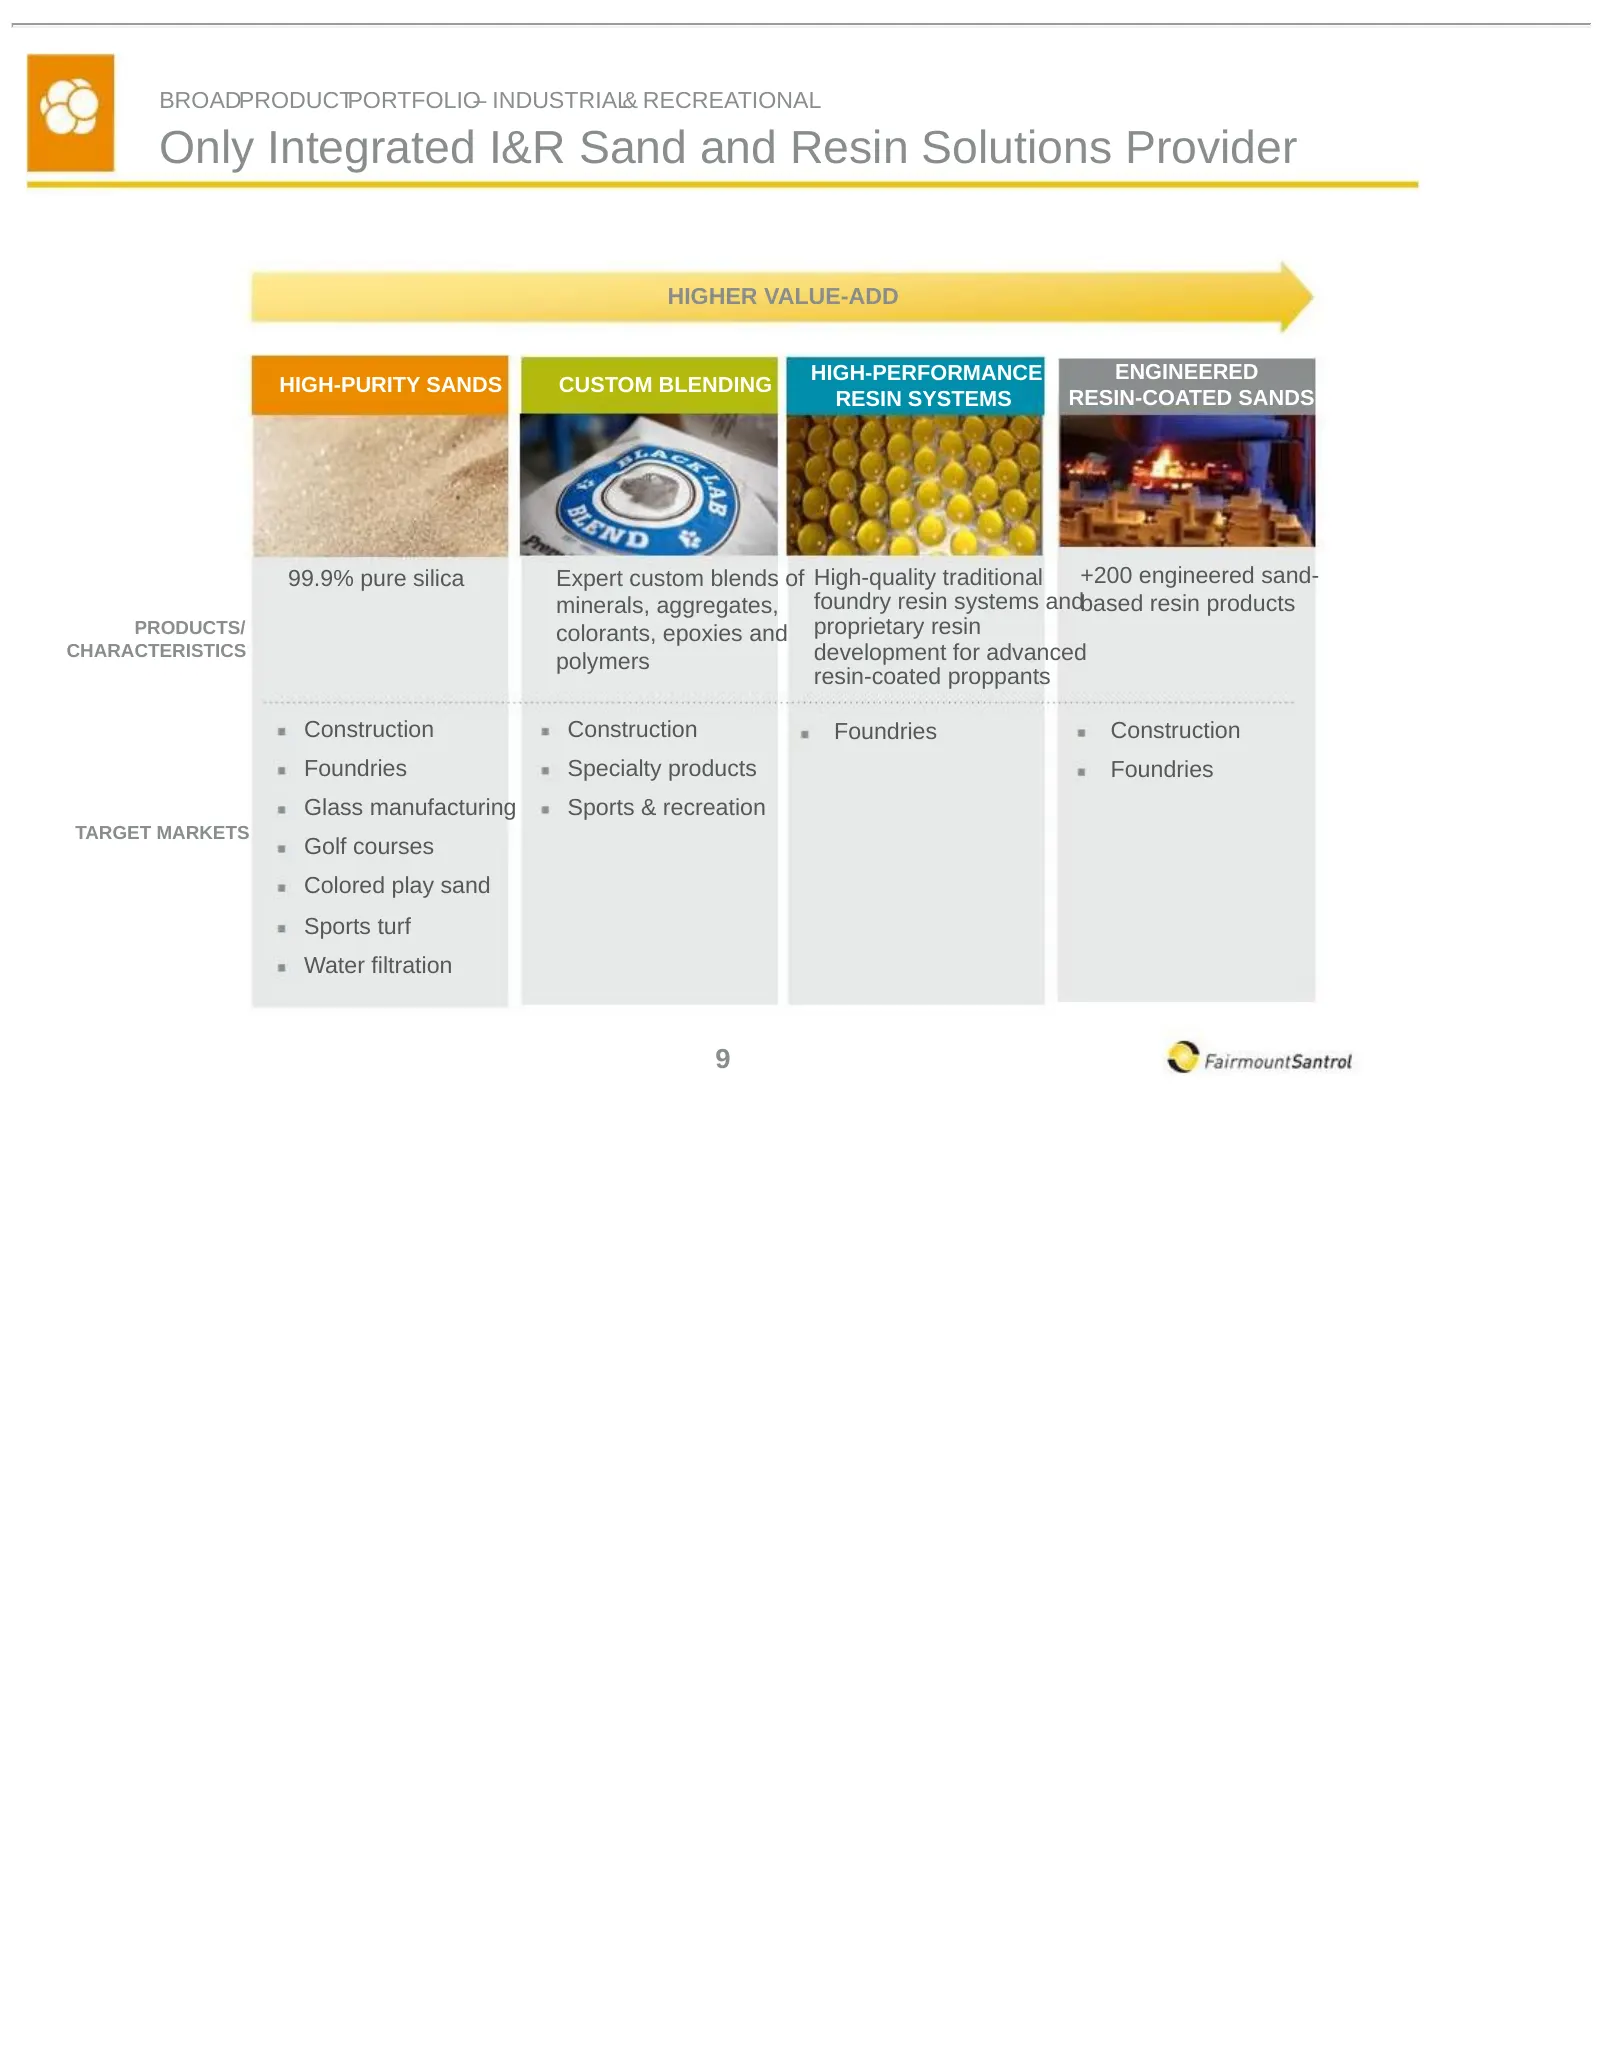
Slide 10: Only Integrated I&R Sand and Resin Solutions Provider
BROADPRODUCTPORTFOLIO– INDUSTRIAL& RECREATIONAL Only Integrated I&R Sand and Resin Solutions Provider HIGHER VALUE-ADD HIGH-PERFORMANCE ENGINEERED HIGH-PURITY SANDS CUSTOM BLENDING RESIN SYSTEMS RESIN-COATED SANDS 99.9% pure silica Expert custom blends of High-quality traditional +200 engineered san
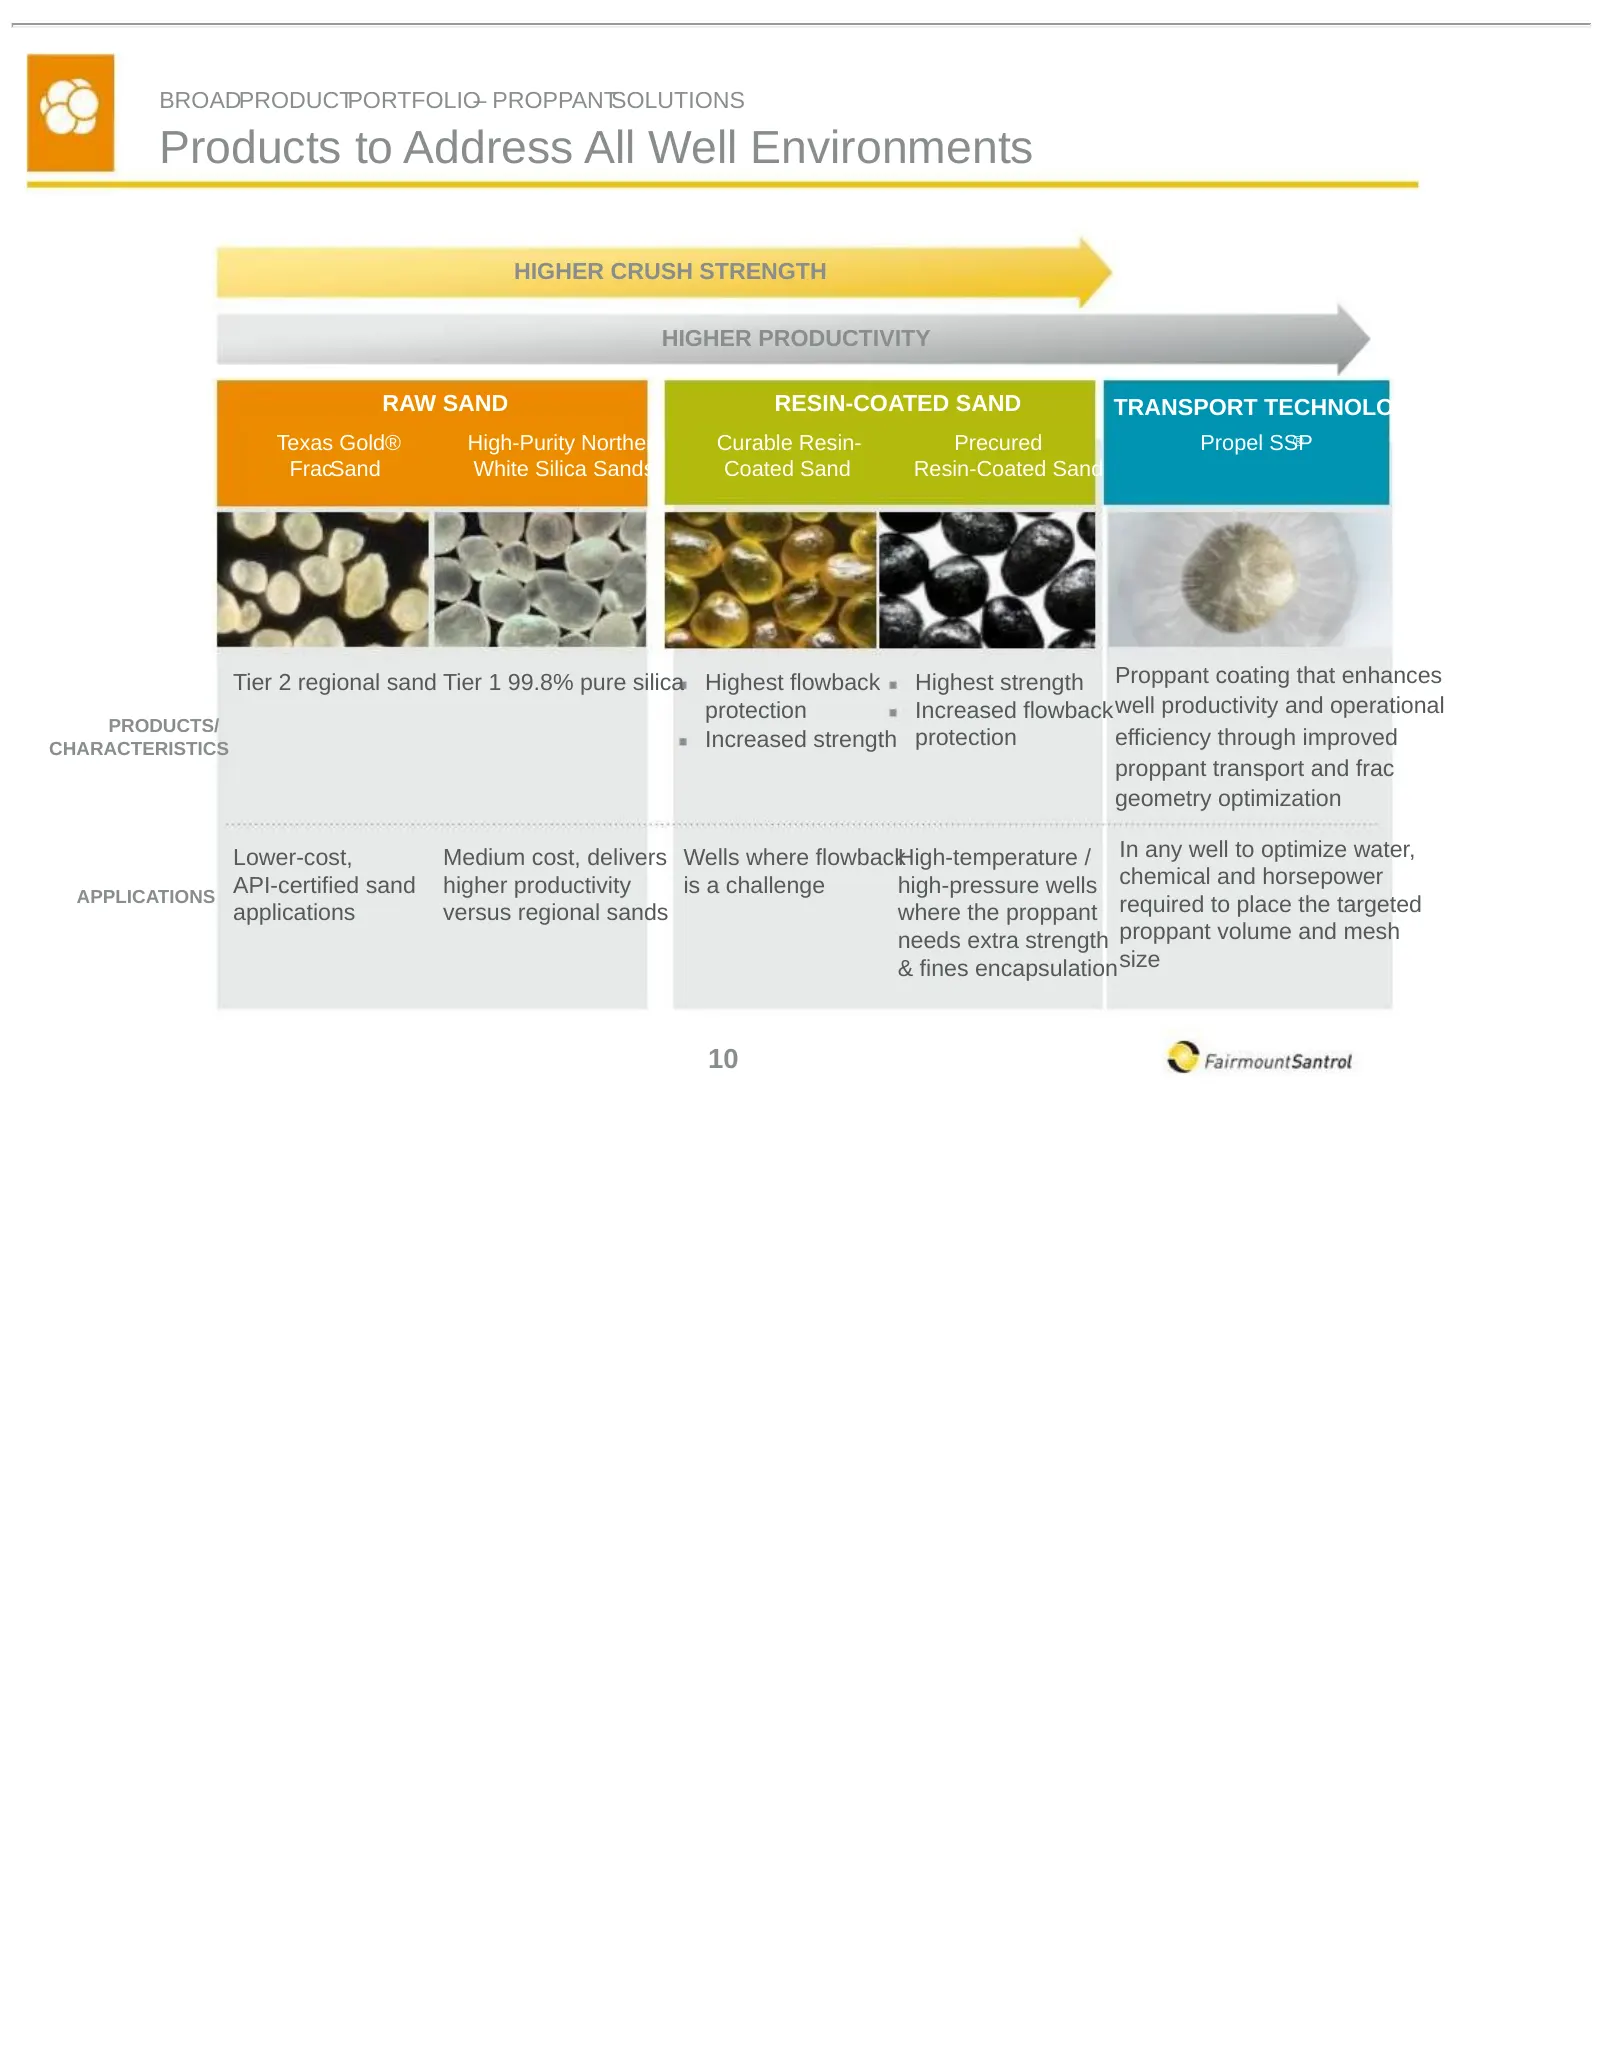
Slide 11: Products to Address All Well Environments
BROADPRODUCTPORTFOLIO– PROPPANTSOLUTIONS Products to Address All Well Environments HIGHER CRUSH STRENGTH HIGHER PRODUCTIVITY RAW SAND RESIN-COATED SAND TRANSPORT TECHNOLOGY Texas Gold® High-Purity Northern Curable Resin- Precured Propel SSP ® FracSand White Silica Sands Coated Sand Resin-Coated Sand
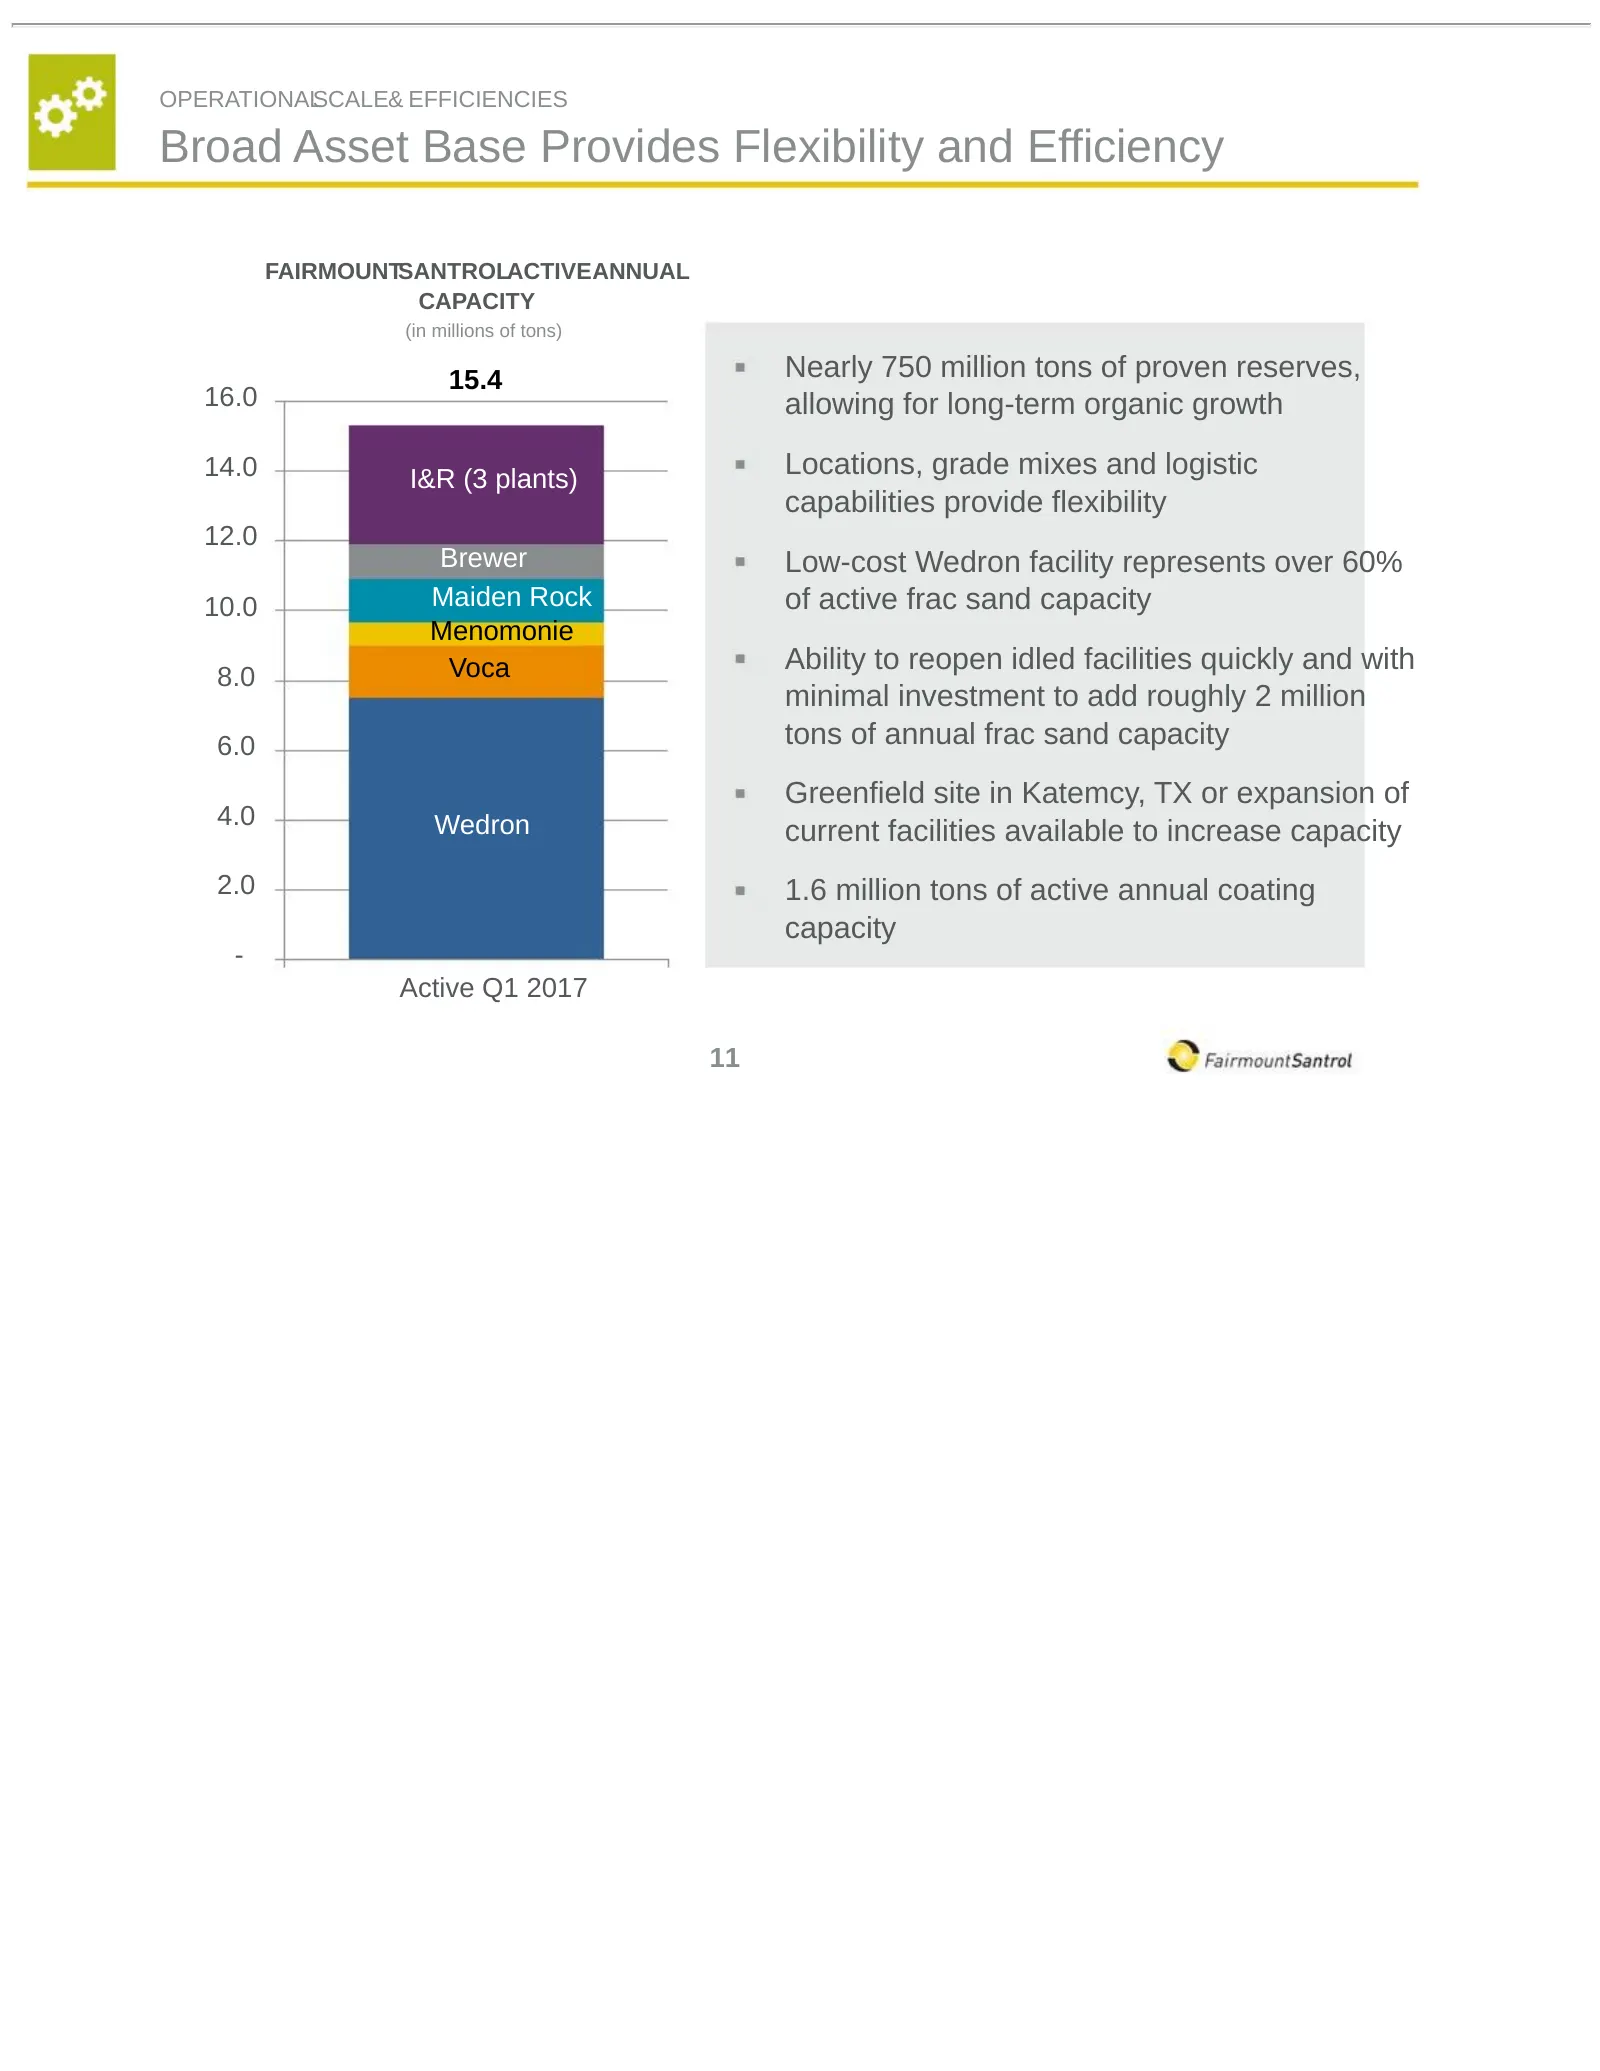
Slide 12: Broad Asset Base Provides Flexibility and Efficiency
OPERATIONALSCALE& EFFICIENCIES Broad Asset Base Provides Flexibility and Efficiency FAIRMOUNTSANTROLACTIVEANNUAL CAPACITY (in millions of tons) 15.4 Nearly 750 million tons of proven reserves, 16.0 allowing for long-term organic growth 14.0 I&R (3 plants) Locations, grade mixes and logistic capabili
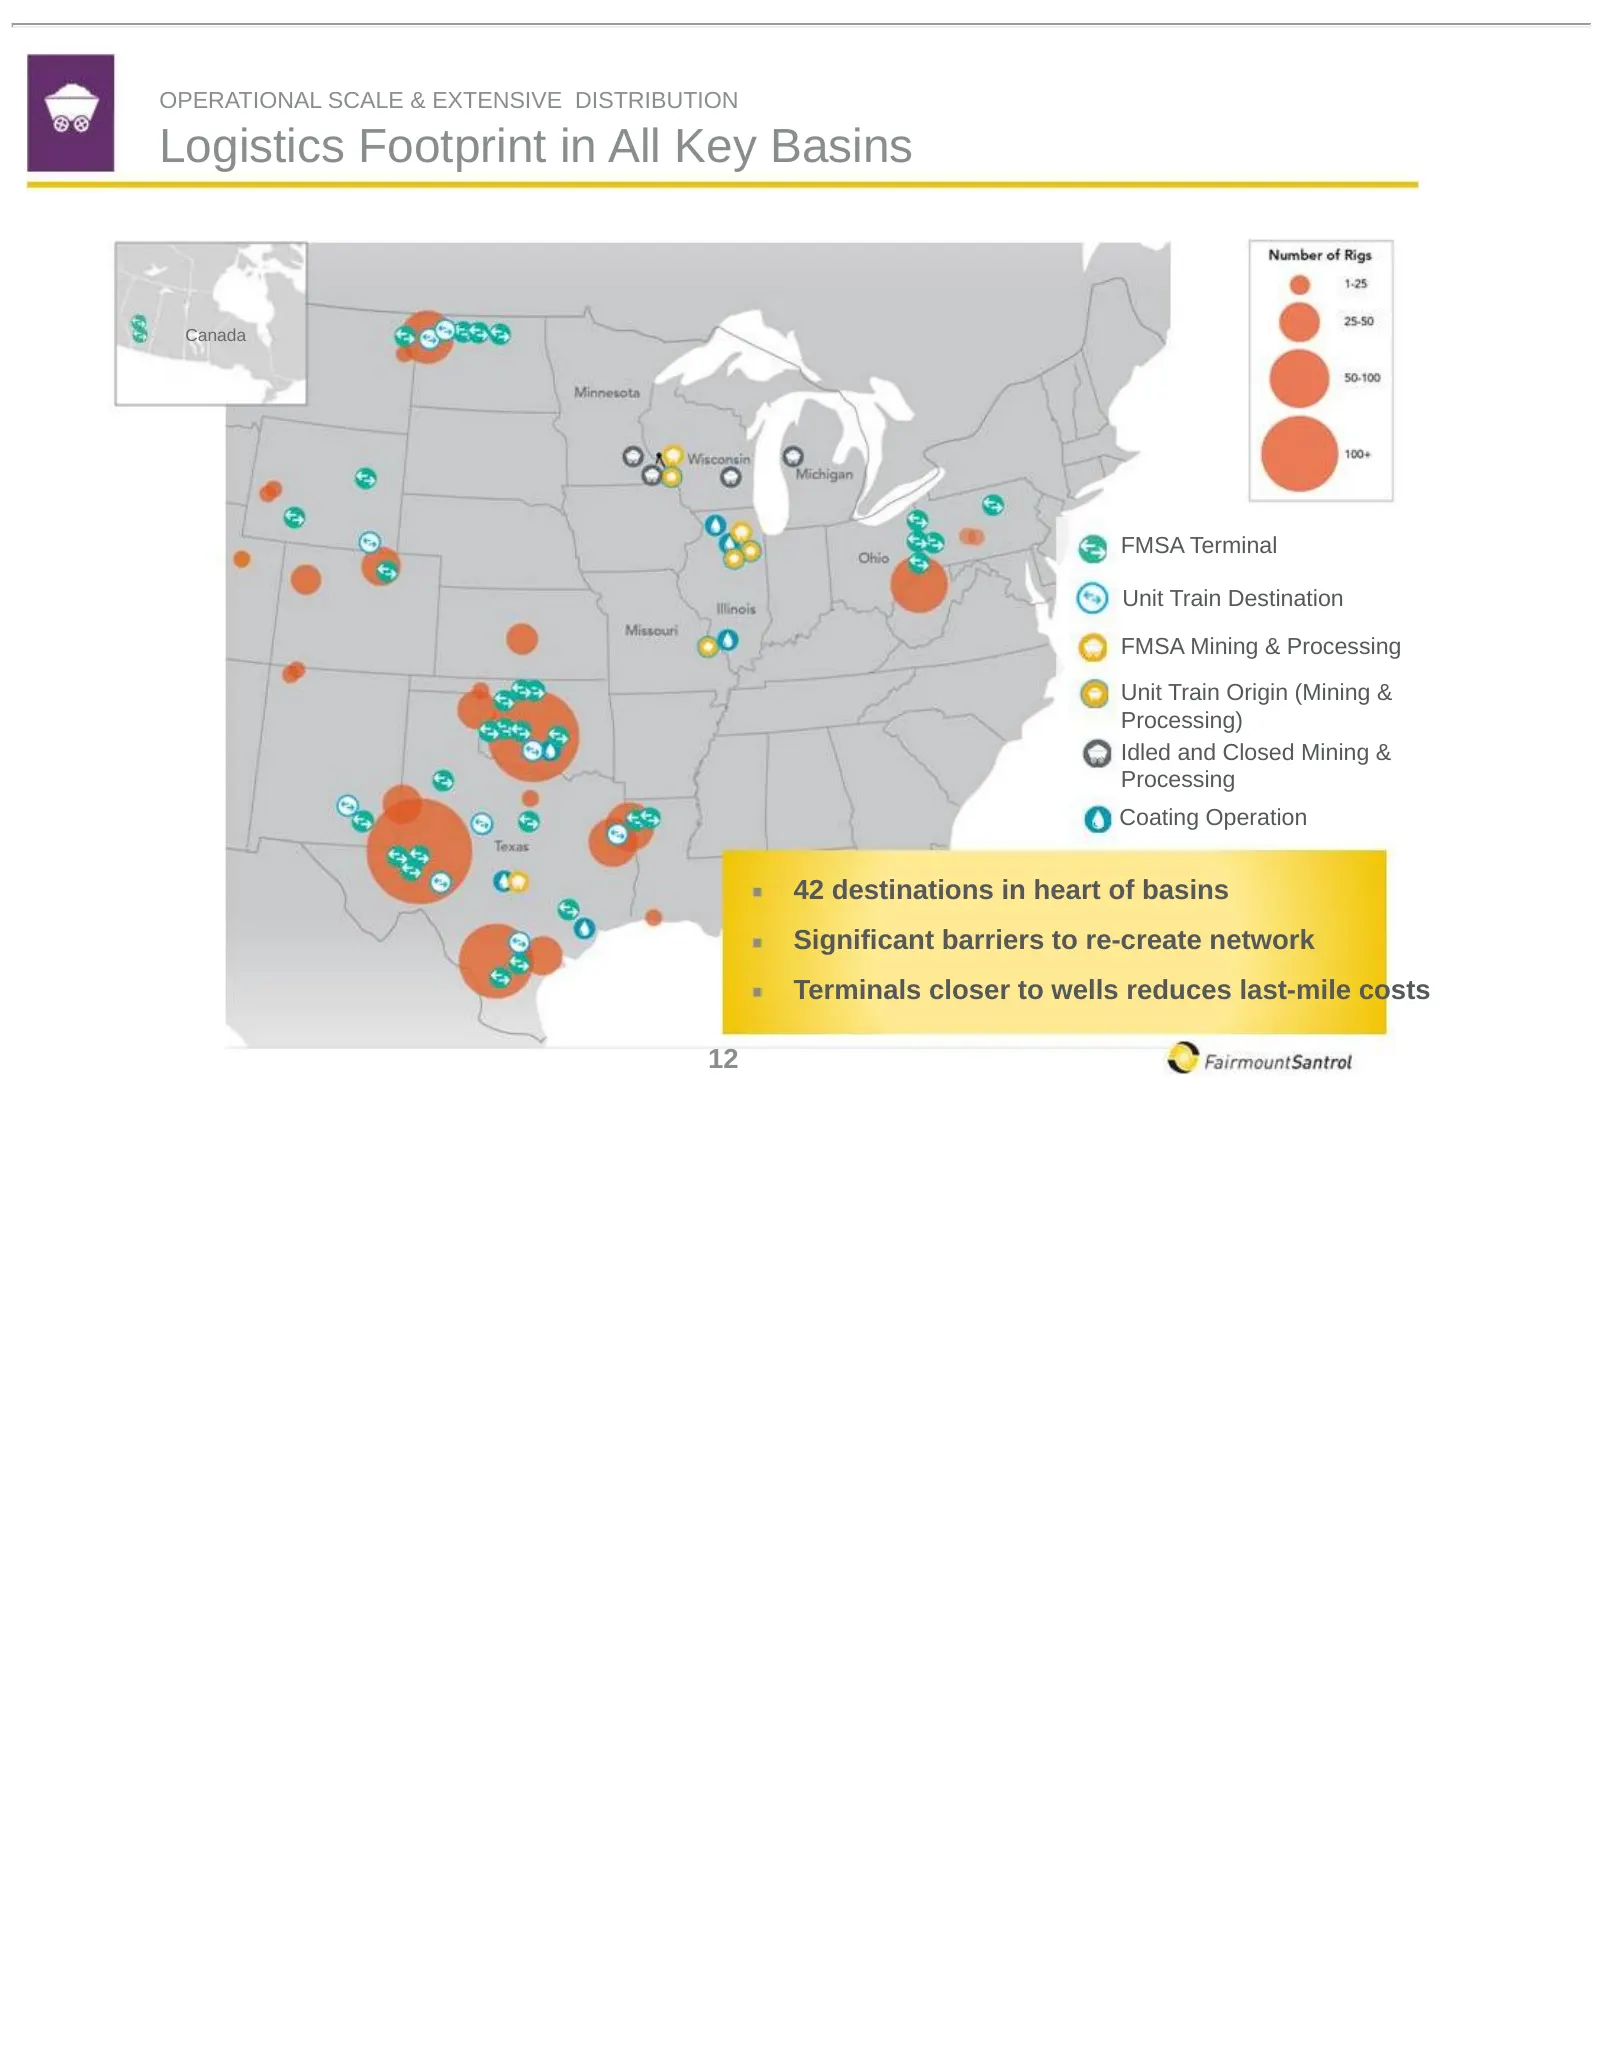
Slide 13: Logistics Footprint in All Key Basins
OPERATIONAL SCALE & EXTENSIVE DISTRIBUTION Logistics Footprint in All Key Basins Canada FMSA Terminal Unit Train Destination FMSA Mining & Processing Unit Train Origin (Mining & Processing) Idled and Closed Mining & Processing Coating Operation 42 destinations in heart of basins Significant barriers
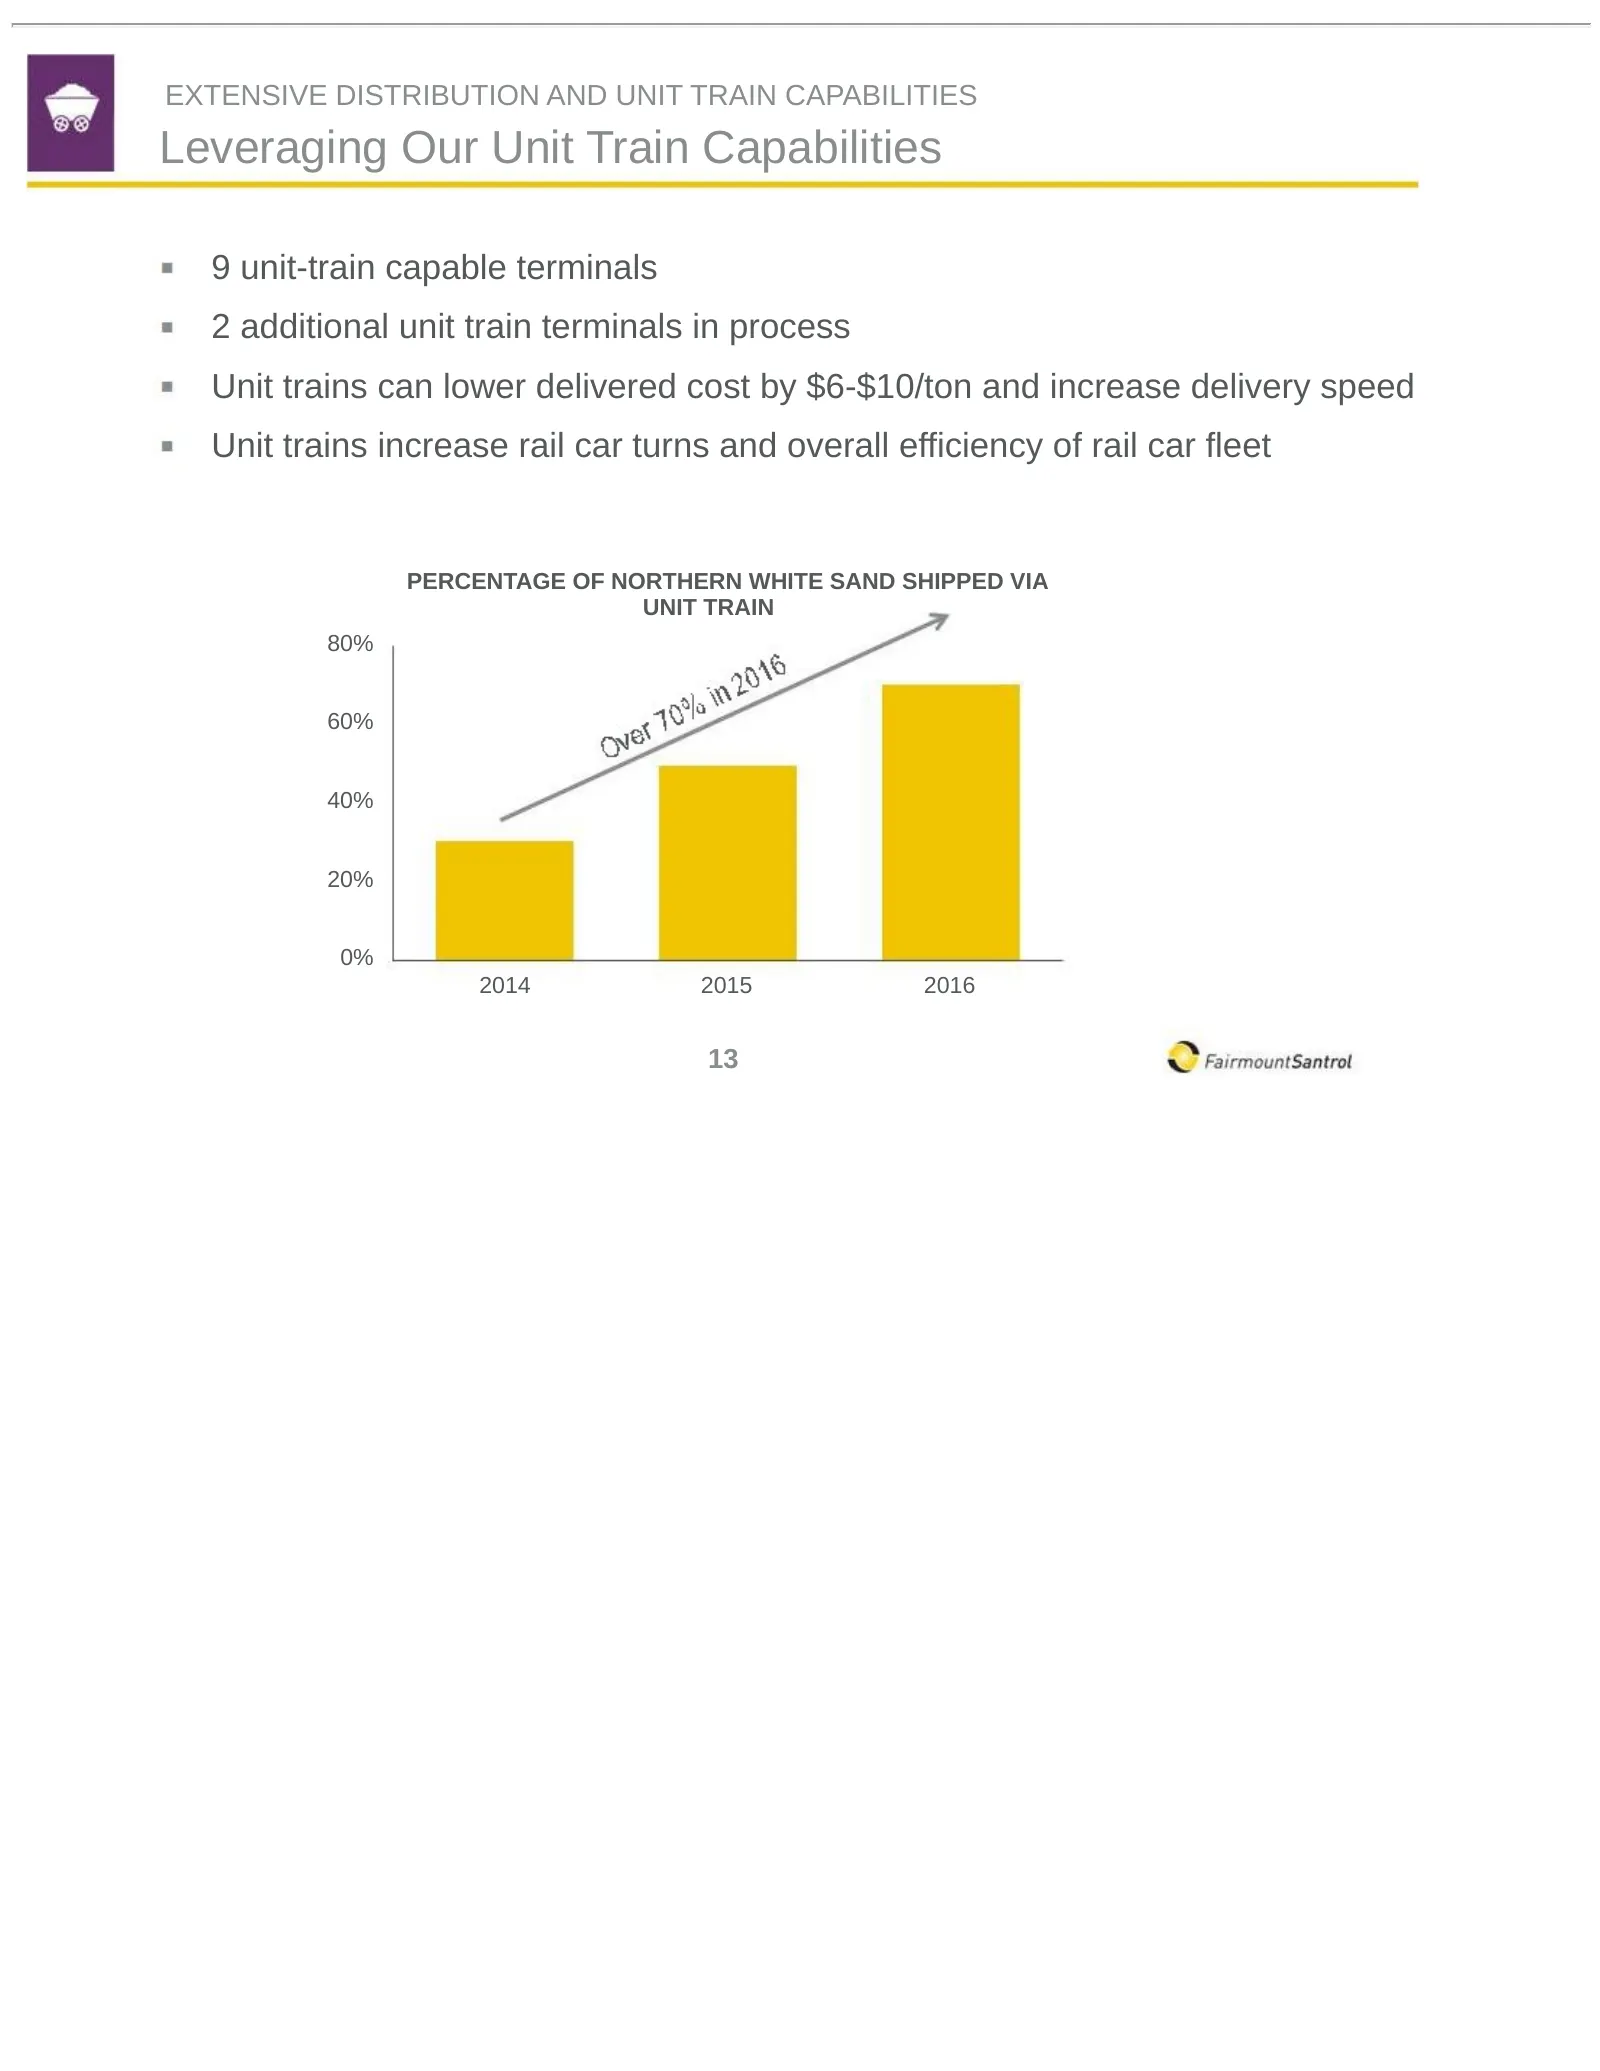
Slide 14: Leveraging Our Unit Train Capabilities
EXTENSIVE DISTRIBUTION AND UNIT TRAIN CAPABILITIES Leveraging Our Unit Train Capabilities 9 unit-train capable terminals 2 additional unit train terminals in process Unit trains can lower delivered cost by $6-$10/ton and increase delivery speed Unit trains increase rail car turns and overall efficie
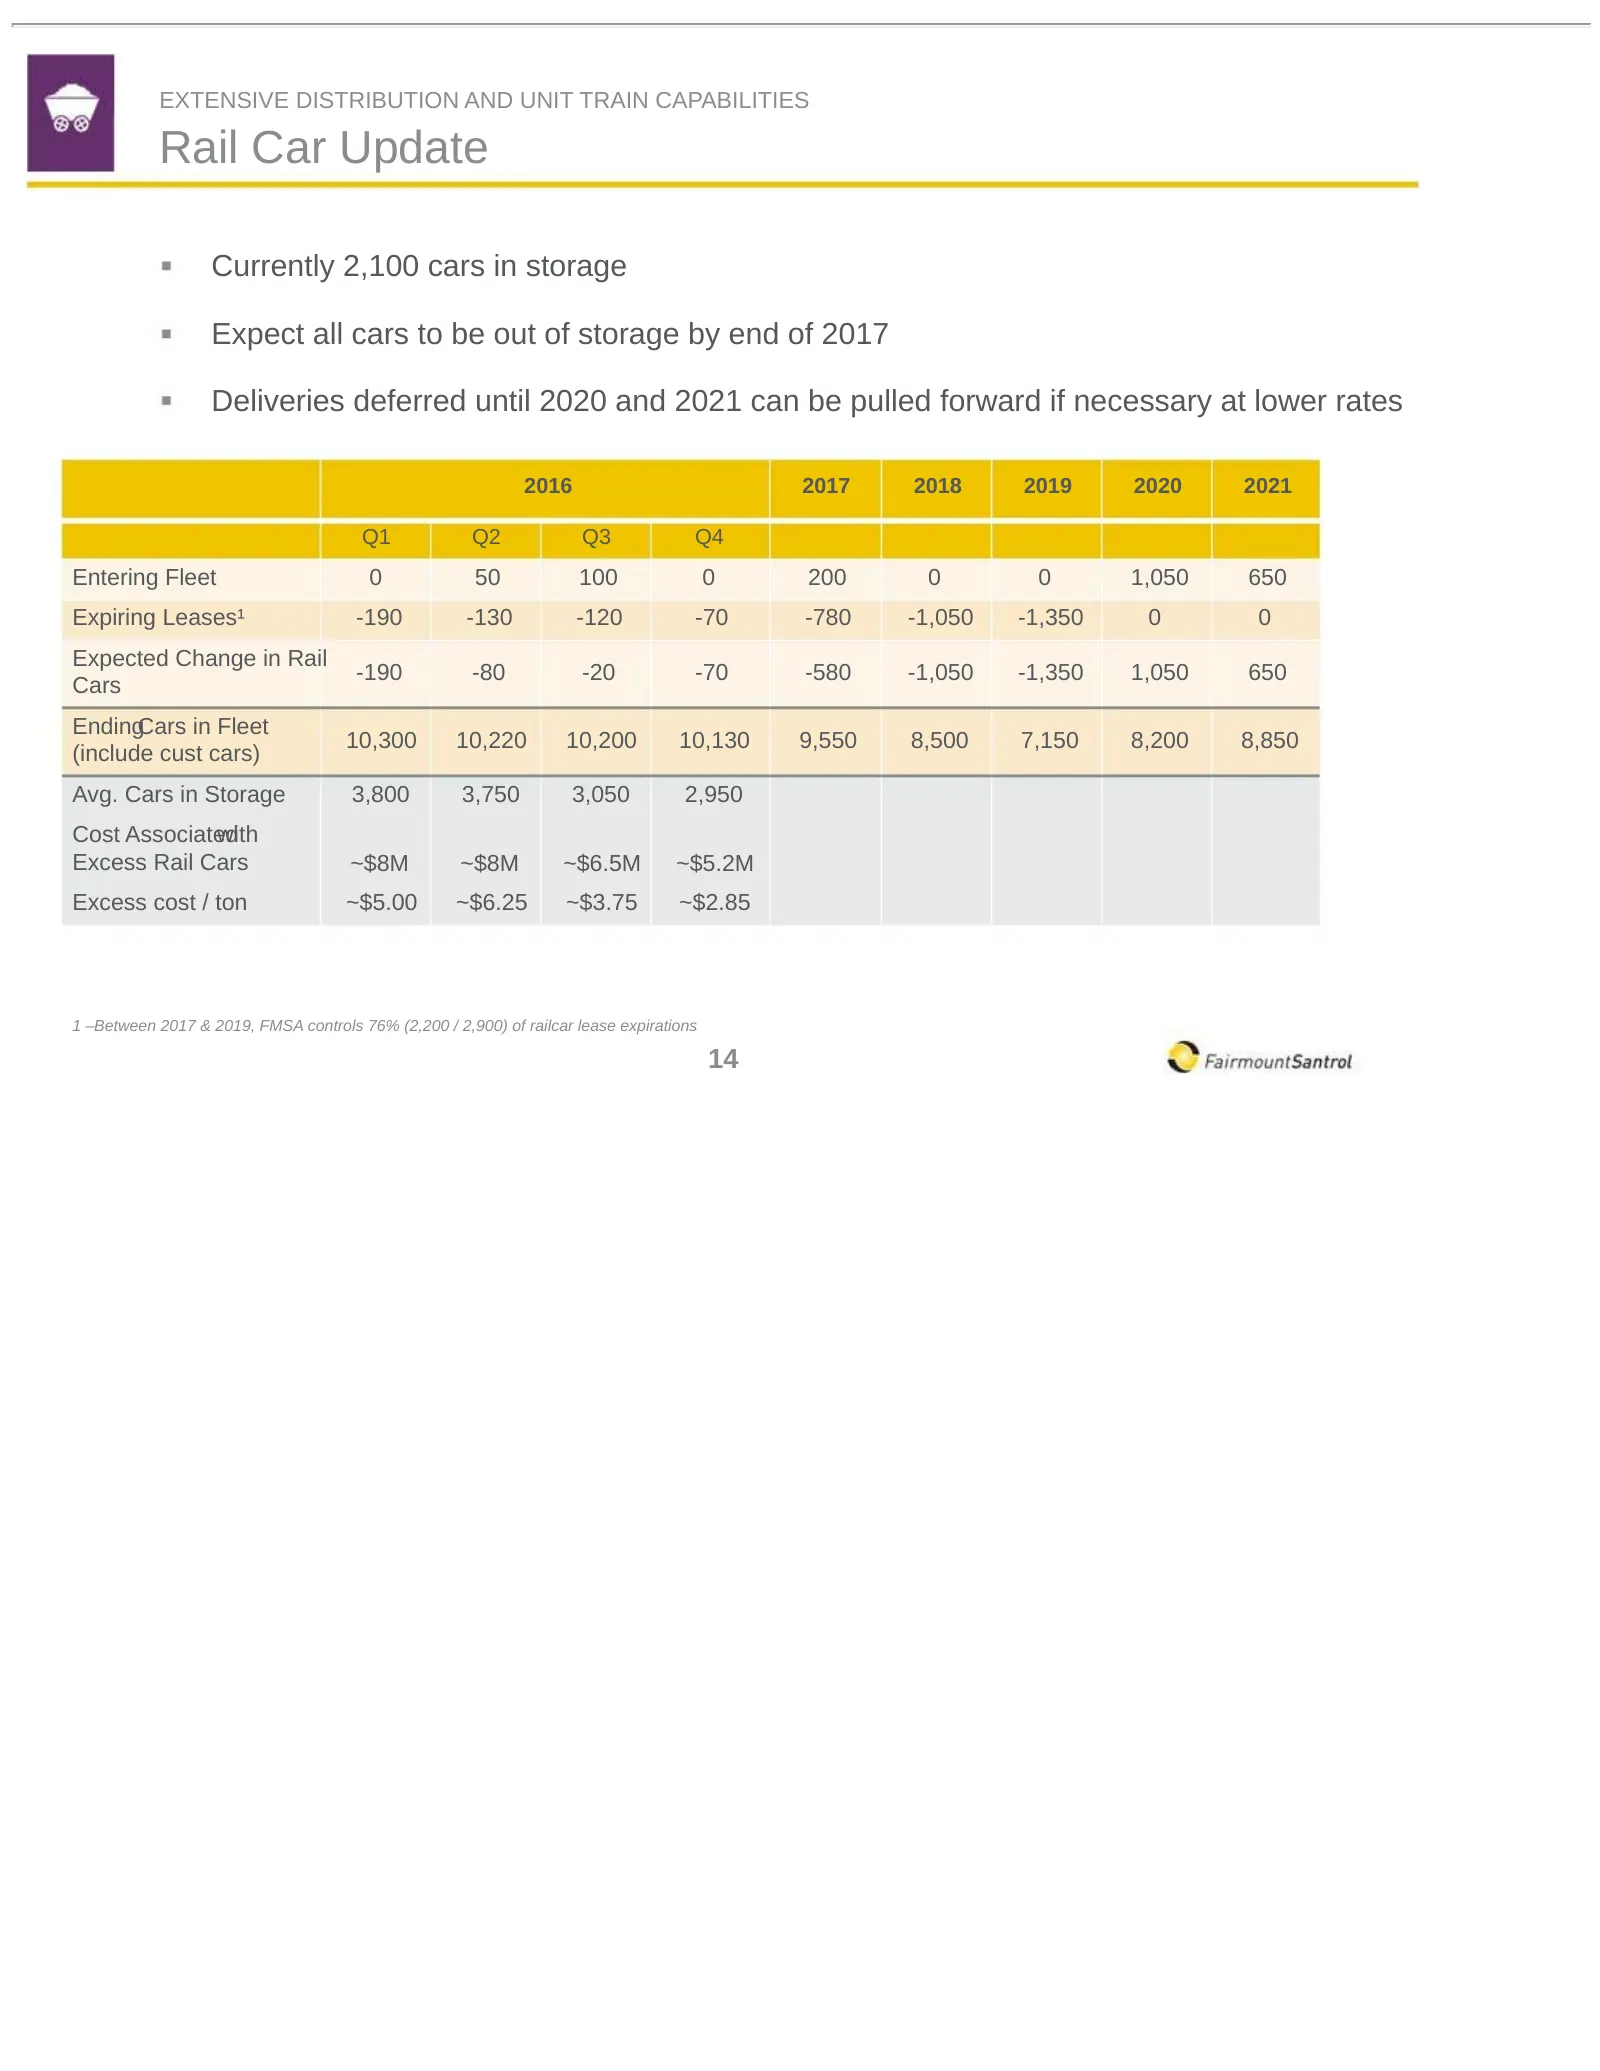
Slide 15: Rail Car Update
EXTENSIVE DISTRIBUTION AND UNIT TRAIN CAPABILITIES Rail Car Update Currently 2,100 cars in storage Expect all cars to be out of storage by end of 2017 Deliveries deferred until 2020 and 2021 can be pulled forward if necessary at lower rates 2016 2017 2018 2019 2020 2021 Q1 Q2 Q3 Q4 Entering Fleet 0
Slide 16: Performance Update
Performance Update
Slide 17: Solid Performance Under Challenging Market Conditions
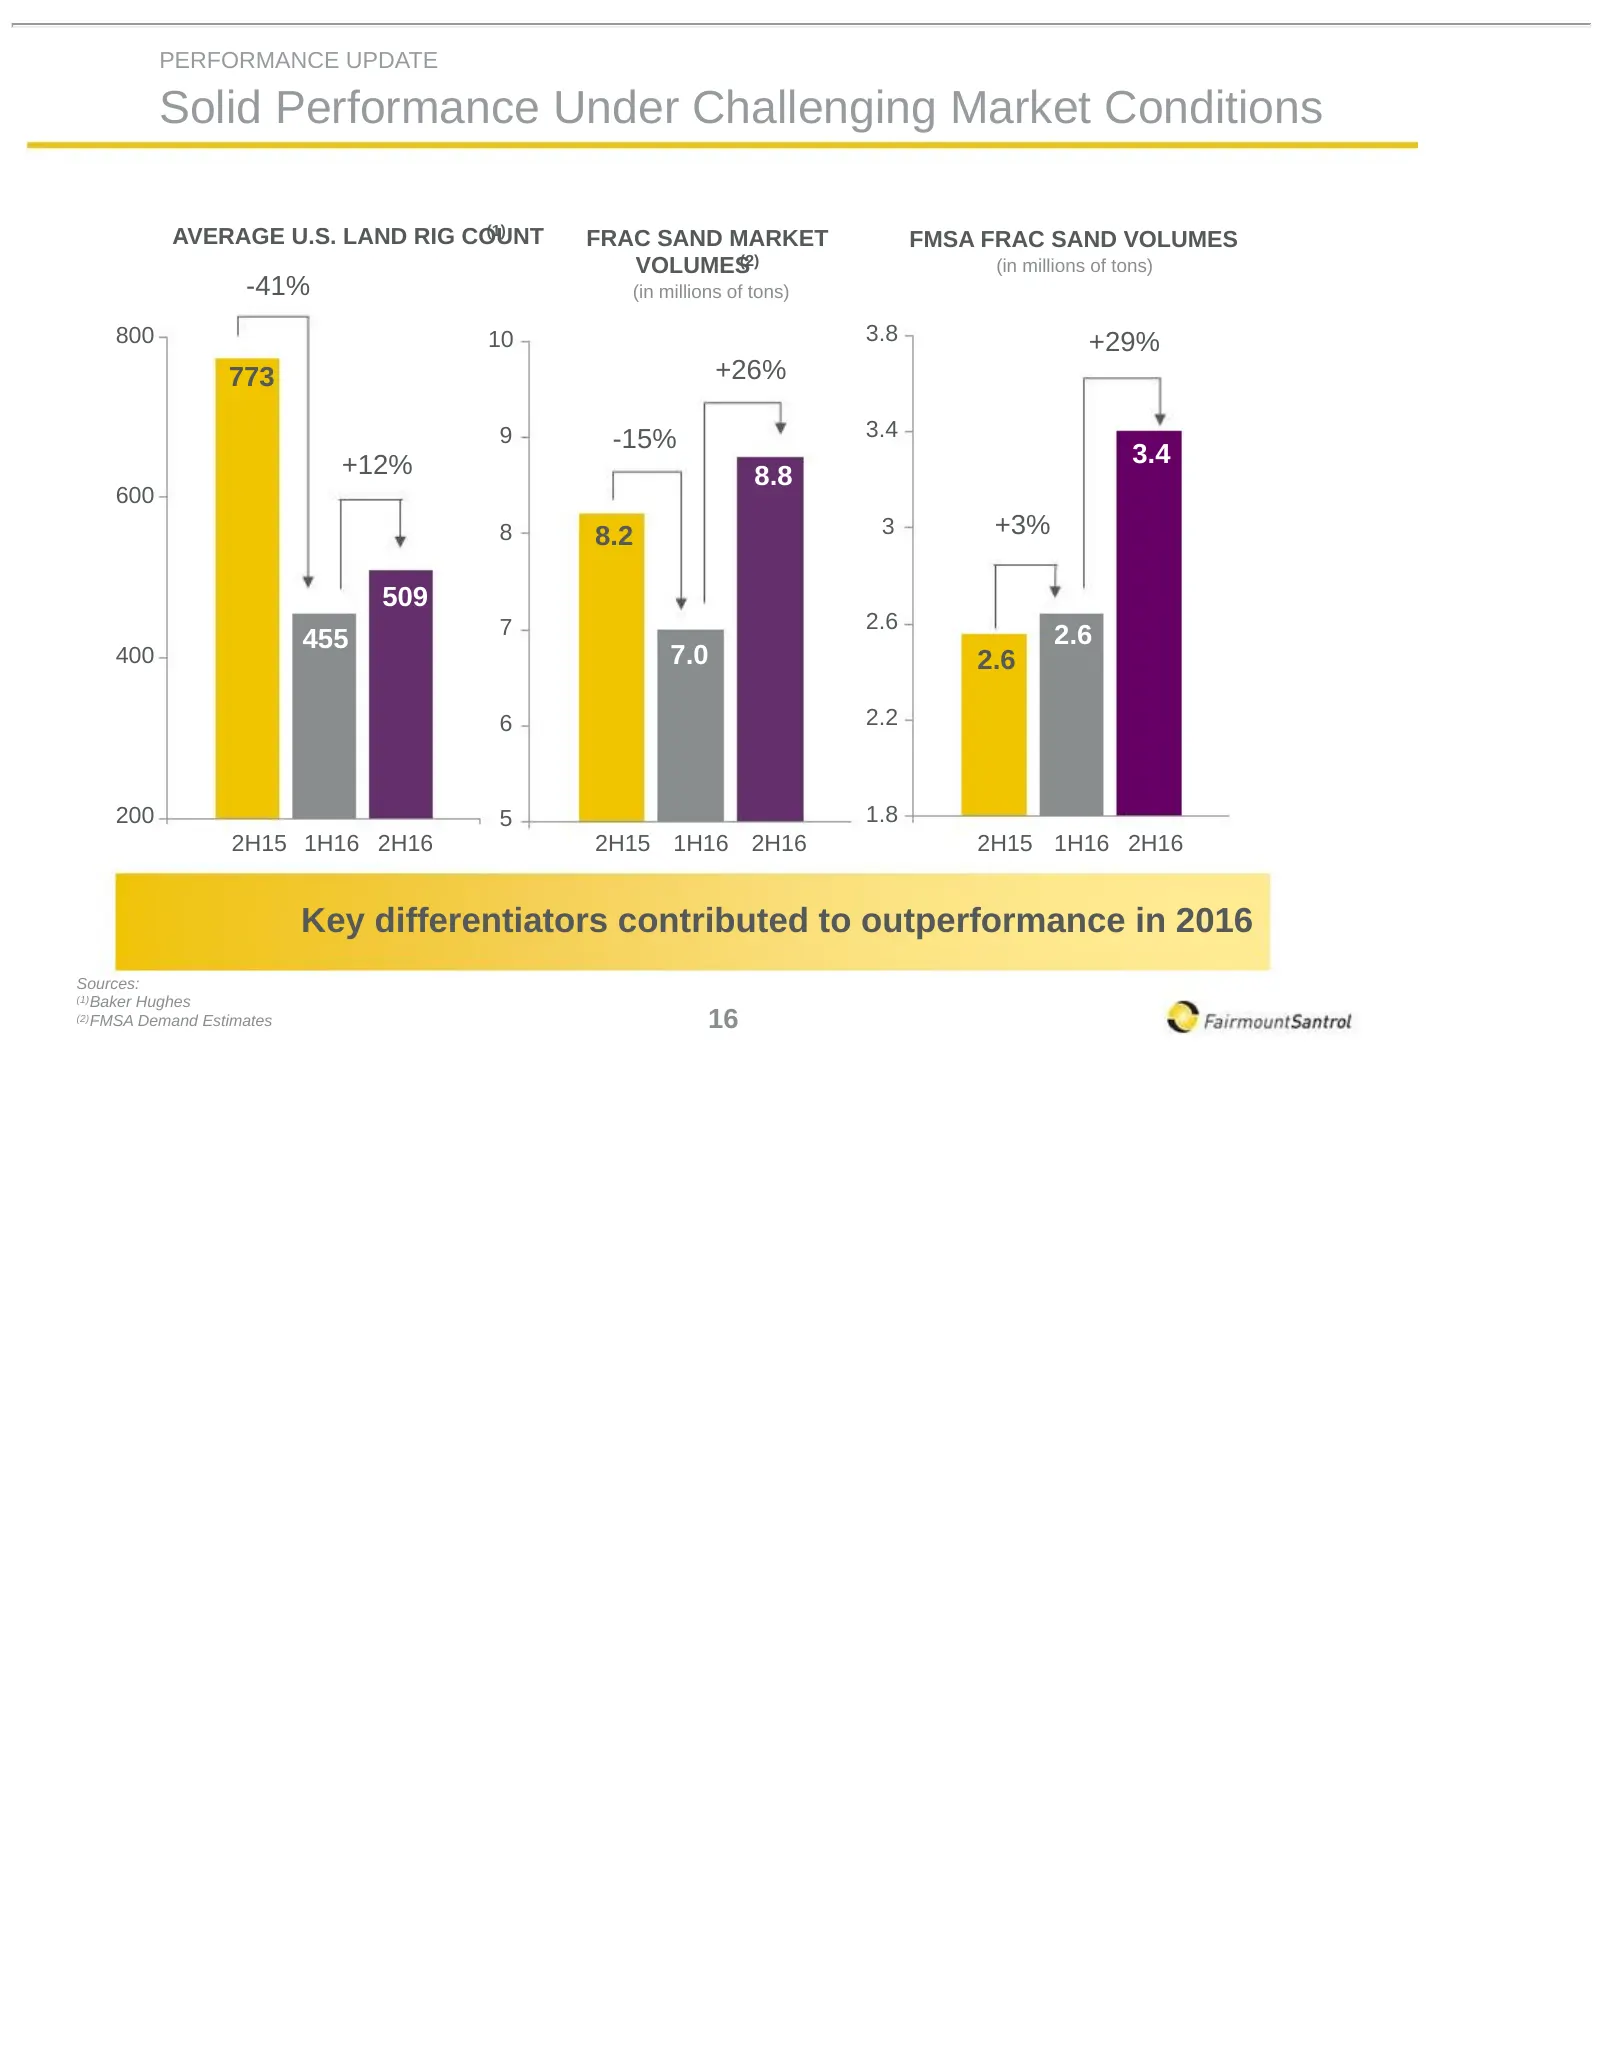
PERFORMANCE UPDATE Solid Performance Under Challenging Market Conditions (1) AVERAGE U.S. LAND RIG COUNT FRAC SAND MARKET FMSA FRAC SAND VOLUMES VOLUMES(2) (in millions of tons) -41% (in millions of tons) 800 10 3.8 +29% 773 +26% 9 3.4 -15% +12% 3.4 8.8 600 8 8.2 3 +3% 509 7 2.6 455 2.6 400 7.0 2.6
Slide 18: Solid Results in I&R Markets
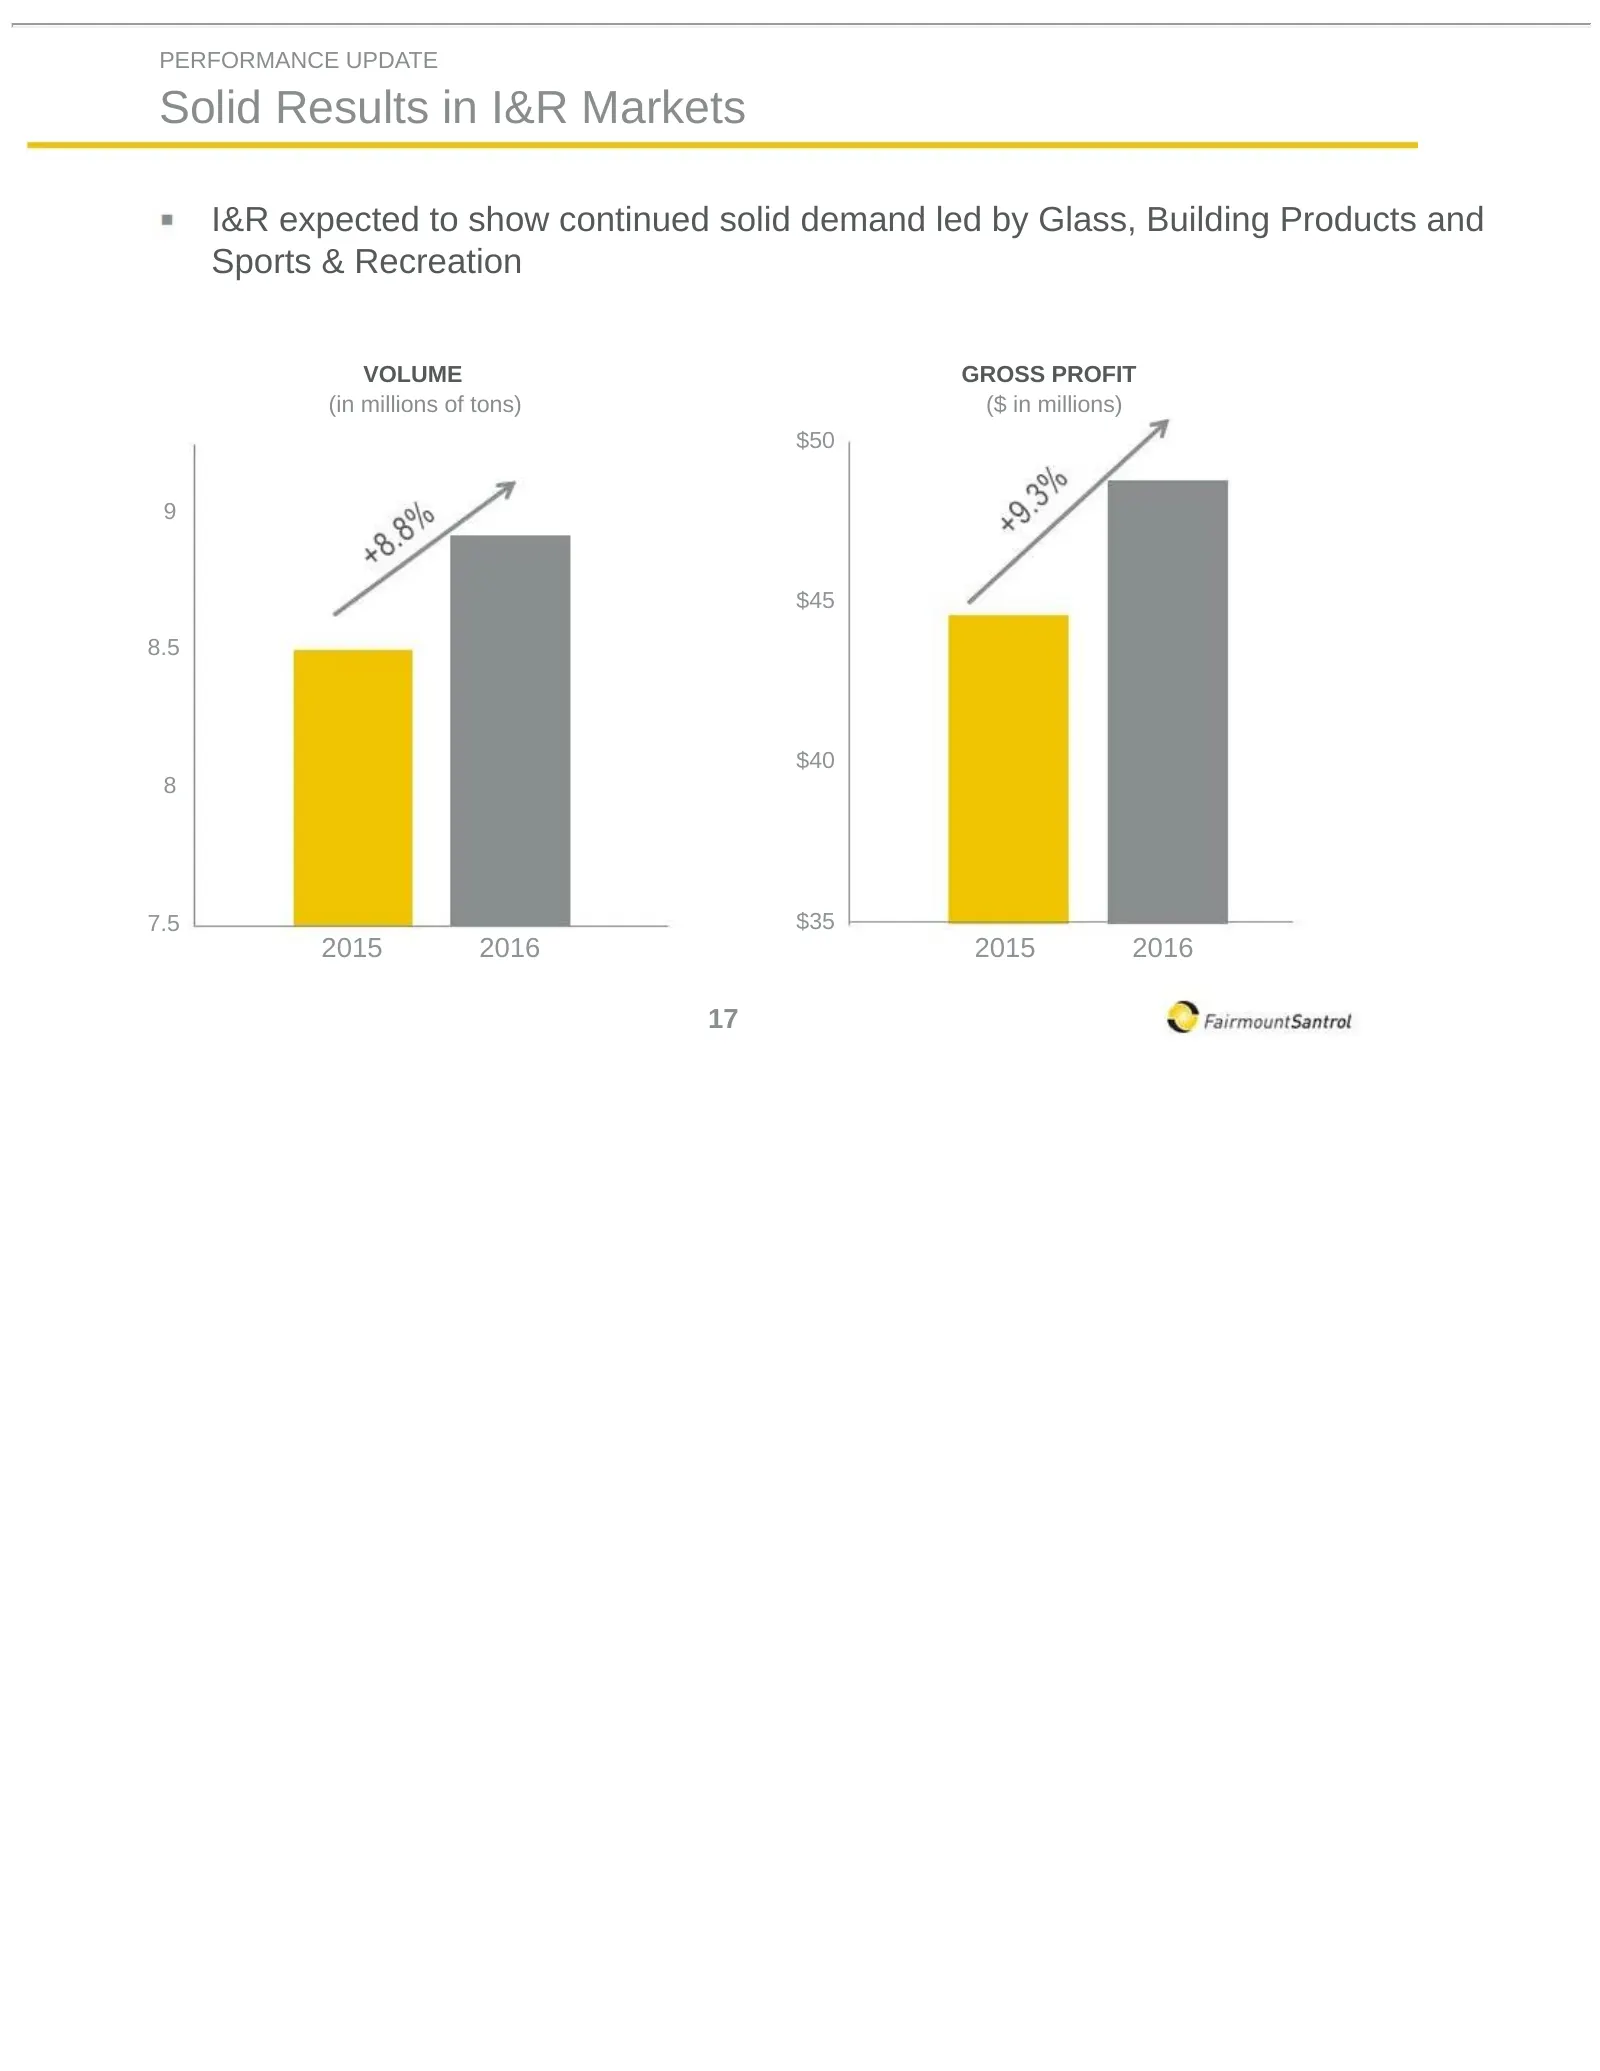
PERFORMANCE UPDATE Solid Results in I&R Markets I&R expected to show continued solid demand led by Glass, Building Products and Sports & Recreation VOLUME GROSS PROFIT (in millions of tons) ($ in millions) $50 9 $45 8.5 $40 8 7.5 $35 2015 2016 2015 2016 17
Slide 19: Financial Update
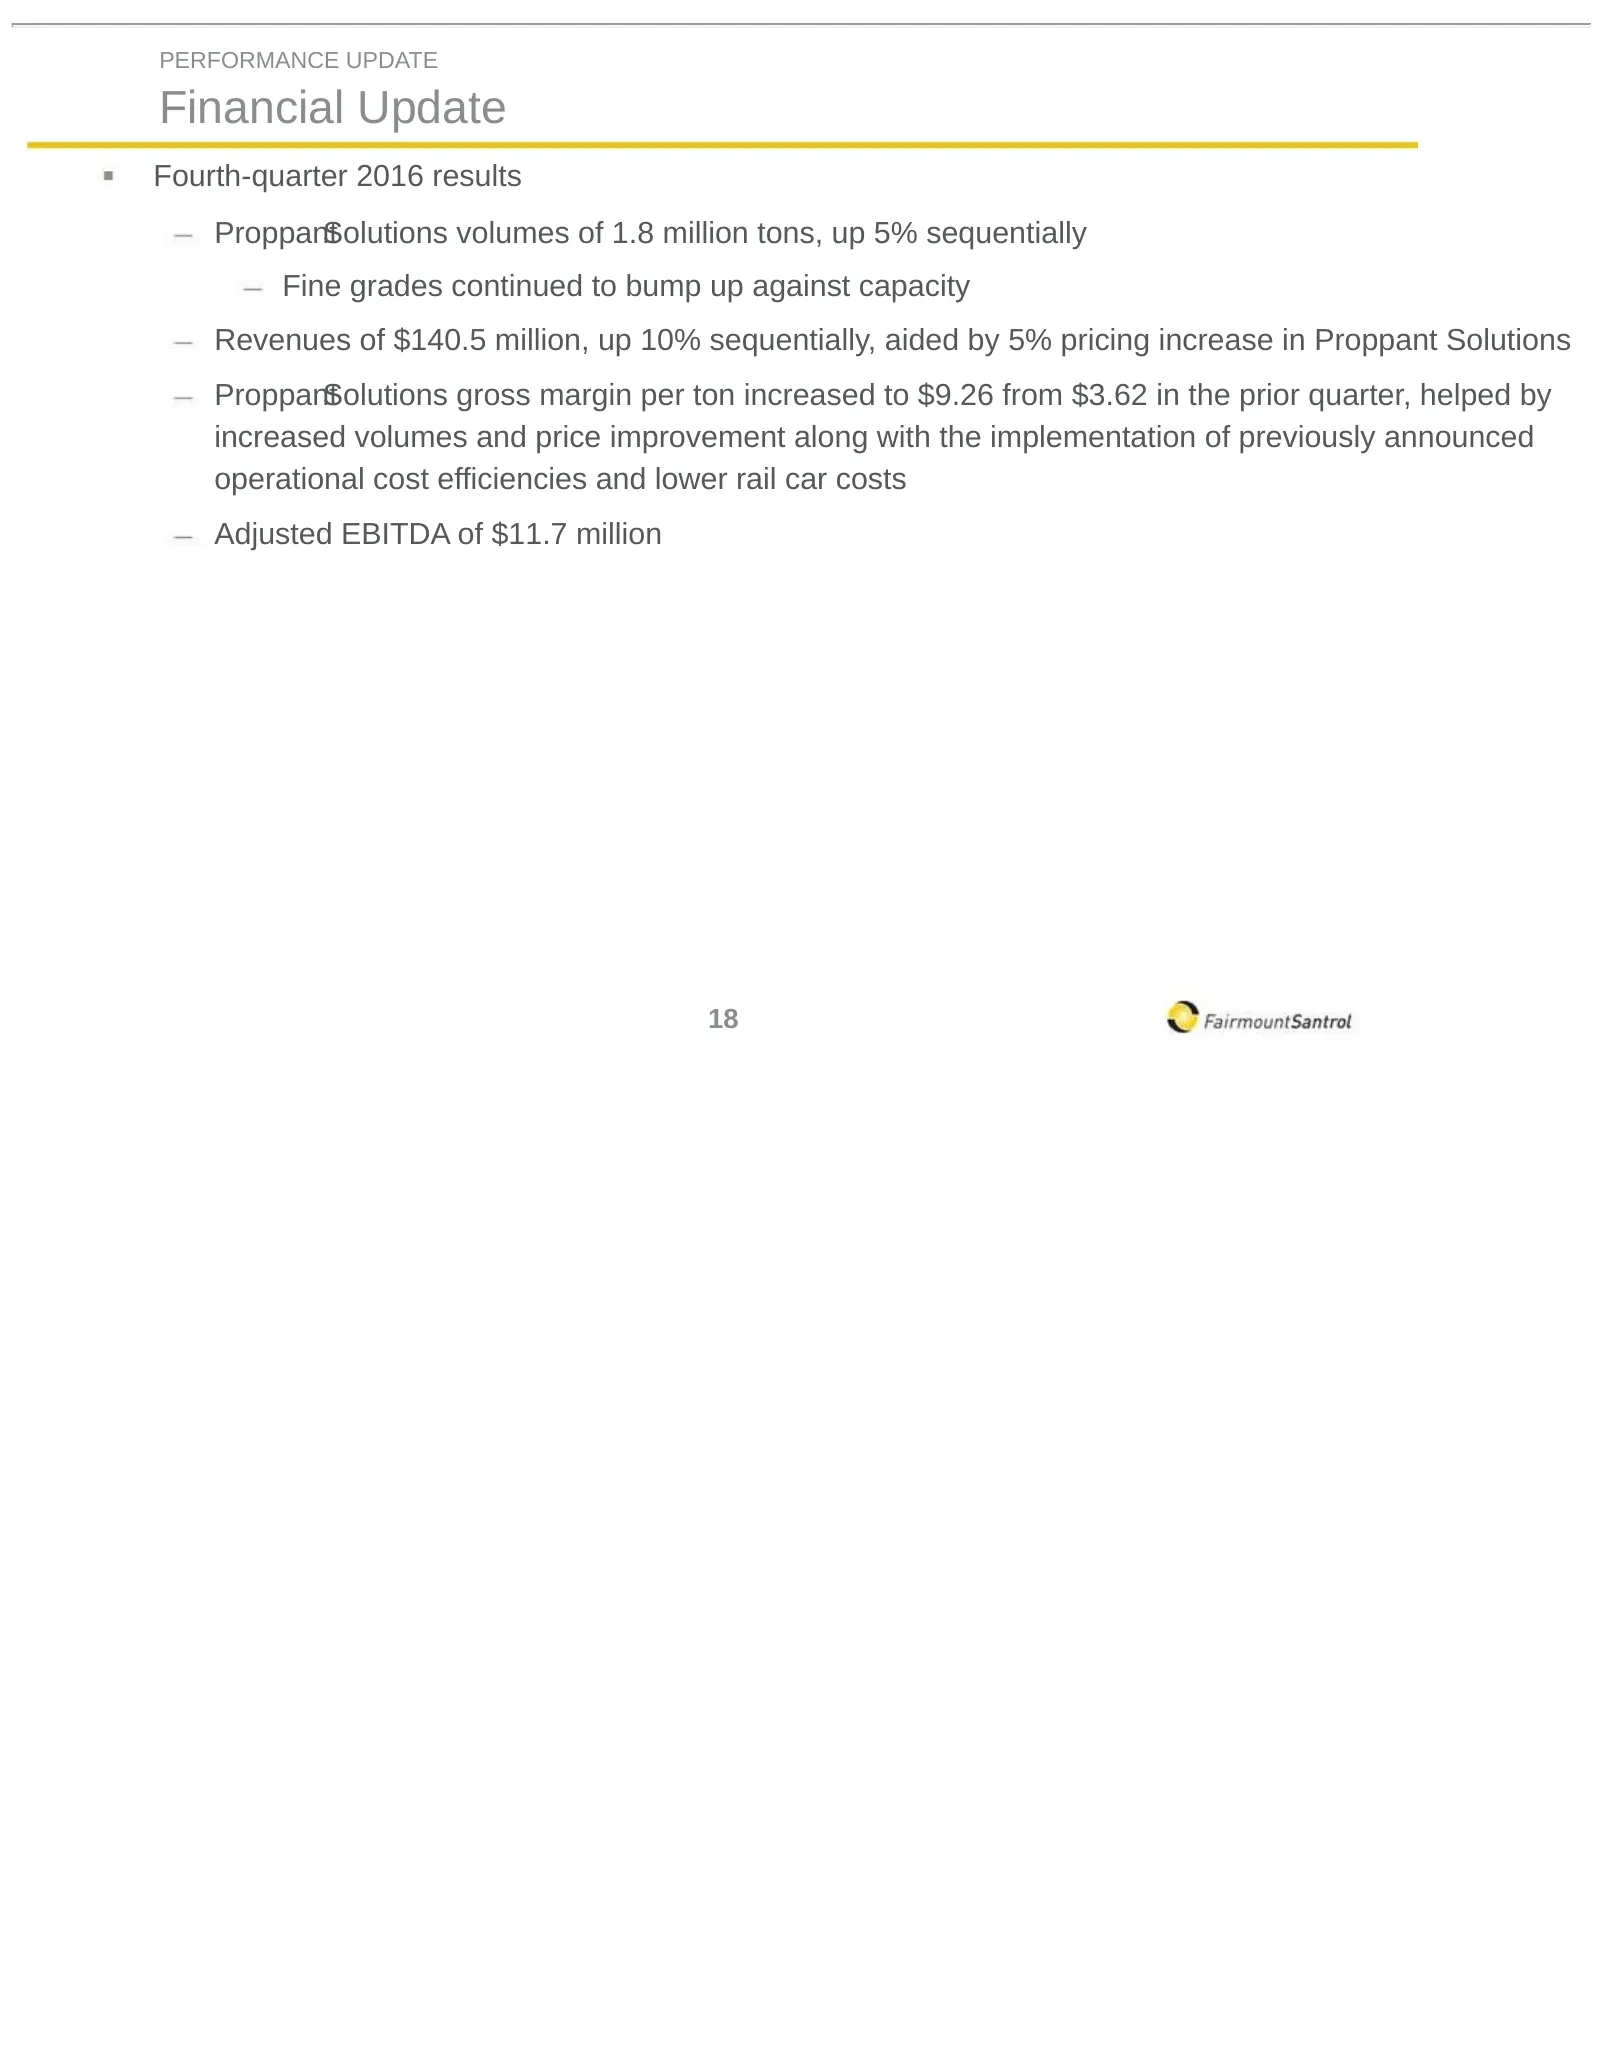
PERFORMANCE UPDATE Financial Update Fourth-quarter 2016 results ProppantSolutions volumes of 1.8 million tons, up 5% sequentially Fine grades continued to bump up against capacity Revenues of $140.5 million, up 10% sequentially, aided by 5% pricing increase in Proppant Solutions ProppantSolutions gr

Slide 20: Looking Ahead
Looking Ahead
Slide 21: Positive Tailwinds for the Proppant Market
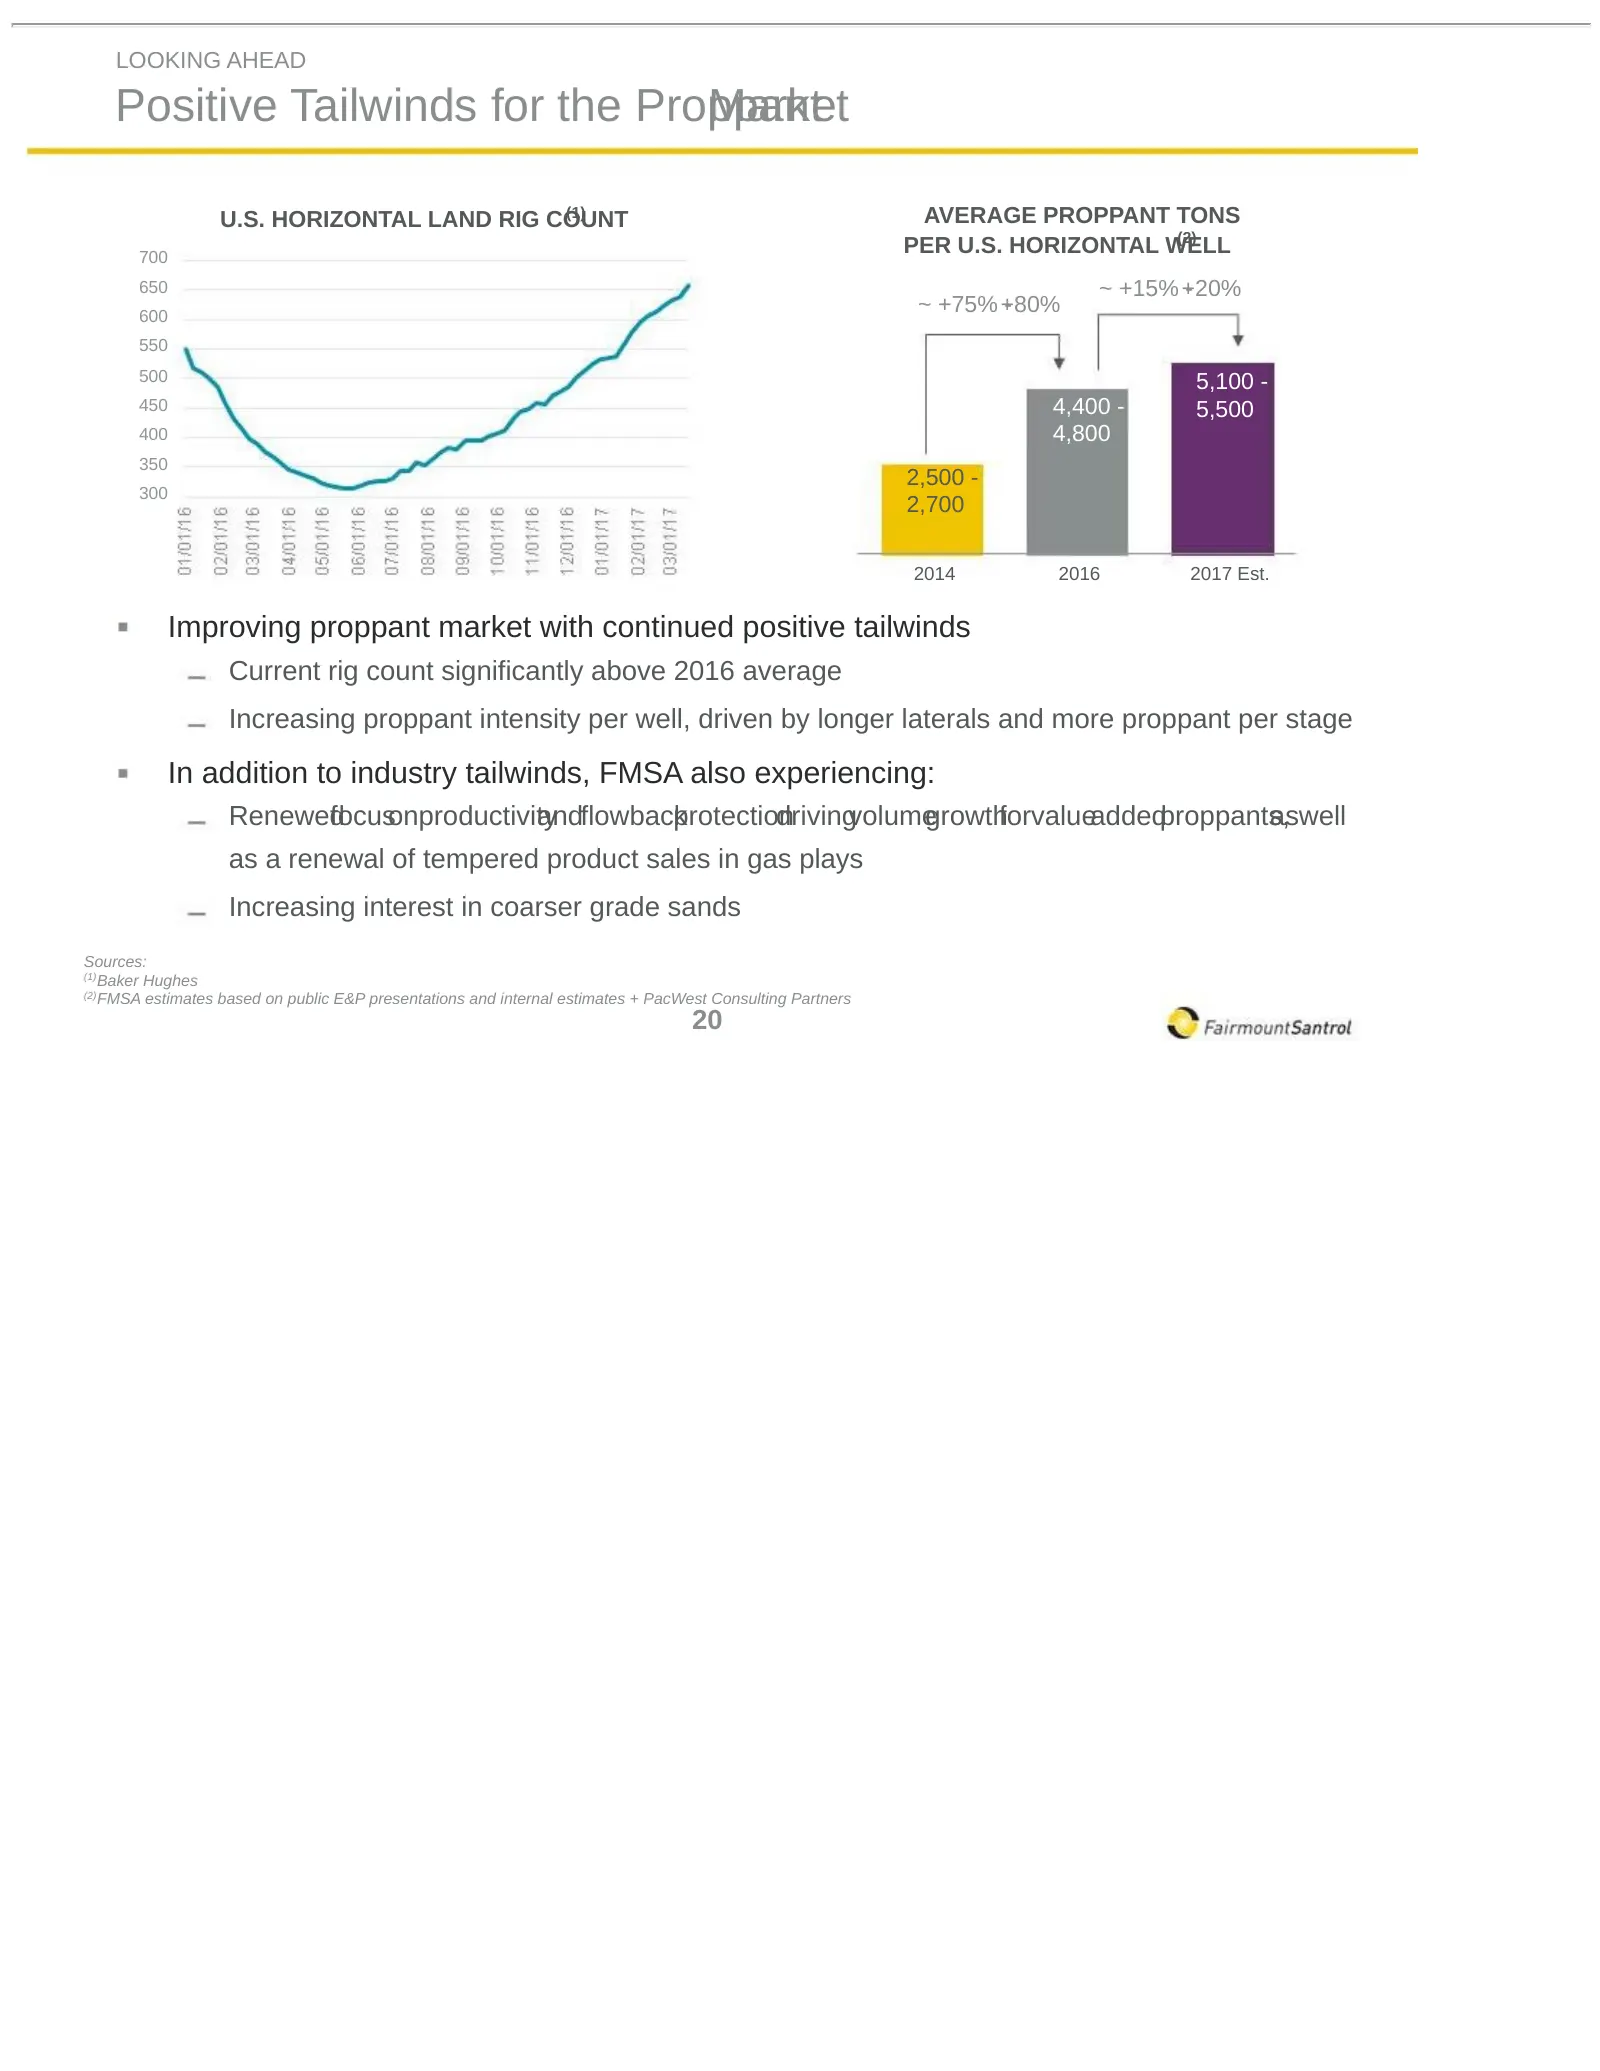
LOOKING AHEAD Positive Tailwinds for the Proppant Market (1) U.S. HORIZONTAL LAND RIG COUNT AVERAGE PROPPANT TONS (2) 700 PER U.S. HORIZONTAL WELL 650 ~ +15% +20% - 600 ~ +75% +80% - 550 500 5,100 - 450 4,400 - 5,500 400 4,800 350 2,500 - 300 2,700 2014 2016 2017 Est. Improving proppant market with
Slide 22: Financial Outlook
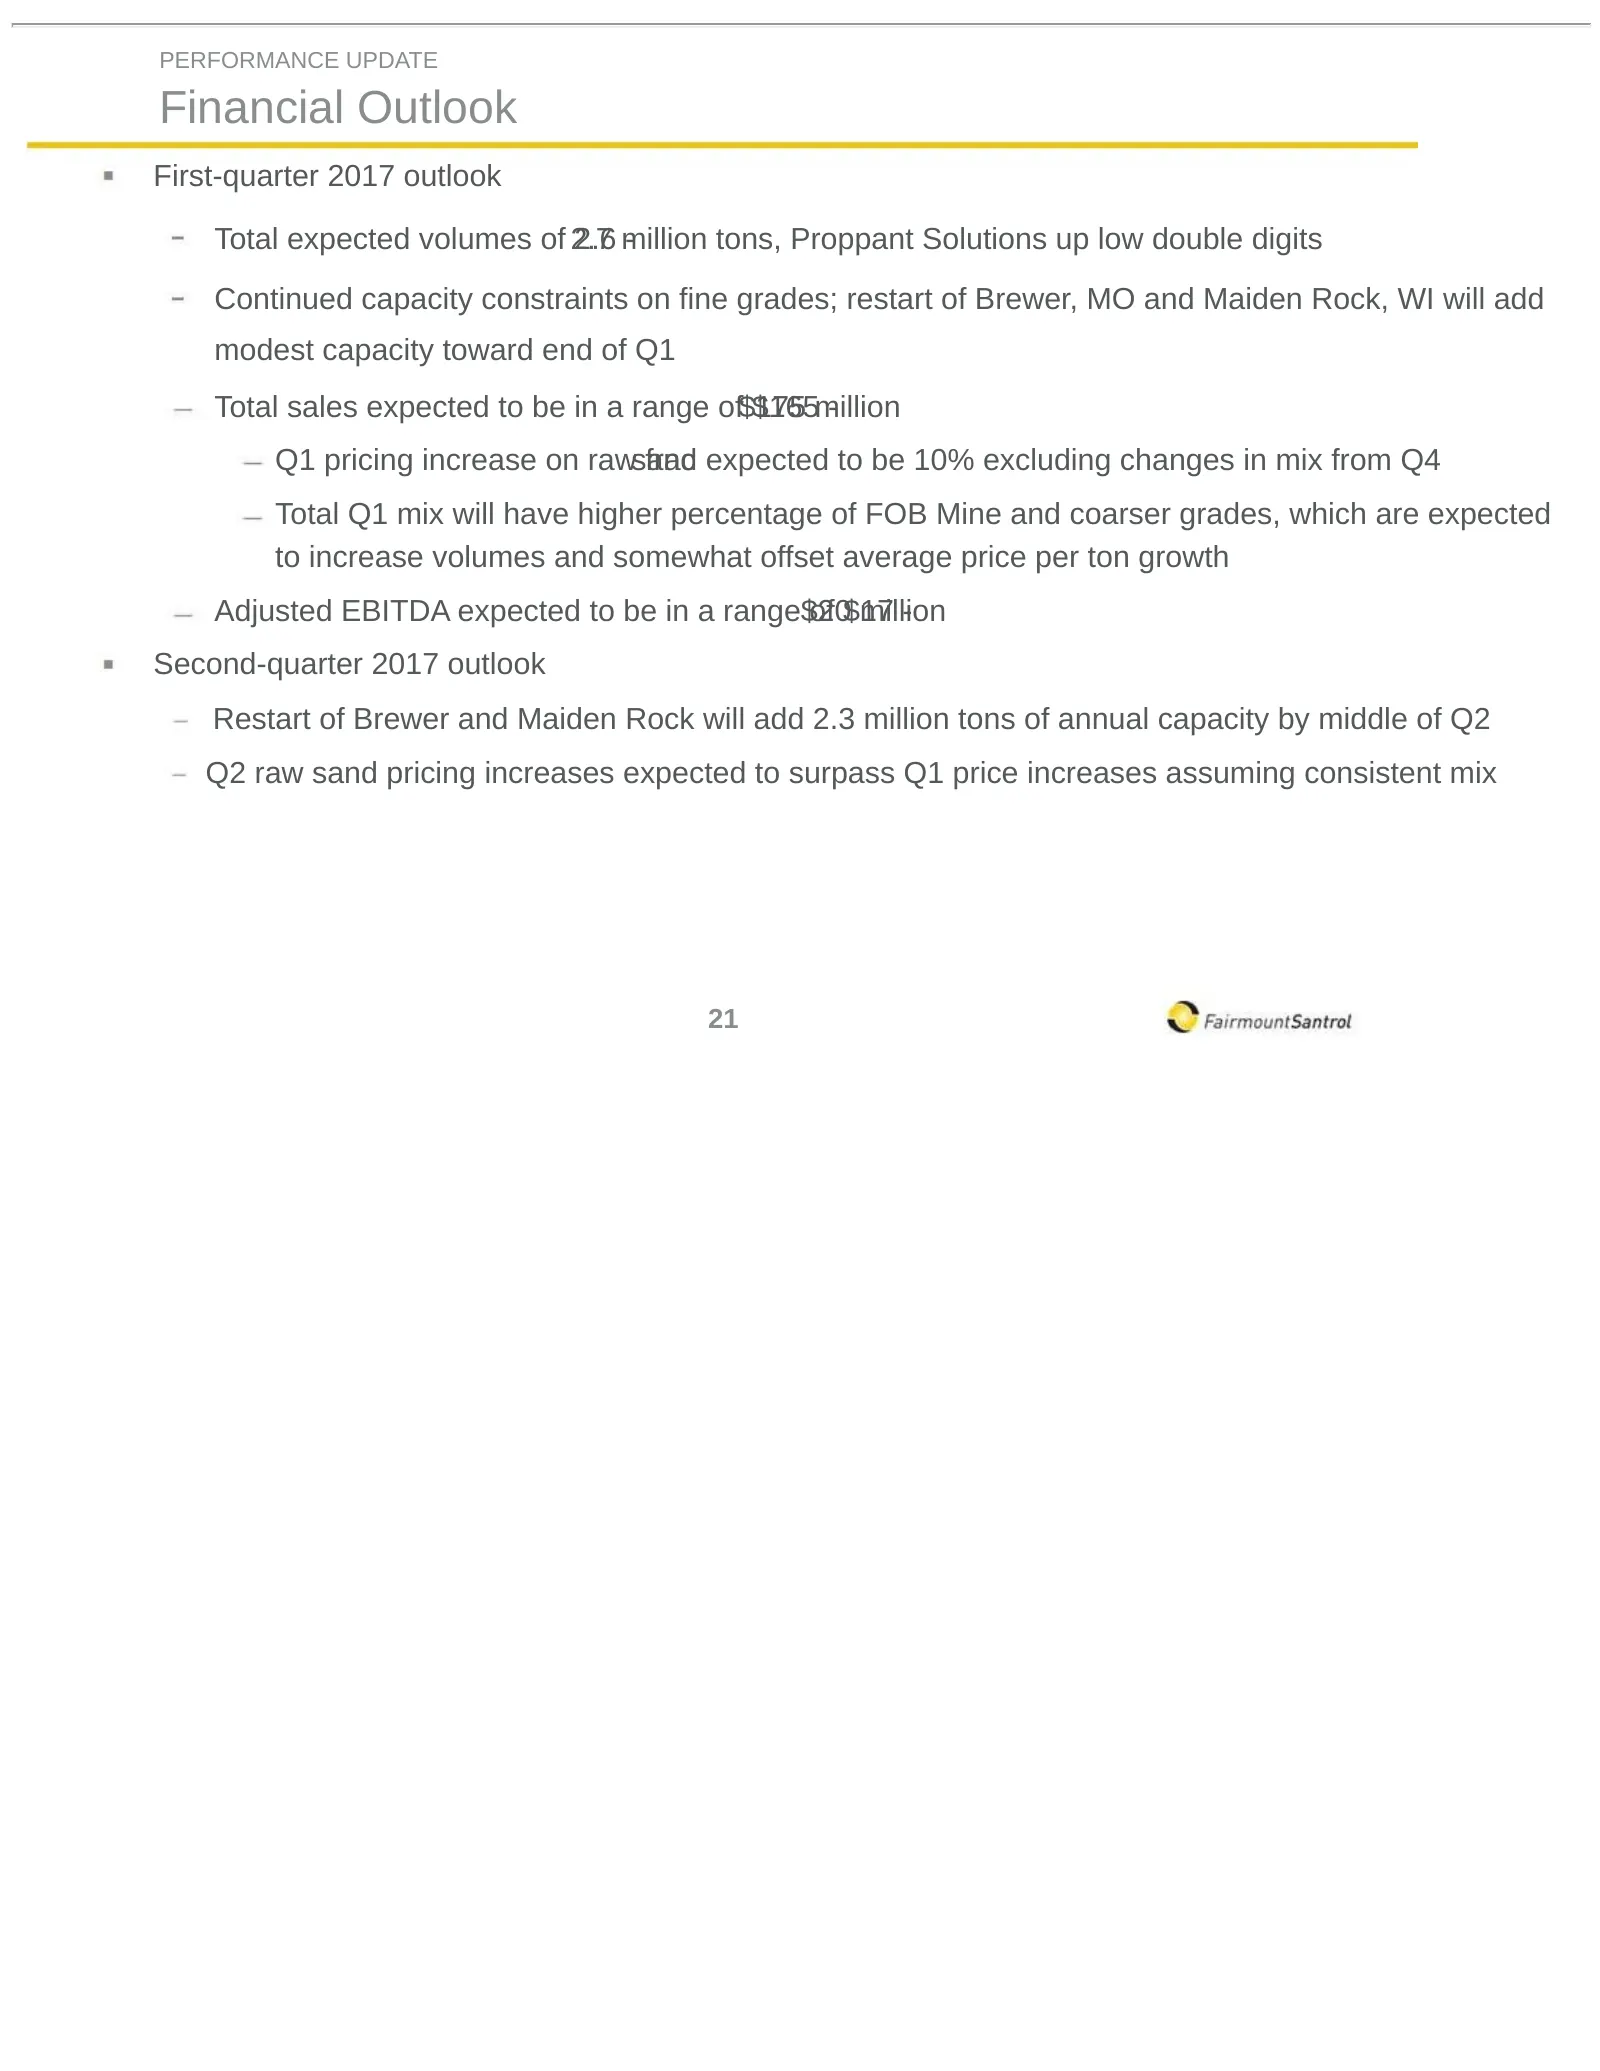
PERFORMANCE UPDATE Financial Outlook First-quarter 2017 outlook Total expected volumes of 2.7 2.6 million - tons, Proppant Solutions up low double digits Continued capacity constraints on fine grades; restart of Brewer, MO and Maiden Rock, WI will add modest capacity toward end of Q1 Total sales exp
Slide 23: Industry Leader Well-Positioned for Growth
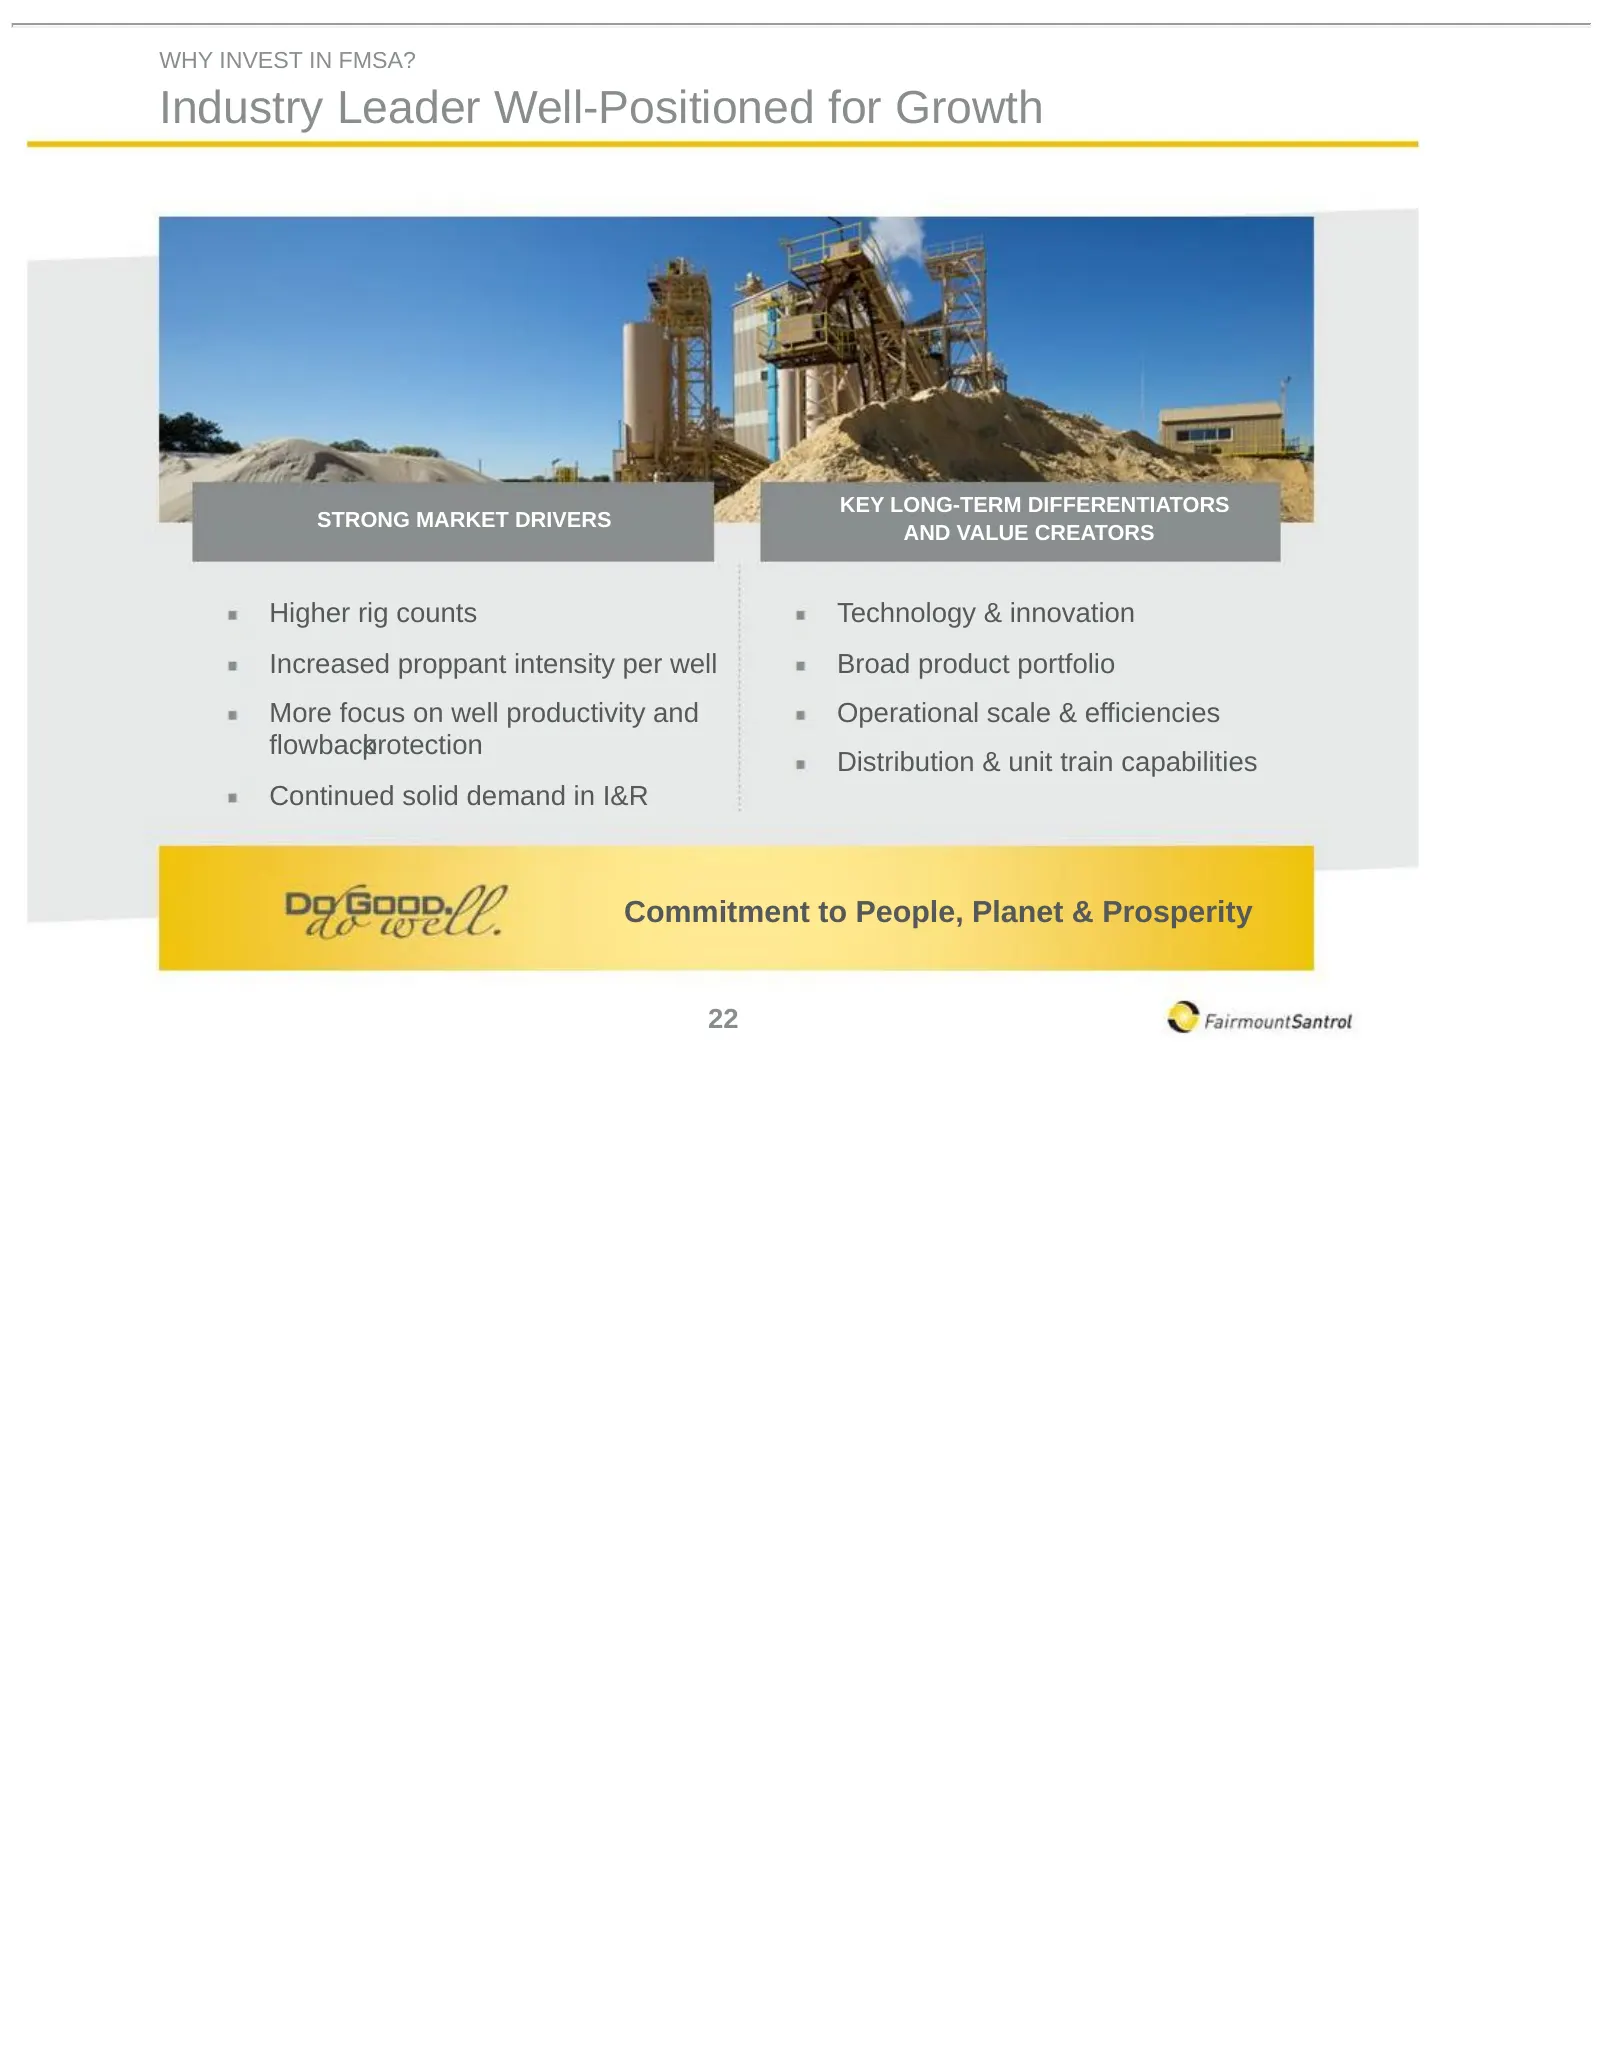
WHY INVEST IN FMSA? Industry Leader Well-Positioned for Growth KEY LONG-TERM DIFFERENTIATORS STRONG MARKET DRIVERS AND VALUE CREATORS Higher rig counts Technology & innovation Increased proppant intensity per well Broad product portfolio More focus on well productivity and Operational scale & effici
Slide 24: Appendix
Appendix
Slide 25: Appendix: Reconciliation of Non-GAAP Financial Measures
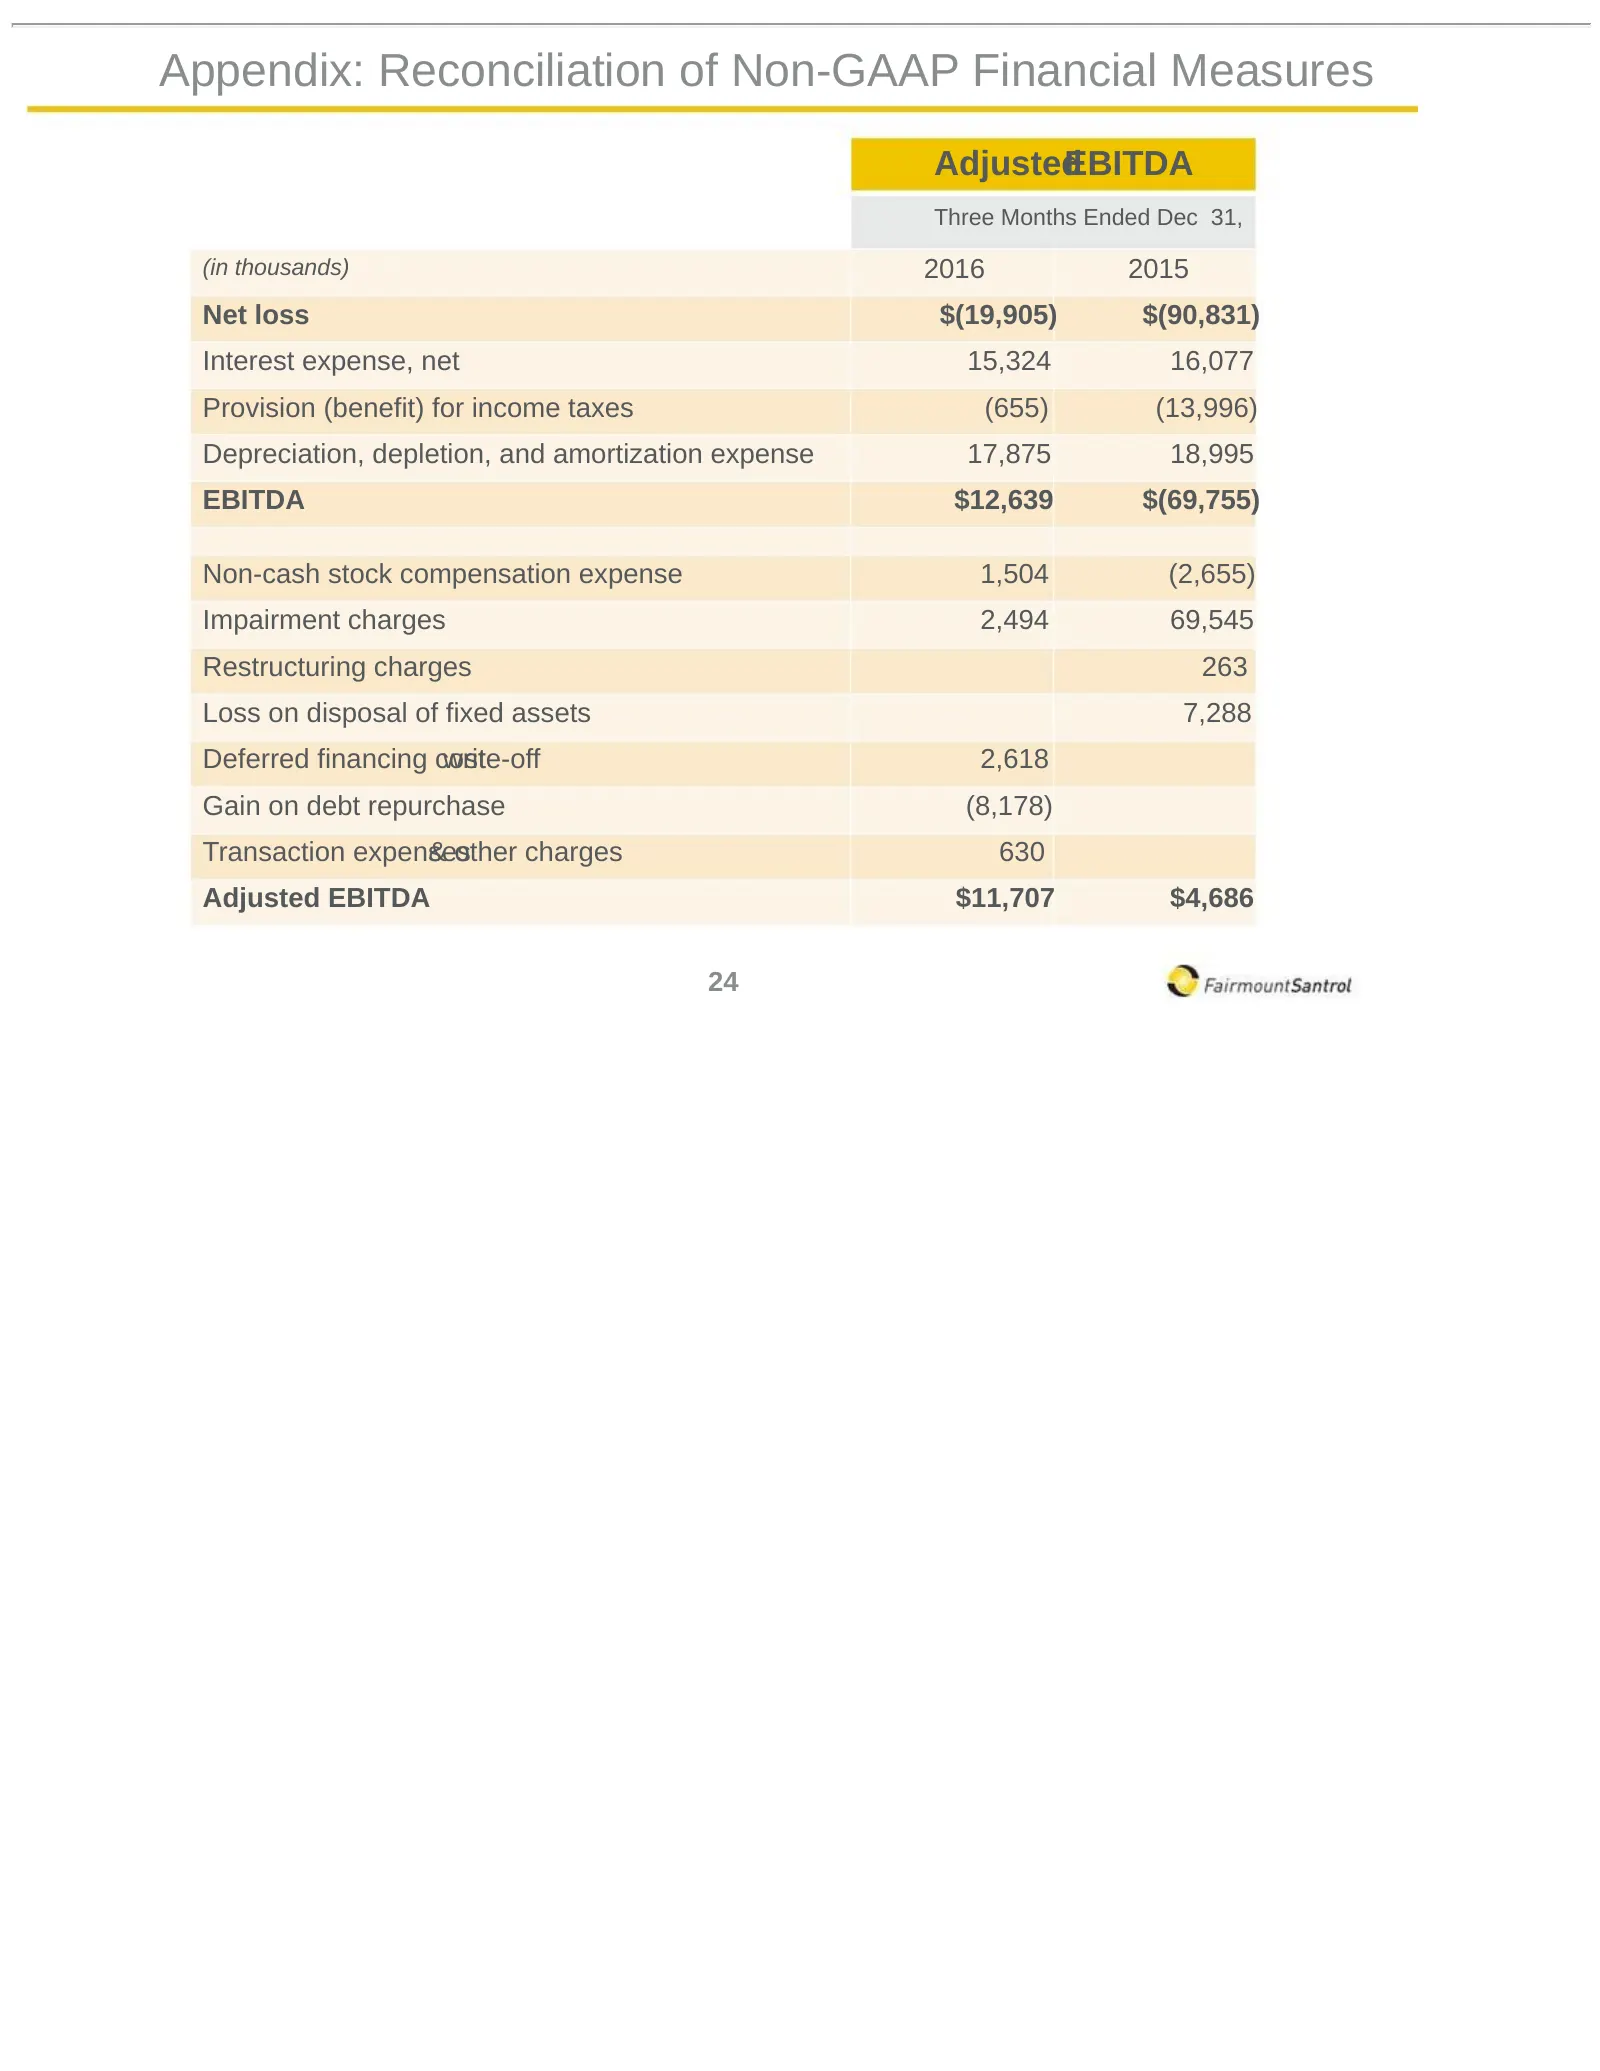
Appendix: Reconciliation of Non-GAAP Financial Measures Adjusted EBITDA Three Months Ended Dec 31, (in thousands) 2016 2015 Net loss $(19,905) $(90,831) Interest expense, net 15,324 16,077 Provision (benefit) for income taxes (655) (13,996) Depreciation, depletion, and amortization expense 17,875 18
Slide 26: Appendix: Total Facility Map
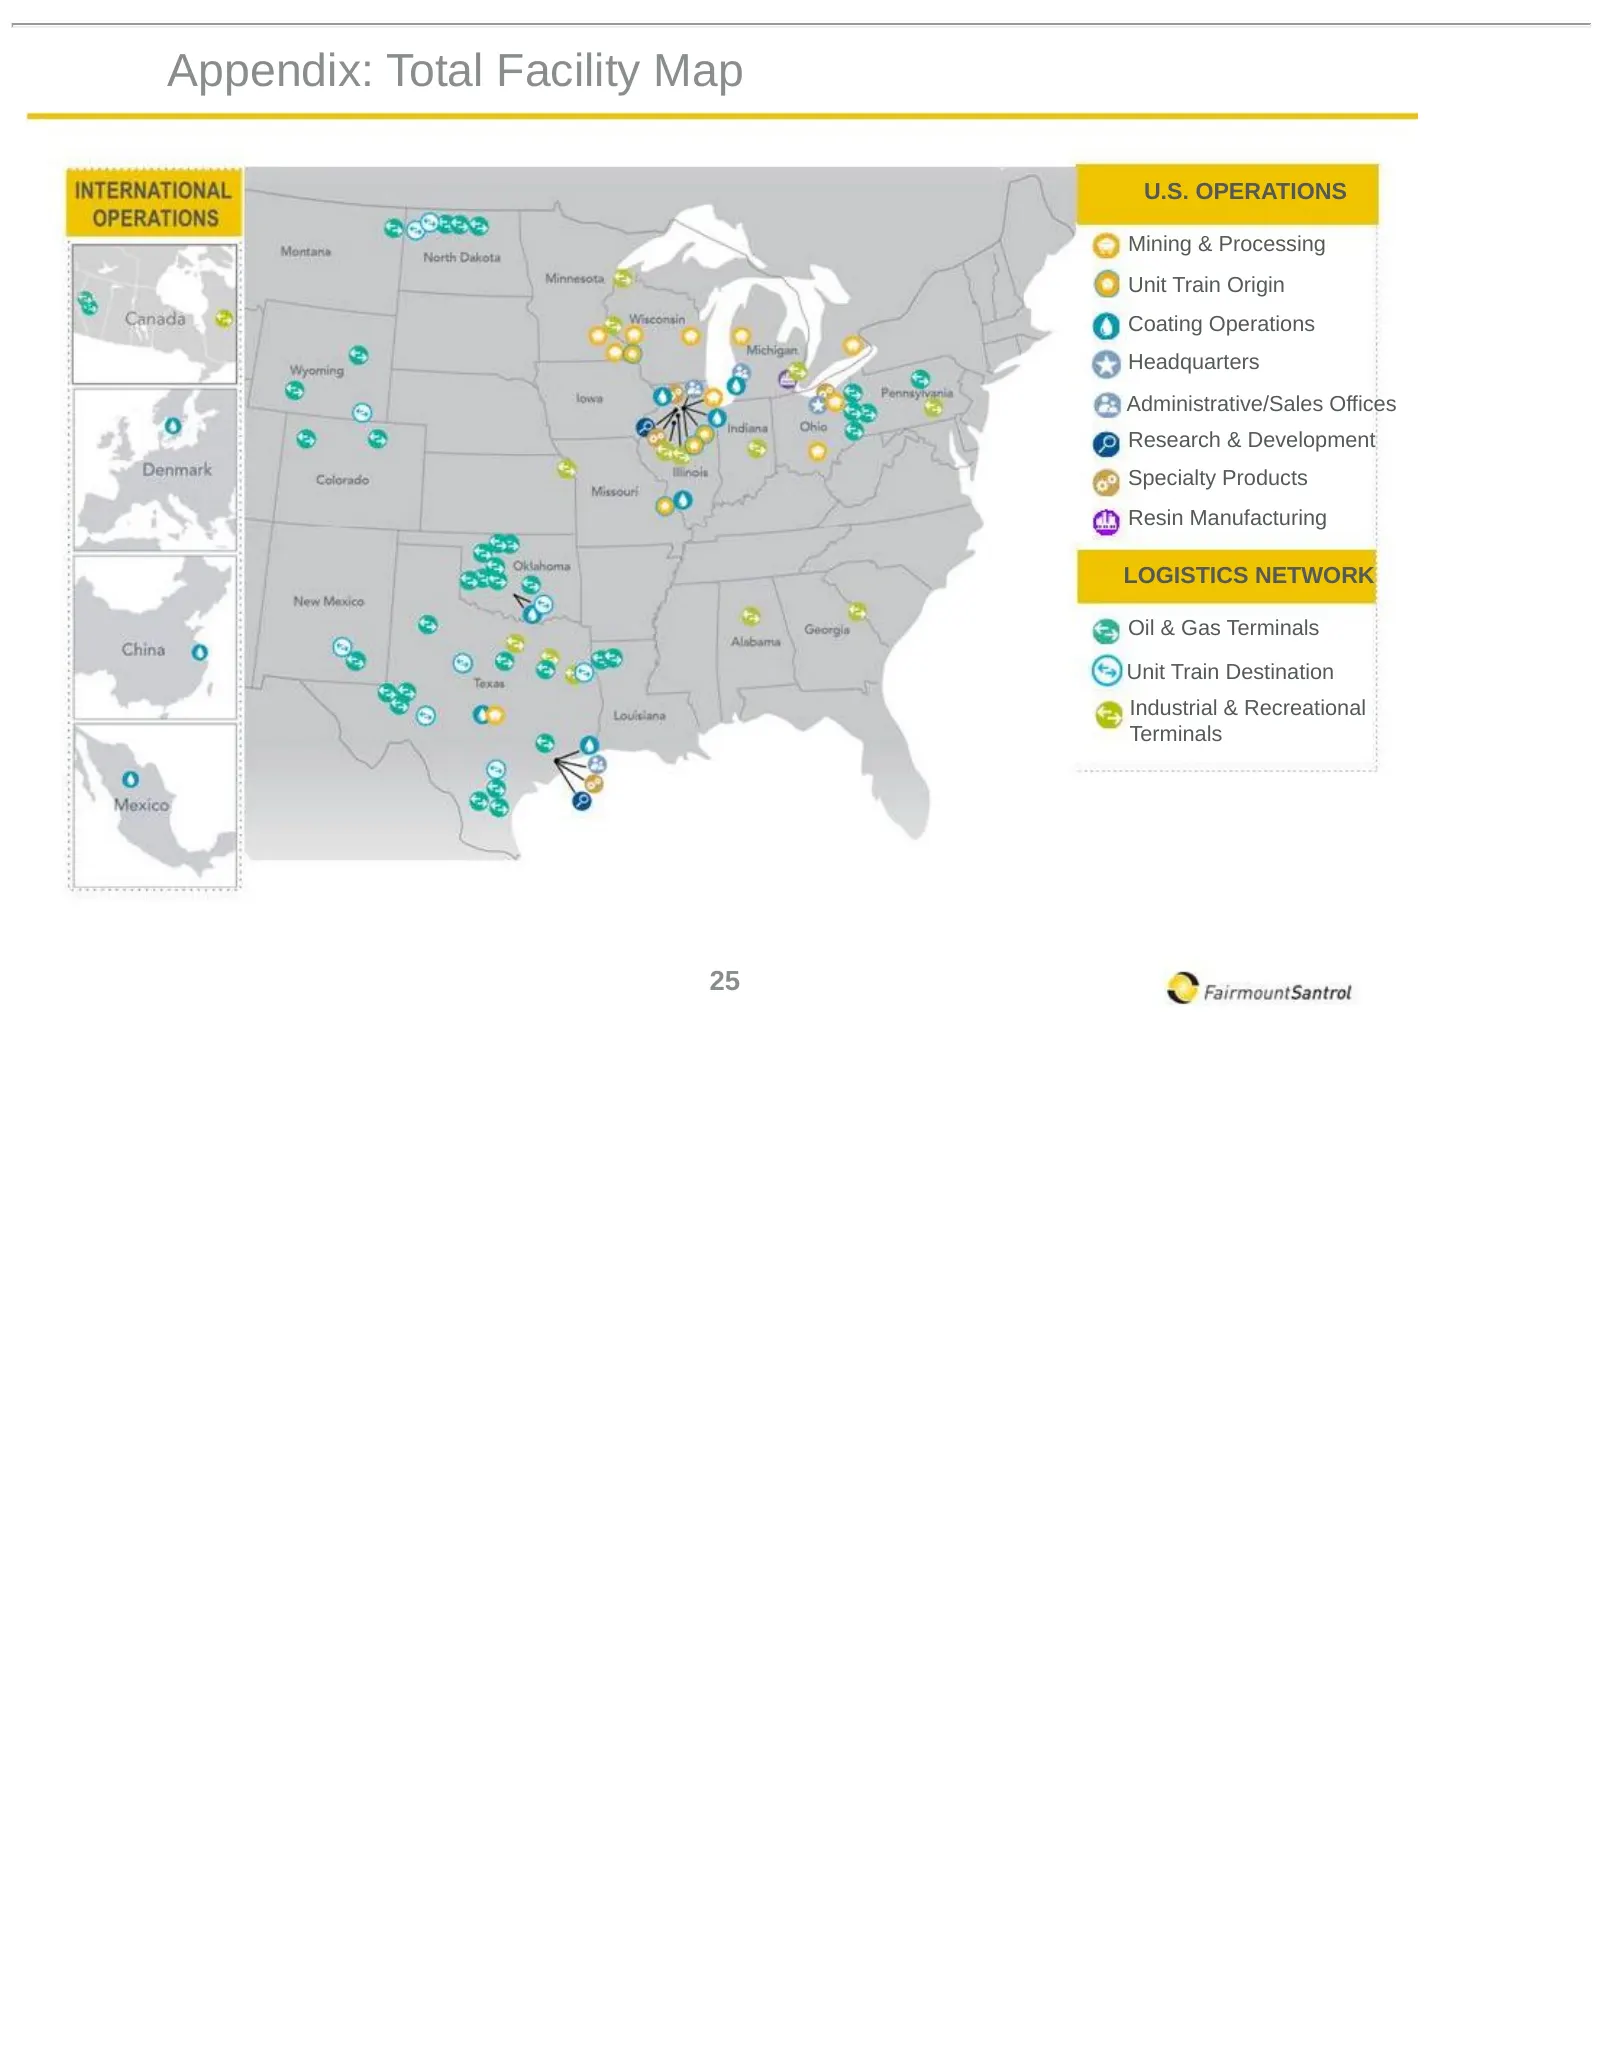
Appendix: Total Facility Map U.S. OPERATIONS Mining & Processing Unit Train Origin Coating Operations Headquarters Administrative/Sales Offices Research & Development Specialty Products Resin Manufacturing LOGISTICS NETWORK Oil & Gas Terminals Unit Train Destination Industrial & Recreational Termina
Source: SEC EDGAR · 8-K filed Mar 21, 2017
More decks from Fairmount Santrol Holdings Inc
 Merger or Acquisition (May 2018)44 slides · May 15, 2018
 Merger or Acquisition (May 2018)44 slides · May 9, 2018
 Debt Investor Presentation (May 2018)62 slides · May 8, 2018
 Merger or Acquisition (March 2018)31 slides · Mar 26, 2018
 Merger or Acquisition (January 2018)42 slides · Jan 3, 2018
 Merger or Acquisition (December 2017)26 slides · Dec 12, 2017