Sealed Air — Jefferies 2012 Global Industrial and A&D Conference
22 slides from Sealed Air's conference presentation, Aug 7, 2012
Slide 1: Sealed Air Update
Jefferies 2012 Global Industrial and A&D Conference SEALED AIR UPDATE August 7, 2012 —— William V. Hickey, CEO Carol P. Lowe, CFO Tod S. Christie, Treasurer Sealed Air
Slide 2: Safe Harbor and Regulation G Statement
_ SAFE HARBOR AND REGULATION G STAT NT . This. contains “fe ‘d-looking ” within the meaning of the Private Securities Ceca Reform Act of 1995. Forward-looking statements can be identified by such words as “anticipates,” “believes, lan,” “assumes,” “could, ” “estimates, ” “expects,” “intends,” “may,”
Slide 3: Who We Are
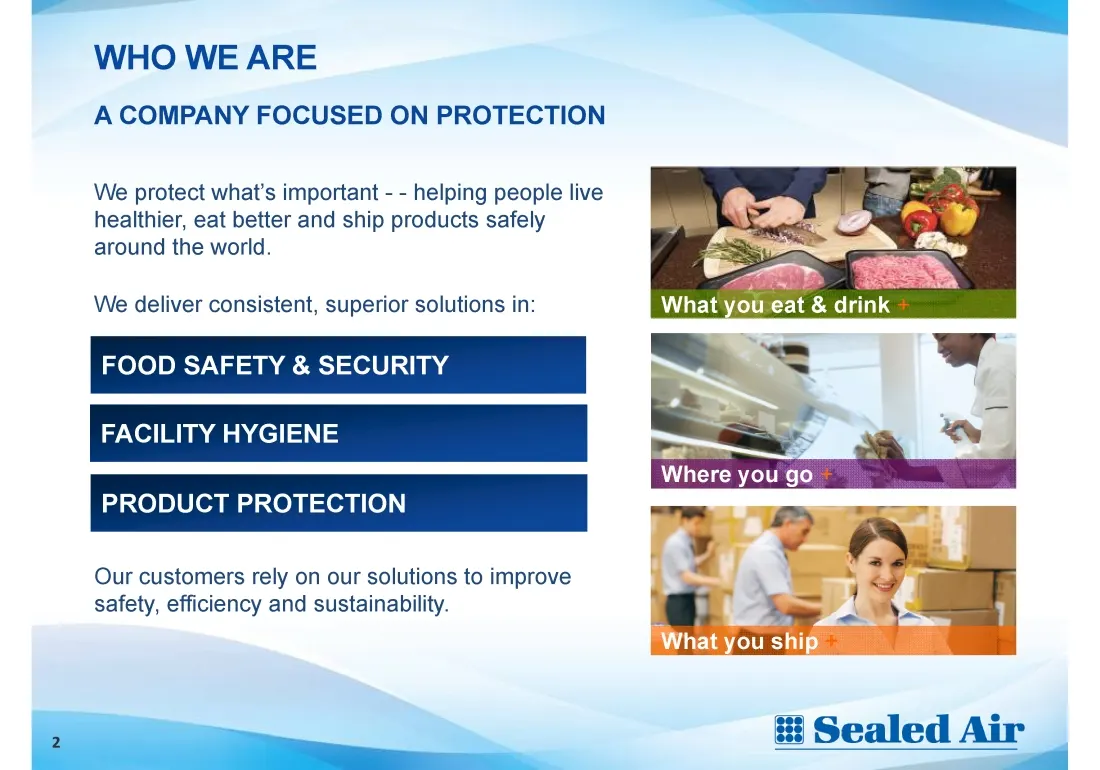
—_— WHO WE ARE A COMPANY FOCUSED ON PROTECTION We protect what's important - - helping people live healthier, eat better and ship products safely around the world. ea od We deliver consistent, superior solutions in: What you eat & drink FOOD SAFETY & SECURITY FACILITY HYGIENE PRODUCT PROTECTION Our
Slide 4: Uniquely Positioned with a Solid Business Profile
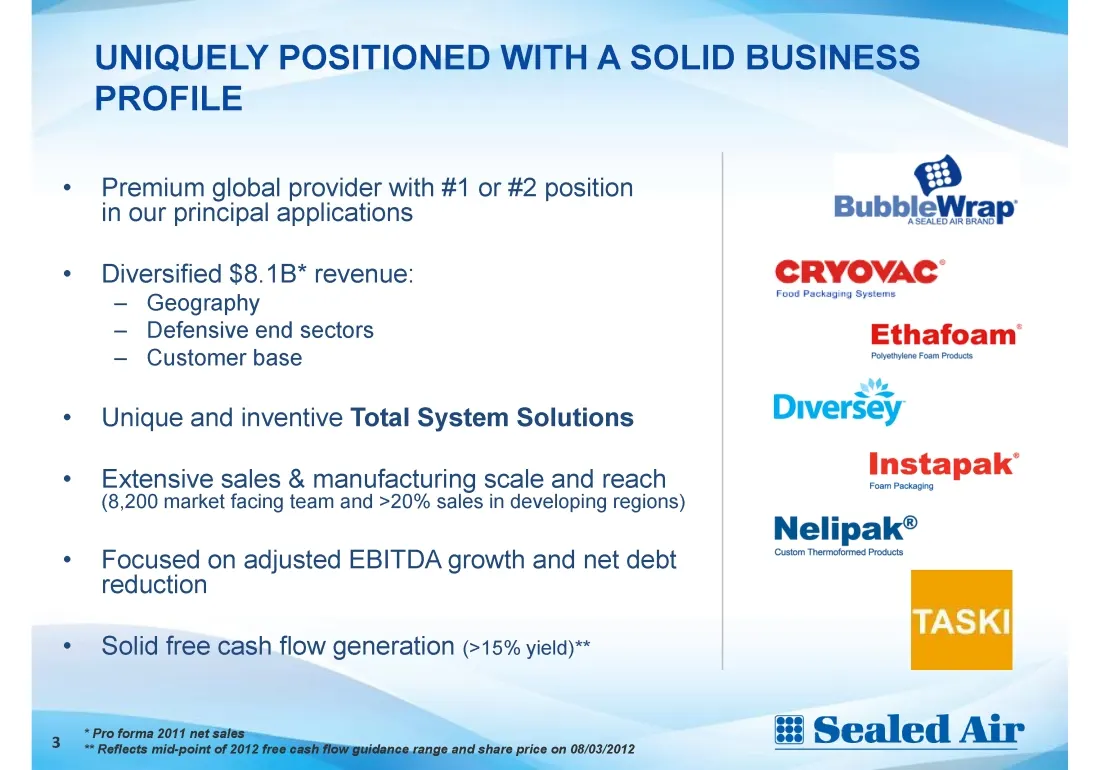
—_—_ UNIQUELY POSITIONED WITH A SOLID BUSINESS PROFILE * Premium global provider with #1 or #2 position @ ; in our principal applications BubbleWrap * Diversified $8.1B* revenue: CRYOVAC’ — Geography = — Defensive end sectors Ethafoam’ — Customer base mueeeniren ras * Unique and inventive Total Syst
Slide 5: Organic Sales Grew - But at a Slower Rate
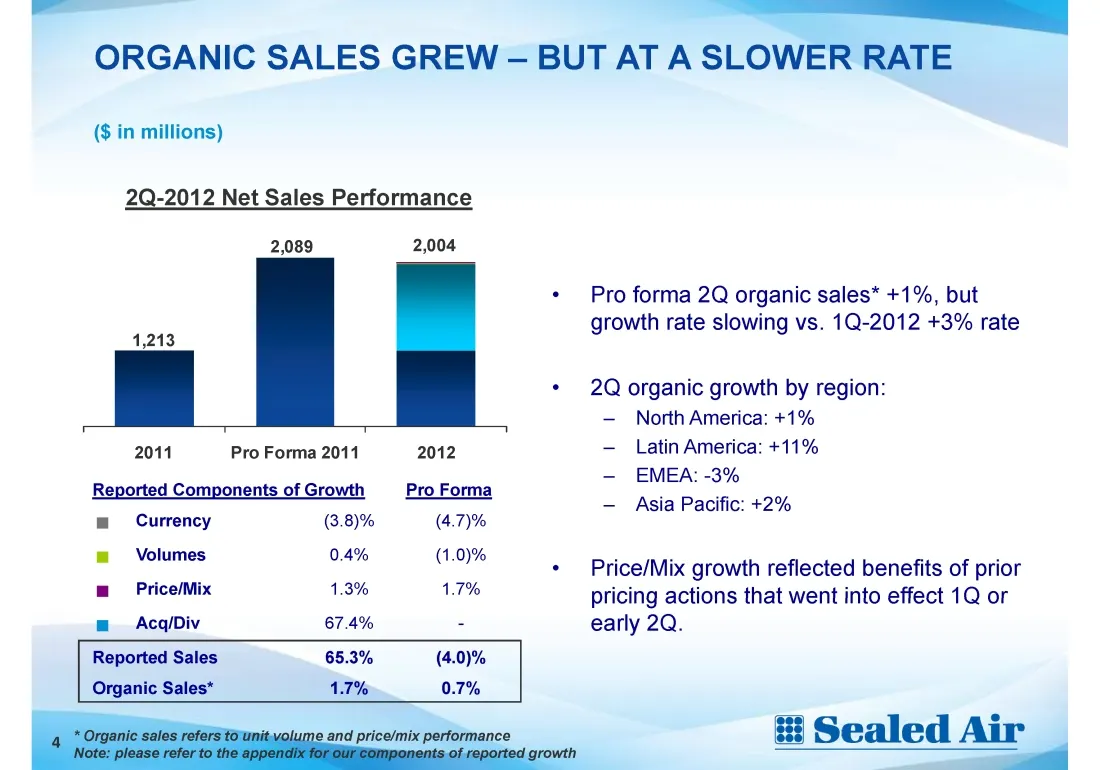
ORGANIC SALES GREW - BUT AT A SLOWER RATE ($ in millions) 4,213 2011 2Q-2012 Net Sales Performance 2,004 Pro Forma 2011 2012 Reported Components of Growth Pro Forma m= Currency (3.8)% (4.7)% m= Volumes 0.4% (1.0)% m_ Price/Mix 1.3% 1.7% wm Acq/Div 67.4% - Reported Sales 65.3% (4.0)% Organic Sales* 1
Slide 6: Volumes Impacted by Challenging Macro and Protein Industry Trends
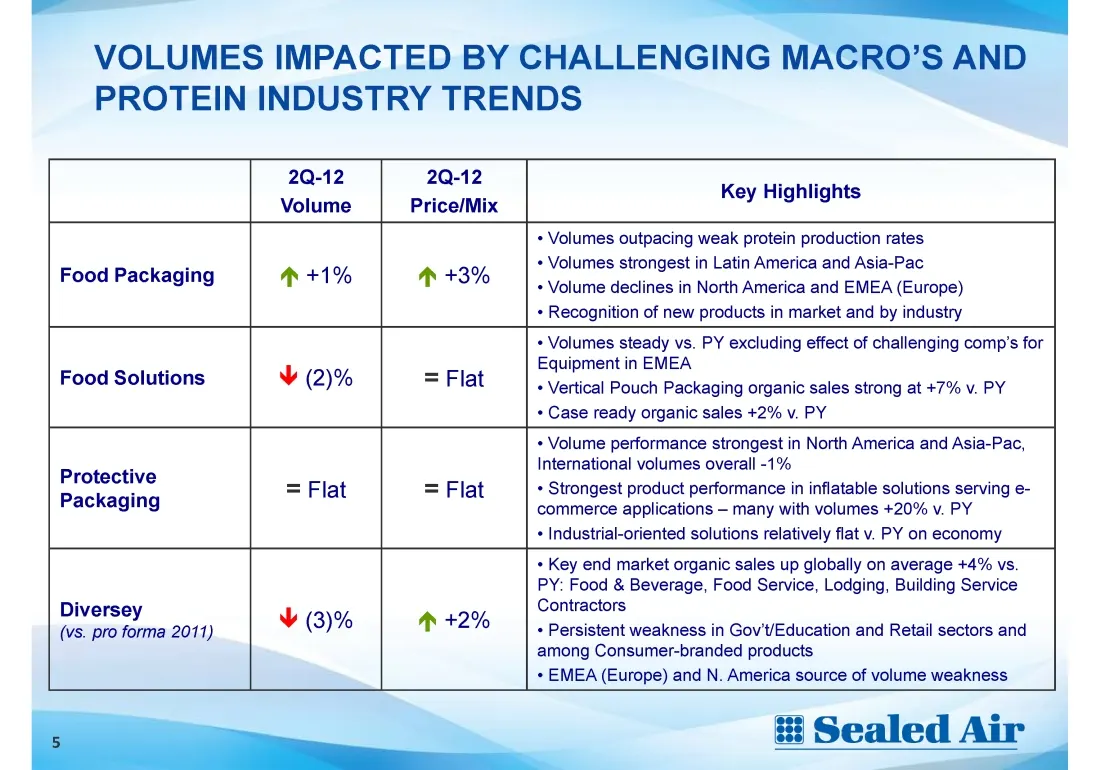
=—_ VOLUMES IMPACTED BY CHALLENGING MAGRO’S AND PROTEIN INDUSTRY TRENDS 2Q-12 Volume 2Q-12 Price/Mix Key Highlights Food Packaging aA +1% ®+3% + Volumes outpacing weak protein production rates + Volumes strongest in Latin America and Asia-Pac + Volume declines in North America and EMEA (Europe) + Re
Slide 7: Implementing $70 Million of New Cost Saving Measures
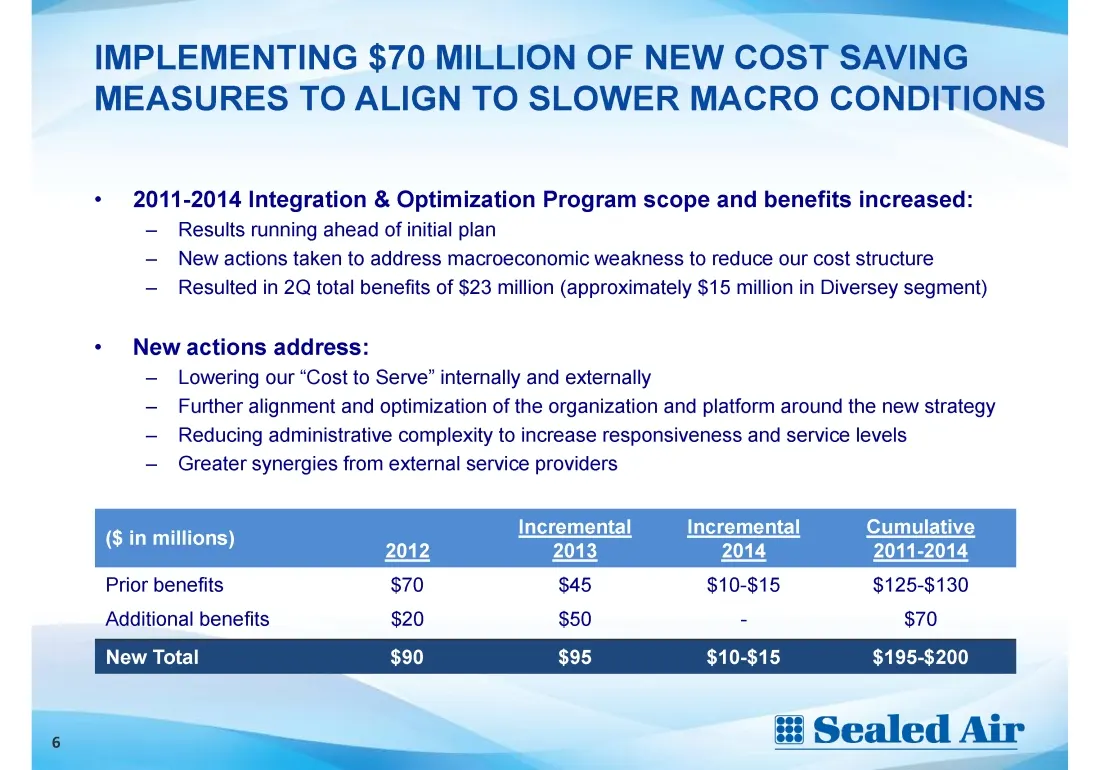
=— IMPLEMENTING $70 MILLION OF NEW COST SAVING MEASURES TO ALIGN TO SLOWER MACRO CONDITIONS + 2011-2014 Integration & Optimization Program scope and benefits increased: - Results running ahead of initial plan — New actions taken to address macroeconomic weakness to reduce our cost structure — Result
Slide 8: Financial Overview
Financial Overview Carol Lowe, CFO a Sealed Air
Slide 9: Lower Volumes and Other Factors Offset Cost Synergies and Positive Price/Cost Spread
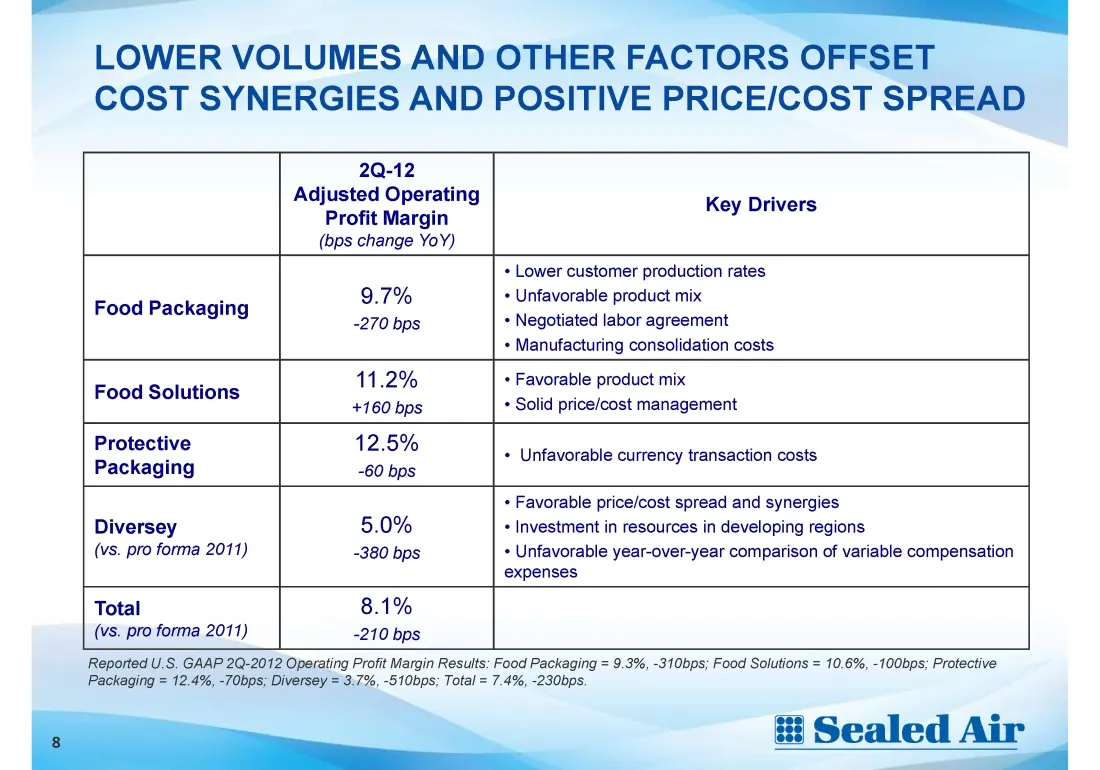
—_—_ LOWER VOLUMES AND OTHER FACTORS OFFSET COST SYNERGIES AND POSITIVE PRICE/COST SPREAD 2Q-12 Adjusted Operating Profit Margin (bps change YoY) Key Drivers + Lower customer production rates - 9.7% + Unfavorable product mix Food Packaging -270 bps + Negotiated labor agreement + Manufacturing consol
Slide 10: 2Q Food Packaging Adjusted Operating Profit Impacted by Unusual Items
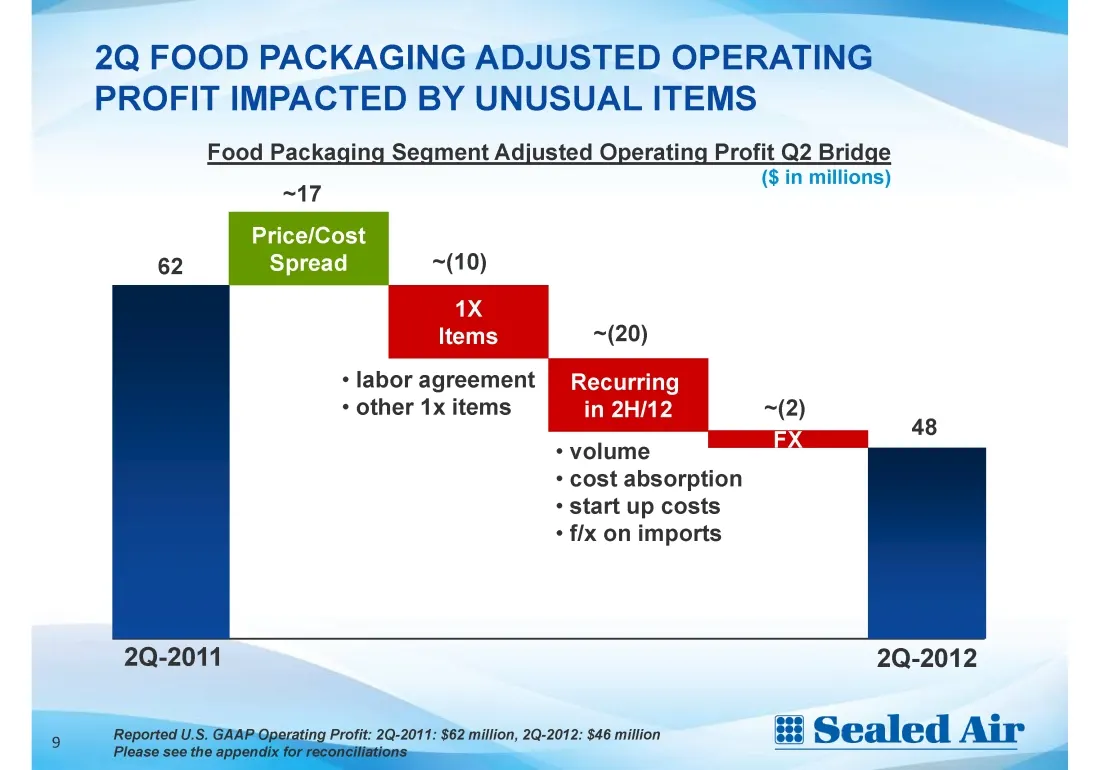
_ | 2Q FOOD PACKAGING ADJUSTED OPERATING PROFIT IMPACTED BY UNUSUAL ITEMS Food Packaging Segment Adjusted Operating Profit Q2 Bridge ~17 ($ in millions) Price/Cost Spread + labor agreement + other 1x items Recurring in 2H/12 * volume * cost absorption + start up costs + f/x on imports 2Q-2011 2Q-201
Slide 11: 2Q Diversey Adjusted Operating Profit
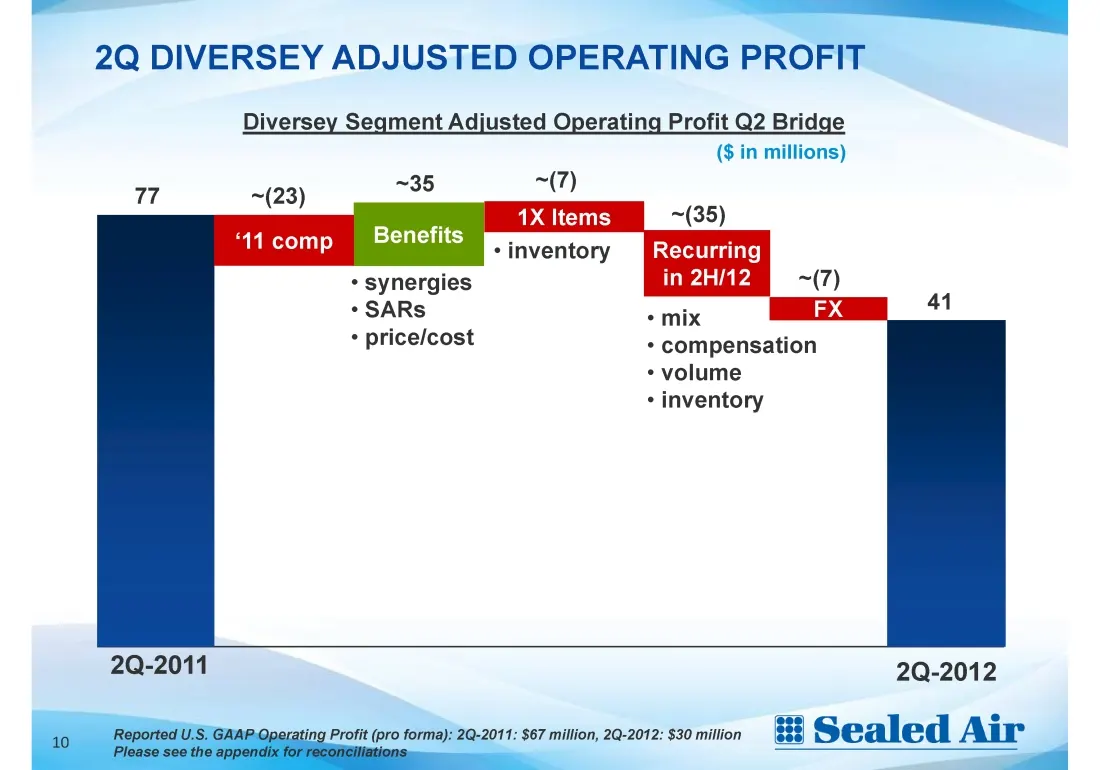
2Q DIVERSEY ADJUSTED OPERATING PROFIT Diversey Segment Adjusted Operating Profit Q2 Bridge ($ in millions) 7 ~(23) ~35 ~(7) 1X Items * inventory ~(35) Recurring ‘44comp _ Benefits * synergies in 2H/12 ~(7) . SARs + mix * price/cost * compensation * volume + inventory 2Q-2011 2Q-2012 : ‘ [oo eis omec
Slide 12: 2Q Food Packaging and Diversey Profit Performance Impacted YTD Adjusted EBITDA
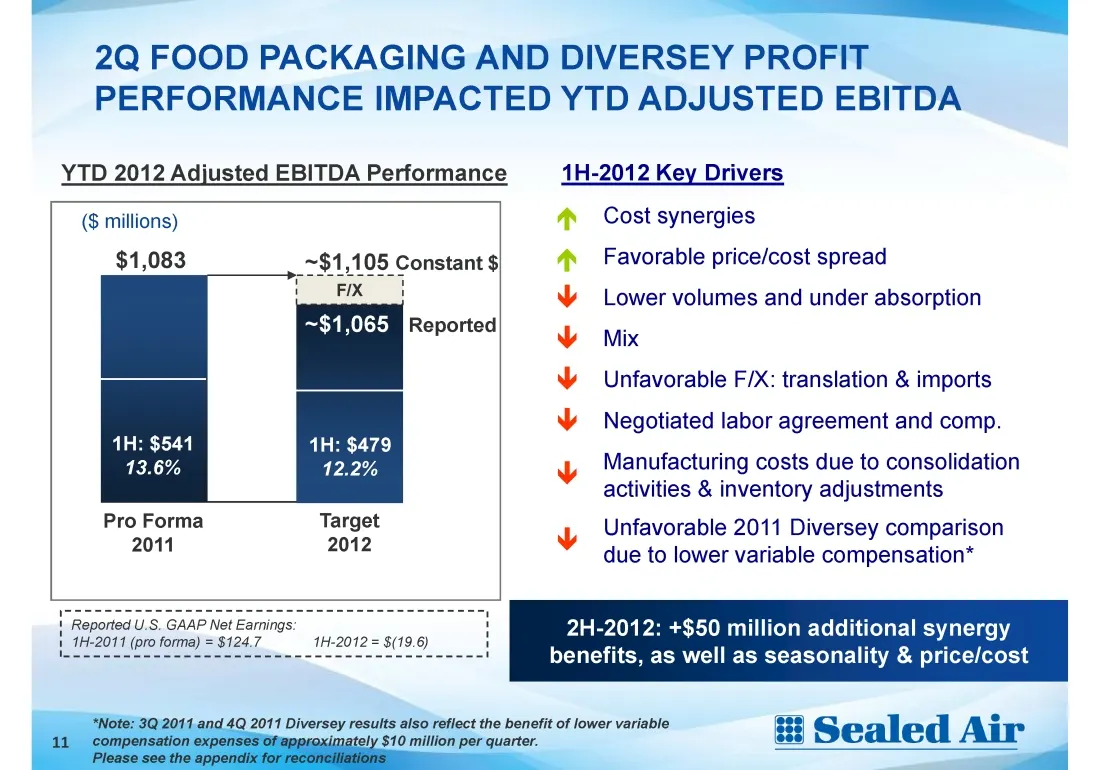
2Q FOOD PACKAGING AND DIVERSEY PROFIT PERFORMANCE IMPACTED YTD ADJUSTED EBITDA YTD 2012 Adjusted EBITDA Performance 1H-2012 Key Drivers ($ millions) Cost synergies $1,083 ~$1,105 Constant $ Favorable price/cost spread Lower volumes and under absorption ~$1,065 Etyyeacre) Mix Unfavorable F/X: transla
Slide 13: Free Cash Flow Continues to Build
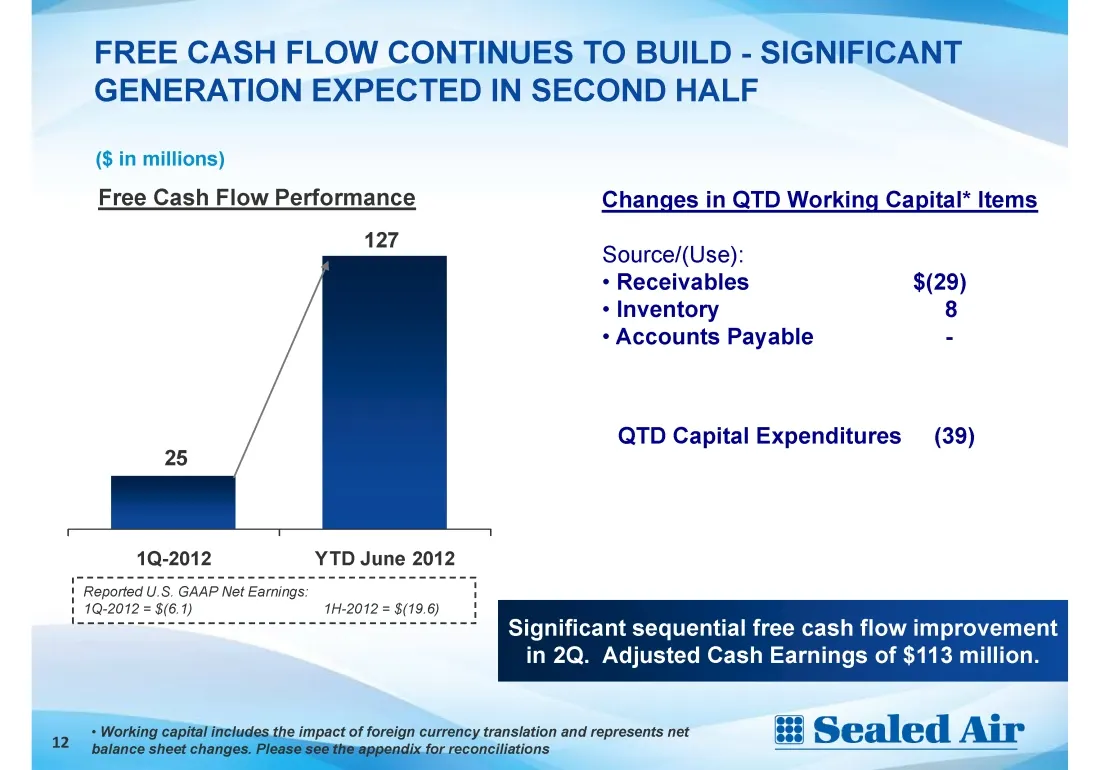
FREE CASH FLOW CONTINUES TO BUILD - SIGNIFICANT GENERATION EXPECTED IN SECOND HALF ($ in millions) Free Cash Flow Performance Changes in QTD Working Capital* Items 127 Source/(Use): - Receivables $(29) + Inventory 8 + Accounts Payable - QTD Capital Expenditures (39) 25 1Q-2012 YTD June 2012 ' Report
Slide 14: Targeting $4.95 Billion Net Debt by 12/31/2012
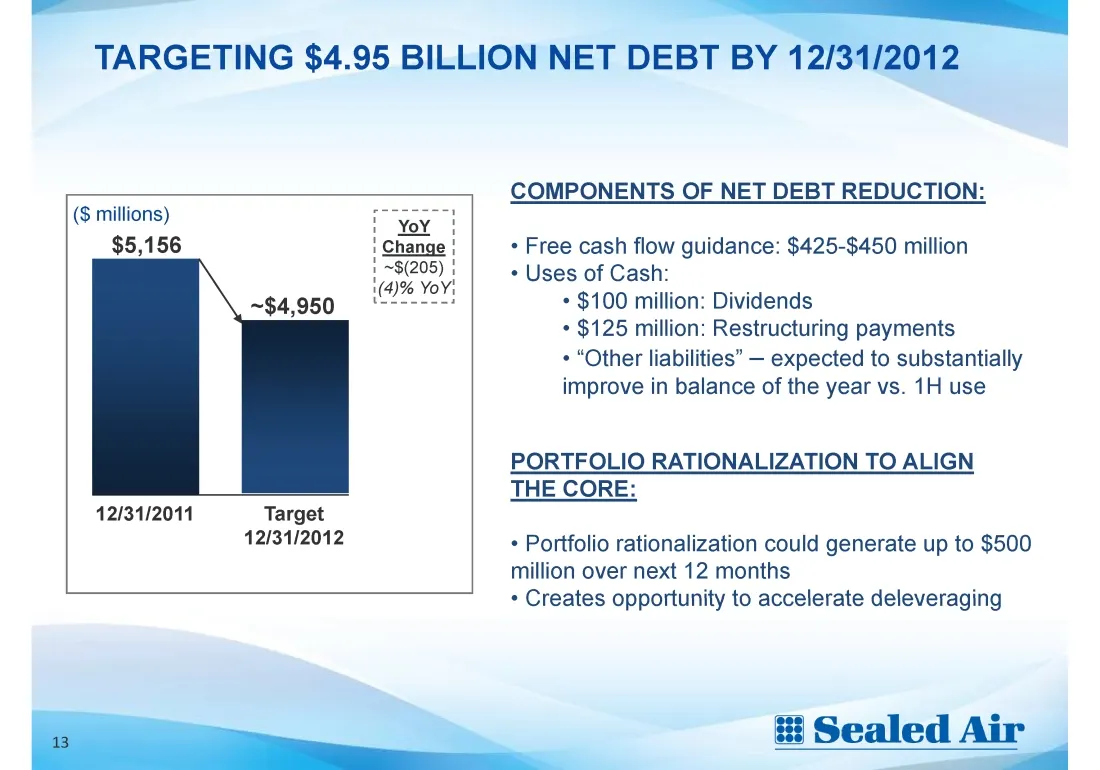
TARGETING $4.95 BILLION NET DEBT BY 12/31/2012 ($ millions) $5,156 12/31/2011 Target 12/31/2012 0 ae COMPONENTS OF NET DEBT REDUCTION: + Free cash flow guidance: $425-$450 million + Uses of Cash: * $100 million: Dividends * $125 million: Restructuring payments + “Other liabilities” — expected to sub
Slide 15: $1.3 Billion in Liquidity to Fund Obligations
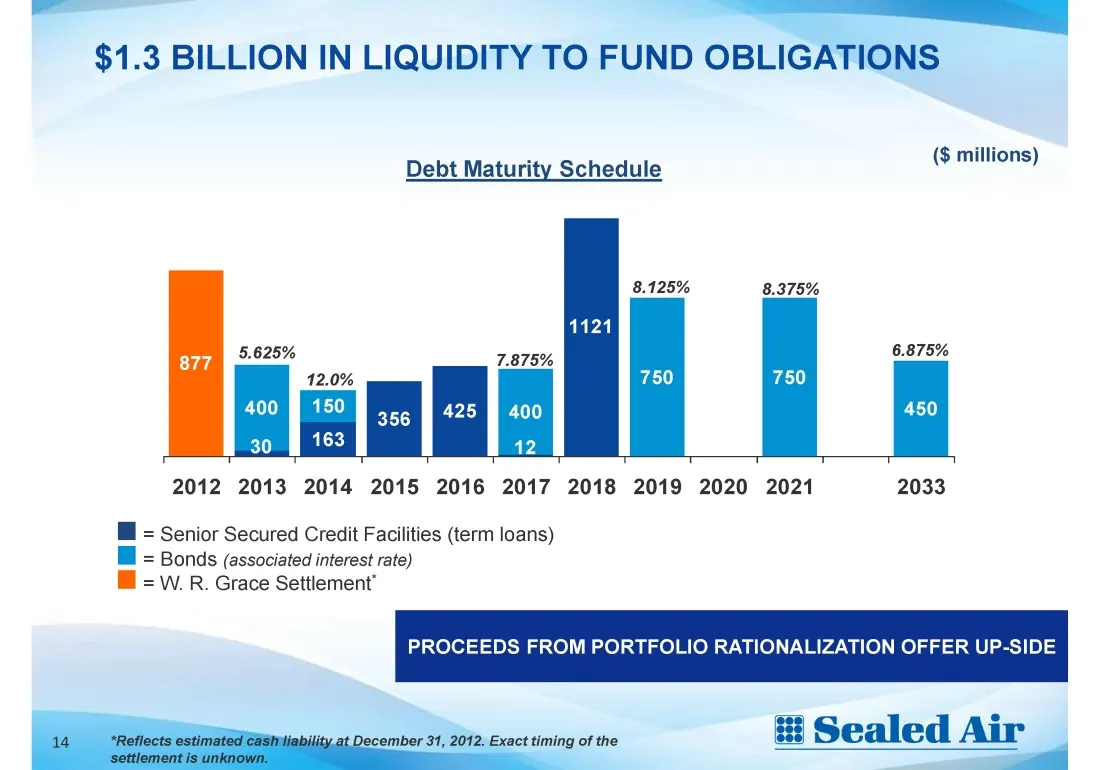
$1.3 BILLION IN LIQUIDITY TO FUND OBLIGATIONS Debt Maturity Schedule ($ millions) 8.375% 2012 2013 2014 2015 2016 2017 2018 2019 2020 2021 2033 Il = Senior Secured Credit Facilities (term loans) = Bonds (associated interest rate) l@ =W.R. Grace Settlement’ PROCEEDS FROM PORTFOLIO RATIONALIZATION OFF
Slide 16: Focused on Solid Execution To...
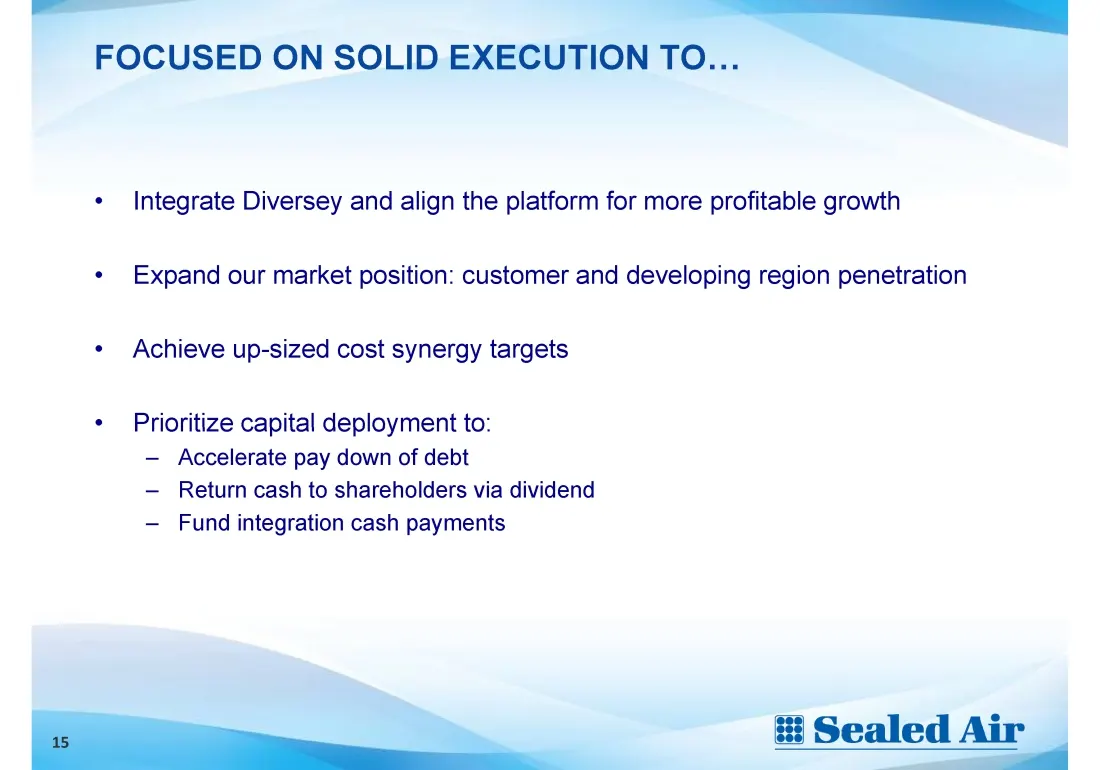
—_—_ FOCUSED ON SOLID EXECUTION TO... « Integrate Diversey and align the platform for more profitable growth « Expand our market position: customer and developing region penetration + Achieve up-sized cost synergy targets «Prioritize capital deployment to: — Accelerate pay down of debt — Return cash
Slide 17: Q&A
Q&A SS # Sealed Air _ Air
Slide 18: Appendix
Appendix 2 eer ti(‘zé Seiler
Slide 19: Components of Change in Net Sales - Business Segments and Other
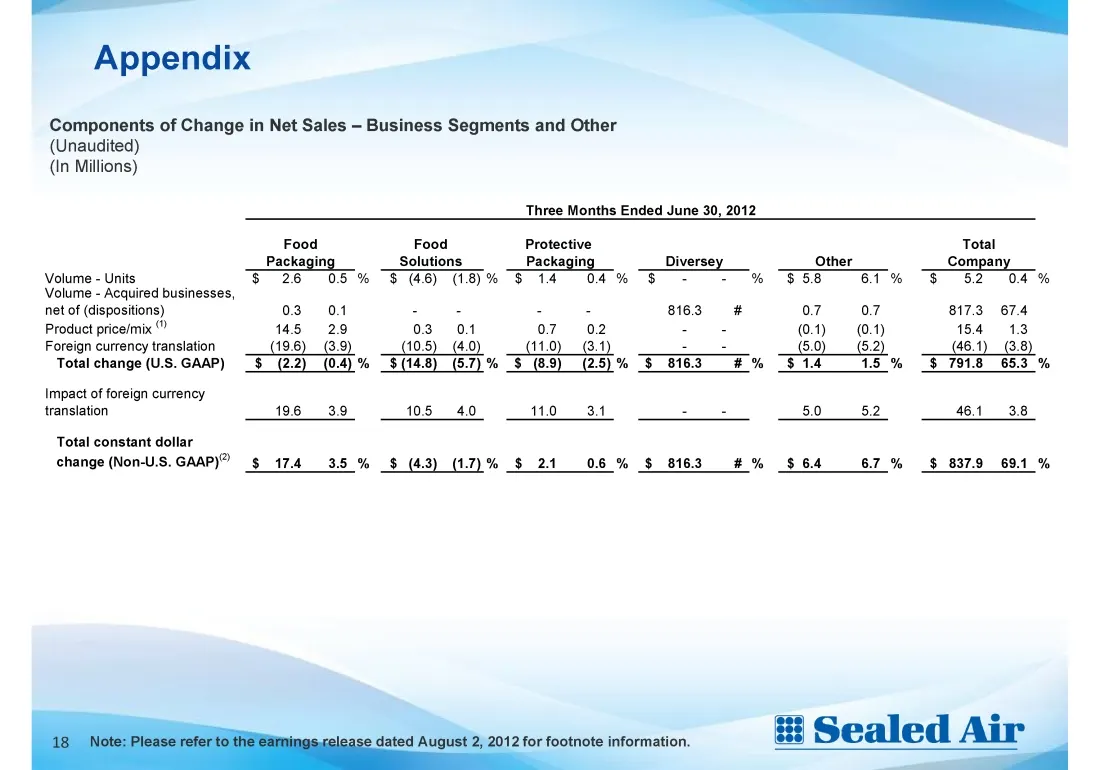
Appendix Components of Change in Net Sales — Bu: (Unaudited) ess Segments and Other (In Millions) Three Months Ended June 30, 2012 Foo Food Protective Total packaging Solutions Packaging Diversey Other Company Volume - Units 3 05% S (46) (18% S$ 14 04% S - - % $58 61% $§ 52 04% Volume - Acquired bus
Slide 20: Reconciliation of U.S. GAAP Operating Profit to Non-U.S. GAAP Adjusted Operating Profit & Pro Forma Results
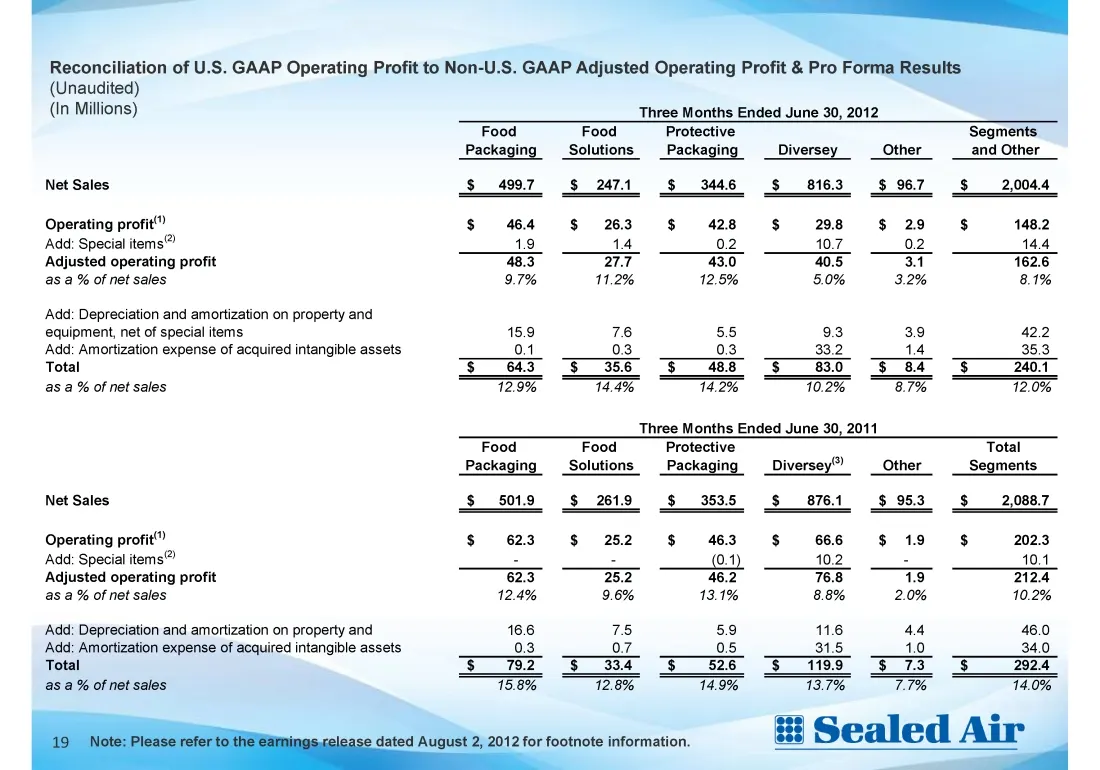
—_—_ os Reconciliation of U.S. GAAP Operating Profit to Non-U.S. GAAP Adjusted Operating Profit & Pro Forma Results (Unaudited) (In Millions) Net Sales Operating profit ‘Add: Special items” Adjusted operating profit as a % of net sales ‘Add: Depreciation and amortization on property and equipment, n
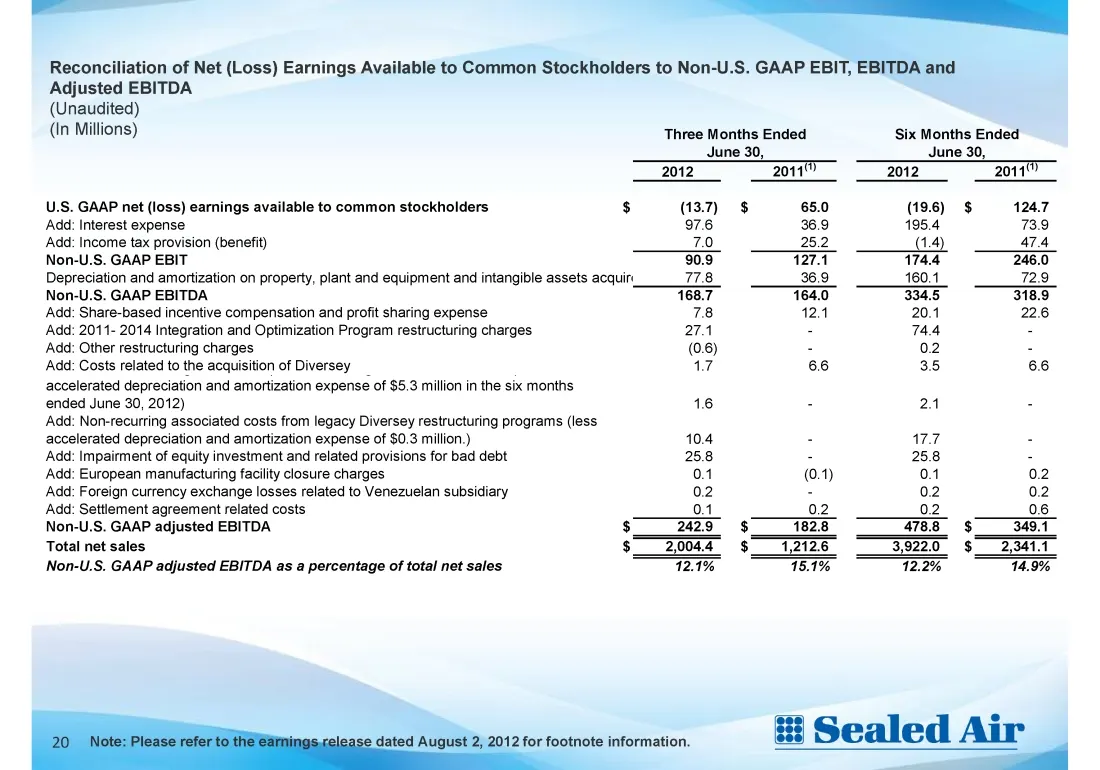
Slide 21: Reconciliation of Net (Loss) Earnings to Non-U.S. GAAP EBIT, EBITDA and Adjusted EBITDA
Reconciliation of Net (Loss) Earnings Available to Common Stockholders to Non-U.S. GAAP EBIT, EBITDA and Adjusted EBITDA (Unaudited) (In Millions) Three Months Ended Six Months Ended June 30, June 30, 2012 20117 2012 20017 U.S. GAAP net (loss) earnings available to common stockholders $ $ 65.0 (196)
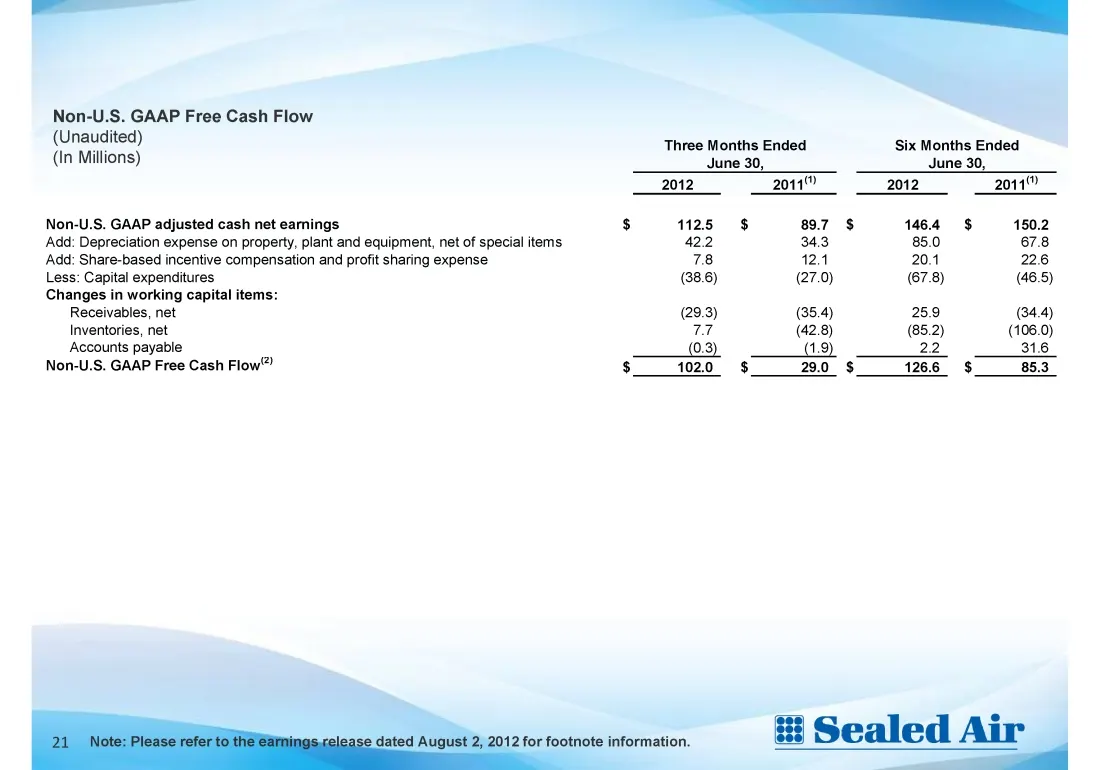
Slide 22: Non-U.S. GAAP Free Cash Flow
Non-U.S. GAAP Free Cash Flow (Unaudited) (In Millions) Non-U.S. GAAP adjusted cash net earnings ‘Add: Depreciation expense on property, plant and equipment, net of special items ‘Add: Share-based incentive compensation and profit sharing expense Less: Capital expenditures Changes in working capital
Source: SEC EDGAR · 8-K filed Aug 7, 2012
More decks from Sealed Air Corporation
 Q3 2025 Earnings Presentation17 slides · Nov 4, 2025
 Q2 2025 Earnings Presentation17 slides · Aug 5, 2025
 Q1 2025 Earnings Presentation15 slides · May 6, 2025
 Q4 2024 Earnings Presentation21 slides · Feb 25, 2025
 Q3 2024 Earnings Presentation20 slides · Nov 7, 2024
 Q2 2024 Earnings Presentation20 slides · Aug 8, 2024