IRIS RegTech Solutions Limited · NSE:IRIS
IRIS RegTech Solutions — IRIS Business Services — Investor Presentation (May 2018)
12 slides from IRIS RegTech Solutions's investor presentation, May 30, 2018
Slide 1: IRIS Business Services Limited - Investor Presentation filing letter to BSE
IRIS Business Services Limited 31st May, 2018 To, BSE Limited Corporate Relationship Department, Phiroze Jeejeebhoy Towers, Dalal Street, Mumbai 400 001. Scrip Code: 540735 Sub: Investor Presentation Dear Sir/ Madam, Pursuant to Regulation 30 of SEBI (Listing Obligations and Disclosure Requirements

Slide 2: IRIS Compliance, Data & Analytics
IRIS Compliance, Data & Analytics Investor Presentation May 30, 2018 1
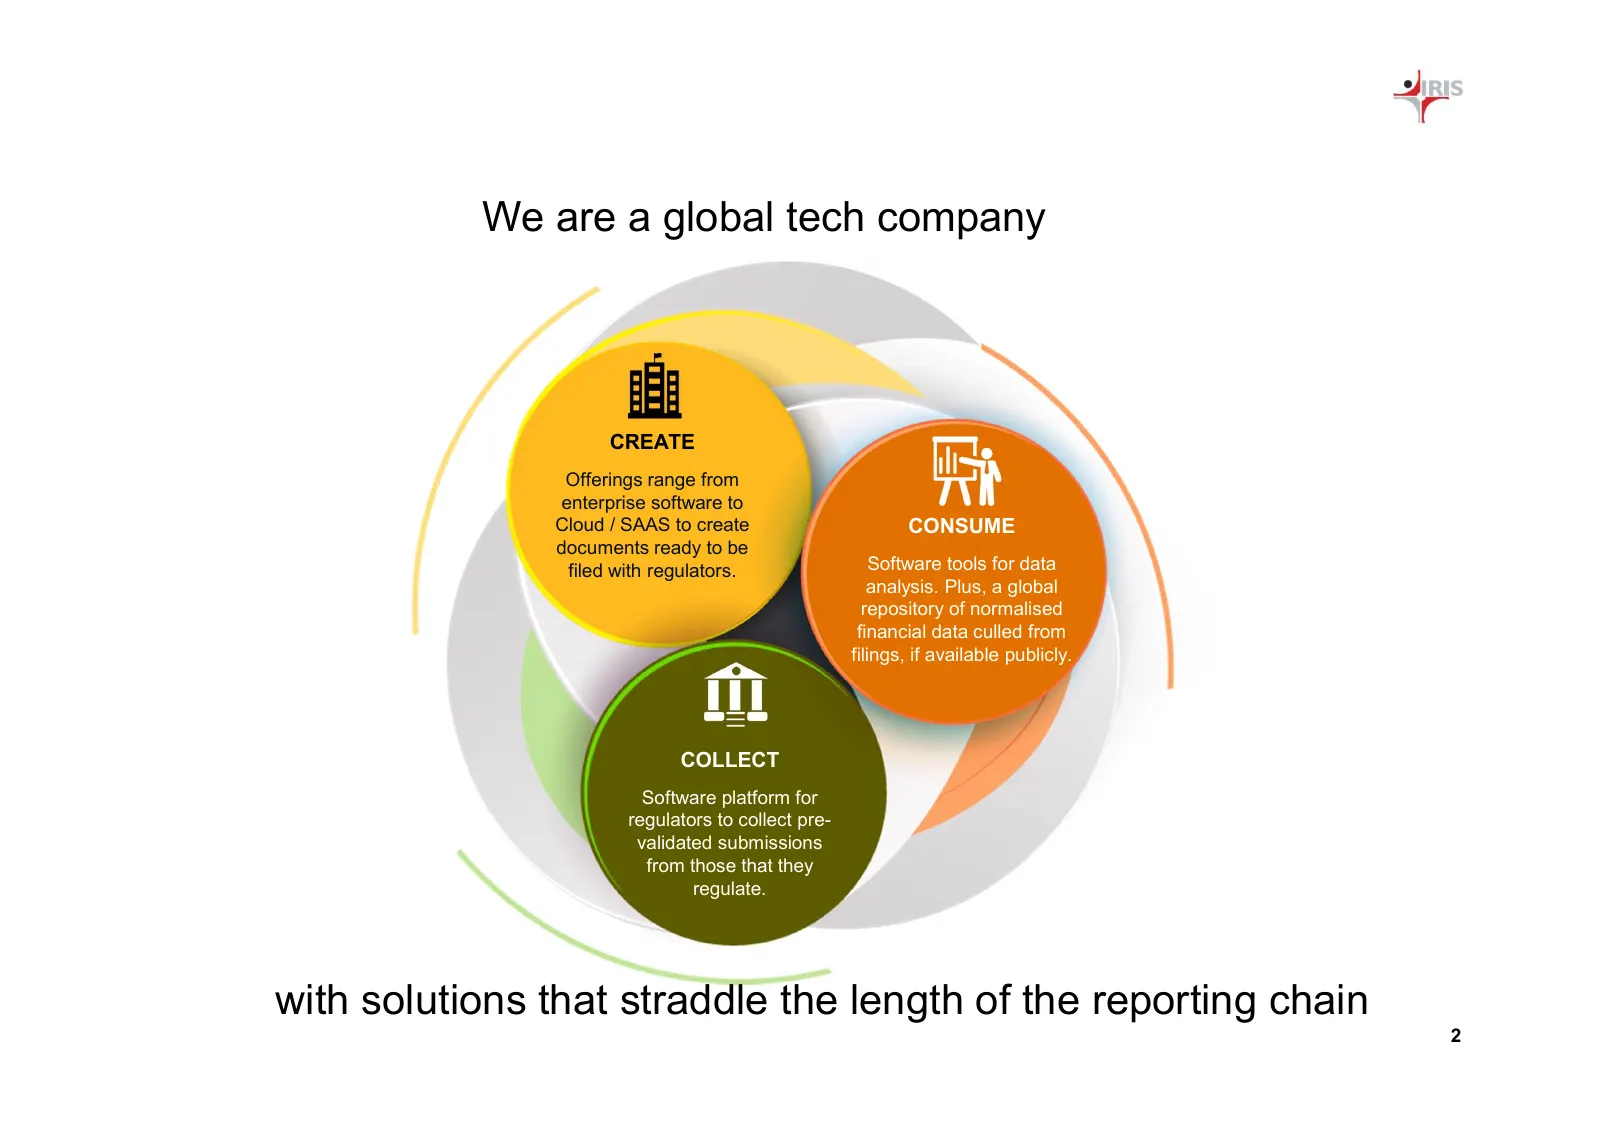
Slide 3: We are a global tech company
We are a global tech company CREATE Offerings range from enterprise software to Cloud / SAAS to create CONSUME documents ready to be filed with regulators. Software tools for data analysis. Plus, a global repository of normalised financial data culled from filings, if available publicly. COLLECT Sof
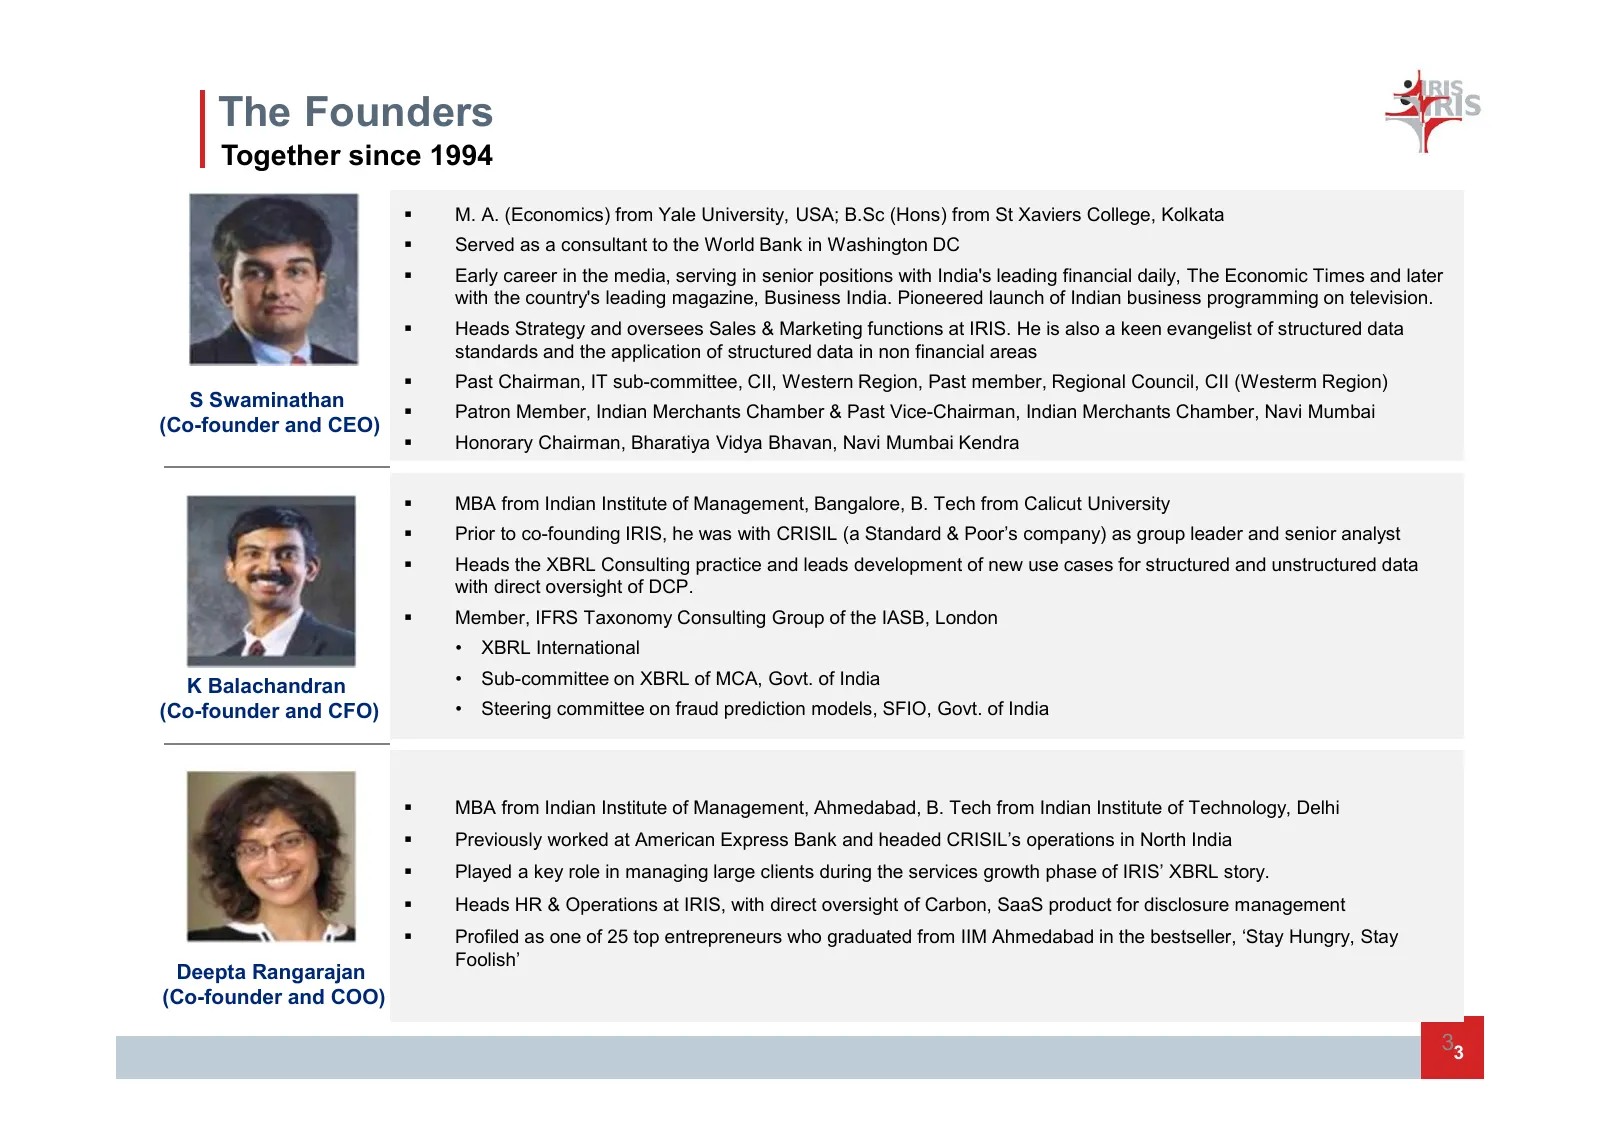
Slide 4: The Founders
The Founders Together since 1994 M. A. (Economics) from Yale University, USA; B.Sc (Hons) from St Xaviers College, Kolkata Served as a consultant to the World Bank in Washington DC Early career in the media, serving in senior positions with India's leading financial daily, The Economic Times a
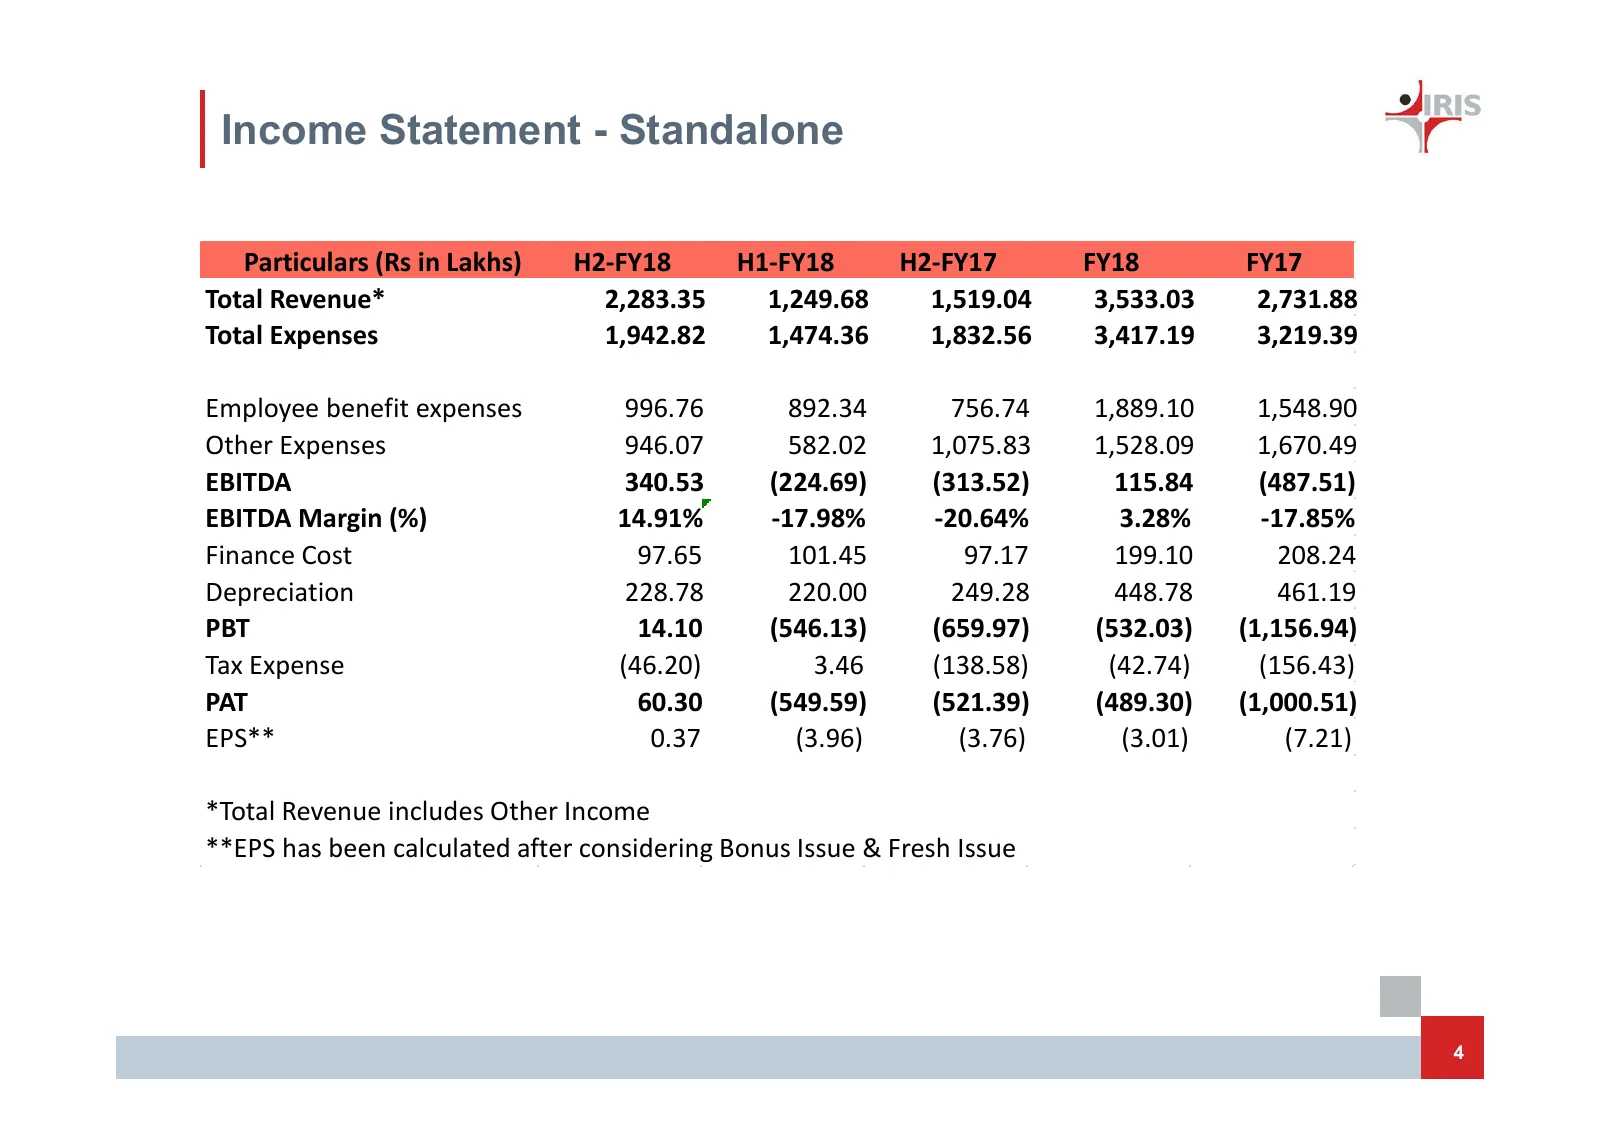
Slide 5: Income Statement - Standalone
Income Statement - Standalone Particulars (Rs in Lakhs) H2-FY18 H1-FY18 H2-FY17 FY18 FY17 Total Revenue* 2,283.35 1,249.68 1,519.04 3,533.03 2,731.88 Total Expenses 1,942.82 1,474.36 1,832.56 3,417.19 3,219.39 Employee benefit expenses 996.76 892.34 756.74 1,889.10 1,548.90 Other Expenses 946.07 582
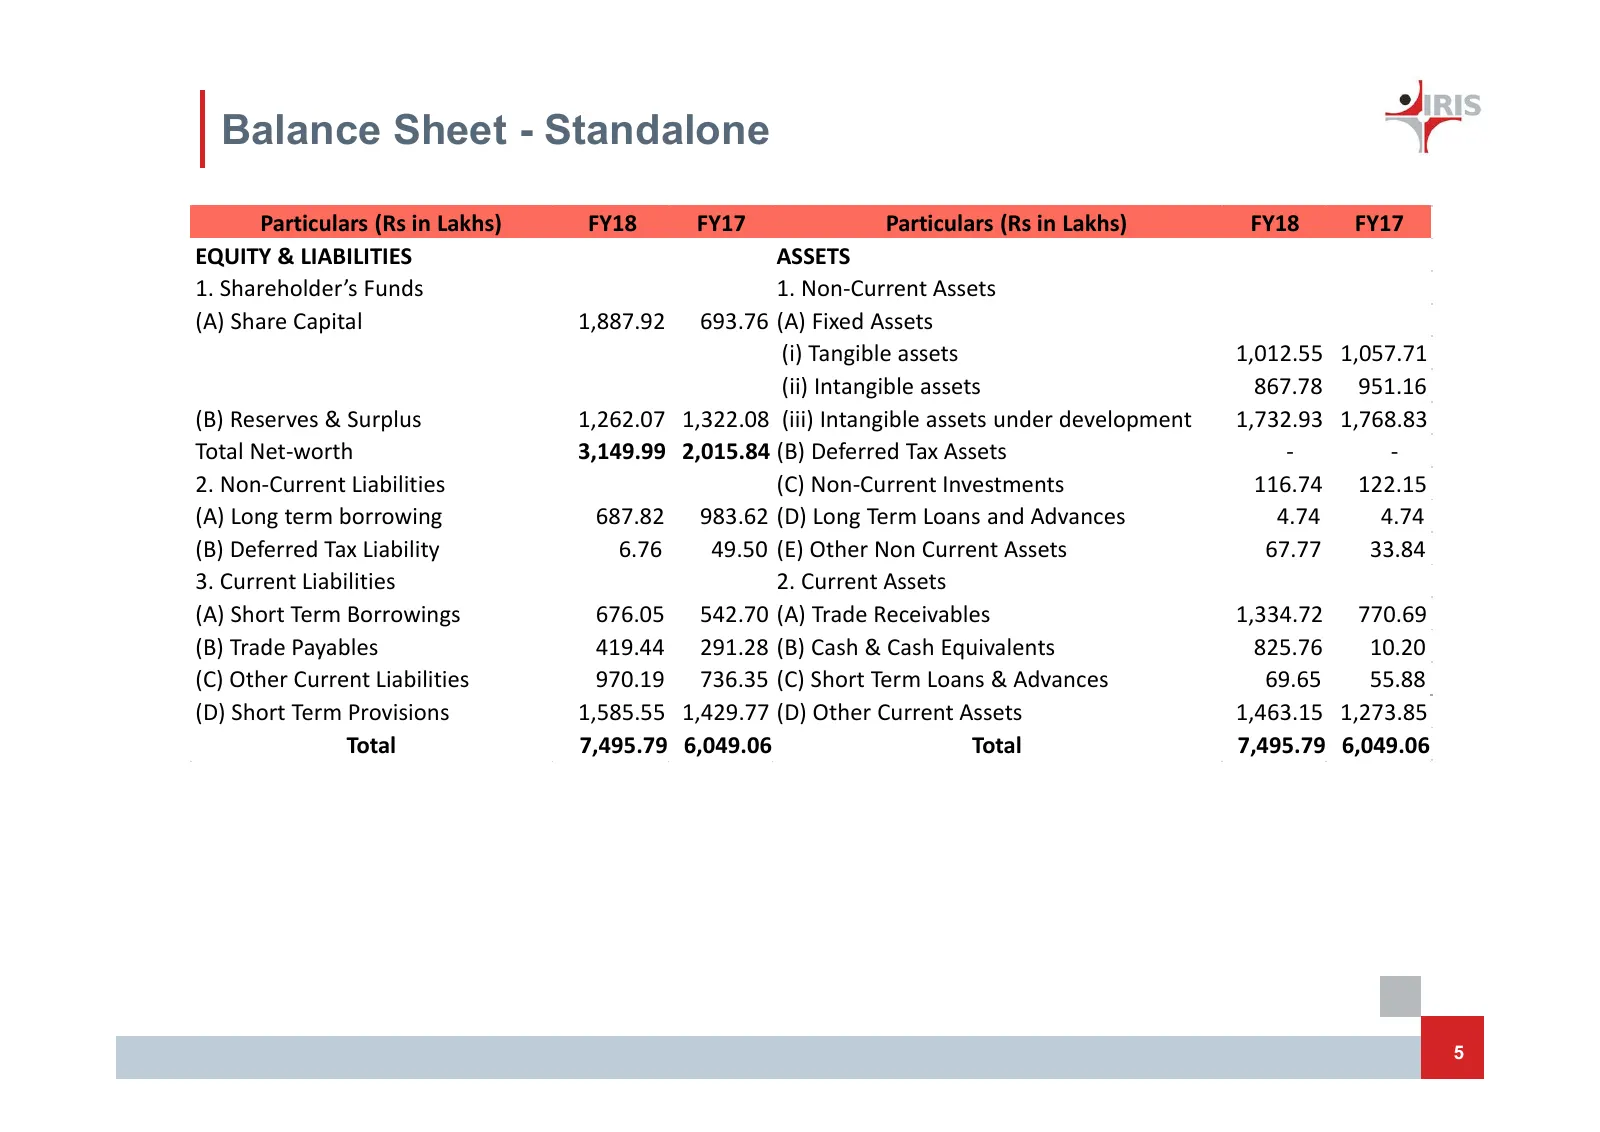
Slide 6: Balance Sheet - Standalone
Balance Sheet - Standalone Particulars (Rs in Lakhs) FY18 FY17 Particulars (Rs in Lakhs) FY18 FY17 EQUITY & LIABILITIES ASSETS 1. Shareholder’s Funds 1. Non-Current Assets (A) Share Capital 1,887.92 693.76 (A) Fixed Assets (i) Tangible assets 1,012.55 1,057.71 (ii) Intangible assets 867.78 951.16 (B
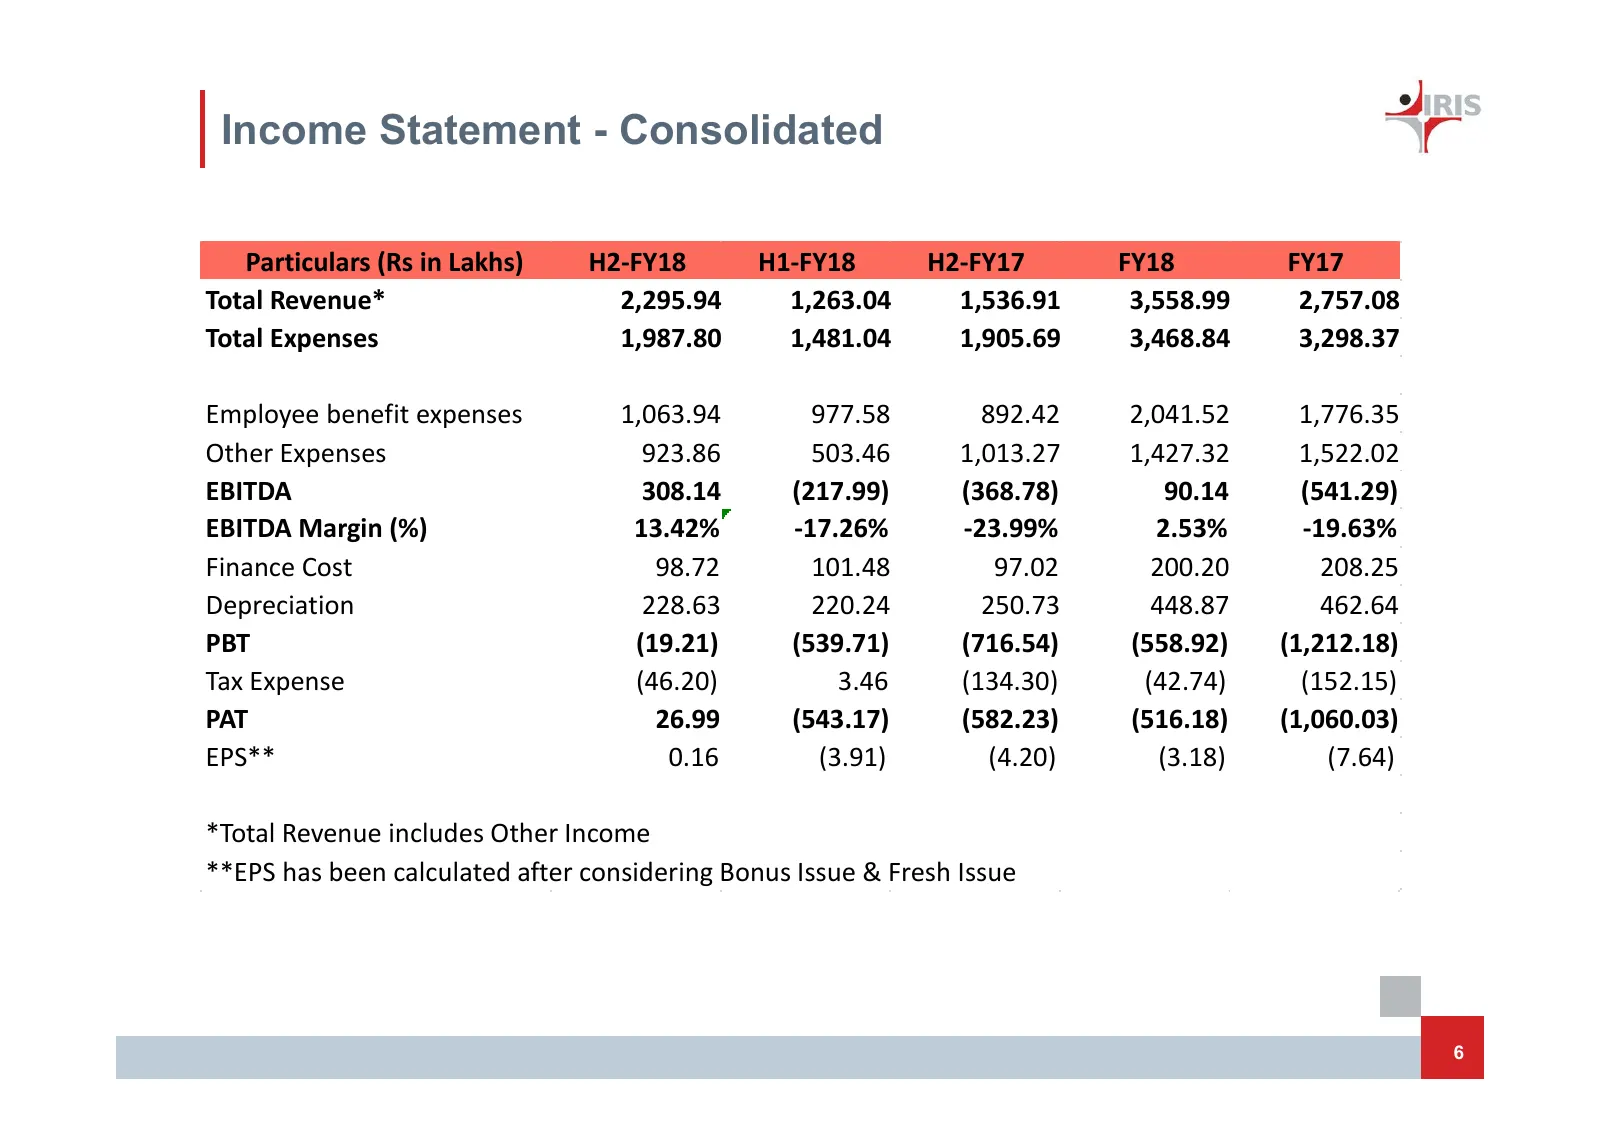
Slide 7: Income Statement - Consolidated
Income Statement - Consolidated Particulars (Rs in Lakhs) H2-FY18 H1-FY18 H2-FY17 FY18 FY17 Total Revenue* 2,295.94 1,263.04 1,536.91 3,558.99 2,757.08 Total Expenses 1,987.80 1,481.04 1,905.69 3,468.84 3,298.37 Employee benefit expenses 1,063.94 977.58 892.42 2,041.52 1,776.35 Other Expenses 923.86
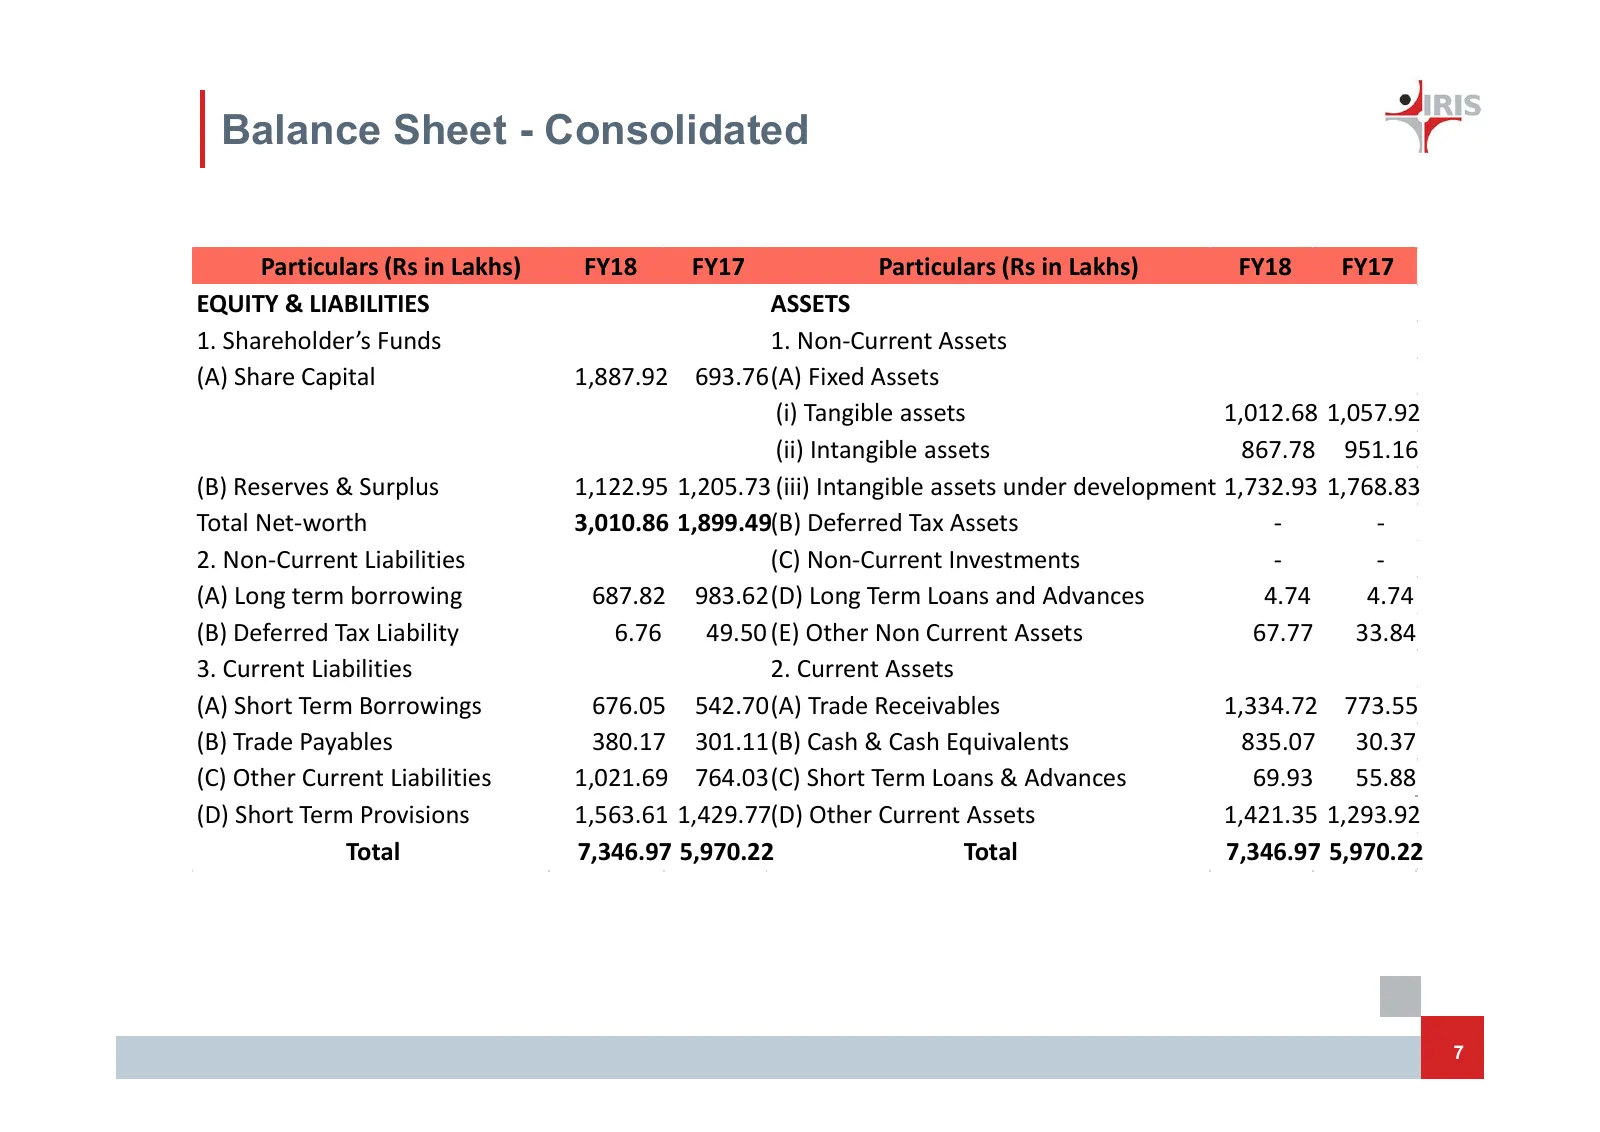
Slide 8: Balance Sheet - Consolidated
Balance Sheet - Consolidated Particulars (Rs in Lakhs) FY18 FY17 Particulars (Rs in Lakhs) FY18 FY17 EQUITY & LIABILITIES ASSETS 1. Shareholder’s Funds 1. Non-Current Assets (A) Share Capital 1,887.92 693.76(A) Fixed Assets (i) Tangible assets 1,012.68 1,057.92 (ii) Intangible assets 867.78 951.16 (
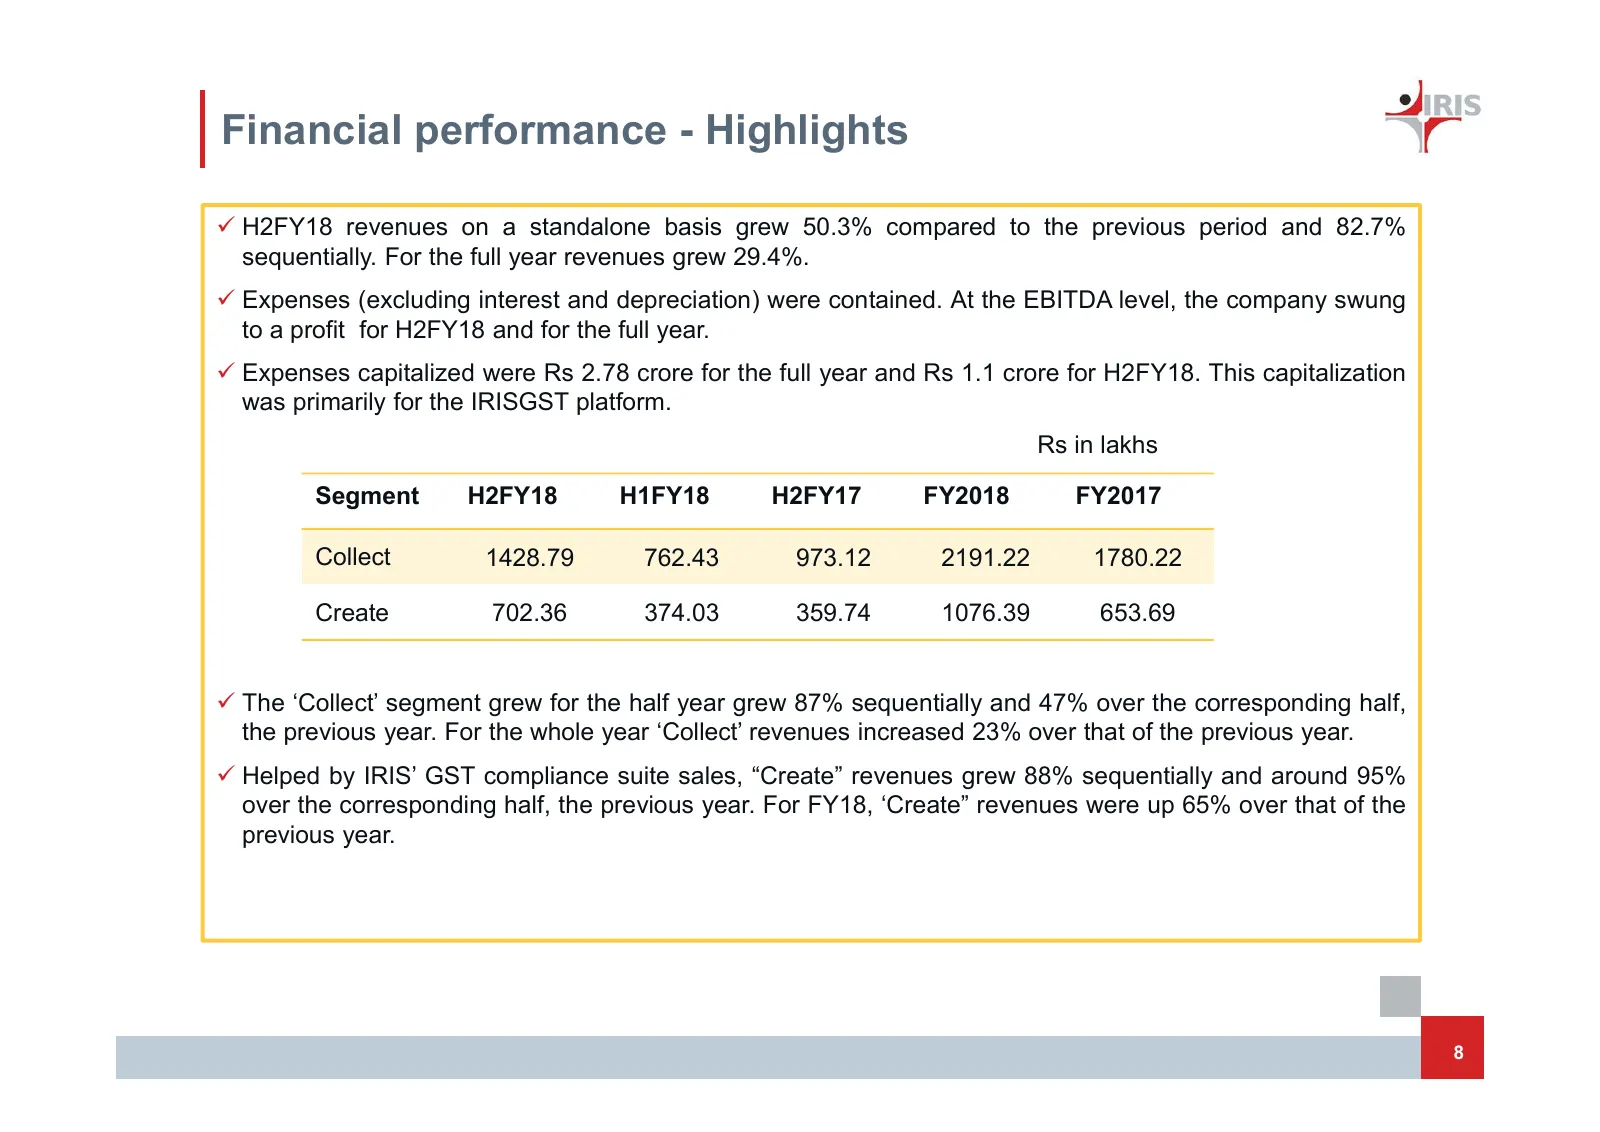
Slide 9: Financial performance - Highlights
Financial performance - Highlights H2FY18 revenues on a standalone basis grew 50.3% compared to the previous period and 82.7% sequentially. For the full year revenues grew 29.4%. Expenses (excluding interest and depreciation) were contained. At the EBITDA level, the company swung to a profit for
Slide 10: Revenue Analysis
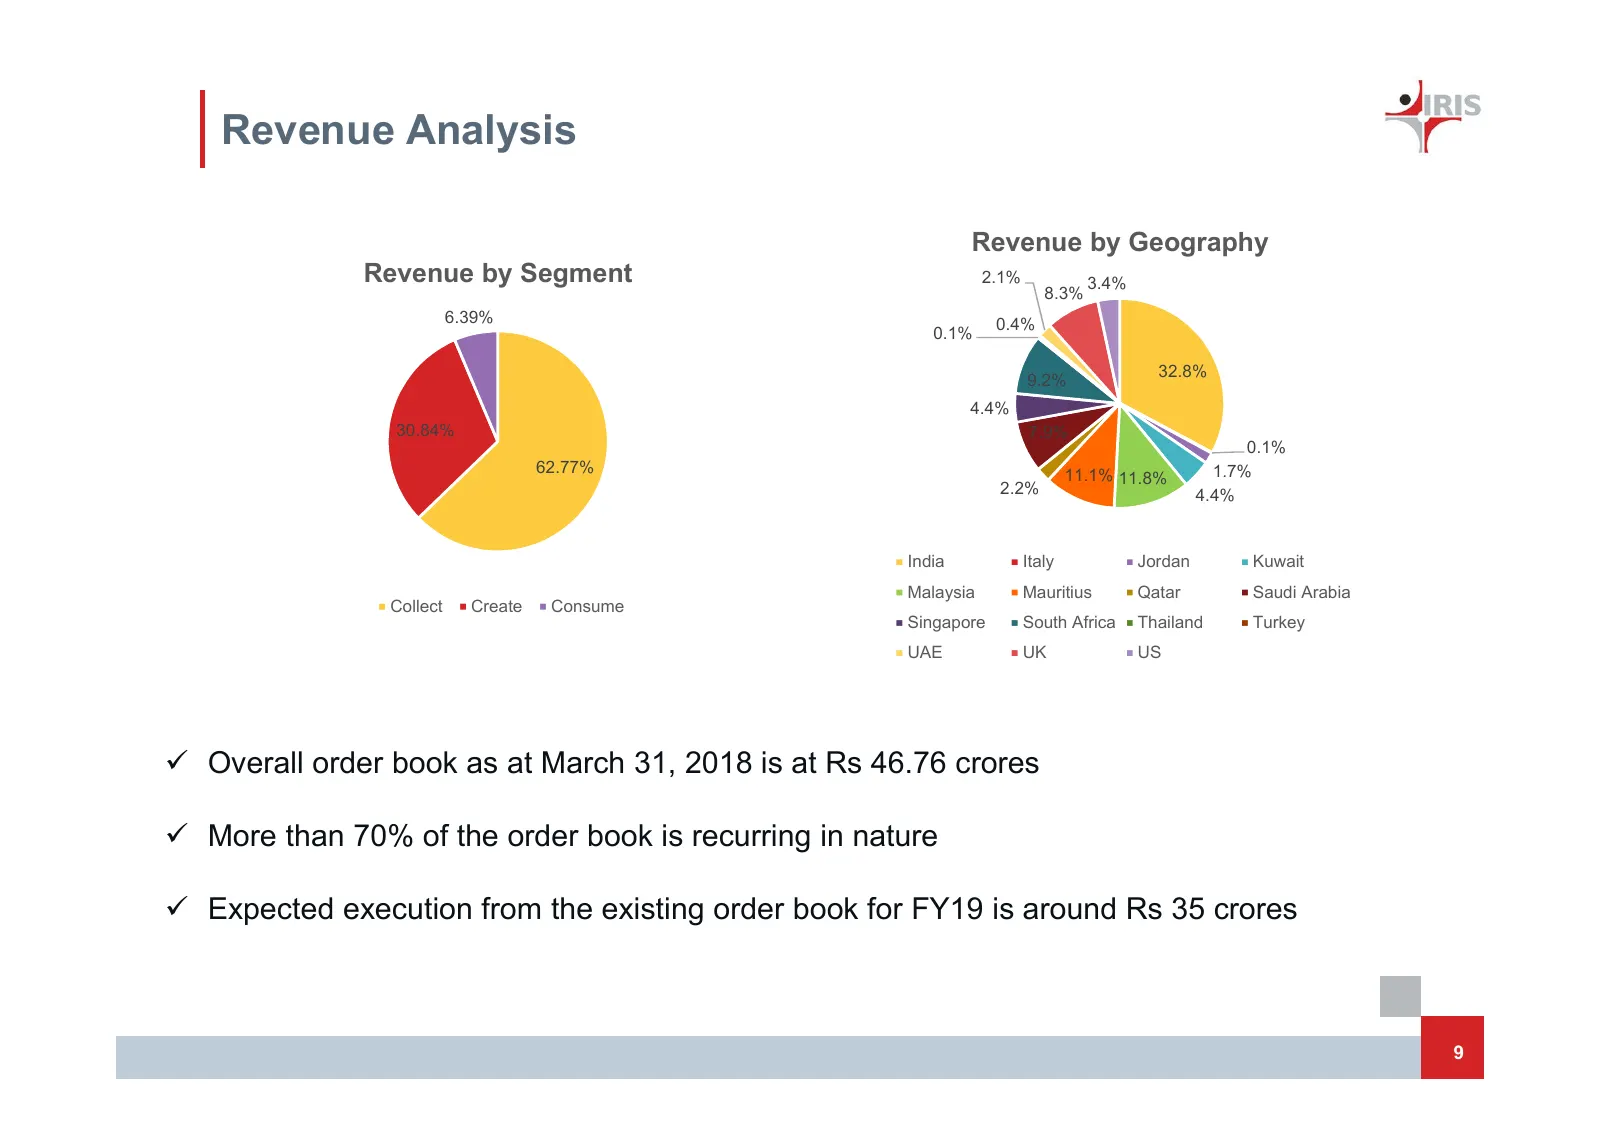
Revenue Analysis Revenue by Geography Revenue by Segment 2.1% 3.4% 8.3% 6.39% 0.4% 0.1% 32.8% 9.2% 4.4% 30.84% 7.9% 0.1% 62.77% 11.1% 11.8% 1.7% 2.2% 4.4% India Italy Jordan Kuwait Malaysia Mauritius Qatar Saudi Arabia Collect Create Consume Singapore South Africa Thailand Turkey UAE UK US Overall
Slide 11: IPO Proceeds Utilization
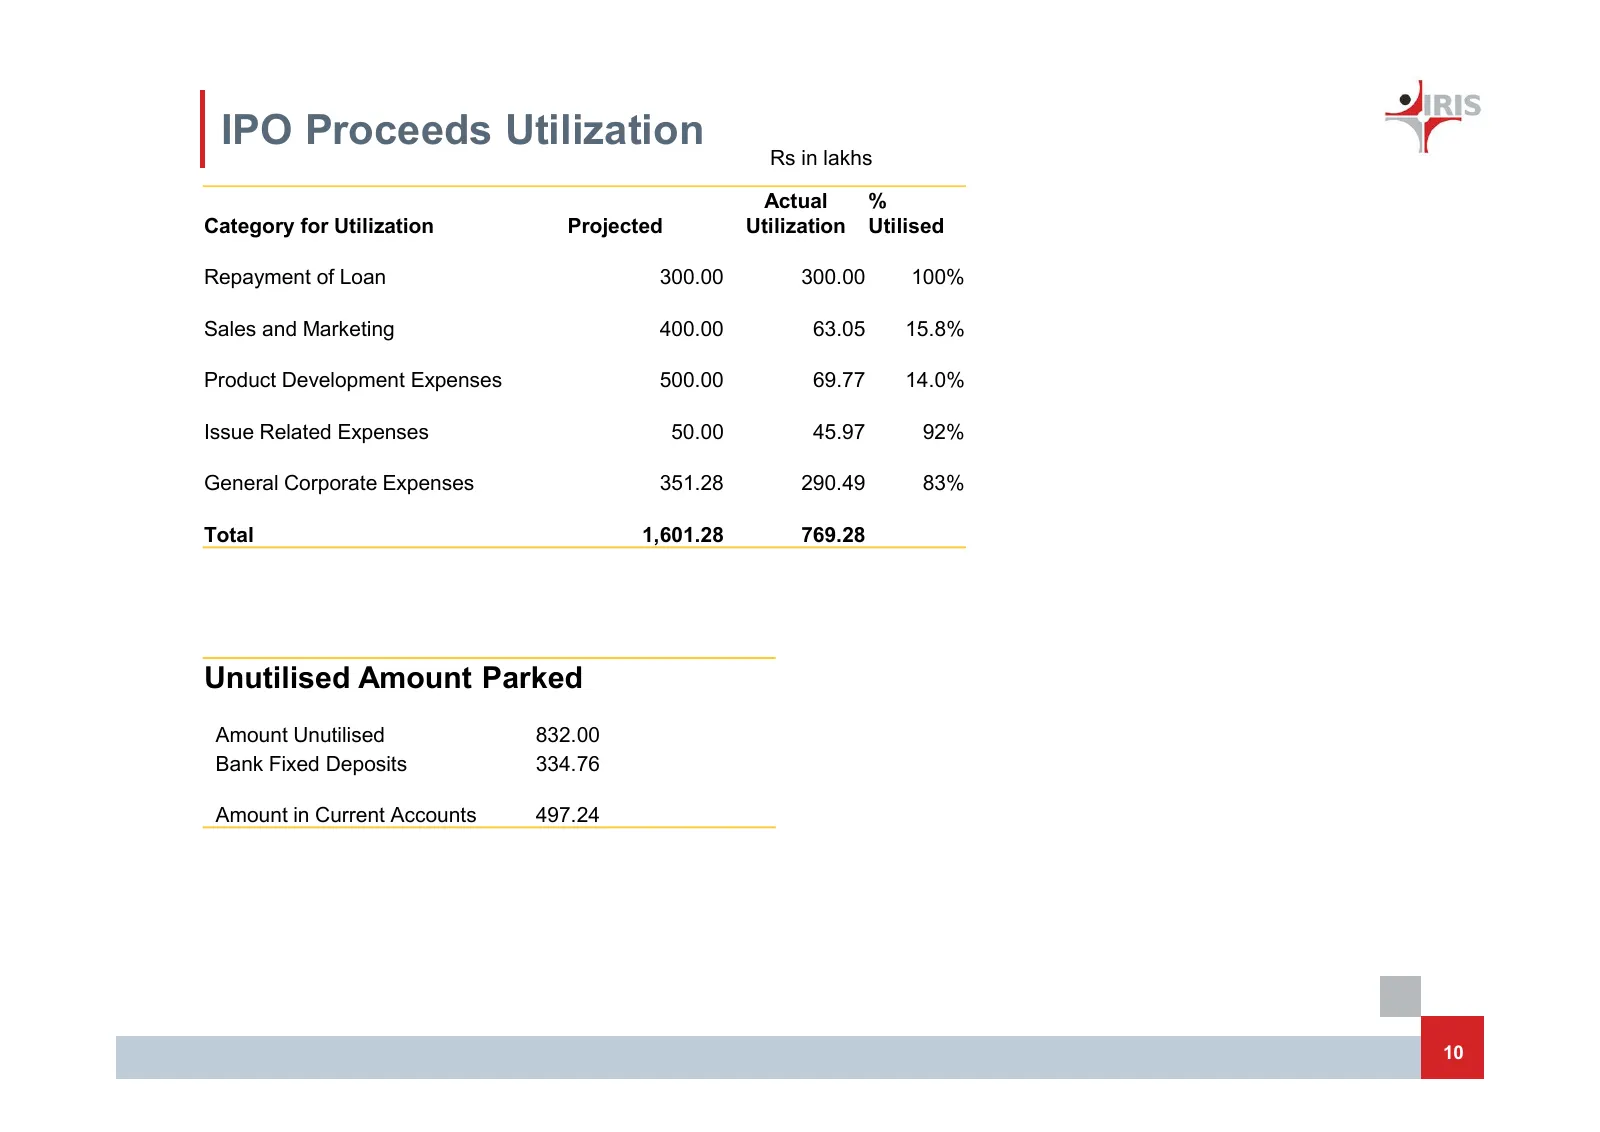
IPO Proceeds Utilization Rs in lakhs Actual % Category for Utilization Projected Utilization Utilised Repayment of Loan 300.00 300.00 100% Sales and Marketing 400.00 63.05 15.8% Product Development Expenses 500.00 69.77 14.0% Issue Related Expenses 50.00 45.97 92% General Corporate Expenses 351.28 2

Slide 12: Thank you!
oy 4a Thank you!
Source: Internet Archive copy of irisbusiness.com
More decks from IRIS RegTech Solutions Limited
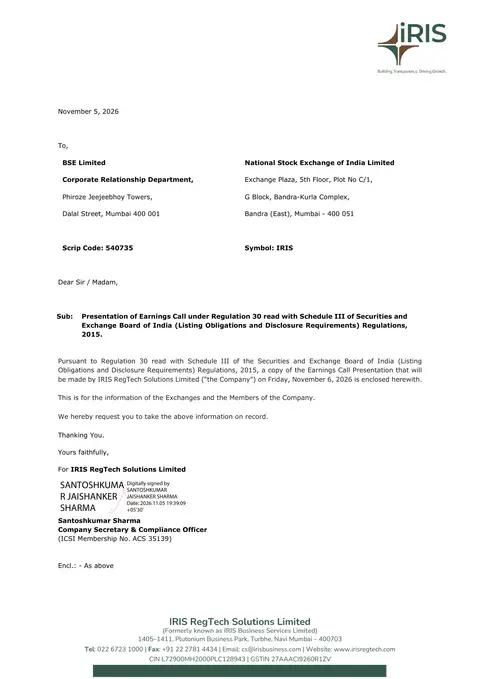 Q2 & H1 FY27 Earnings Presentation29 slides · Nov 5, 2026
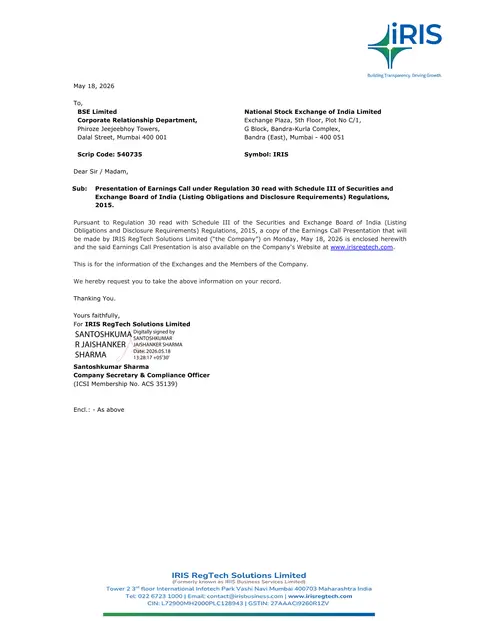 Q4 FY26 Earnings Presentation40 slides · May 18, 2026
 Q2 FY26 Earnings Presentation38 slides · Nov 14, 2025
 FY2025 Earnings Presentation36 slides · May 15, 2025
 Investor Day (November 2024)72 slides · Nov 26, 2024
 H1 FY25 Earnings Presentation30 slides · Oct 30, 2024