Silver Bay Realty Trust — Investor Presentation (July 2014)
23 slides from Silver Bay Realty Trust's investor presentation, Jul 23, 2014
Slide 1: Silver Bay Realty Trust Corp. July 2014
SILVER BAY REALTY TRUST CORP. J u l y 2 0 1 4
Slide 2: Safe Harbor Statement / Forward-Looking Statements
2 S A F E H A R B O R S T A T E M E N T F O R W A R D - L O O K I N G S T A T E M E N T S This presentation includes “forward-looking statements” within the meaning of the safe harbor provisions of the United States Private Securities Litigation Reform Act of 1995. Actual results may differ from exp
Slide 3: Silver Bay Realty Trust Corp.
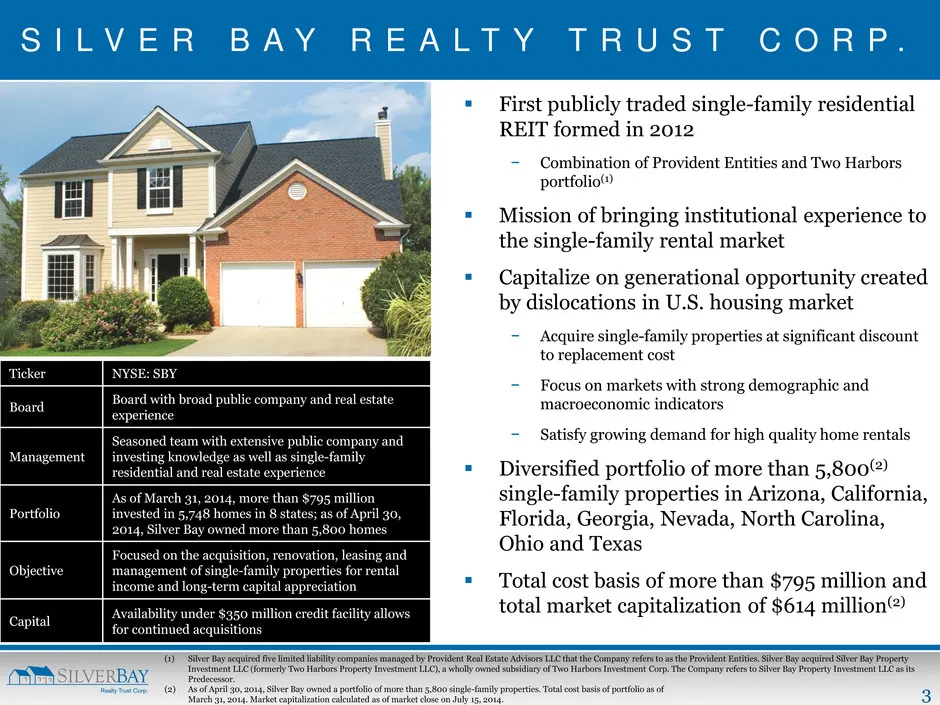
3 S I L V E R B A Y R E A L T Y T R U S T C O R P . First publicly traded single-family residential REIT formed in 2012 − Combination of Provident Entities and Two Harbors portfolio(1) Mission of bringing institutional experience to the single-family rental market Capitalize on generational op
Slide 4: Single Family Rental Industry Market Opportunity
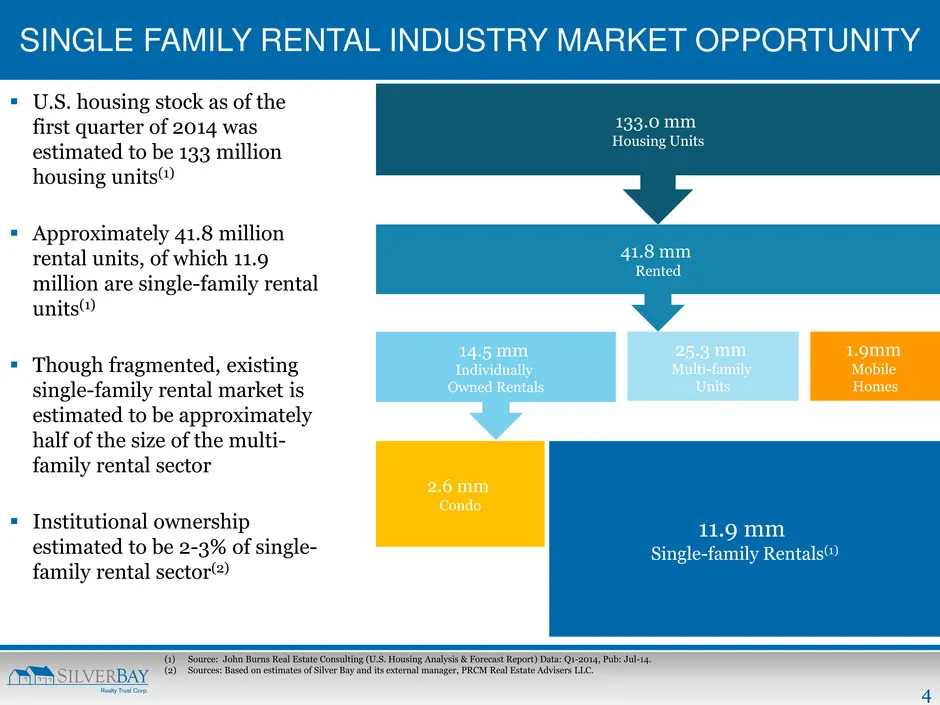
4 (1) Source: John Burns Real Estate Consulting (U.S. Housing Analysis & Forecast Report) Data: Q1-2014, Pub: Jul-14. (2) Sources: Based on estimates of Silver Bay and its external manager, PRCM Real Estate Advisers LLC. SINGLE FAMILY RENTAL INDUSTRY MARKET OPPORTUNITY U.S. housing stock as of the
Slide 5: Investment Opportunity Remains Compelling
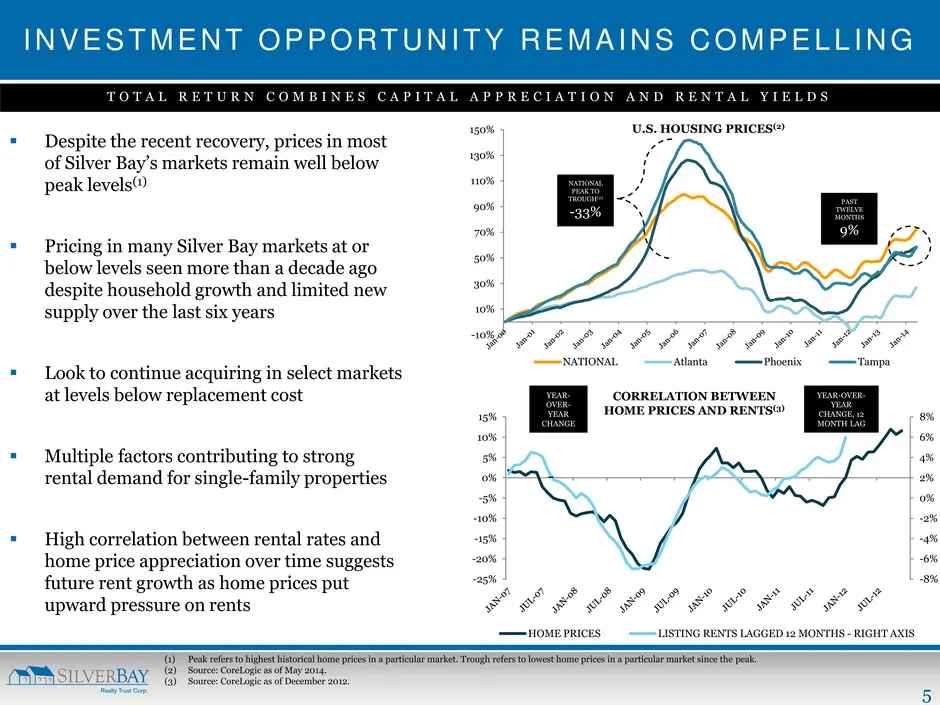
5 -8% -6% -4% -2% 0% 2% 4% 6% 8% -25% -20% -15% -10% -5% 0% 5% 10% 15% HOME PRICES LISTING RENTS LAGGED 12 MONTHS - RIGHT AXIS -10% 10% 30% 50% 70% 90% 110% 130% 150% NATIONAL Atlanta Phoenix Tampa INVESTMENT OPPORTUNITY REMAINS COMPELL ING Despite the recent recovery, prices in most of Silver Bay
Slide 6: Portfolio of Homes as of March 31, 2014
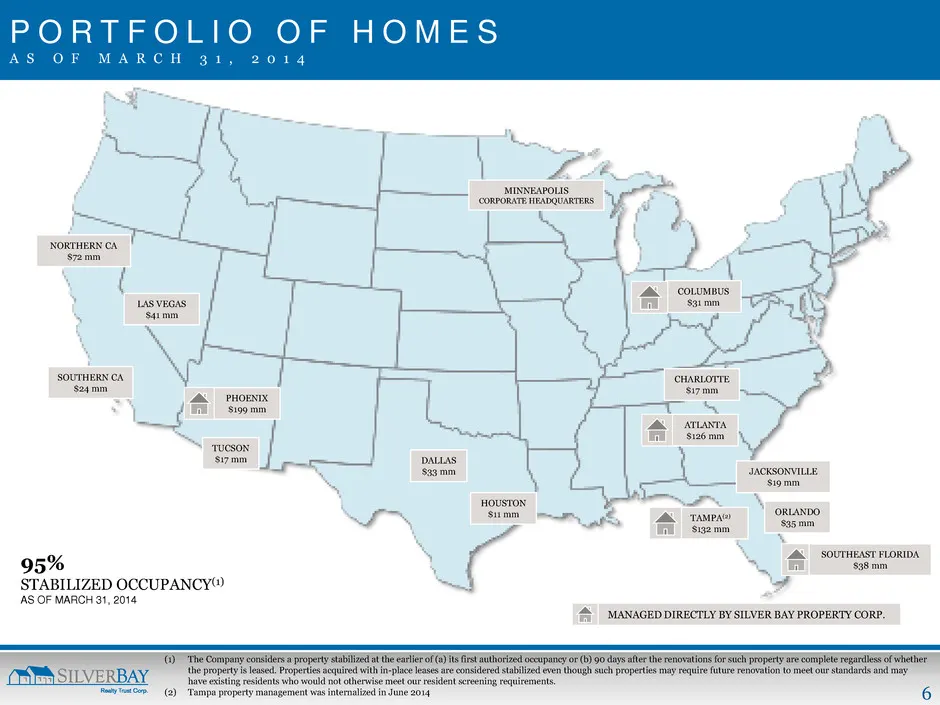
6 (1) The Company considers a property stabilized at the earlier of (a) its first authorized occupancy or (b) 90 days after the renovations for such property are complete regardless of whether the property is leased. Properties acquired with in-place leases are considered stabilized even though such
Slide 7: Operational Metrics
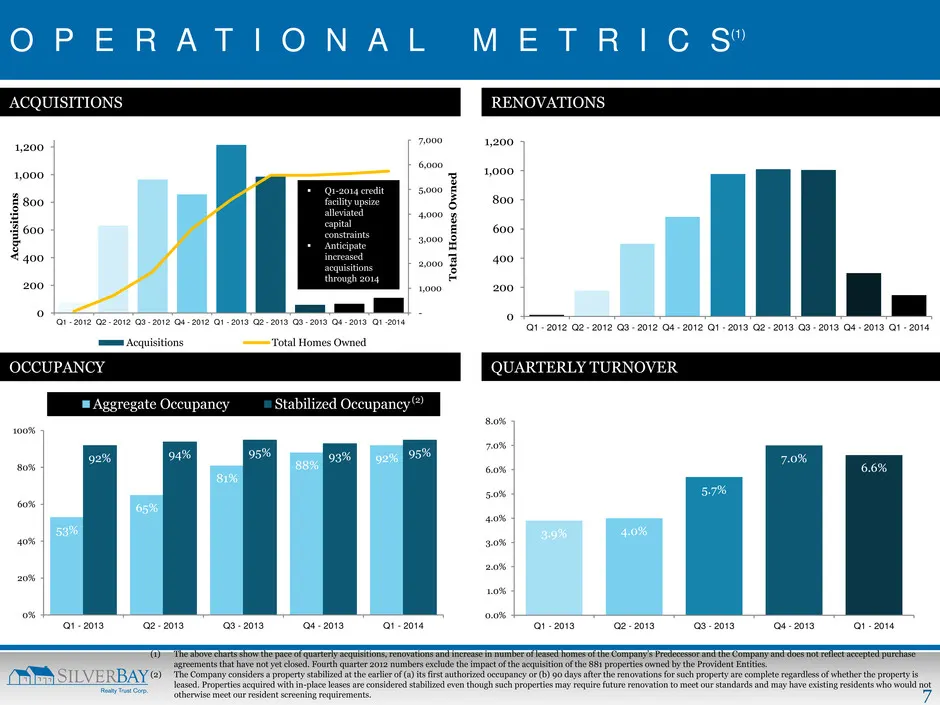
7 O P E R A T I O N A L M E T R I C S(1) RENOVATIONS 0 200 400 600 800 1,000 1,200 Q1 - 2012 Q2 - 2012 Q3 - 2012 Q4 - 2012 Q1 - 2013 Q2 - 2013 Q3 - 2013 Q4 - 2013 Q1 - 2014 - 1,000 2,000 3,000 4,000 5,000 6,000 7,000 0 200 400 600 800 1,000 1,200 Q1 - 2012 Q2 - 2012 Q3 - 2012 Q4 - 2012 Q1 - 2013 Q2
Slide 8: Organizational Structure
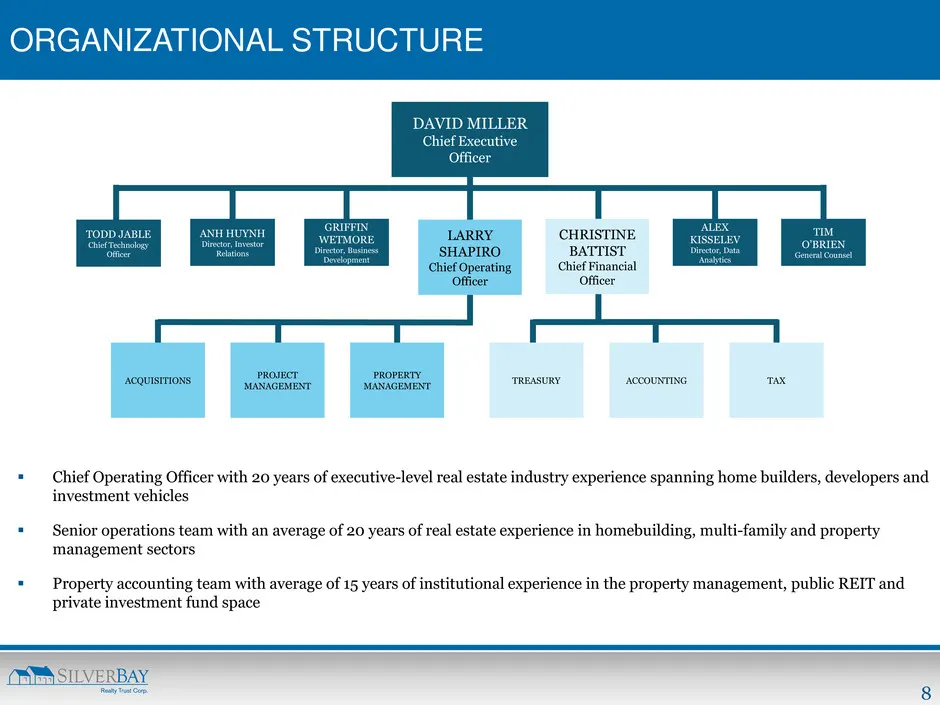
8 ORGANIZATIONAL STRUCTURE DAVID MILLER Chief Executive Officer ANH HUYNH Director, Investor Relations GRIFFIN WETMORE Director, Business Development LARRY SHAPIRO Chief Operating Officer CHRISTINE BATTIST Chief Financial Officer ALEX KISSELEV Director, Data Analytics TIM O’BRIEN General Counsel ACQ
Slide 9: Strategic Initiatives
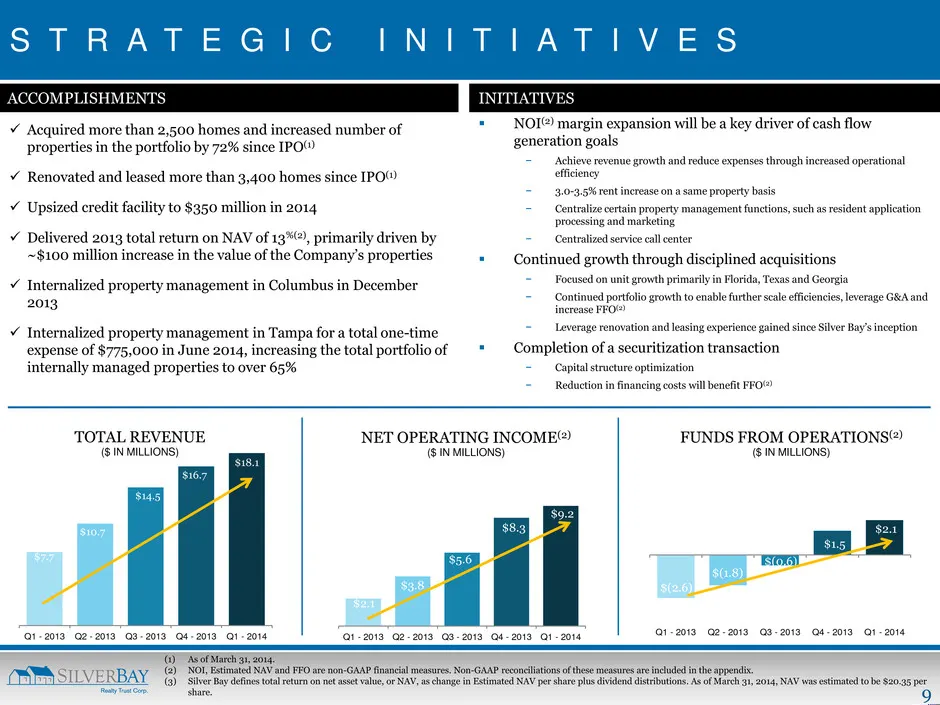
9 S T R A T E G I C I N I T I A T I V E S NOI(2) margin expansion will be a key driver of cash flow generation goals − Achieve revenue growth and reduce expenses through increased operational efficiency − 3.0-3.5% rent increase on a same property basis − Centralize certain property management func
Slide 10: Acquisition and Property Management
10 ACQUISITION AND PROPERTY MANAGEMENT
Slide 11: Institutional Operating Platform
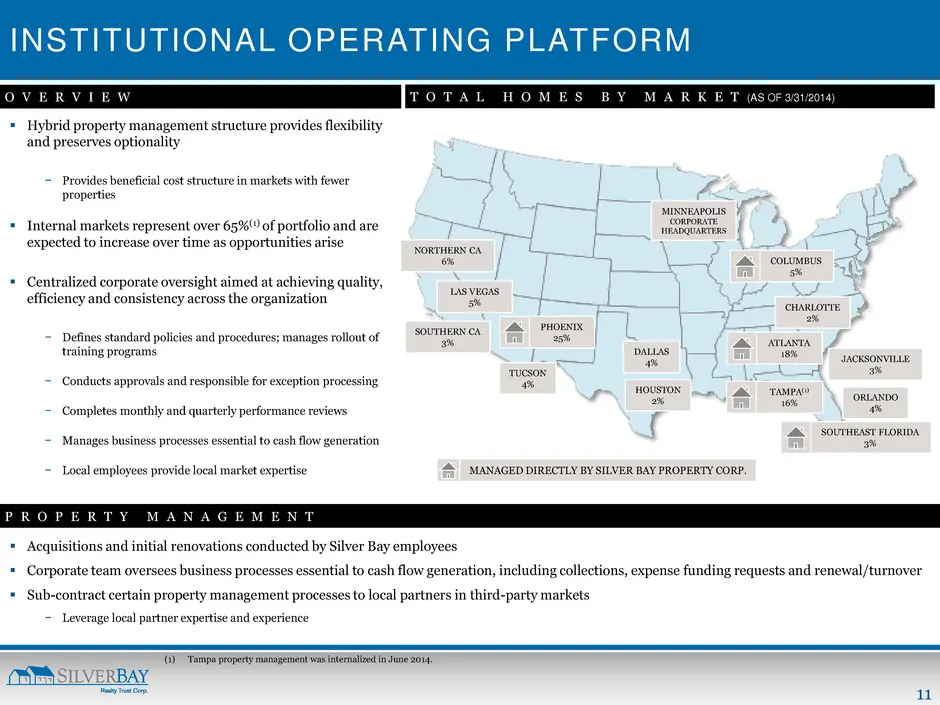
11 INSTITUTIONAL OPERATING PLATFORM Hybrid property management structure provides flexibility and preserves optionality − Provides beneficial cost structure in markets with fewer properties Internal markets represent over 65%(1) of portfolio and are expected to increase over time as opportunitie
Slide 12: Acquisition Strategy and Asset Selection Process
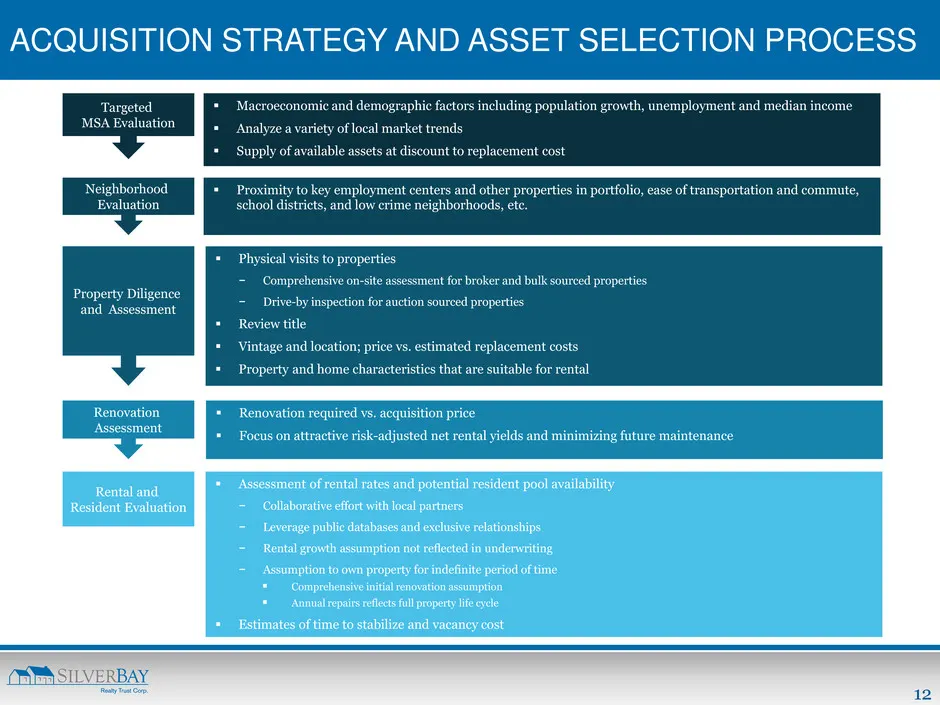
12 ACQUISITION STRATEGY AND ASSET SELECTION PROCESS Targeted MSA Evaluation Neighborhood Evaluation Property Diligence and Assessment Renovation Assessment Rental and Resident Evaluation Macroeconomic and demographic factors including population growth, unemployment and median income Analyze a v
Slide 13: Acquisition Experience and Outlook
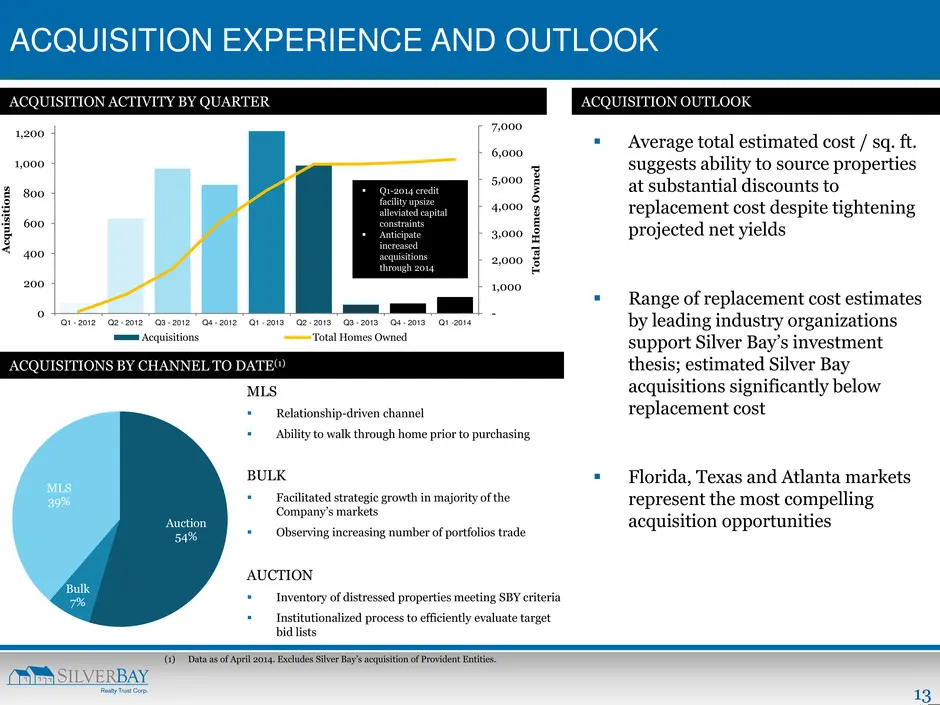
13 - 1,000 2,000 3,000 4,000 5,000 6,000 7,000 0 200 400 600 800 1,000 1,200 Q1 - 2012 Q2 - 2012 Q3 - 2012 Q4 - 2012 Q1 - 2013 Q2 - 2013 Q3 - 2013 Q4 - 2013 Q1 -2014 T o tal H o m e s O w n e d A c q u is it io n s Acquisitions Total Homes Owned ACQUISITION EXPERIENCE AND OUTLOOK Average total est
Slide 14: Renovations
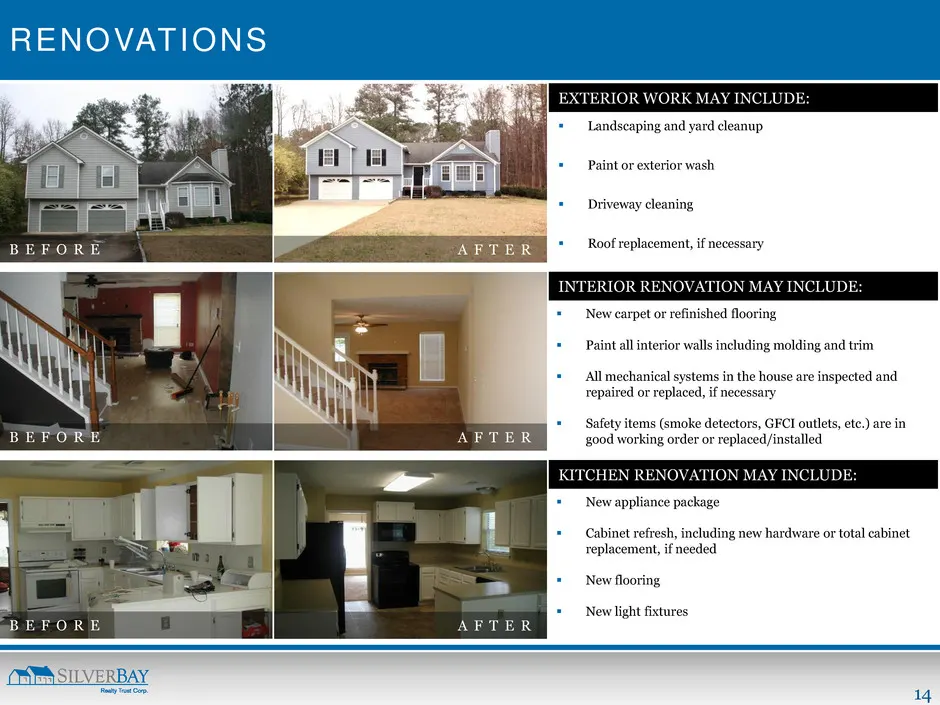
14 New appliance package Cabinet refresh, including new hardware or total cabinet replacement, if needed New flooring New light fixtures RENOVATIONS B E F O R E A F T E R Landscaping and yard cleanup Paint or exterior wash Driveway cleaning Roof replacement, if necessary New carpet
Slide 15: Marketing and Leasing
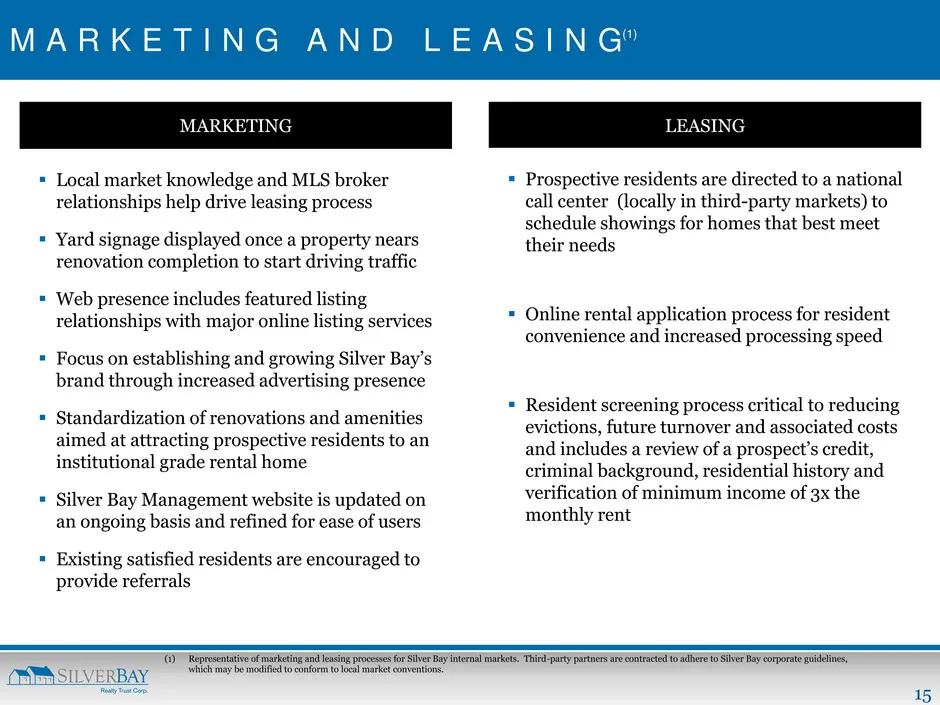
15 M A R K E T I N G A N D L E A S I N G(1) Local market knowledge and MLS broker relationships help drive leasing process Yard signage displayed once a property nears renovation completion to start driving traffic Web presence includes featured listing relationships with major online listing
Slide 16: Appendix
16 A P P E N D I X
Slide 17: Current Housing Market Environment
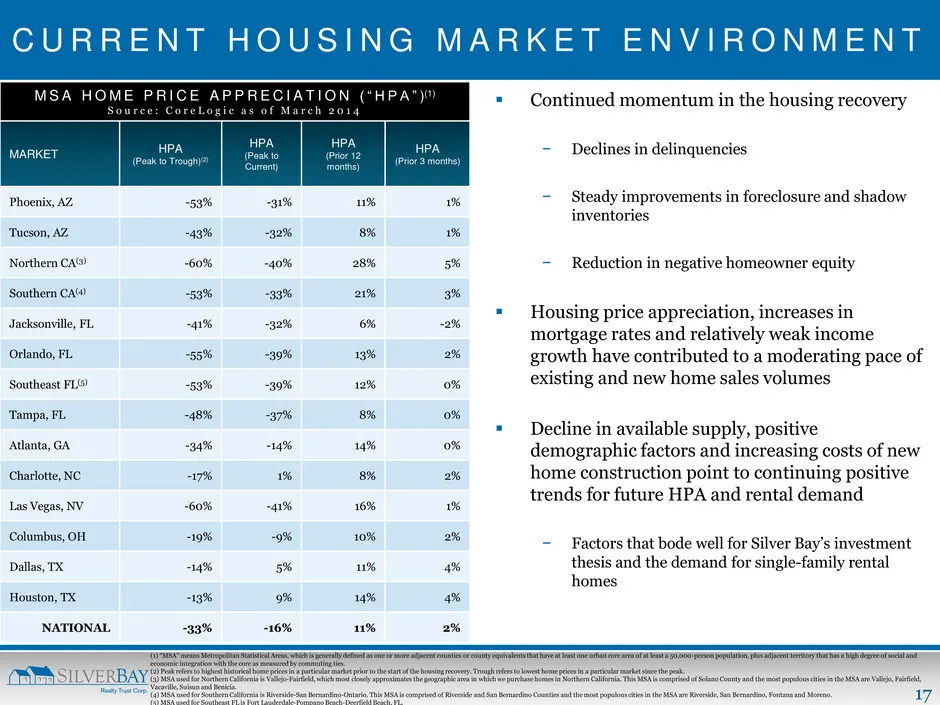
17 C U R R E N T H O U S I N G M A R K E T E N V I R O N M E N T Continued momentum in the housing recovery − Declines in delinquencies − Steady improvements in foreclosure and shadow inventories − Reduction in negative homeowner equity Housing price appreciation, increases in mortgage rates and
Slide 18: Portfolio of Single-Family Properties
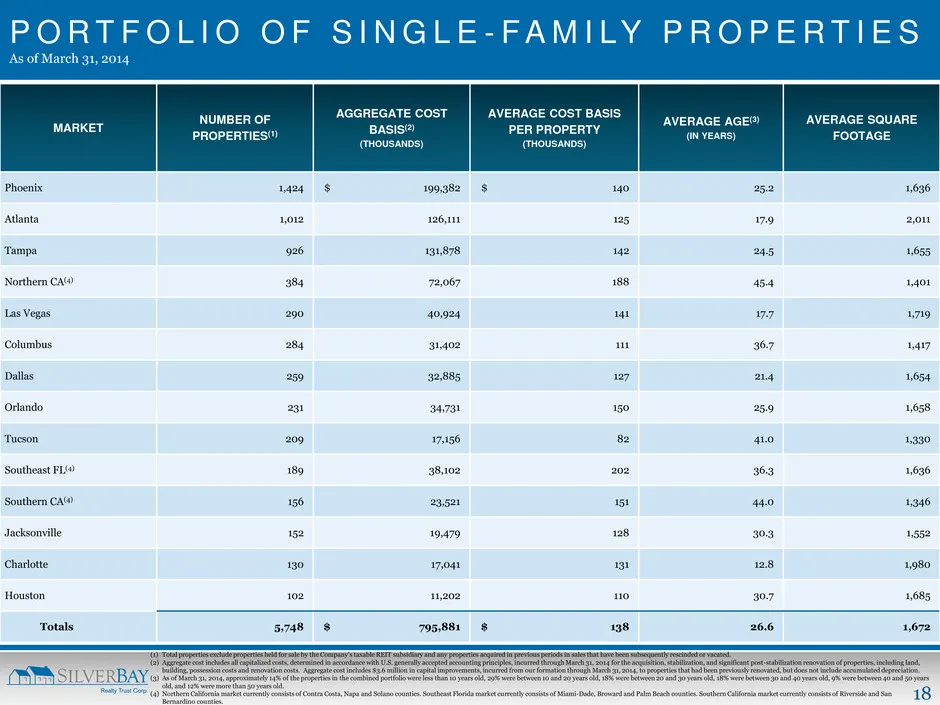
18 P O R T F O L I O O F S I N G L E - F A M I LY P R O P E R T I E S As of March 31, 2014 MARKET NUMBER OF PROPERTIES(1) AGGREGATE COST BASIS(2) (THOUSANDS) AVERAGE COST BASIS PER PROPERTY (THOUSANDS) AVERAGE AGE(3) (IN YEARS) AVERAGE SQUARE FOOTAGE Phoenix 1,424 $ 199,382 $ 140 25.2 1,636 Atlanta
Slide 19: Portfolio Summary of Leasing Status of Properties
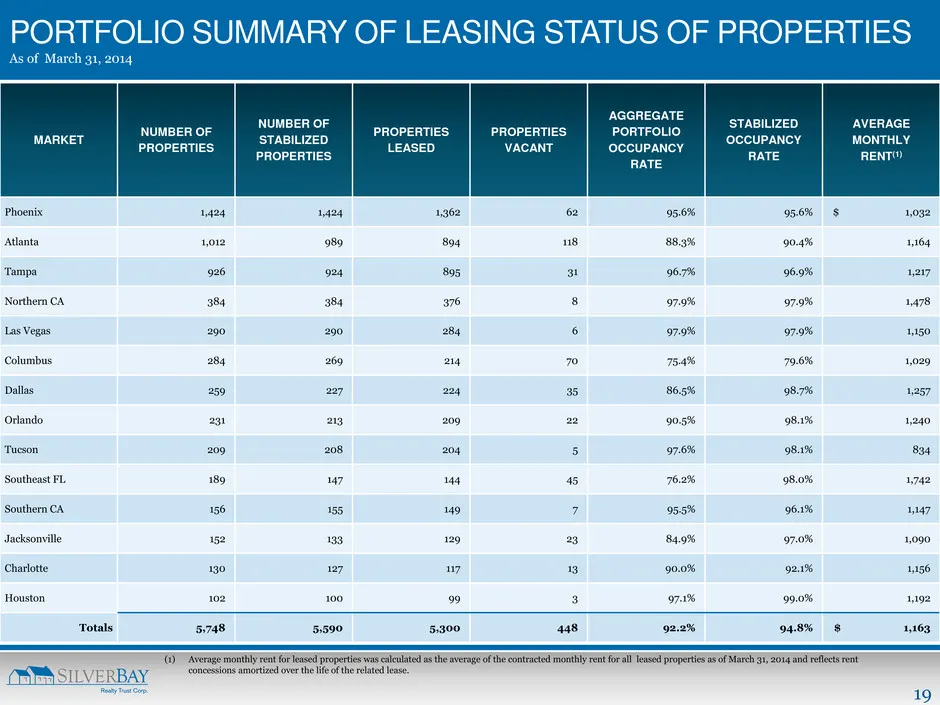
19 MARKET NUMBER OF PROPERTIES NUMBER OF STABILIZED PROPERTIES PROPERTIES LEASED PROPERTIES VACANT AGGREGATE PORTFOLIO OCCUPANCY RATE STABILIZED OCCUPANCY RATE AVERAGE MONTHLY RENT(1) Phoenix 1,424 1,424 1,362 62 95.6% 95.6% $ 1,032 Atlanta 1,012 989 894 118 88.3% 90.4% 1,164 Tampa 926 924 895 31 96
Slide 20: Estimated Portfolio and Estimated Net Asset Value
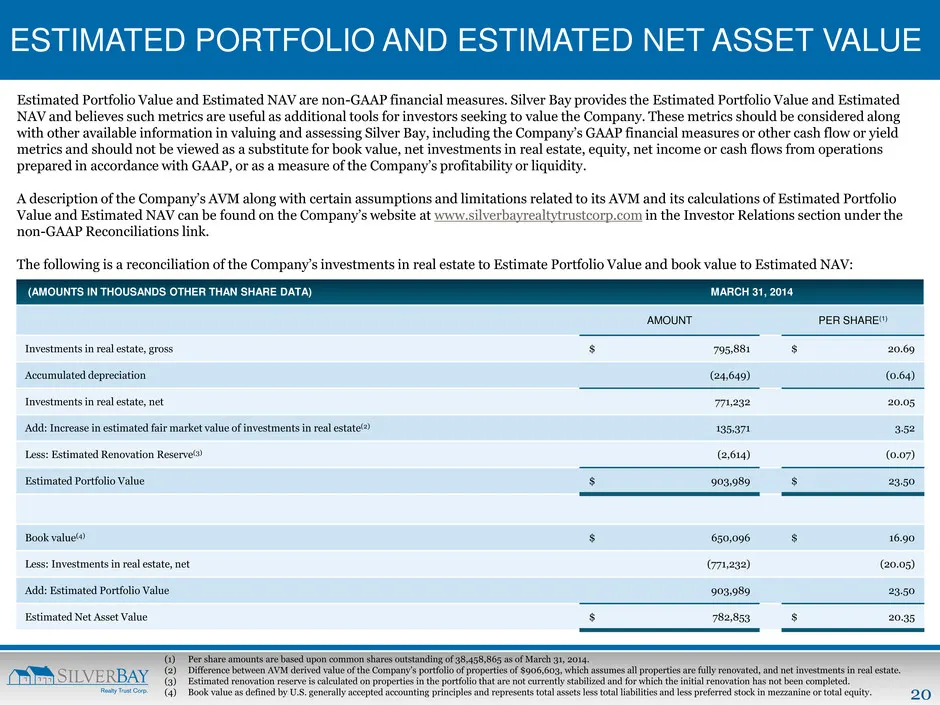
20 ESTIMATED PORTFOLIO AND ESTIMATED NET ASSET VALUE Estimated Portfolio Value and Estimated NAV are non-GAAP financial measures. Silver Bay provides the Estimated Portfolio Value and Estimated NAV and believes such metrics are useful as additional tools for investors seeking to value the Company. T
Slide 21: Net Operating Income
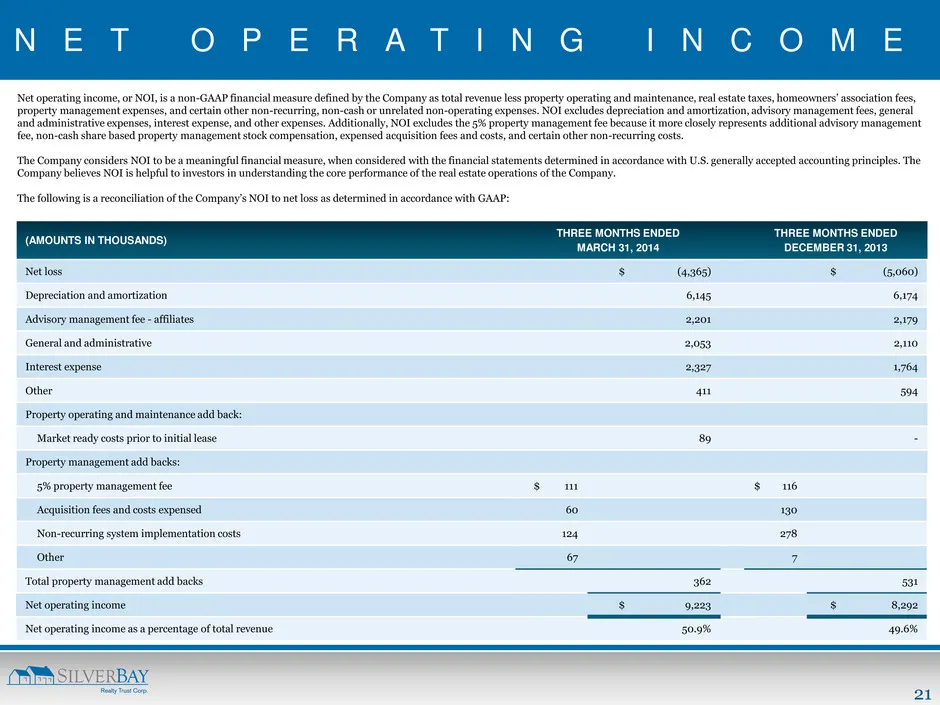
21 N E T O P E R A T I N G I N C O M E Net operating income, or NOI, is a non-GAAP financial measure defined by the Company as total revenue less property operating and maintenance, real estate taxes, homeowners’ association fees, property management expenses, and certain other non-recurring, non-ca
Slide 22: Funds From Operations
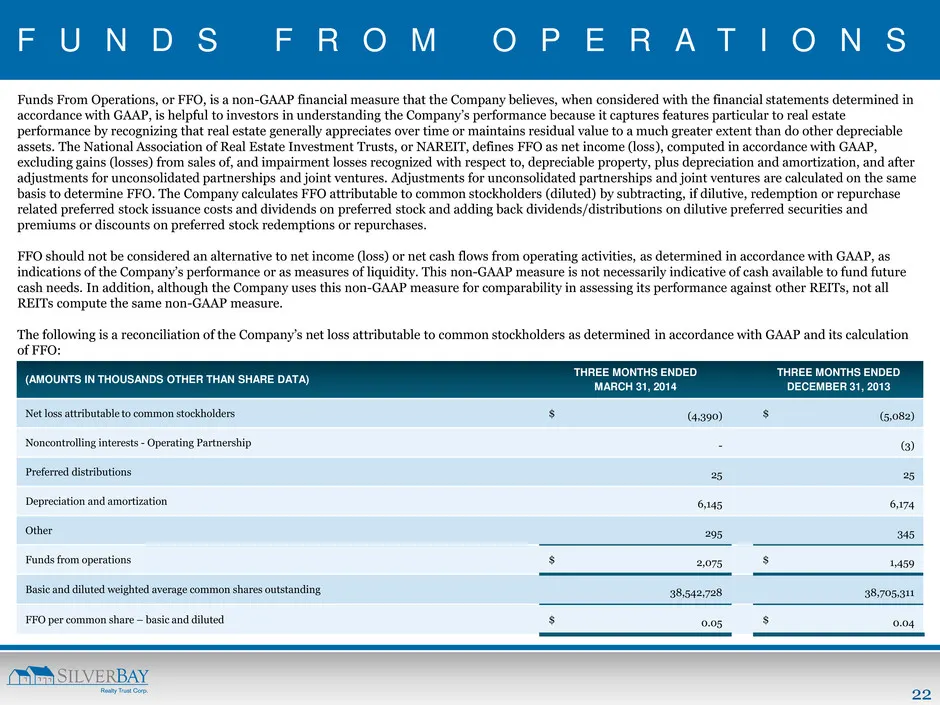
22 F U N D S F R O M O P E R A T I O N S Funds From Operations, or FFO, is a non-GAAP financial measure that the Company believes, when considered with the financial statements determined in accordance with GAAP, is helpful to investors in understanding the Company’s performance because it captures
Slide 23: CARLSON PARKWAY | SUITE | MINNETONKA | MN | 55305 P: 952.358.4400 | E:
23 601 CARLSON PARKWAY | SUITE 250 | MINNETONKA | MN | 55305 P: 952.358.4400 | E: INVES TO RS@ SILVERBAYMGMT .C OM
Source: SEC EDGAR · 8-K filed Jul 23, 2014
More decks from Silver Bay Realty Trust Corp
 Merger or Acquisition (February 2017)12 slides · Feb 28, 2017
 Investor Presentation (September 2016)32 slides · Sep 22, 2016
 Q4 2015 Earnings Presentation13 slides · Feb 24, 2016
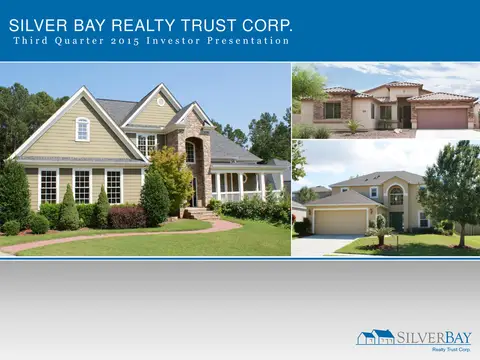 Q3 2015 Earnings Presentation33 slides · Nov 24, 2015
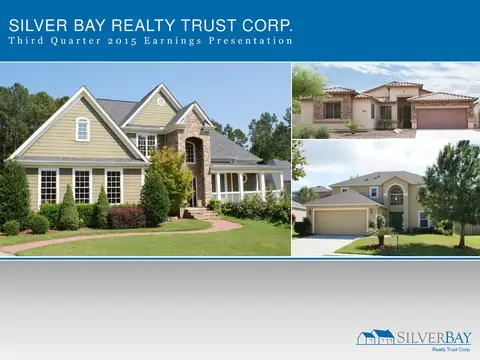 Q3 2015 Earnings Presentation10 slides · Nov 4, 2015
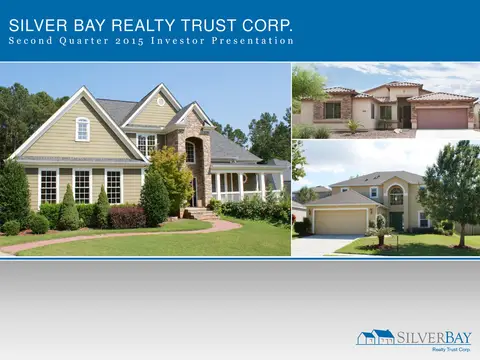 Q2 2015 Earnings Presentation34 slides · Sep 8, 2015