Penford — Investor Presentation (January 2008)
21 slides from Penford's investor presentation, Jan 22, 2008
Slide 1: Penford Corporation – January 2008
January 2008 Nature. Science. Solutions. (r) Penford Corporation
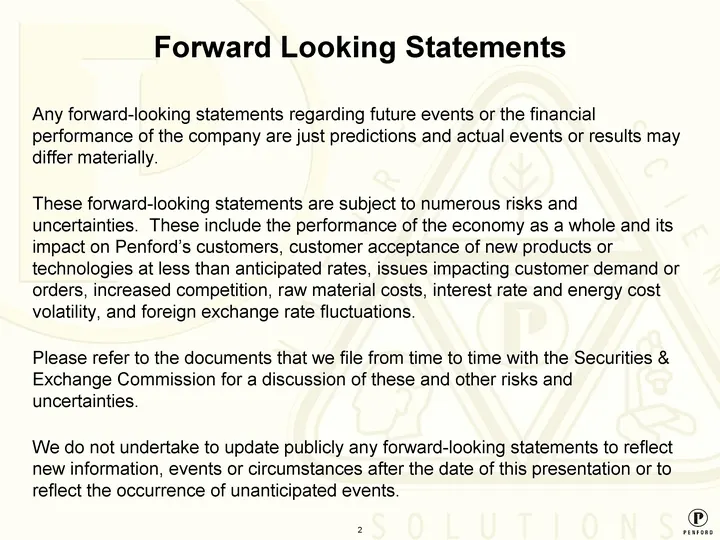
Slide 2: Forward Looking Statements
Any forward-looking statements regarding future events or the financial performance of the company are just predictions and actual events or results may differ materially. These forward-looking statements are subject to numerous risks and uncertainties. These include the performance of the economy a
Slide 3: Fiscal 2007 Financial Highlights
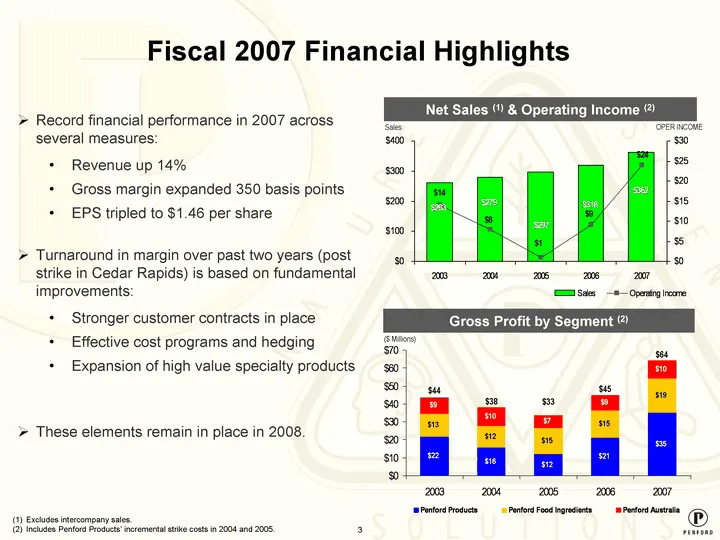
Sales Operating Income 2003 262.5 262.5 14 2004 279.4 279.4 8 2005 296.8 296.8 1 2006 318.4 318.4 9 2007 362.4 362.4 24 Fiscal 2007 Financial Highlights Record financial performance in 2007 across several measures: Revenue up 14% Gross margin expanded 350 basis points EPS tripled to $1.46 per share
Slide 4: Specialty Starch Industry Overview
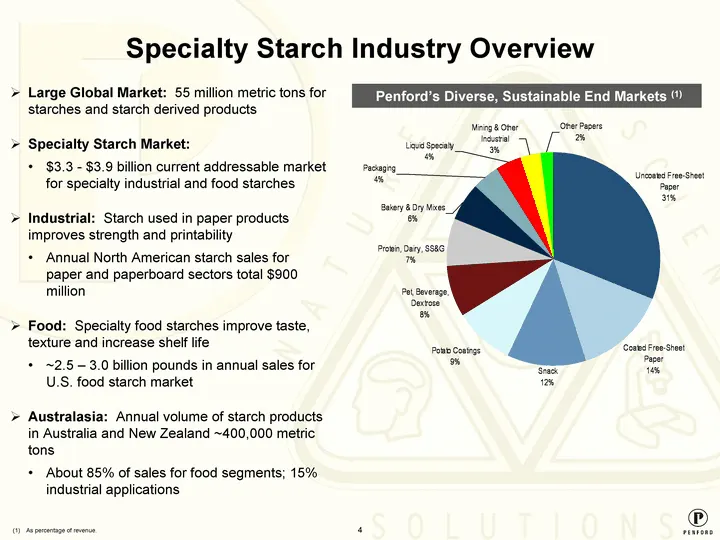
Specialty Starch Industry Overview Large Global Market: 55 million metric tons for starches and starch derived products Specialty Starch Market: $3.3 - $3.9 billion current addressable market for specialty industrial and food starches Industrial: Starch used in paper products improves strength and p
Slide 5: Specialty Starch Solutions
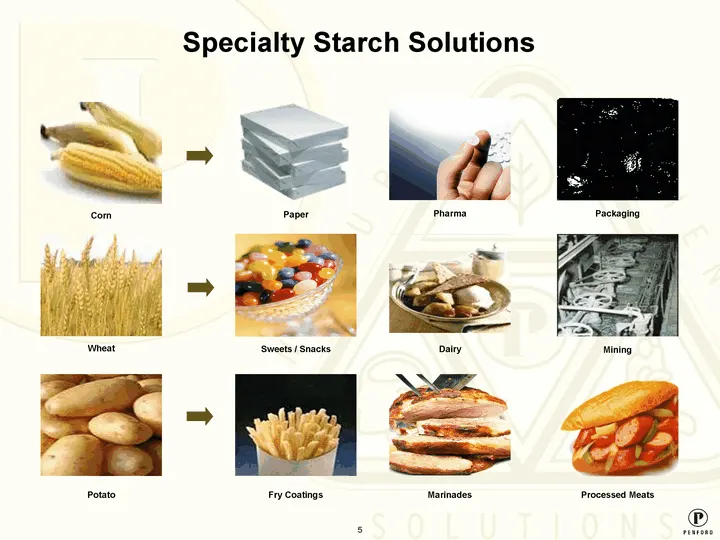
Specialty Starch Solutions Wheat Fry Coatings Potato Sweets / Snacks Processed Meats Mining Paper Marinades Packaging Dairy Corn Pharma
Slide 6: Diverse, Premier Customer Base
Diverse, Premier Customer Base Highly diversified across a range of end-user markets, applications and geographies 16 of 20 largest customers have been in top 20 for 5 years Sales to this group increased 16% over past 5 years Key customers include: Most national QSR chains Four of the top five potat
Slide 7: Strategies and Opportunities for Growth
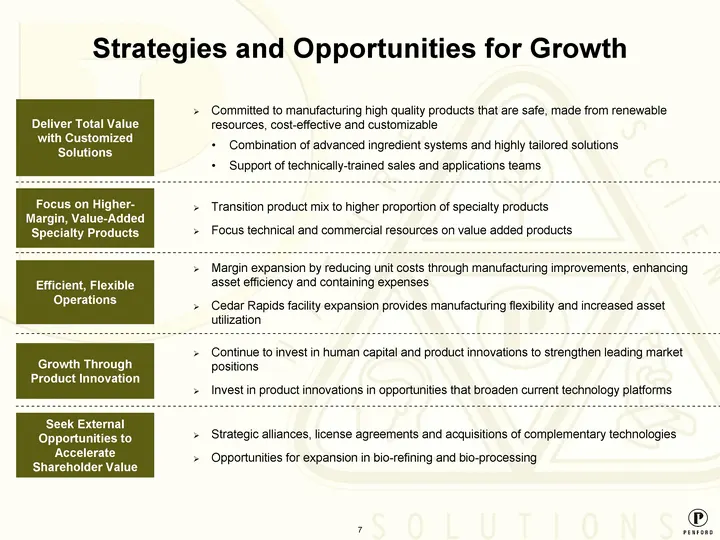
Strategies and Opportunities for Growth Deliver Total Value with Customized Solutions Committed to manufacturing high quality products that are safe, made from renewable resources, cost-effective and customizable Combination of advanced ingredient systems and highly tailored solutions Support of tec

Slide 8: Business Segments
Business Segments
Slide 9: Penford Products Co.
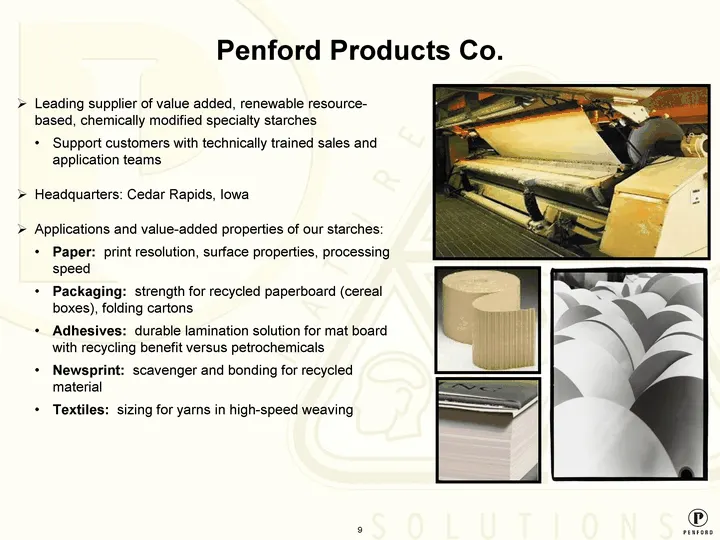
Leading supplier of value added, renewable resource- based, chemically modified specialty starches Support customers with technically trained sales and application teams Headquarters: Cedar Rapids, Iowa Applications and value-added properties of our starches: Paper: print resolution, surface propert
Slide 10: Case Study - LNA Adhesives
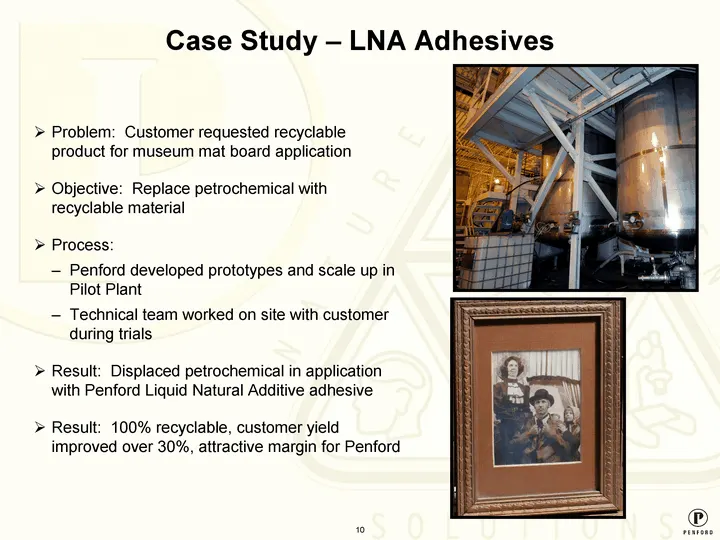
Case Study - LNA Adhesives Problem: Customer requested recyclable product for museum mat board application Objective: Replace petrochemical with recyclable material Process: Penford developed prototypes and scale up in Pilot Plant Technical team worked on site with customer during trials Result: Dis
Slide 11: Cedar Rapids Facility Expansion Project
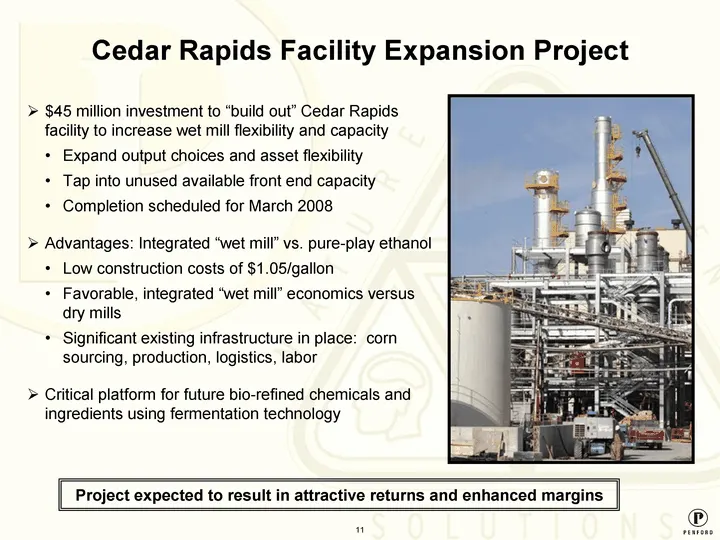
$45 million investment to "build out" Cedar Rapids facility to increase wet mill flexibility and capacity Expand output choices and asset flexibility Tap into unused available front end capacity Completion scheduled for March 2008 Advantages: Integrated "wet mill" vs. pure-play ethanol Low construct
Slide 12: Penford Food Ingredients Co.
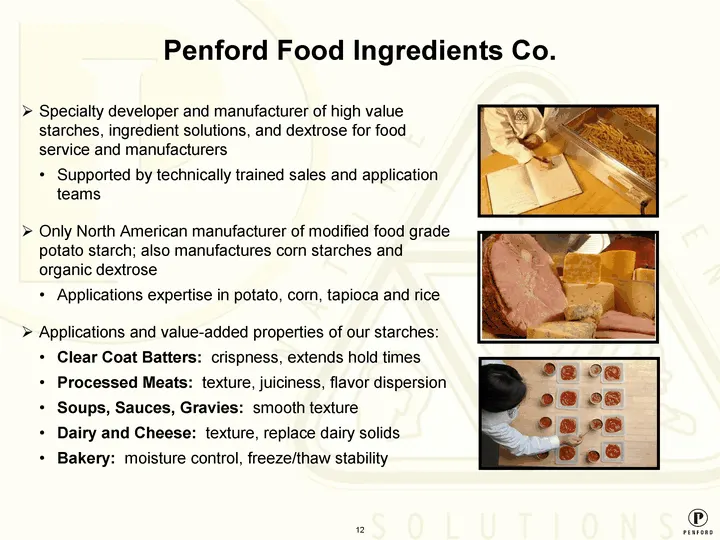
Specialty developer and manufacturer of high value starches, ingredient solutions, and dextrose for food service and manufacturers Supported by technically trained sales and application teams Only North American manufacturer of modified food grade potato starch; also manufactures corn starches and o
Slide 13: Penford Australia Limited
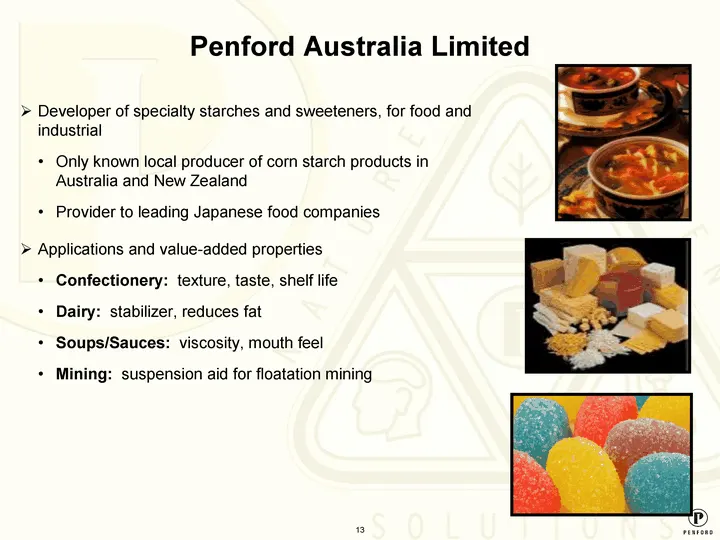
Developer of specialty starches and sweeteners, for food and industrial Only known local producer of corn starch products in Australia and New Zealand Provider to leading Japanese food companies Applications and value-added properties Confectionery: texture, taste, shelf life Dairy: stabilizer, redu

Slide 14: Financial Overview
Financial Overview
Slide 15: Financial Strategy
Expand product offerings and diversify end-markets to drive higher sales Enhance profitability through the sale of higher margin products Actively manage raw materials and other costs to lower per unit cost Increase financial returns through efficient use of manufacturing assets Maintain balance she
Slide 16: Business Segments Sales and Gross Profit
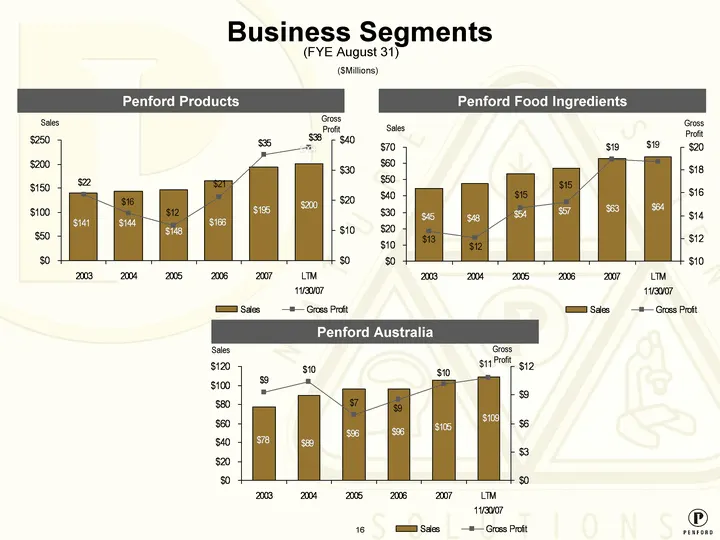
Business Segments Sales Gross Profit 2003 140.6 140.6 21.8 2004 143.6 143.6 15.7 2005 147.8 147.8 11.7 2006 165.9 165.9 21.2 2007 195 195 35.1 LTM 11/30/07 200.2 200.2 37.7 Sales Gross Profit Penford Products Sales Gross Profit 2003 77.7 77.7 9.314 2004 89.1 89.1 10.358 2005 96.2 96.2 6.868 2006 96.
Slide 17: Strong Growth with Seasonality
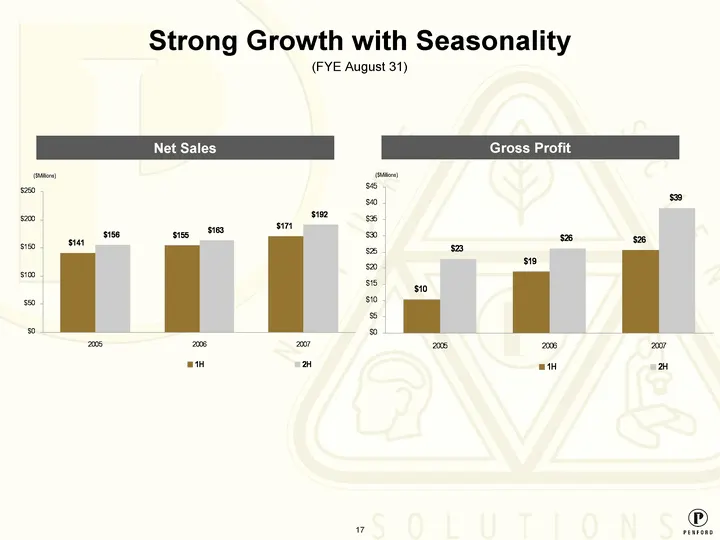
Strong Growth with Seasonality 1H 2H 2005 141.3 155.5 2006 155 163.4 2007 170.7 191.6 1H 2H 2005 10.4 22.8 2006 18.9 26 2007 25.6 38.6 Gross Profit Net Sales ($Millions) (FYE August 31) ($Millions)
Slide 18: Financial Summary ($ Millions)
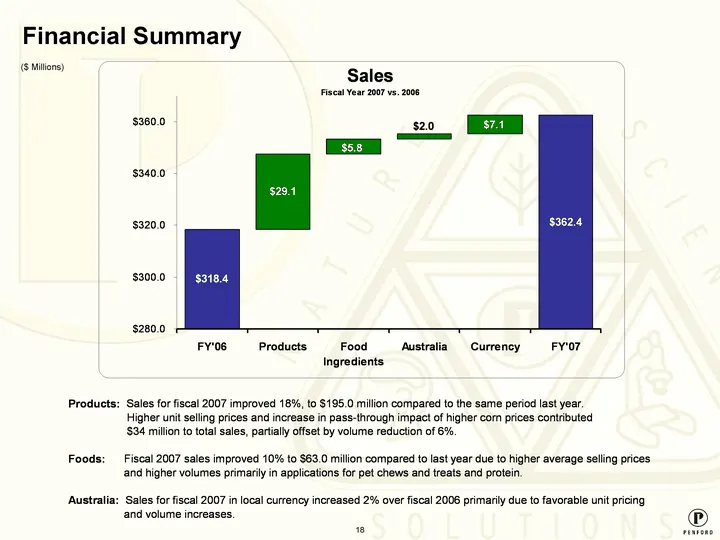
Financial Summary ($ Millions)
Slide 19: Financial Summary ($ Millions)
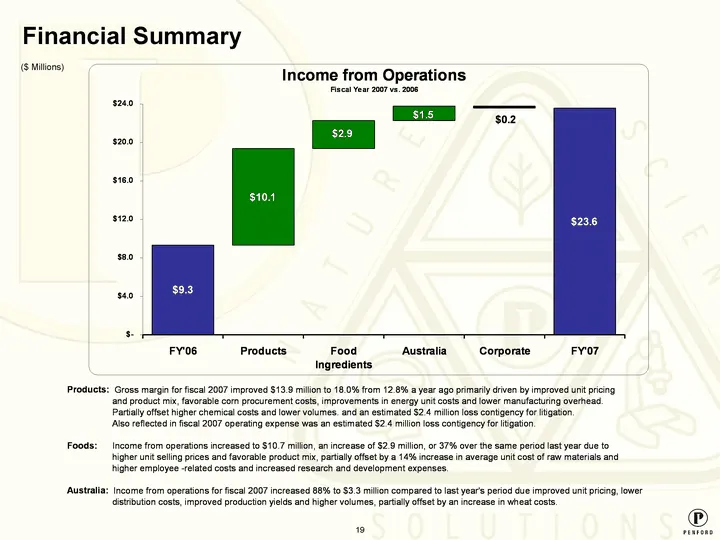
Financial Summary ($ Millions)
Slide 20: Consolidated Debt ($Millions)
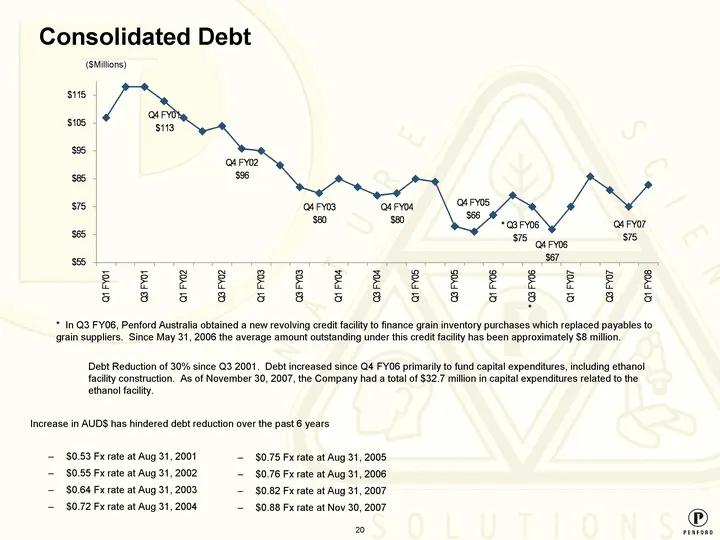
Q1 Q1 FY01 107 Q2 FY01 118 Q3 FY01 118 Q4 FY01 113 Q1 FY02 107 Q2 FY02 102 Q3 FY02 104 Q4 FY02 96 Q1 FY03 95 Q2 FY03 90 Q3 FY03 82 Q4 FY03 80 Q1 FY04 85 Q2 FY04 82 Q3 FY04 79 Q4 FY04 80 Q1 FY05 85 Q2 FY05 84 Q3 FY05 68 Q4 FY05 66 Q1 FY06 72 Q2 FY06 79 * Q3 FY06 75 Q4 FY06 67 Q1 FY07 75 Q2 FY07 86 Q3
Slide 21: Investment Highlights
Leader in value-added segments of modified specialty starch industry Attractive opportunity in customized specialty starch market Expertise using a broad array of renewable, natural-based ingredients Significant value creation through expansion of output choices and capacity at Cedar Rapids manufact
Source: SEC EDGAR · 8-K filed Jan 22, 2008