SKF AB Class A · OMXSTO:SKF_A
SKF AB Class A — Q1 2004 Earnings Presentation
13 slides from SKF AB Class A's earnings presentation, Nov 21, 2004

Slide 1: oKr
oKr
Slide 2: The SKF Group First-quarter result 2004
The SKF Group First-quarter result 2004 Tom Johnstone, President and CEO
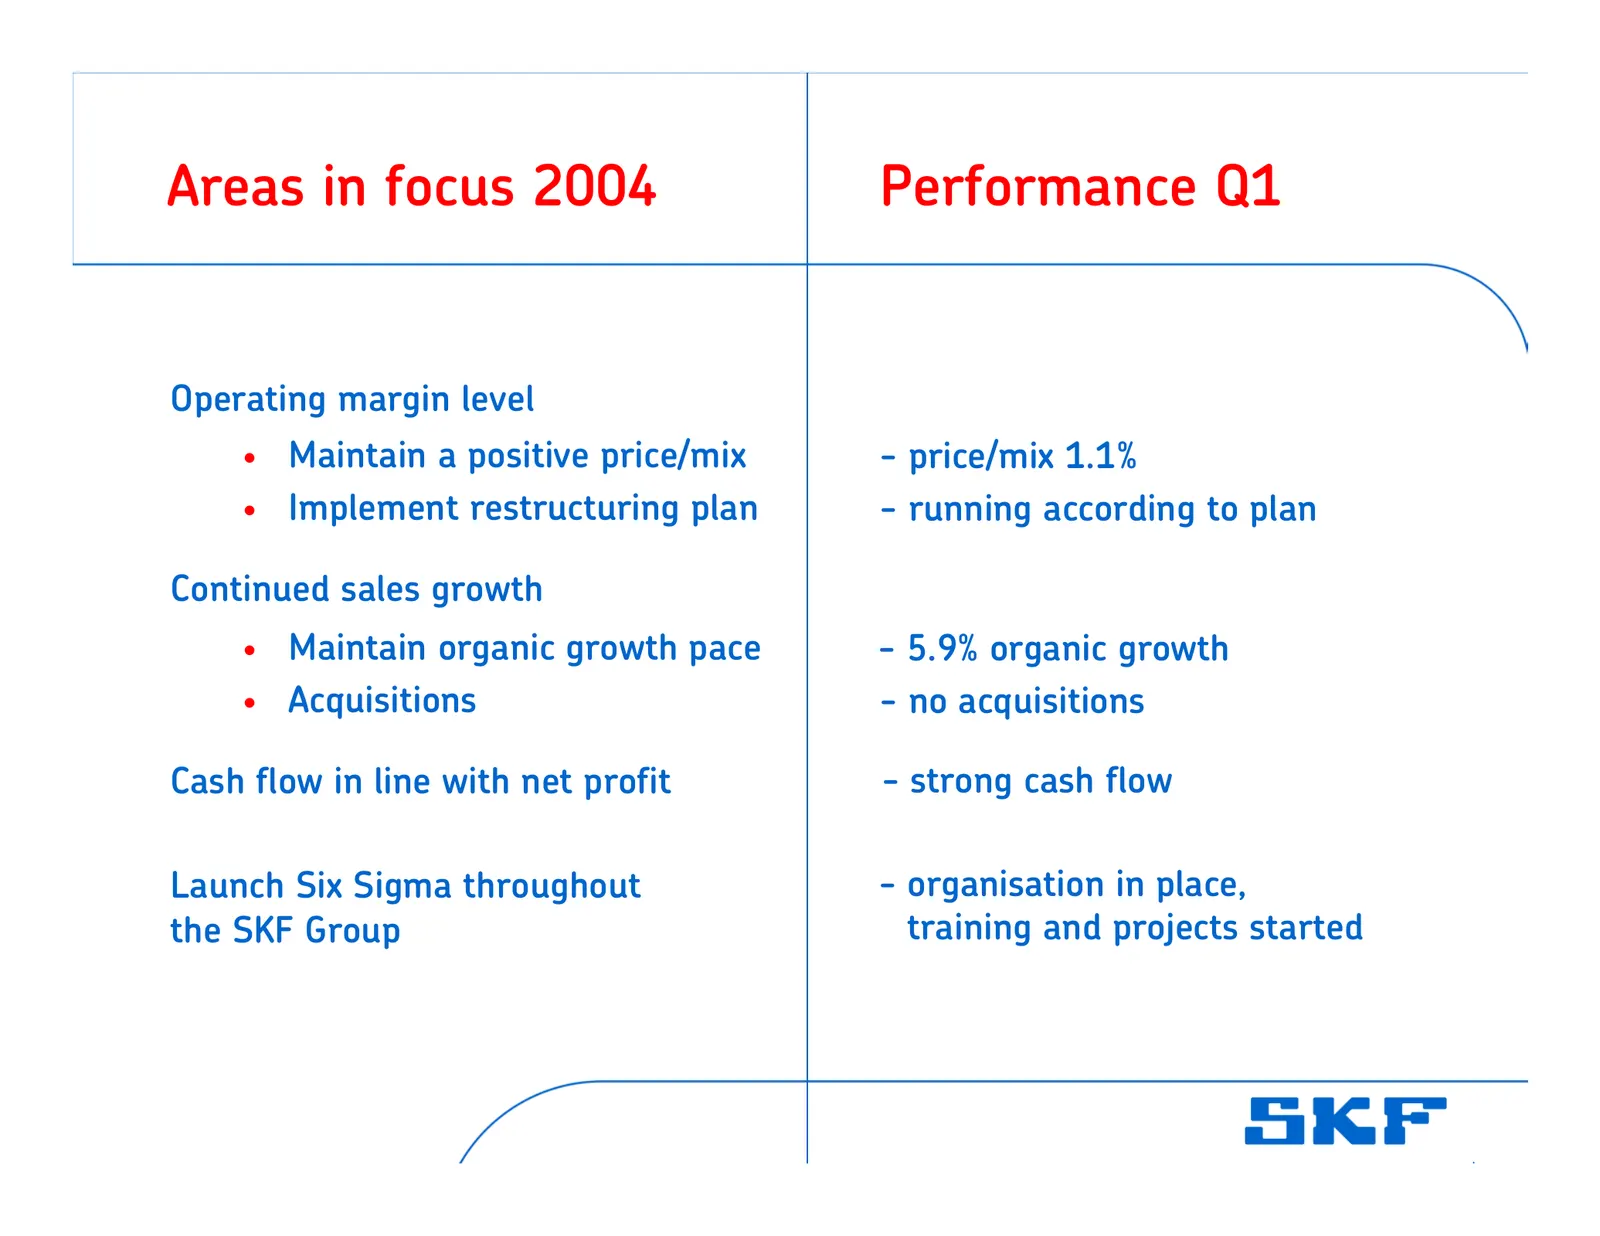
Slide 3: Areas in focus 2004 Performance Q1
Areas in focus 2004 Performance Q1 Operating margin level • Maintain a positive price/mix - price/mix 1.1% • Implement restructuring plan - running according to plan Continued sales growth • Maintain organic growth pace - 5.9% organic growth • Acquisitions - no acquisitions Cash flow in line with ne
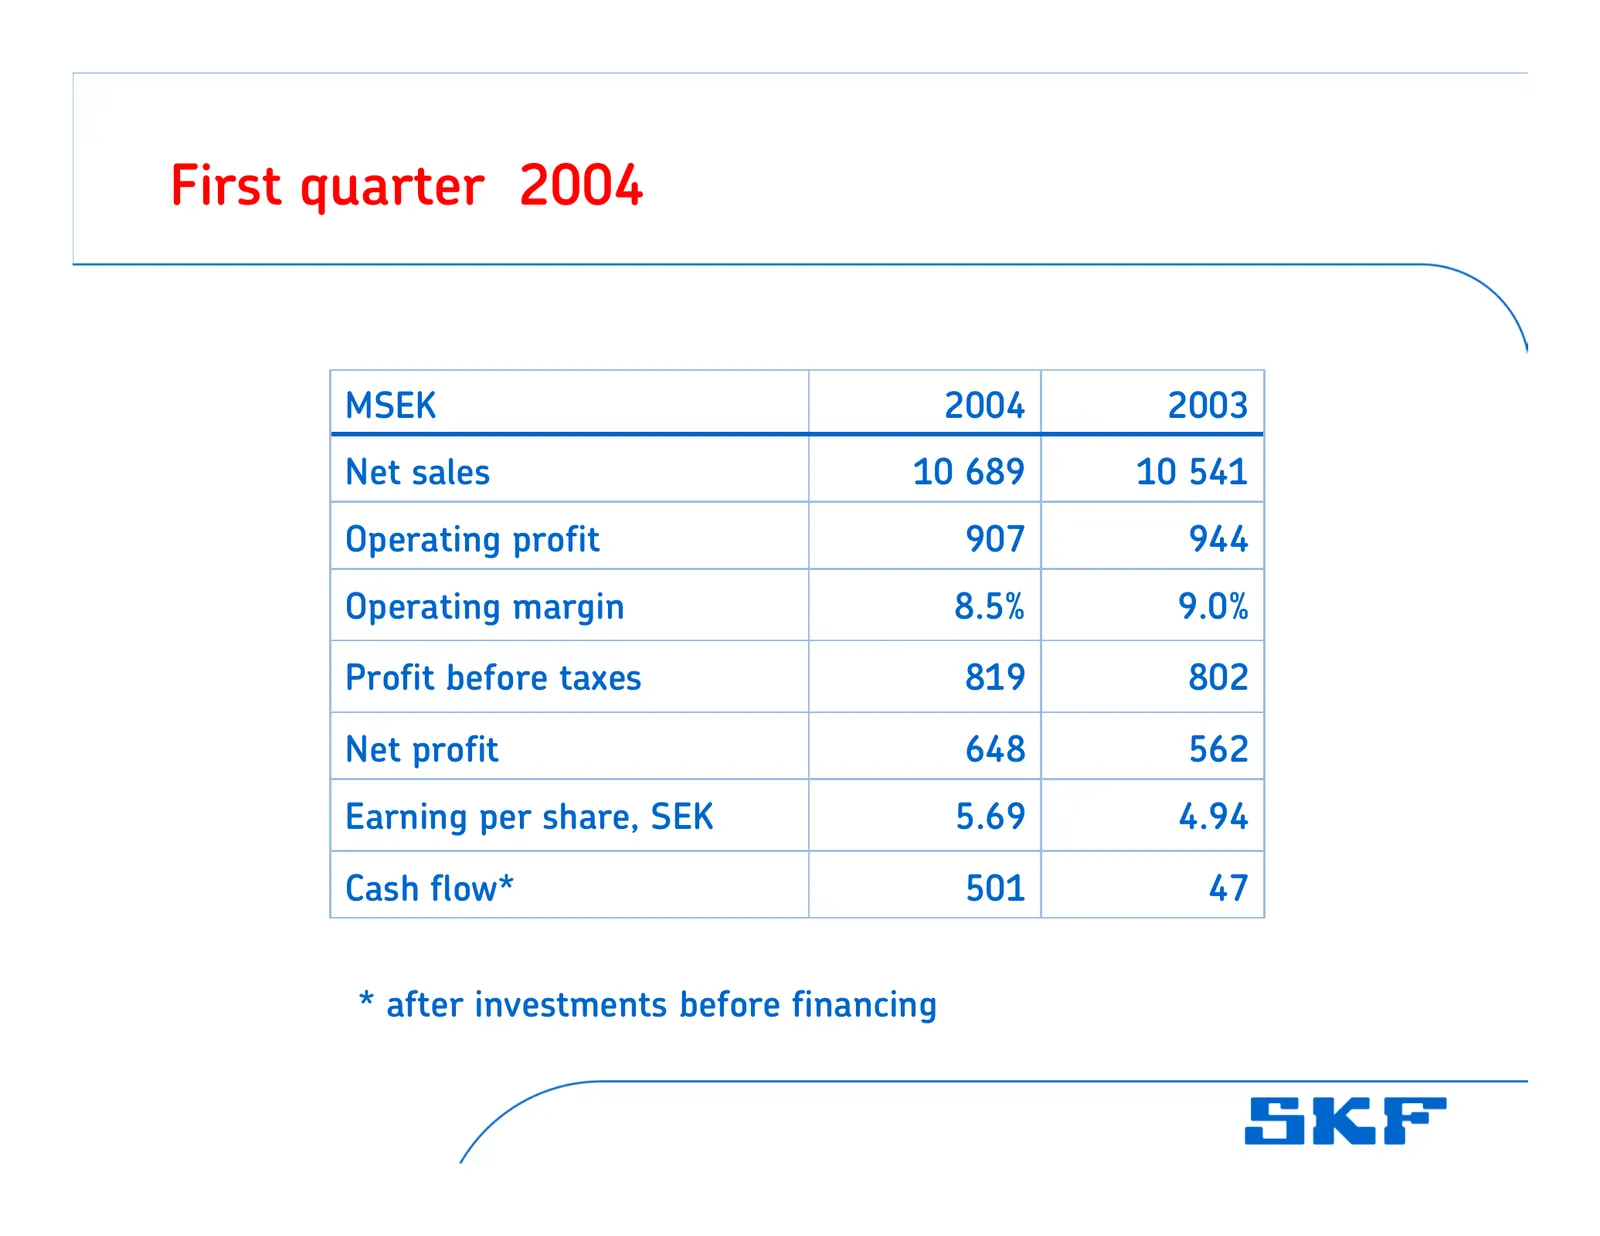
Slide 4: First quarter 2004
First quarter 2004 MSEK 2004 2003 Net sales 10 689 10 541 Operating profit 907 944 Operating margin 8.5% 9.0% Profit before taxes 819 802 Net profit 648 562 Earning per share, SEK 5.69 4.94 Cash flow* 501 47 * after investments before financing
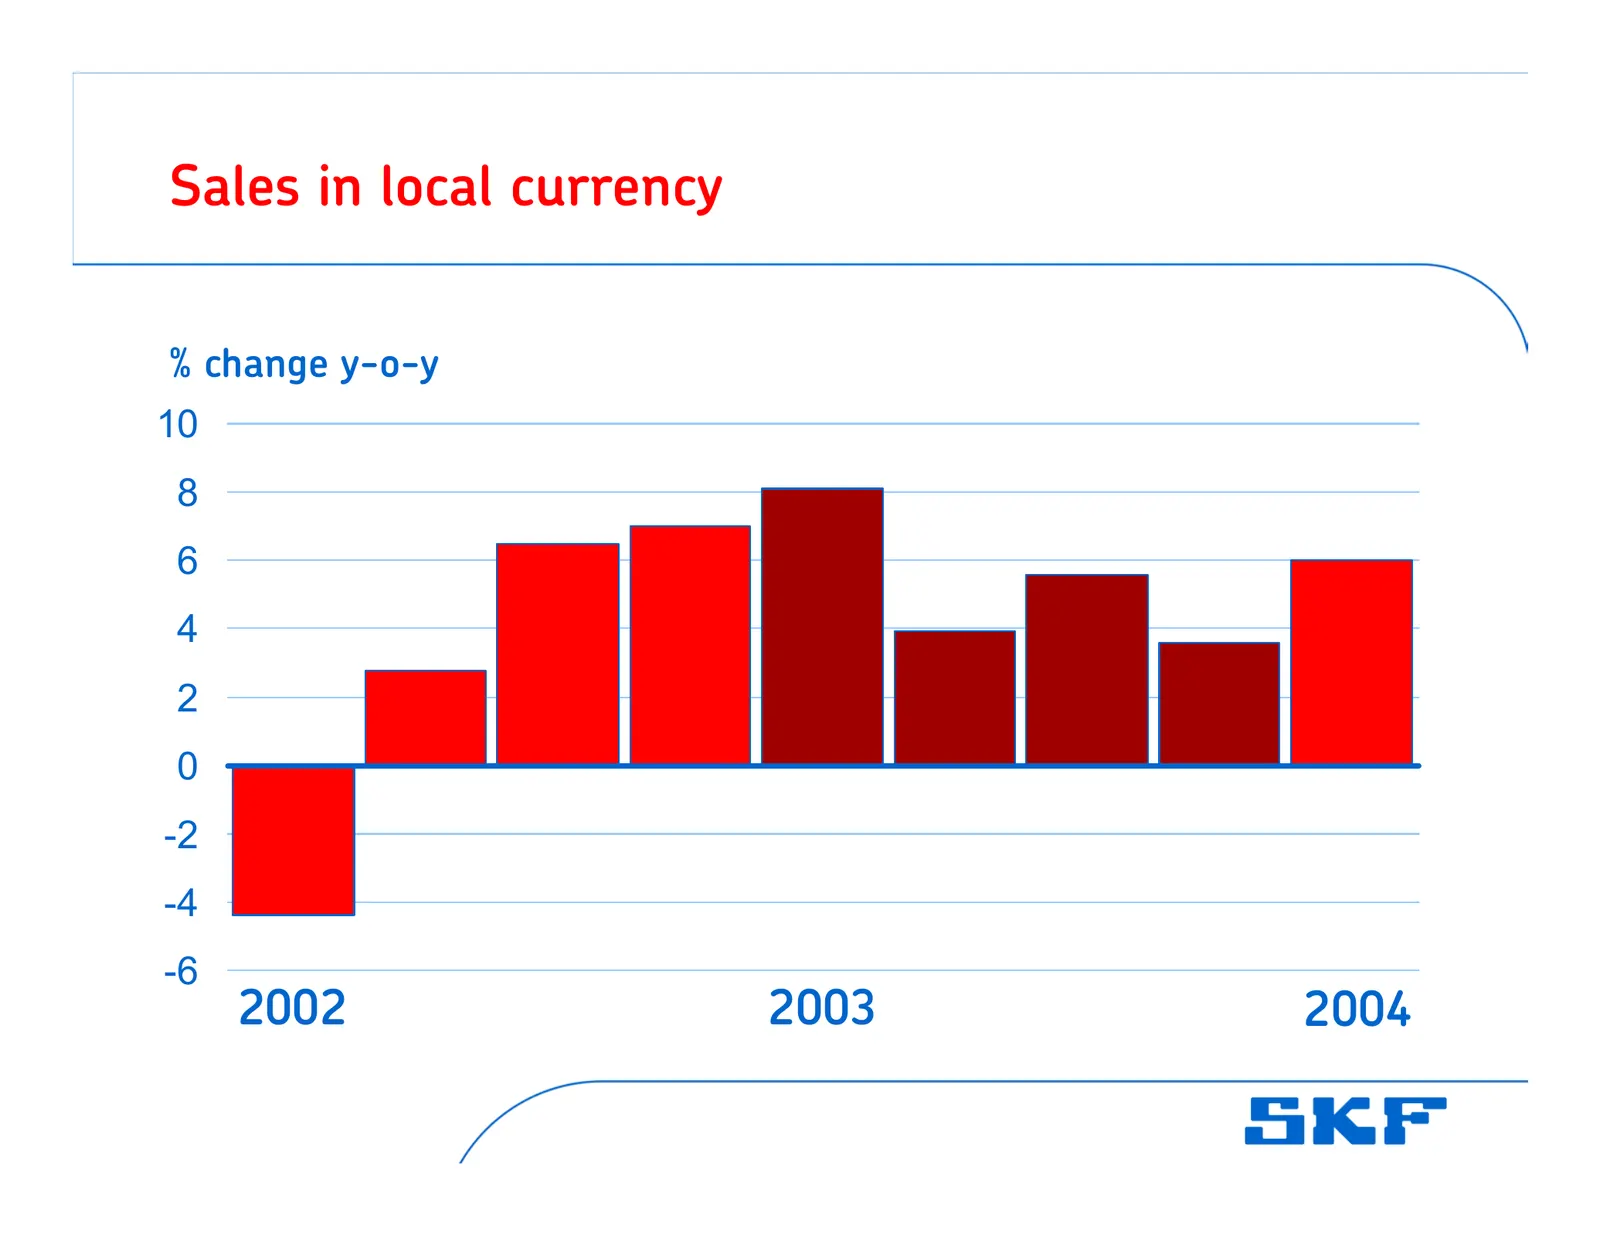
Slide 5: Sales in local currency
Sales in local currency % change y-o-y 10 8 6 4 2 0 -2 -4 -6 2002 2003 2004
Slide 6: Net sales development per quarter
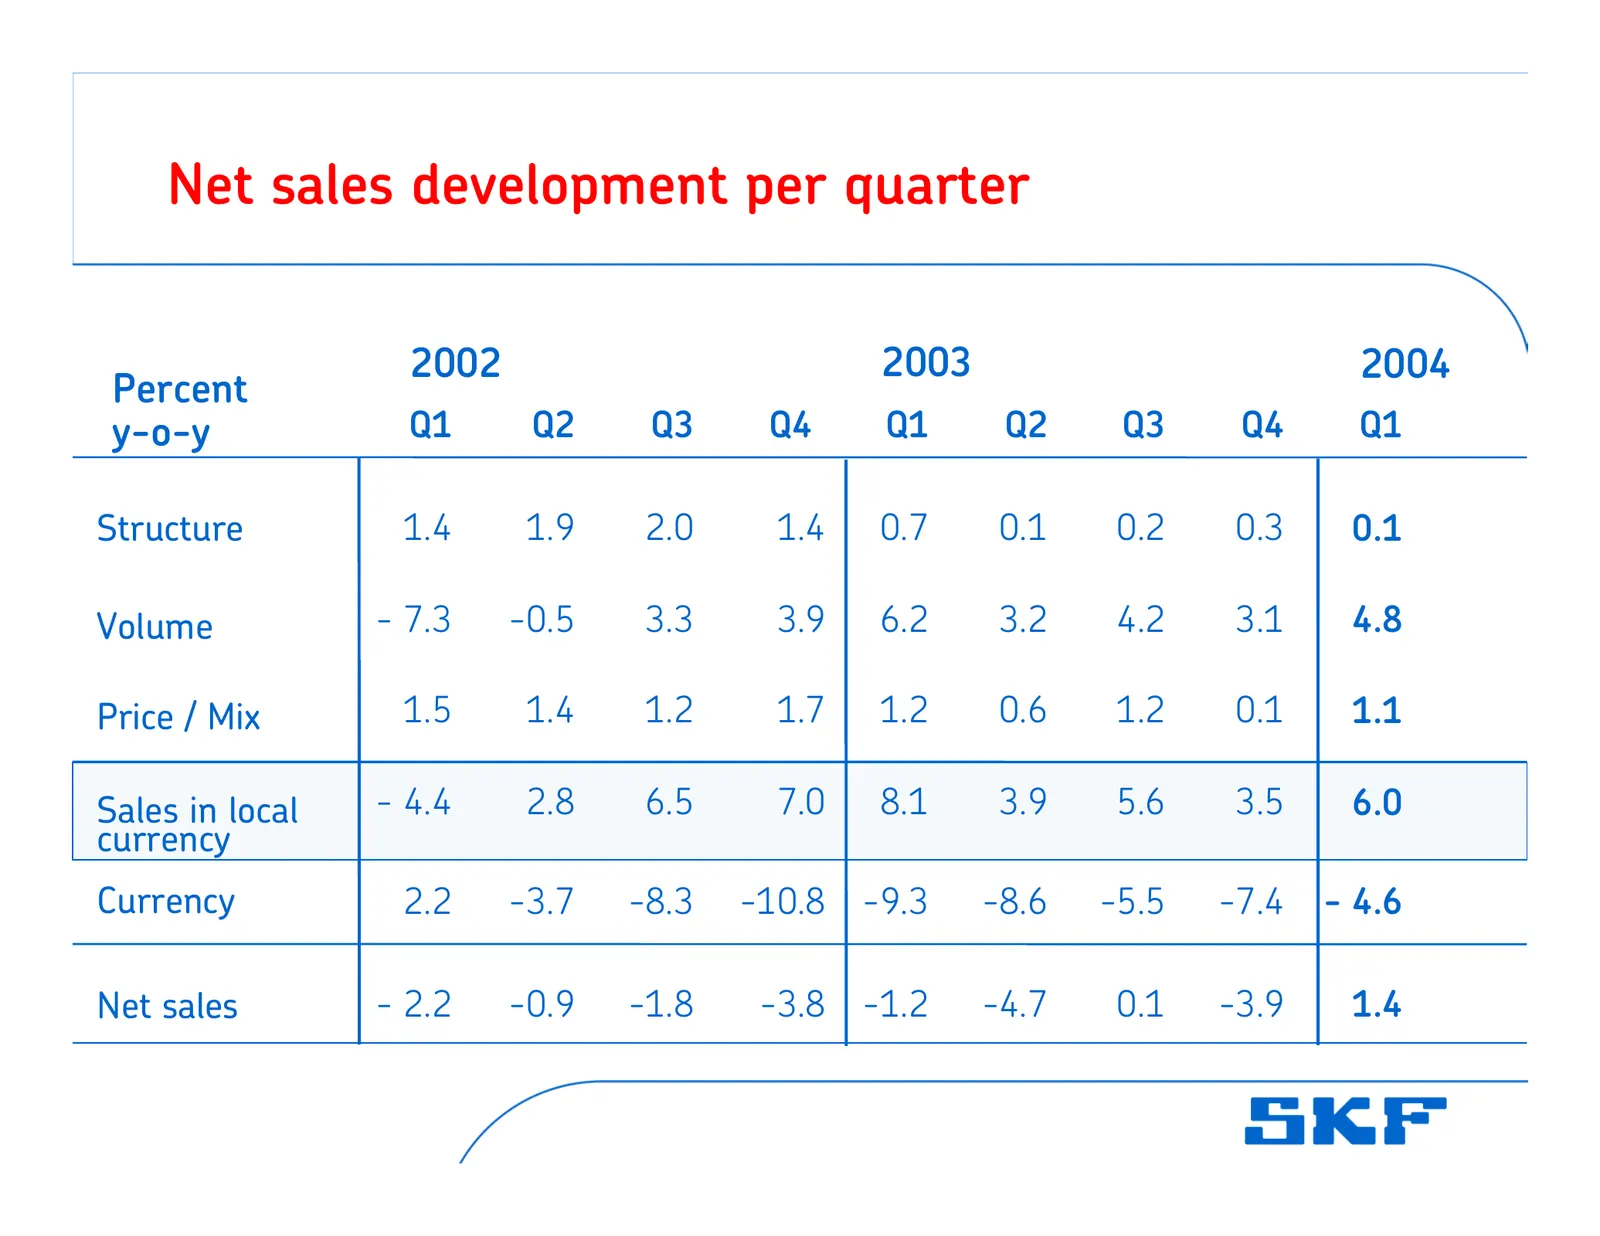
Net sales development per quarter 2002 2003 2004 Percent y-o-y Q1 Q2 Q3 Q4 Q1 Q2 Q3 Q4 Q1 Structure 1.4 1.9 2.0 1.4 0.7 0.1 0.2 0.3 0.1 Volume - 7.3 -0.5 3.3 3.9 6.2 3.2 4.2 3.1 4.8 Price / Mix 1.5 1.4 1.2 1.7 1.2 0.6 1.2 0.1 1.1 Sales in local - 4.4 2.8 6.5 7.0 8.1 3.9 5.6 3.5 6.0 currency Currency
Slide 7: Operating margin
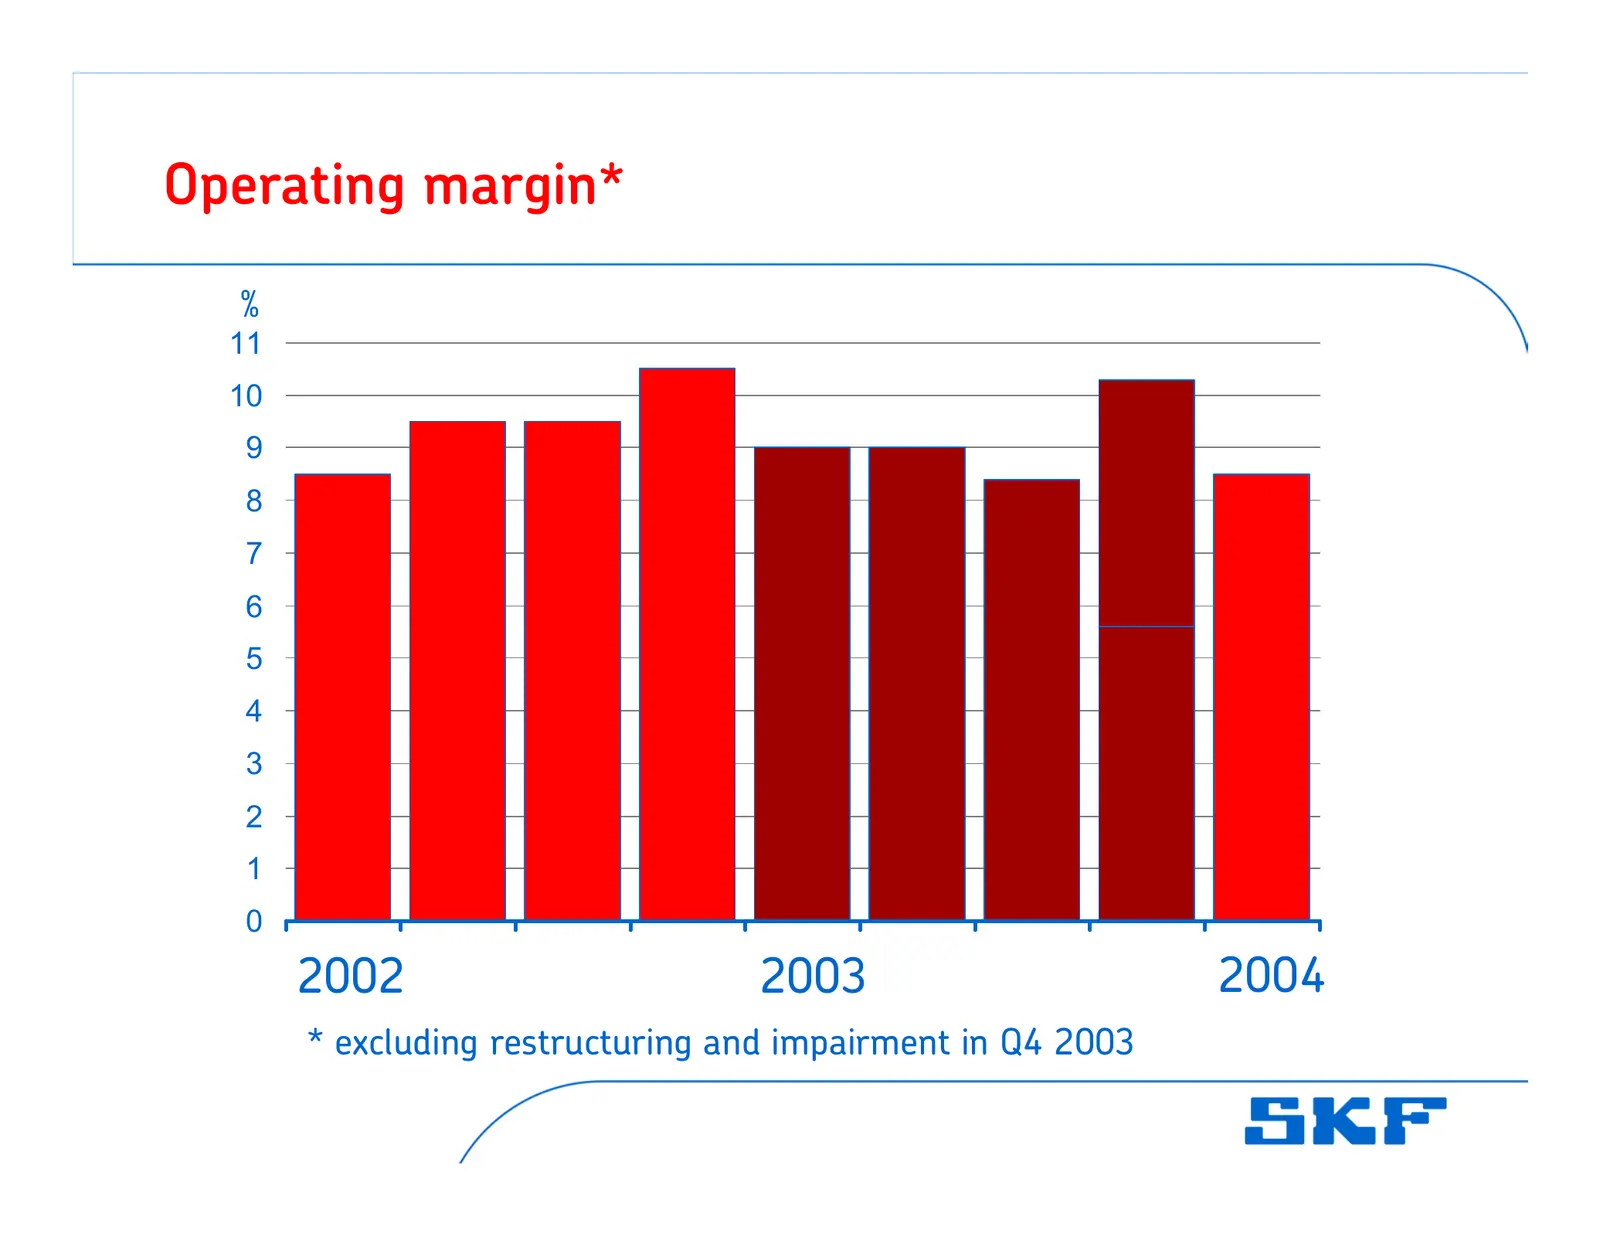
Operating margin* % 11 10 9 8 7 6 5 4 3 2 1 0 2002 2003 2004 * excluding restructuring and impairment in Q4 2003
Slide 8: Operating margin per division
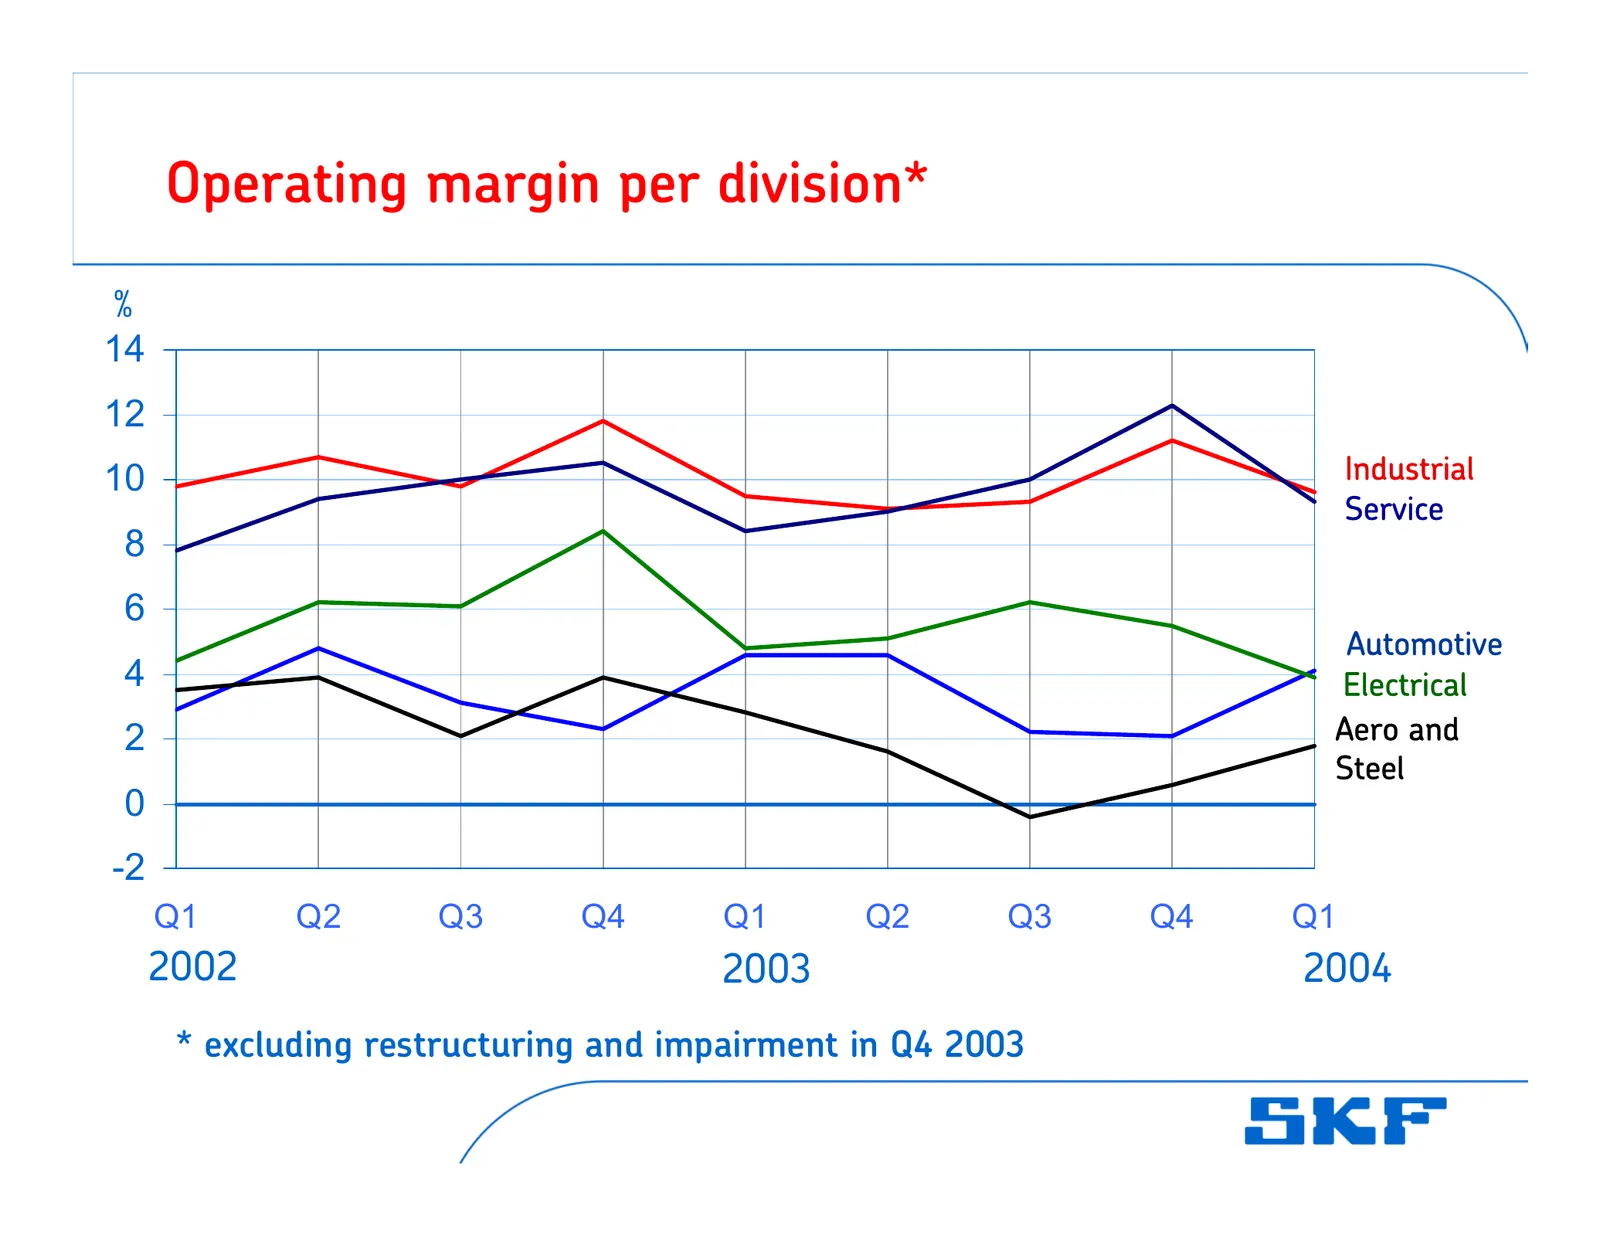
Operating margin per division* % 14 12 10 Industrial Service 8 6 Automotive 4 Electrical 2 Aero and Steel 0 -2 Q1 Q2 Q3 Q4 Q1 Q2 Q3 Q4 Q1 2002 2003 2004 * excluding restructuring and impairment in Q4 2003
Slide 9: Inventories as % of annual sales - Target 20%
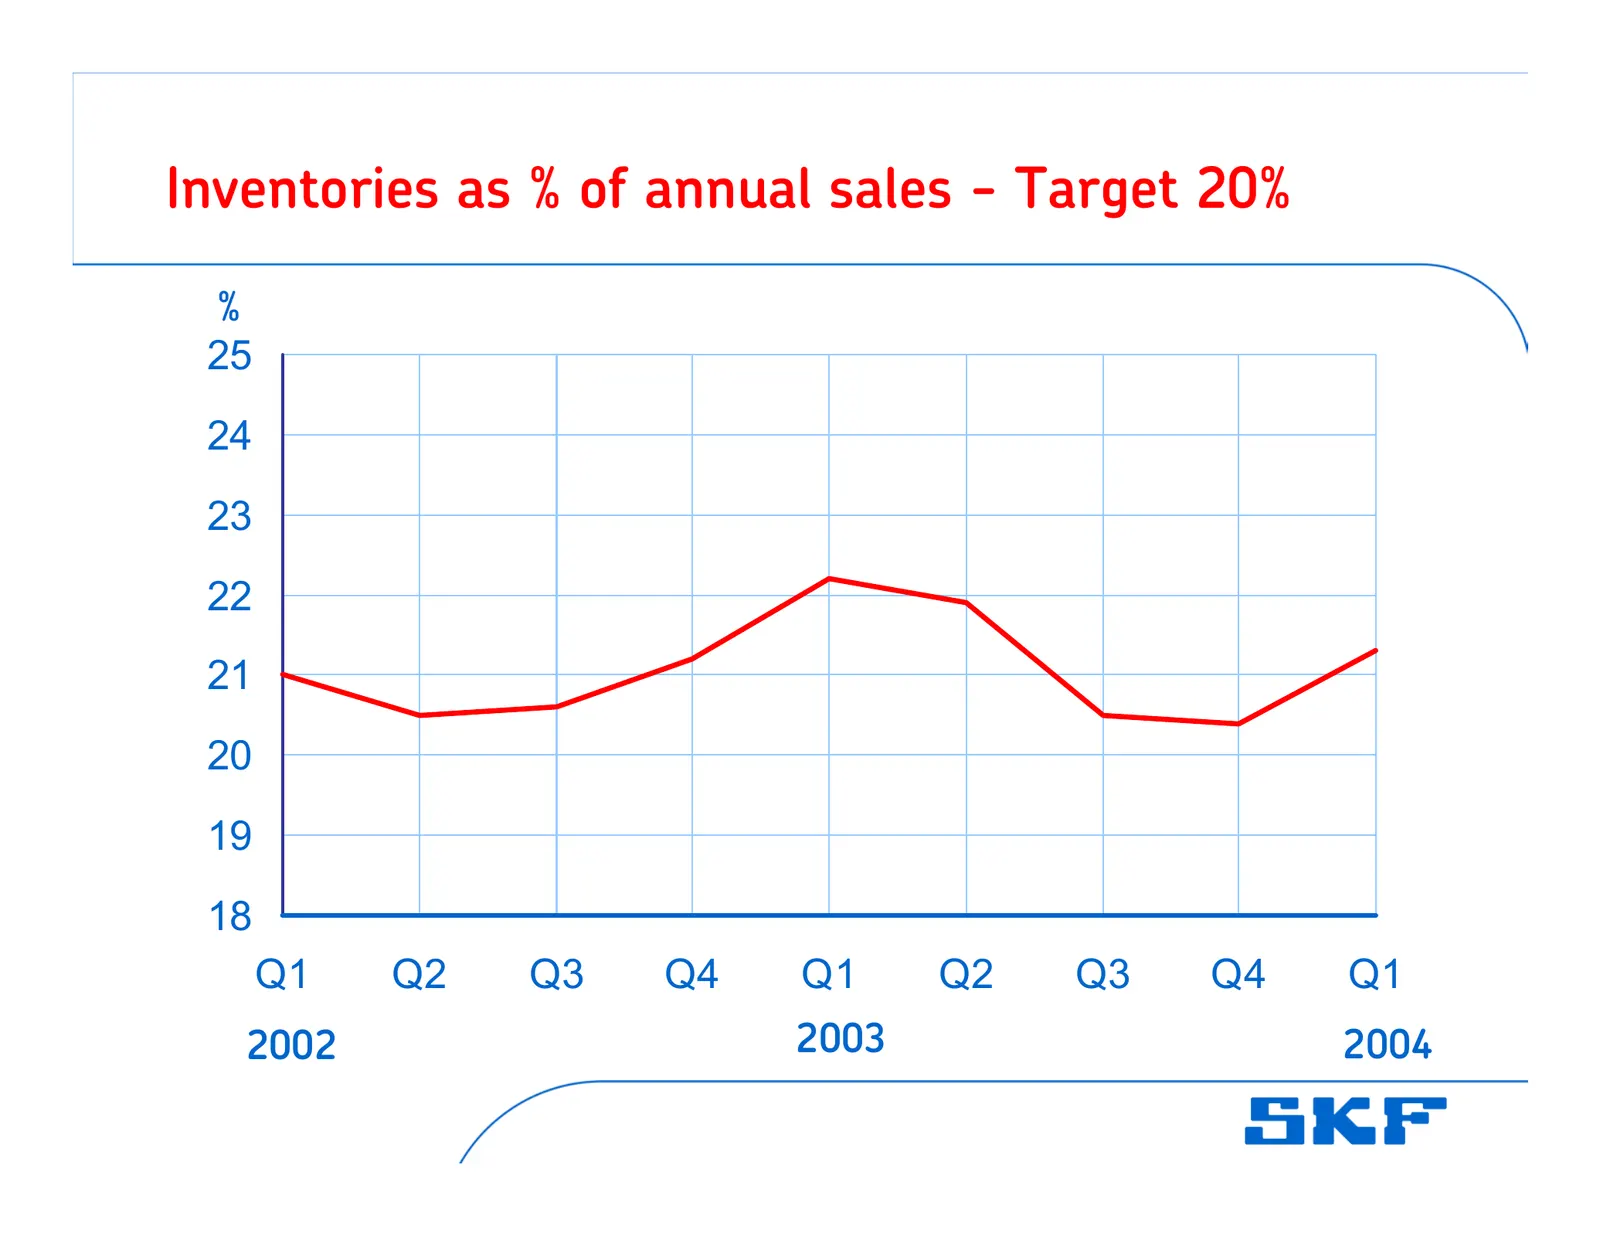
Inventories as % of annual sales - Target 20% % 25 24 23 22 21 20 19 18 Q1 Q2 Q3 Q4 Q1 Q2 Q3 Q4 Q1 2002 2003 2004
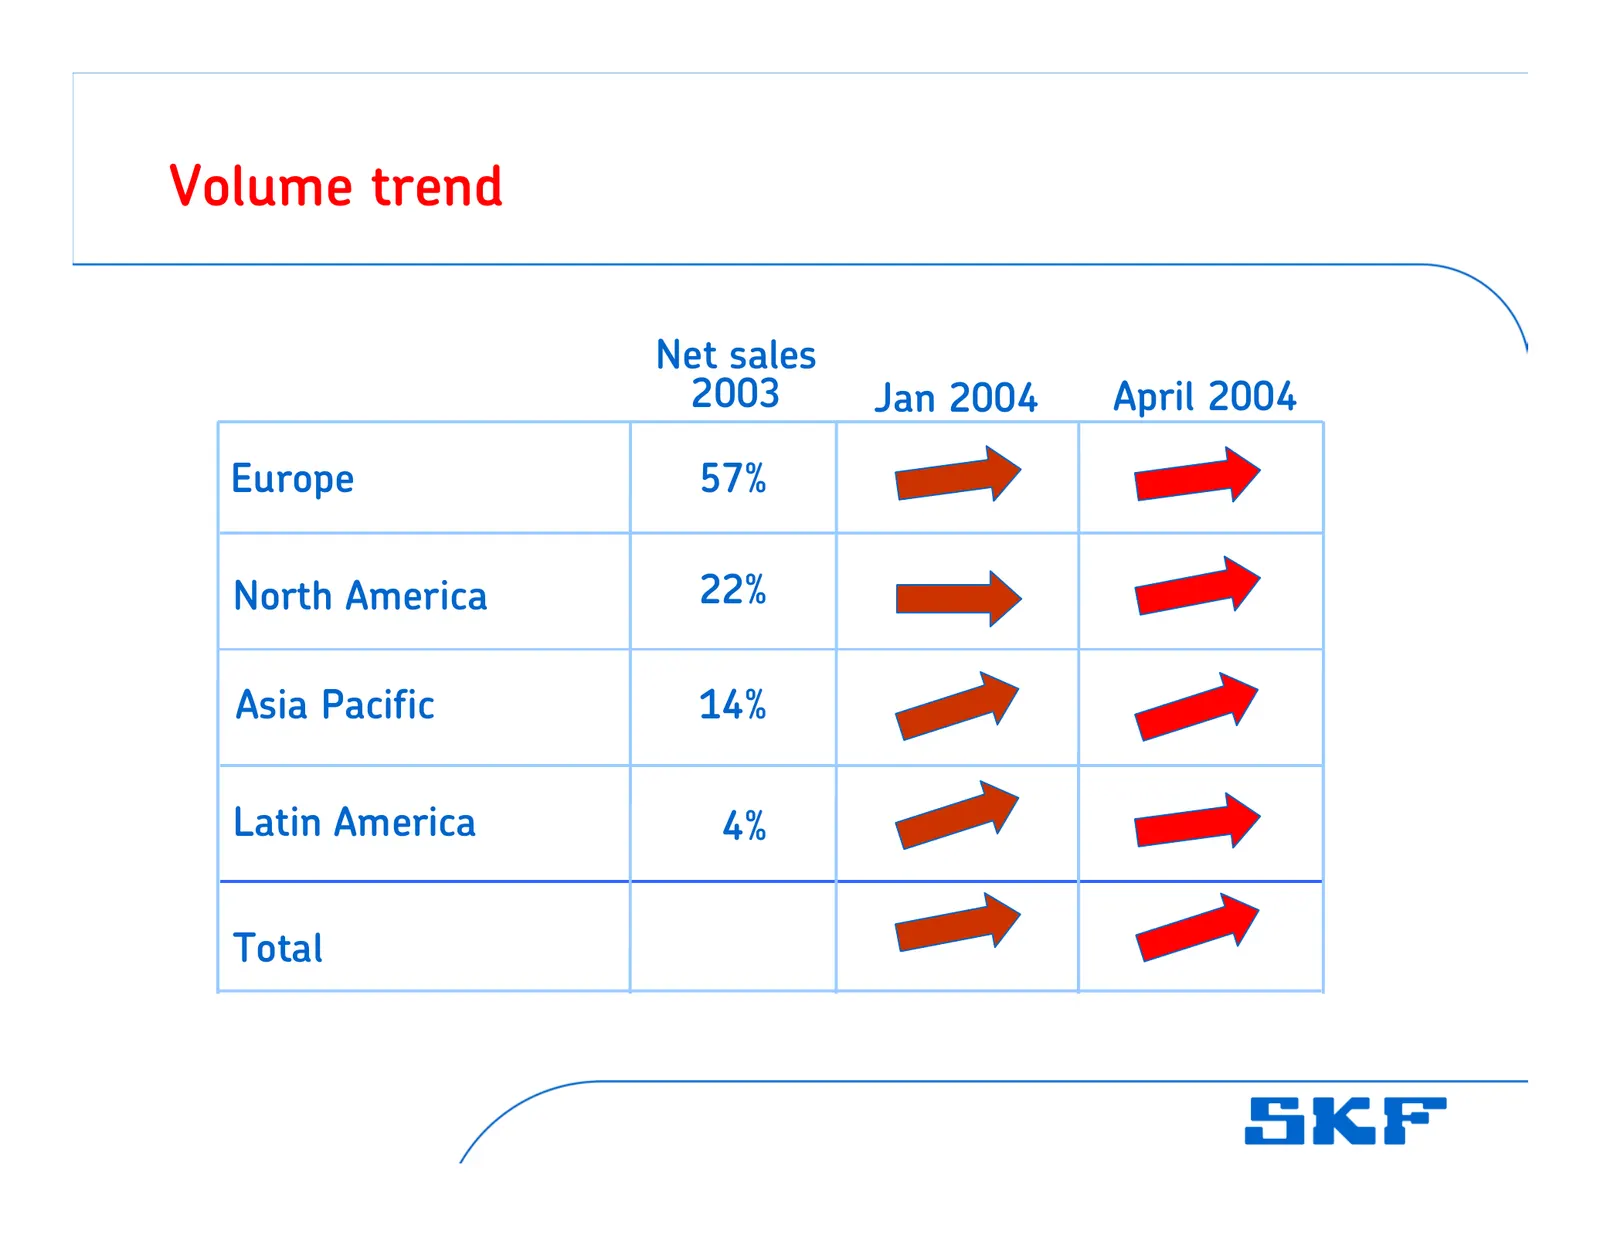
Slide 10: Volume trend
Volume trend Net sales 2003 Jan 2004 April 2004 Europe 57% North America 22% Asia Pacific 14% Latin America 4% Total
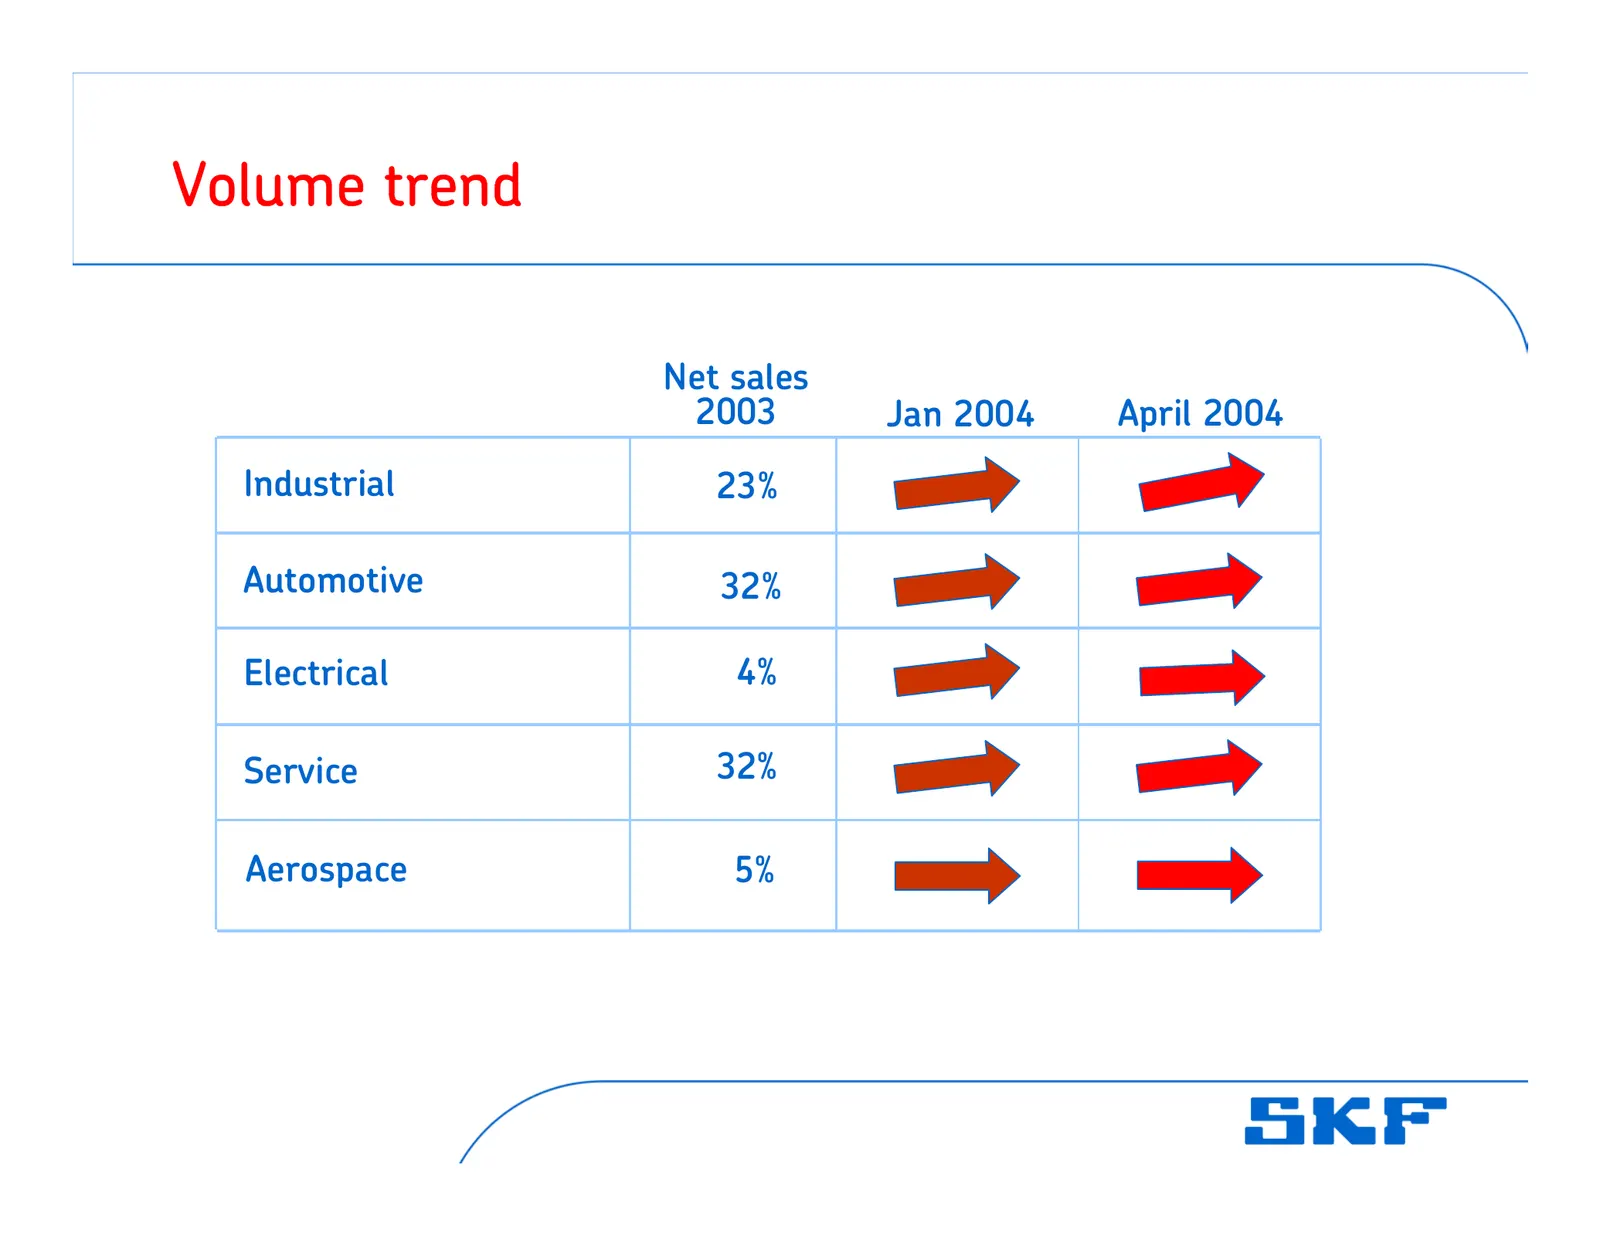
Slide 11: Volume trend
Volume trend Net sales 2003 Jan 2004 April 2004 Industrial 23% Automotive 32% Electrical 4% Service 32% Aerospace 5%
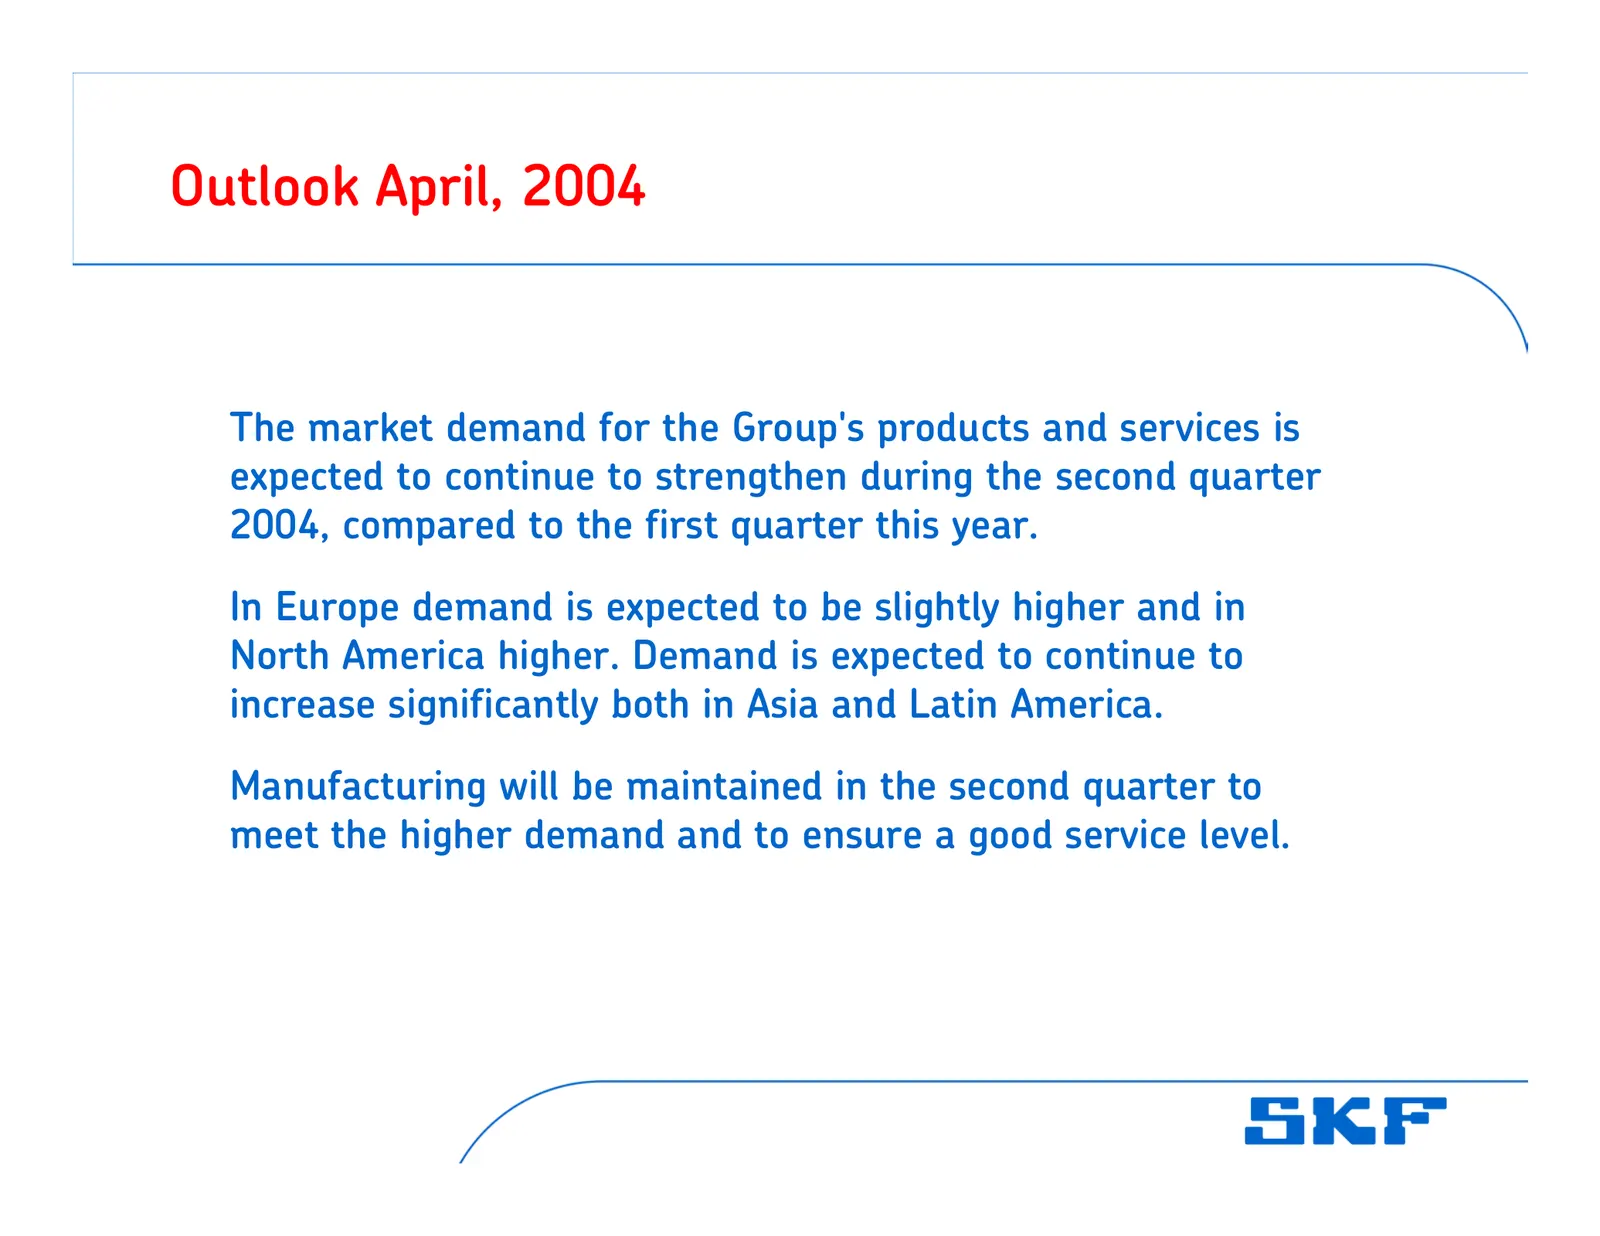
Slide 12: Outlook April, 2004
Outlook April, 2004 The market demand for the Group's products and services is expected to continue to strengthen during the second quarter 2004, compared to the first quarter this year. In Europe demand is expected to be slightly higher and in North America higher. Demand is expected to continue to
Slide 13: Cautionary Statement
Cautionary Statement This report contains forward-looking statements that are based on the current expectations of the management of SKF. Although management believes that the expectations reflected in such forward-looking statements are reasonable, no assurance can be given that such expectations w
Source: Internet Archive copy of investors.skf.com
More decks from SKF AB Class A
 Q3 2026 Earnings Presentation20 slides · Oct 21, 2026
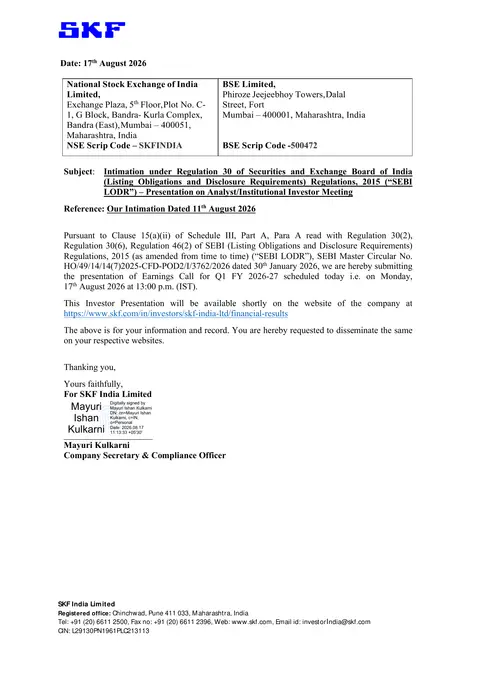 SKF India — Q1 FY2026-27 Earnings Presentation20 slides · Aug 17, 2026
 Q2 2026 Earnings Presentation21 slides · Jul 17, 2026
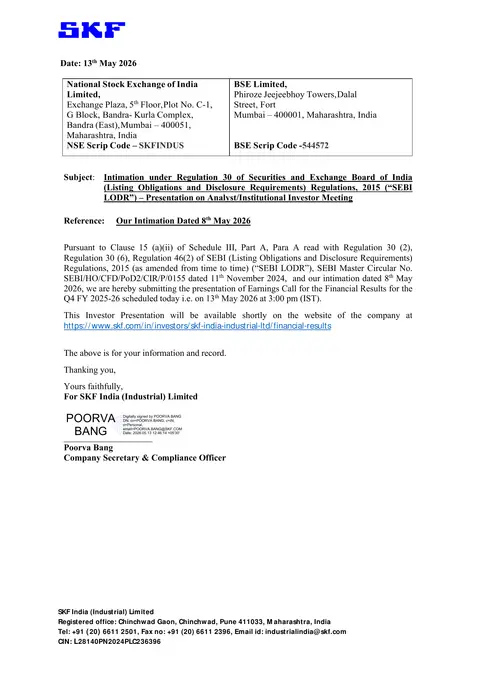 SKF India (Industrial) — Q4 FY2026 Earnings Presentation20 slides · May 13, 2026
 Q1 2026 Earnings Presentation22 slides · Apr 21, 2026
 Q4 2025 Earnings Presentation19 slides · Jan 30, 2026