Del Monte Foods — Merger or Acquisition (June 2002)
40 slides from Del Monte Foods's merger presentation, Jun 17, 2002
Slide 1: The New Del Monte Investor Presentation
Del Monte Quality The New Del Monte investor Presentation June 2002
Slide 2: Safe Harbor Statements
Safe Harbor Statements Del Monte will fle a proxy staterent-prospectus and other relevant documents concerning the proposed mer ger transaction with the Securities and Exchange Commission (“SEC”). Investors are urged to read the proxy statement prospectus when k becomes available and other relevant
Slide 3: Management Team
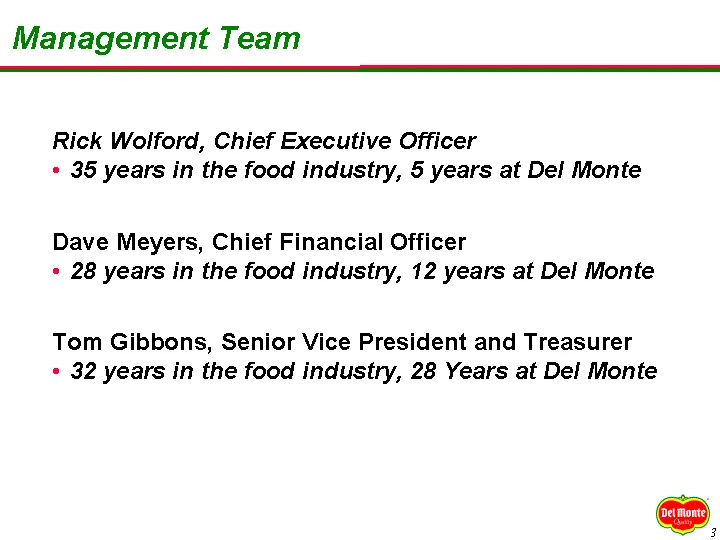
Management Team Rick Wolford, Chief Executive Officer * 35 years in the food industry, 5 years at Del Monte Dave Meyers, Chief Financial Officer « 28 years in the food industry, 12 years at Del Monte Tom Gibbons, Senior Vice President and Treasurer * 32 years in the food industry, 28 Years at Del Mo
Slide 4: Transaction Overview
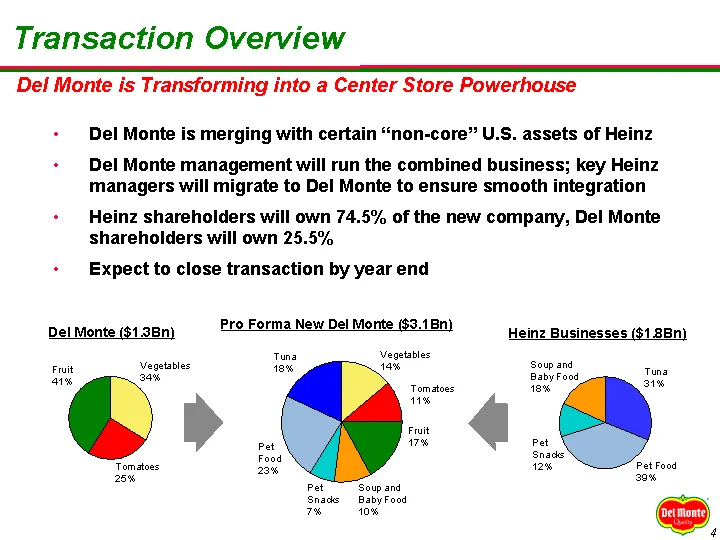
Transaction Overview Def Monte is Transforming into a Center Store Powerhouse + Del Monte is merging with certain “non-core” U.S. assets of Heinz + Del Monte management will run the combined business; key Heinz managers will migrate to Del Monte to ensure smooth integration + Heinz shareholders will
Slide 5: Investor Highlights
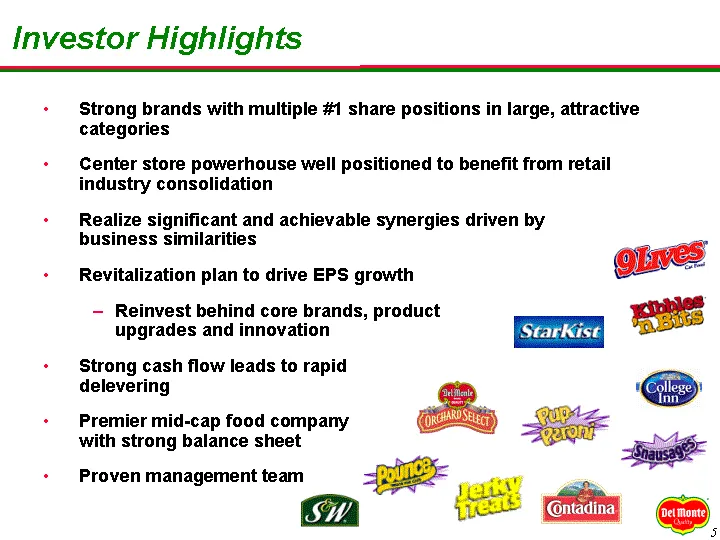
Investor Highlights + Strong brands with multiple #1 share positions in large, attractive categories + Center store powerhouse well positioned to benefit from retail industry consolidation + Realize significant and achievable synergies driven by business similarities + Revitalization plan to drive E
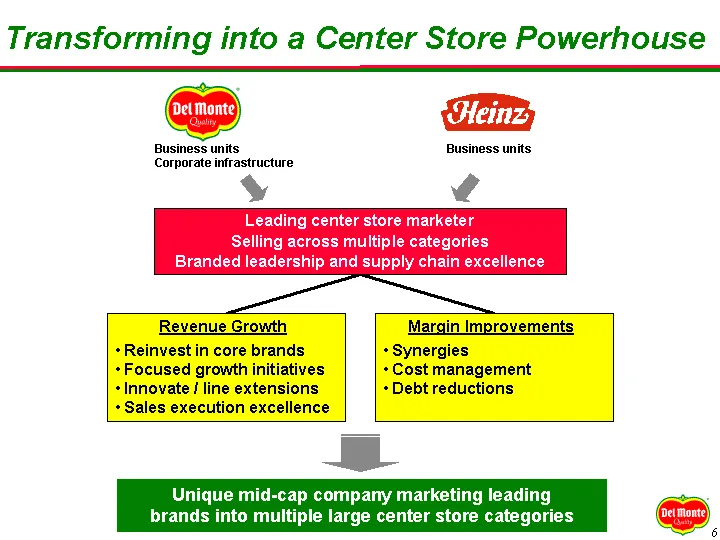
Slide 6: Transforming into a Center Store Powerhouse
Transforming into a Center Store Powerhouse | Heinz) Business units Bu Corporate infrastructure b 7 4 Leading center store marketer Selling across multiple categories Branded leadership and supply chain excellence Revenue Growth Margin Improvements + Reinvest in core brands + Synergies + Focused gro
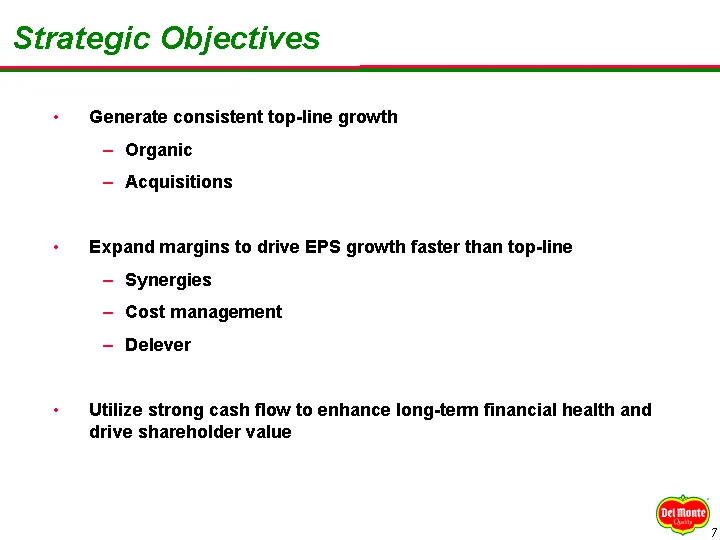
Slide 7: Strategic Objectives
Strategic Objectives + Generate consistent top-line growth — Organic — Acquisitions + Expand margins to drive EPS growth faster than top-line — Synergies — Cost management — Delever + Utilize strong cash flow to enhance long-term financial health and drive shareholder value SS,
Slide 8: Strategic Rationale
Strategic Rationale
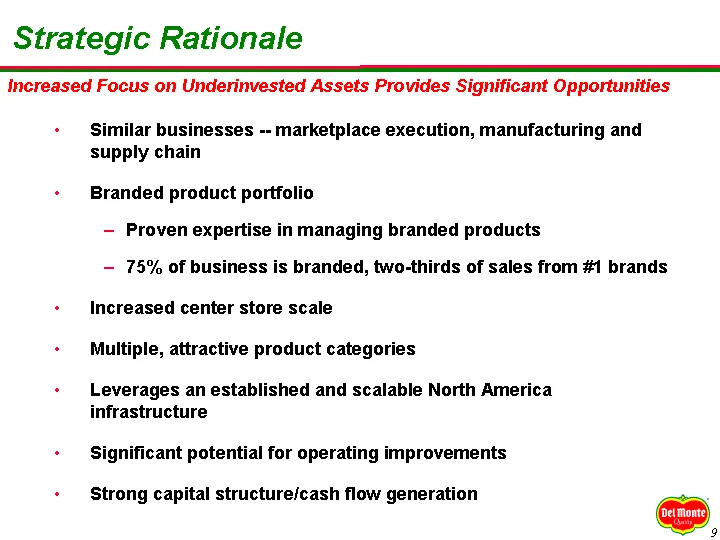
Slide 9: Strategic Rationale
Strategic Rationale increased Focus on Underinvested Assets Provides Significant Opportunities Similar businesses -- marketplace execution, manufacturing and supply chain Branded product portfolio — Proven expertise in managing branded products — 75% of business is branded, two-thirds of sales from
Slide 10: Strong Portfolio of Leading Brands...
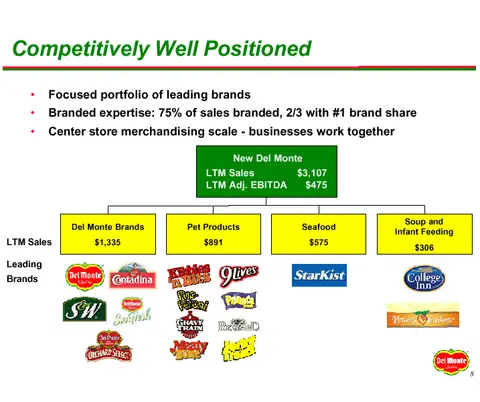
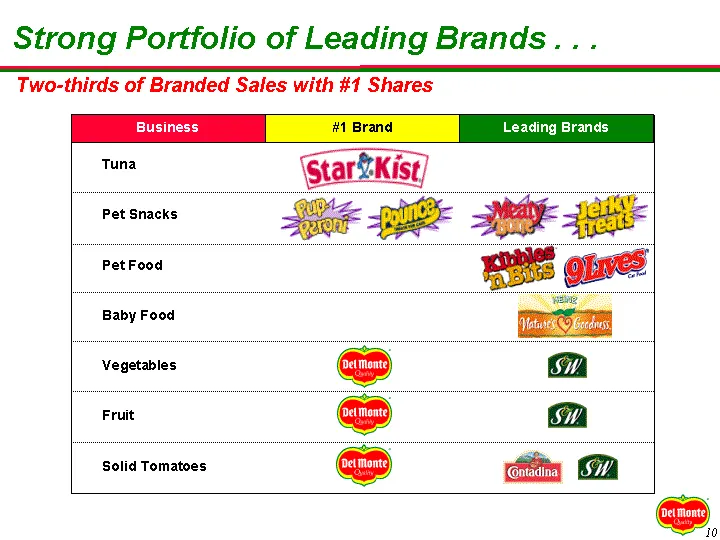
Strong Portfolio of Leading Brands... Two-thirds of Branded Sales with #1 Shares Business Leading Brands Tuna Pet Food Baby Food Vegetables S ru S a Solid Tomatoes iE 2 ee on
Slide 11: ...In Attractive Categories...
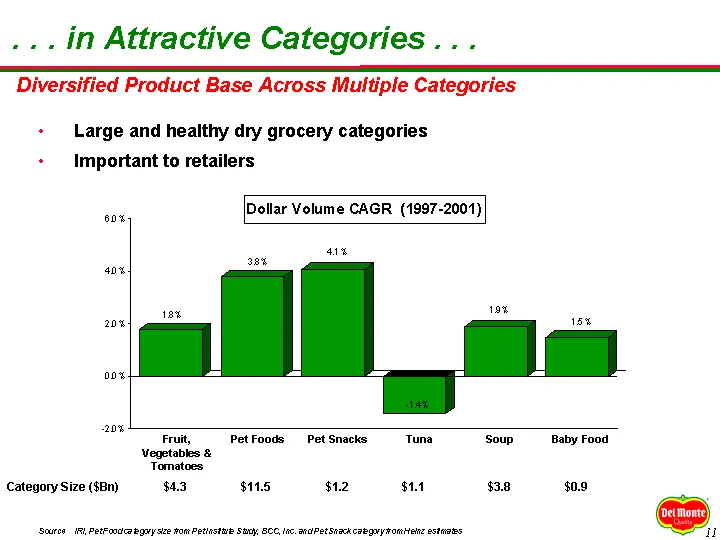
...4n Attractive Categories... Diversified Product Base Across Multiple Categories + Large and healthy dry grocery categories + Important to retailers Dollar Volume CAGR (1997-2001) Fruit, PetFoods Pet Snacks Tuna Soup Baby Food Vegetables & Tomatoes Category Size ($Bn) $43 $115 $12 $14 $38 $0.9 Sou
Slide 12: ... Results in a Premier Mid Cap Food Co...
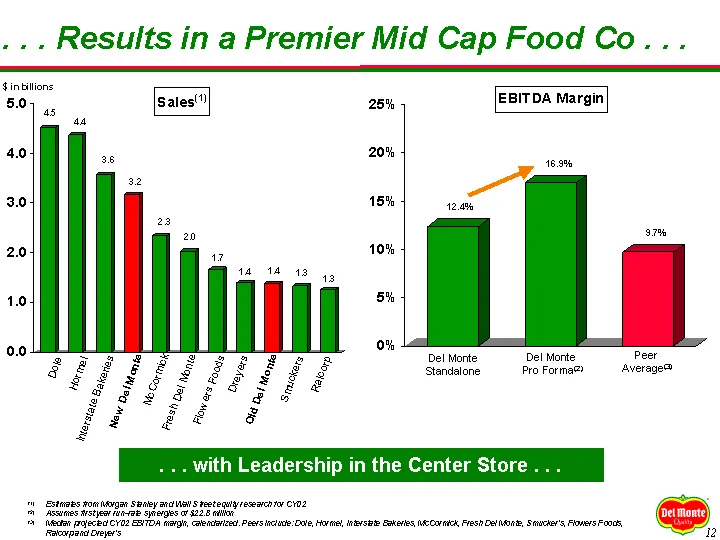
... Results in a Premier Mid Cap Food Co... $intitions 5.0 Sales") EBITDA Margin Del Morte Del Morte Peer Standalone Pro Formam Averages Stems roars spay ae at etegtyrese C02 ‘estes Motjear te sptrges a tome pceacras son ae ERE. Pes De, Ho ni ats CCC Pes DH Sec OMS D0, , mowpan 2
Slide 13: ... With a Strong Financial Foundation
... With a Strong Financial Foundation Opportunity to Drive Shareholder Value + Accretive to EPS in the first full year post closing + Substantial cash flow generation to execute strategy — Investment in growth initiatives — Significant and immediate delevering — Acquisitions + Pro forma equity valu
Slide 14: Execution
Execution
Slide 15: Key Elements of Execution
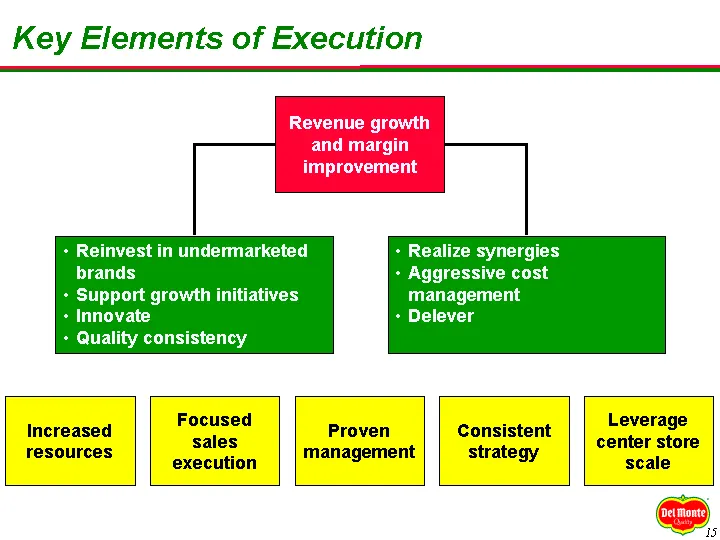
Key Elements of Execution Revenue growth and margin improvement + Reinvest in undermarketed + Realize synergies brands + Aggressive cost + Support growth initiatives management + Innovate + Delever + Quality consistency Focused . Leverage Increased sales Proven Consistent center store resources " ma
Slide 16: Investment in Quality, Brands and Innovation
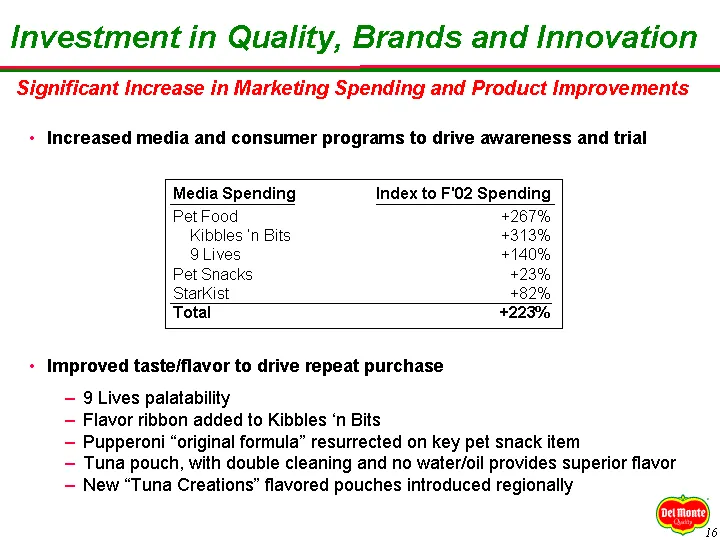
Investment in Quality, Brands and Innovation Significant Increase in Marketing Spending and Product Improvements + Increased media and consumer programs to drive awareness and trial Media Spending Index to F'02 Spending Pet Food Kibbles 'n Bits 9 Lives Pet Snacks Starkist Total + Improved taste/flav
Slide 17: Proven Results at Del Monte
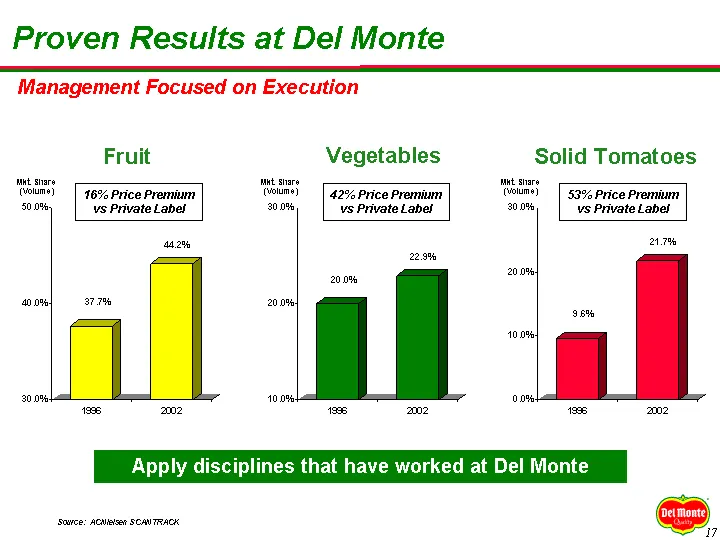
Proven Results at Del Monte Management Focused on Execution Fruit Vegetables Solid Tomatoes oun) | 76% Price Premium (woume) | 42% Price Premium wouns) | 53% Price Premium 50.0%) vs Private Label 30.0%) vs Private Label 30.0%) vs Private Label 21% Apply
Slide 18: Significant, Achievable Synergies
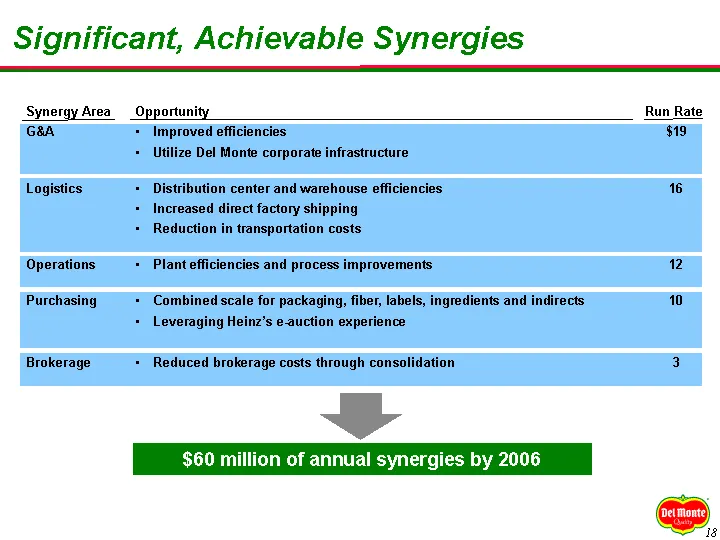
Significant, Achievable Synergies Synergy Area _Opportunity Run Rate GaA + Improved efficiencies $19 + Utilize Del Monte corporate infrastructure Logistics + Distribution center and warehouse efficiencies 6 + Increased direct factory shipping + Reduction in transportation costs Operations = Plant ef
Slide 19: Cost Management
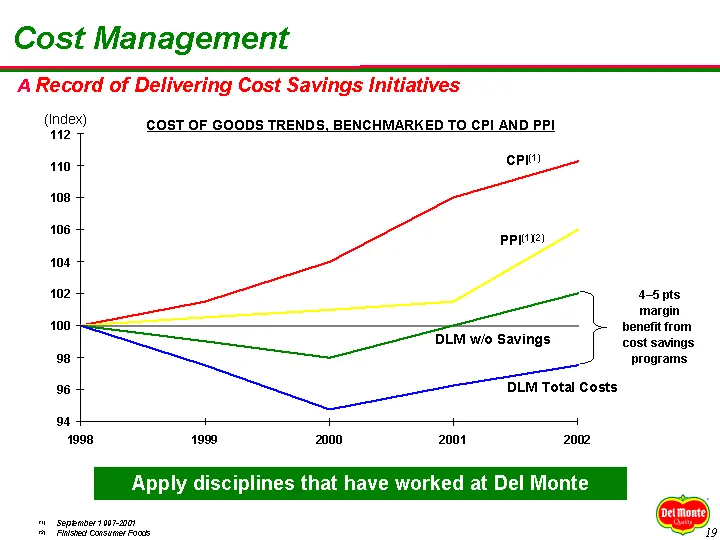
Cost Management A Record of Delivering Cost Savings Initiatives (ingen) COST OF GOODS TRENDS, BENCHMARKED TO CPI AND PPI 110 cpr) 108 0s PPIAI2) 104 102 45pts margin benefit from cost savings programs 100 DLM wio Savings DLM Total Costs 1998 1999 2000 2001 2002 Apply disciplines that have worked at
Slide 20: Focused Management with Proven Expertise
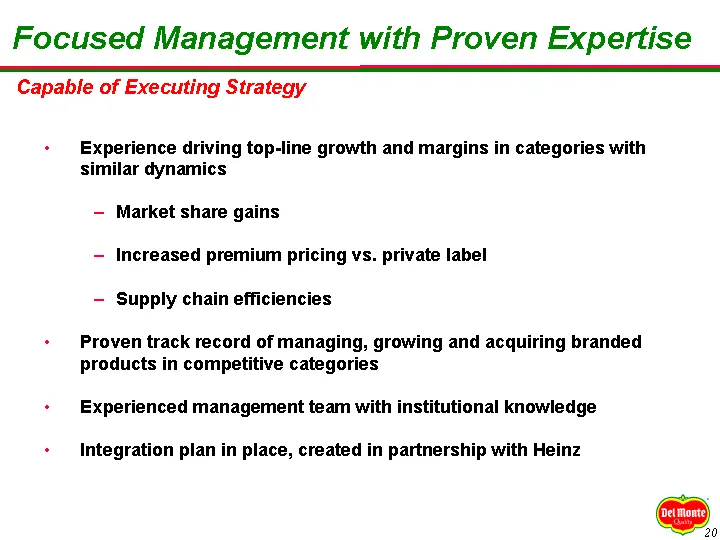
Focused Management with Proven Expertise Capable of Executing Strategy Experience driving top-line growth and margins in categories with similar dynamics — Market share gains — Increased premium pricing vs. private label — Supply chain efficiencies Proven track record of managing, growing and acquir
Slide 21: Leveraging the Del Monte Shared Services
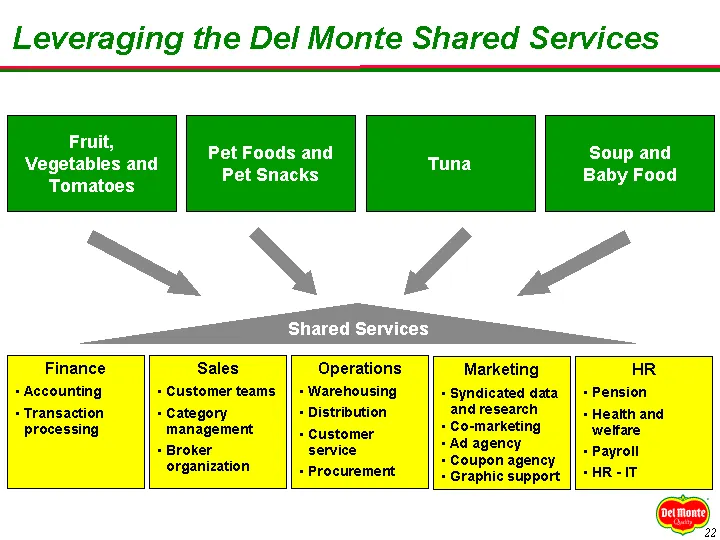
Leveraging the Del Monte Shared Services Fruit, Pet Foods and Soup and Vegetables and Tuna Pet Snacks Baby Food Tomatoes Finance Sales Operations Marketing HR + Accounting + Customer teams || - Warehousing = Syndicated data || - Pension + Transaction + Category + Distribution and research +Health an
Slide 22: The New Del Monte
The New Del Monte
Slide 23: The New Del Monte
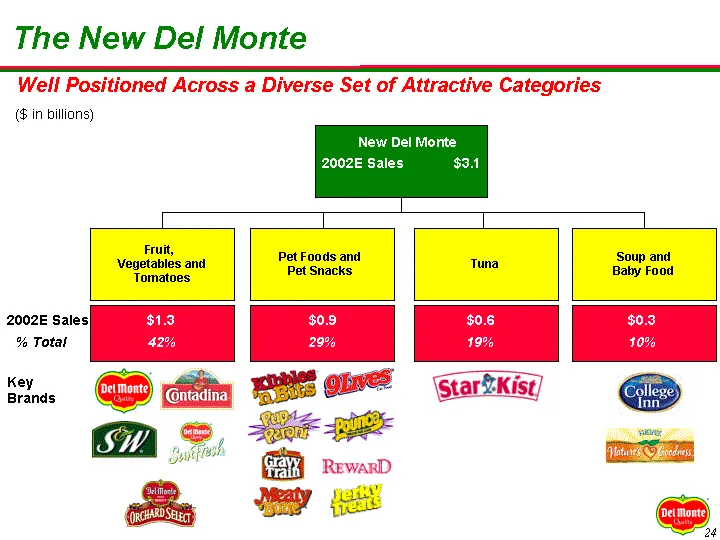
The New Del Monte Well Positioned Across a Diverse Set of Attractive Categories ($ in billions) @ ci aves New Del Monte 2002E Sales $3.4 Pet Foods and Pet Snacks Soup and Vegetatss and Baby Food Tomatoes 2002E Sales} % Total
Slide 24: Pet Foods
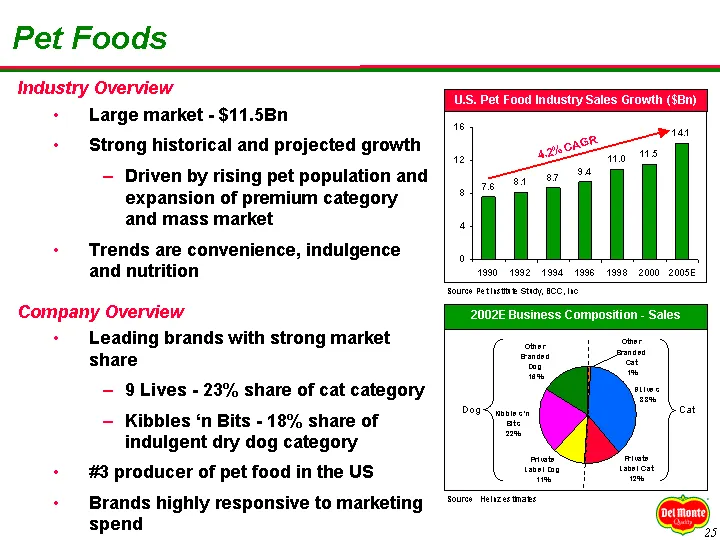
Pet Foods industry Overview + Large market - $11.5Bn + Strong historical and projected growth — Driven by ri; and mass market + Trends are convenience, indulgence and nutrition Company Overview + Leading brands with strong market share — 9Lives - 23% share of cat category — Kibbles ‘n Bits - 18% sha
Slide 25: Pet Snacks
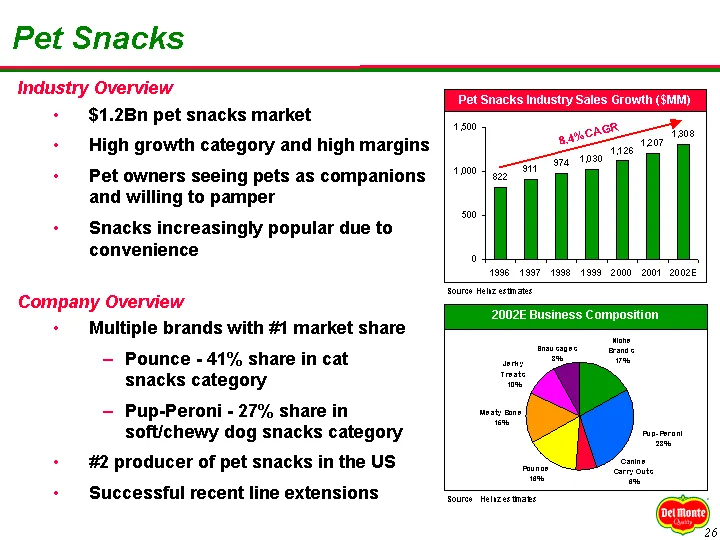
Pet Snacks industry Overview + $1.2Bn pet snacks market + High growth category and high margins + Pet owners seeing pets as companions and willing to pamper + Snacks increasingly popular due to convenience Company Overview + Multiple brands with #1 market share — Pounce - 41% share in cat snacks cat
Slide 26: Pet Foods and Pet Snacks
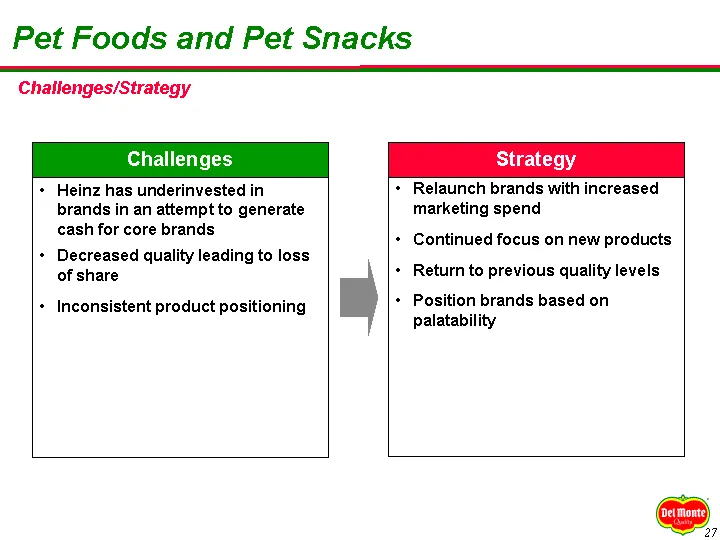
Pet Foods and Pet Snacks Chailenges/Strategy Challenges + Heinz has underinvested in Relaunch brands with increased brands in an attempt to generate marketing spend cash for core brands + Decreased quality leading to loss of share Continued focus on new products Return to previous quality levels Pos
Slide 27: Tuna
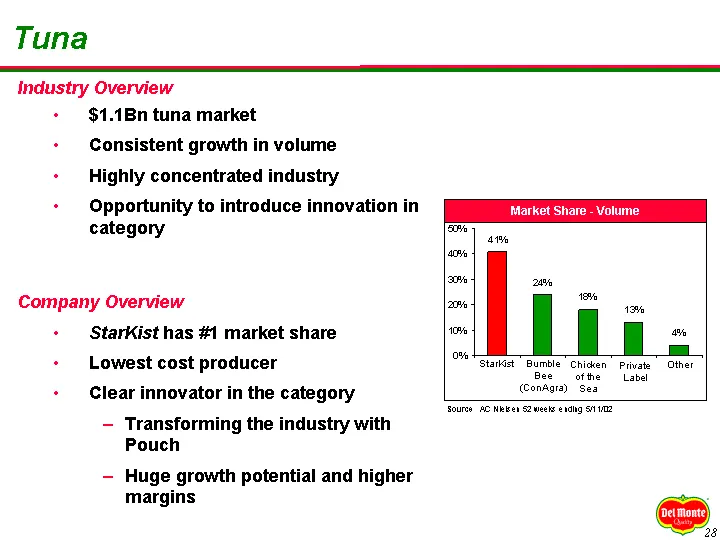
Tuna industry Overview + $1.1Bn tuna market + Consistent growth in volume + Highly concentrated industry + Opportunity to introduce innovation in category Market Share - Volume Company Overview + StarKist has #1 market share + Lowest cost producer Oana” Bune" chien” Faas” Ober ee ofthe ‘Label + Clea
Slide 28: Tuna
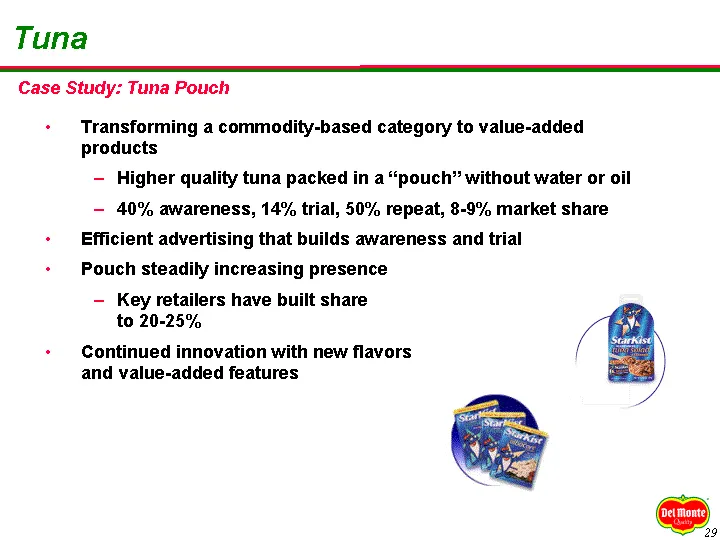
Tuna Case Study: Tuna Pouch Transforming a commodity-based category to value-added products — Higher quality tuna packed in a “pouch” without water or oil — 40% awareness, 14% trial, 50% repeat, 8-9% market share Efficient advertising that builds awareness and trial Pouch steadily increasing presenc
Slide 29: Tuna
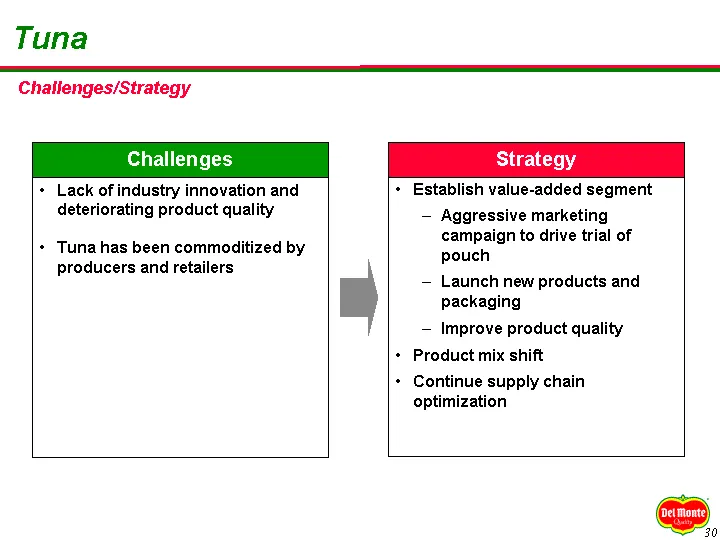
Tuna Chailenges/Strategy Challenges + Lack of industry innovation and deteriorating product quality Establish value-added segment — Aggressive marketing campaign to drive trial of pouch — Launch new products and packaging + Tuna has been commoditized by producers and retailers — Improve product qual
Slide 30: Private Label Soup
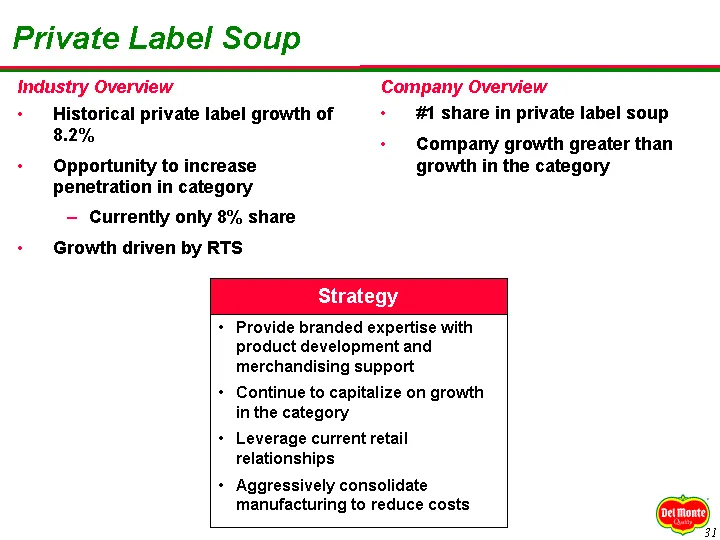
Private Label Soup industry Overview Company Overview + Historical private label growth of + #1 share in private label soup 8.2% + Company growth greater than + Opportunity to increase growth in the category penetration in category — Currently only 8% share + Growth driven by RTS Strategy Provide br
Slide 31: Baby Food
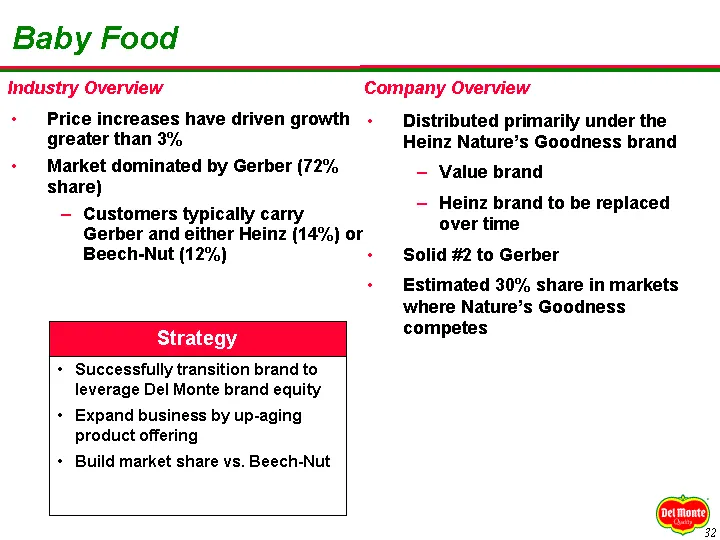
Baby Food industry Overview Price increases have driven growth - greater than 3% Market dominated by Gerber (72% share) — Customers typically carry Gerber and either Heinz (14%) or Beech-Nut (12%) : Strategy Successfully transition brand to leverage Del Monte brand equity Expand business by up-aging
Slide 32: Del Monte Overview
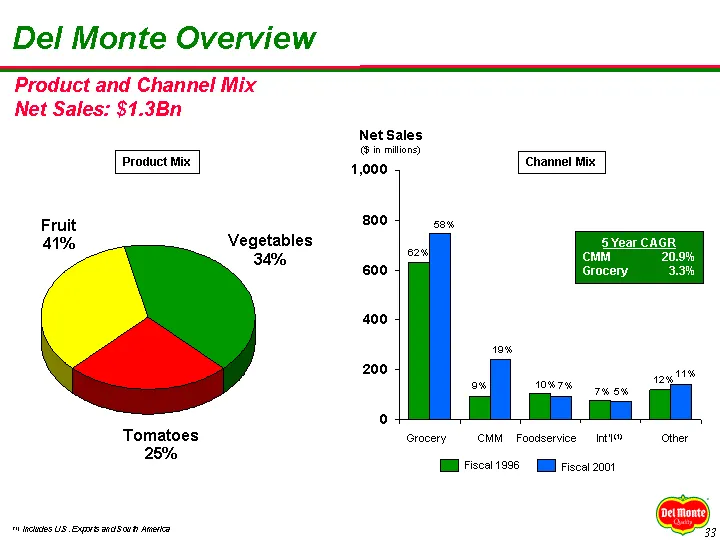
Del Monte Overview Product and Channel Mix Net Sales: $1.3Bn Product Mix Fruit A% Vegetables 34% Tomatoes 25% nes 08. xs arS O08 Anetce Net Sales is rillons) 1,000 800 Grocery Tl Fiscal 1996 Channel Mix MM 20. Grocery 3 CMM Foodservice Int Other Wi Fiscal 2001
Slide 33: Del Monte Overview
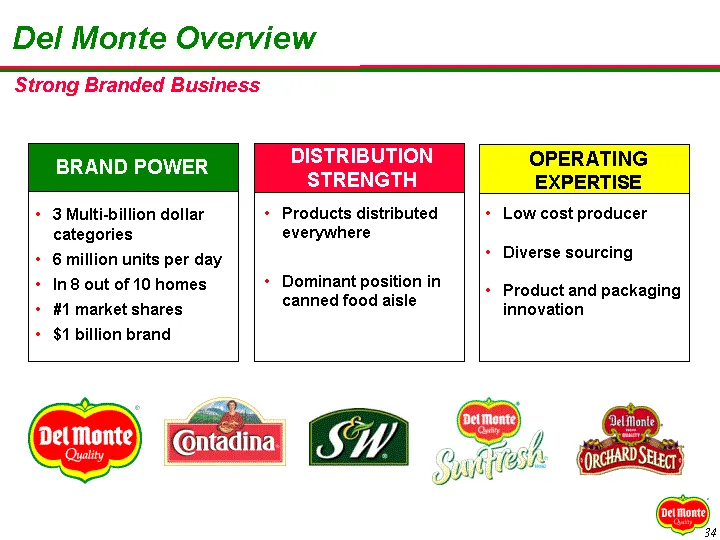
Del Monte Overview Strong Branded Business DISTRIBUTION BRAND POWER STRENGTH + 3Multi-billion dollar + Products distributed + Low cost producer categories everywhere + 6 million units per day + Diverse sourcing + In8 out of 10 homes + Dominant position in + Product and packaging canned food aisle in

Slide 34: Financial Highlights
Financial Highlights
Slide 35: Financial Highlights
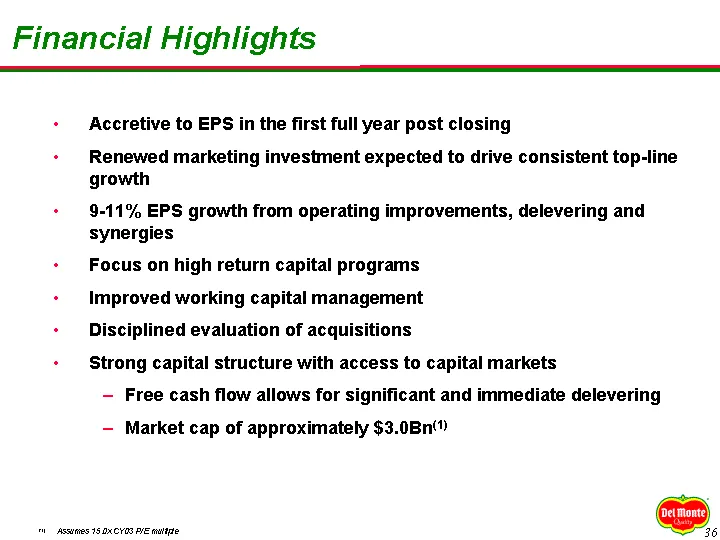
Financial Highlights + Accretive to EPS in the first full year post closing + Renewed marketing investment expected to drive consistent top-line growth + 9-11% EPS growth from operating improvements, delevering and synergies + Focus on high return capital programs + Improved working capital manageme
Slide 36: Proven Financial Results
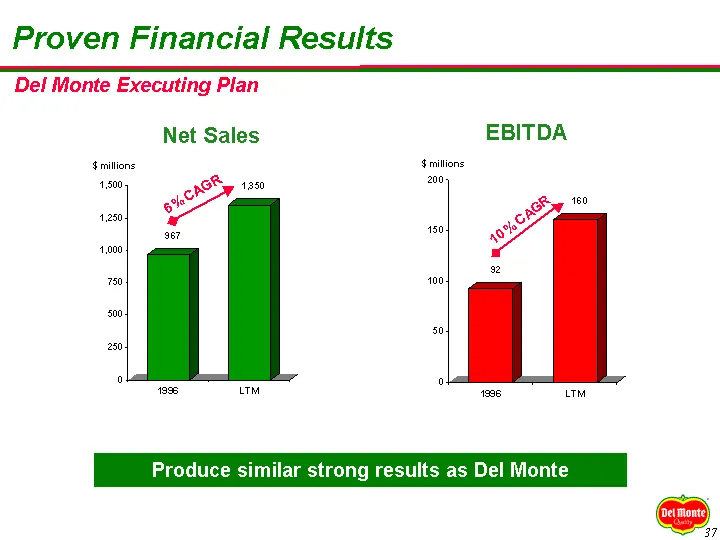
Proven Financial Results Def Monte Executing Plan Net Sales Bos & $ millions 198 umm EBITDA $mitions 200 150 100 Produce similar strong results as Del Monte eS
Slide 37: Pro Forma Projections
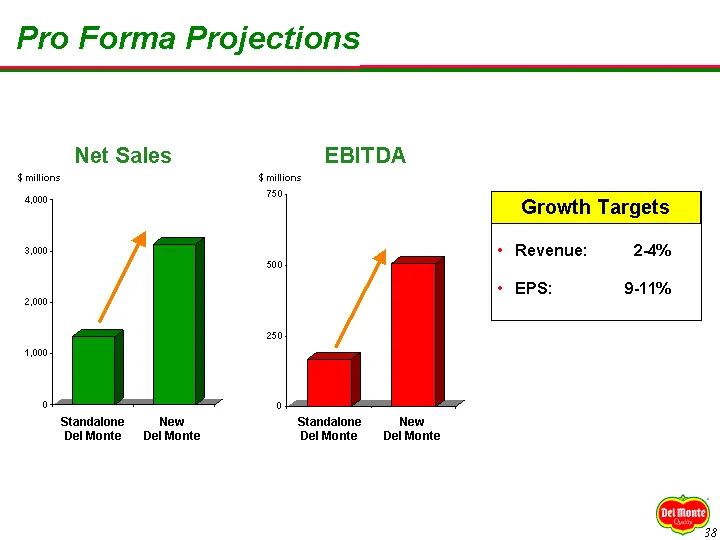
Pro Forma Projections Net Sales EBITDA ition mito 4.000. 70 2,00 + Revenue: 24% so0 + EPS: 911% 2,000 250 1,000 0 0 Standalone New Standalone New DelMonte Del Monte DelMonte Del Monte
Slide 38: Capital Markets
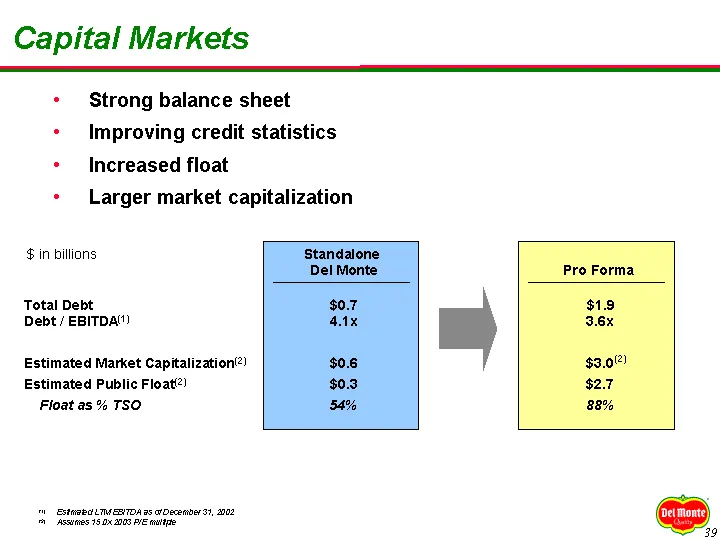
Capital Markets + Strong balance sheet + Improving credit statistics ° Increased float + Larger market capi _ bi ‘senescent eS "26 ization $ in billions Total Debt Debt / EBITDA) Estimated Market Capitalization’) Estimated Public Float?) Float as % TSO
Slide 39: Summary of Combined Strengths
Summary of Combined Strengths + Strong brands with multiple #1 share positions in large, attractive categories + Center store powerhouse well positioned to benefit from retail industry consolidation + Realize significant and achievable synergies driven by business similarities + Revitalization plan
Slide 40
Source: SEC EDGAR · 425 filed Jun 17, 2002