Tiger Brands Limited · JSE:TBS
Tiger Brands — H1 2017 Earnings Presentation
49 slides from Tiger Brands's earnings presentation, May 25, 2017
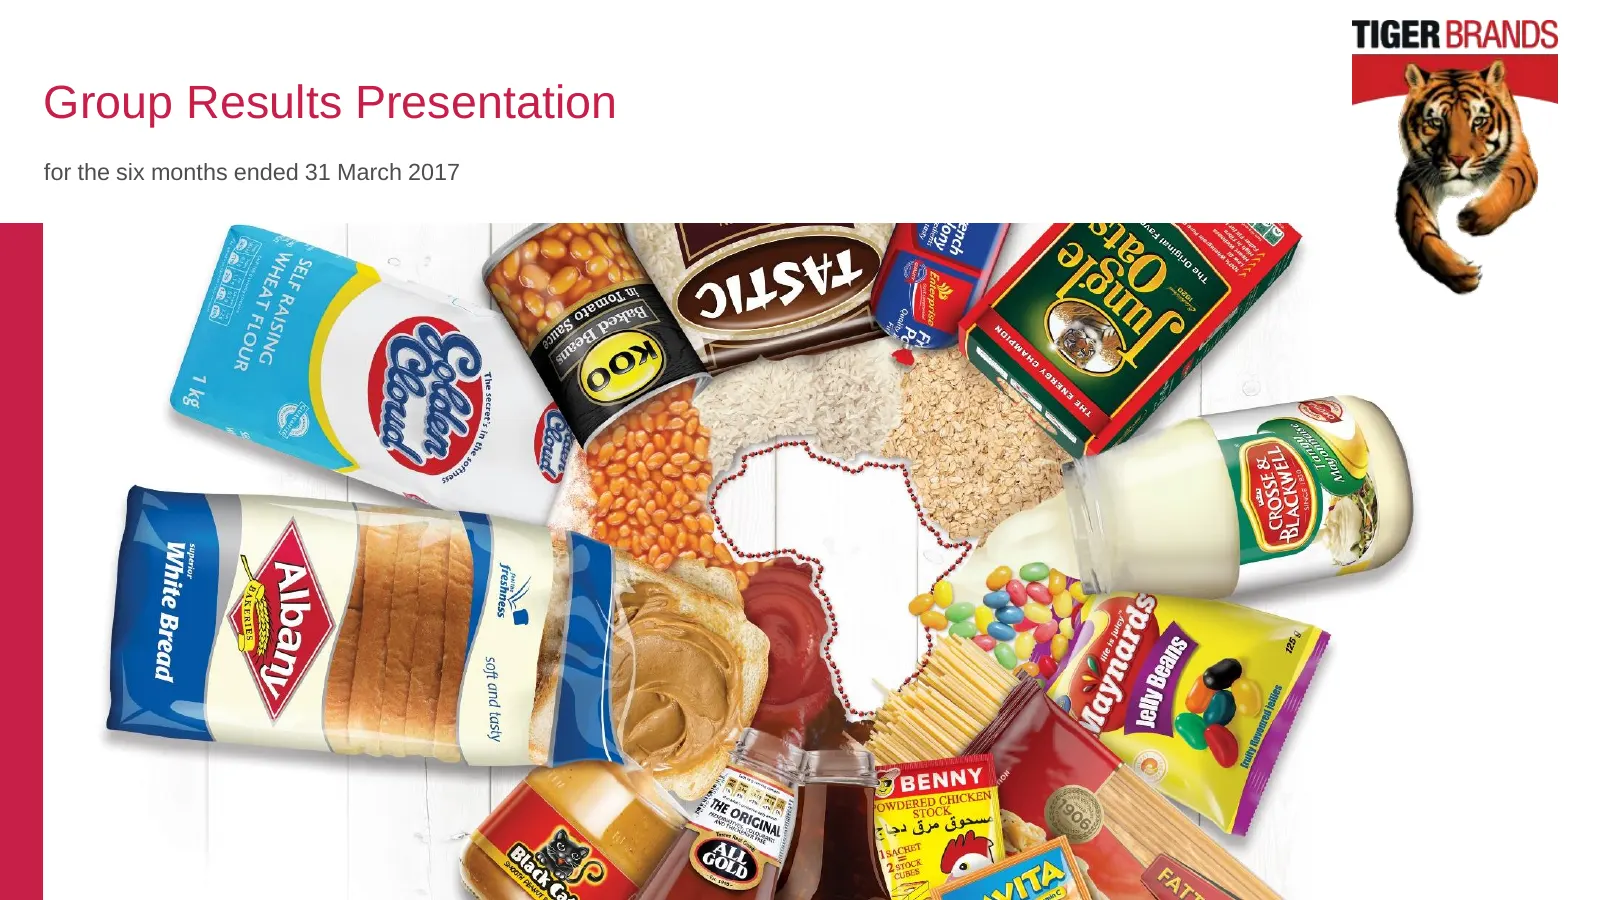
Slide 1: Group Results Presentation
Group Results Presentation for the six months ended 31 March 2017
Slide 2: Index
Index Overview Financial & operational performance Strategic review Group Results Presentation for the for the six months ended 31 March 2017 2
Slide 3: Disclaimer
Disclaimer Forward-looking statement This document contains forward looking statements that, unless otherwise indicated, reflect the company’s expectations as at 25 May 2017. Actual results may differ materially from the company’s expectations if known and unknown risks or uncertainties affect the b
Slide 4: Overview
Overview Lawrence Mac Dougall Chief Executive Officer
Slide 5: Strong H1 underpinned by resilient domestic performance
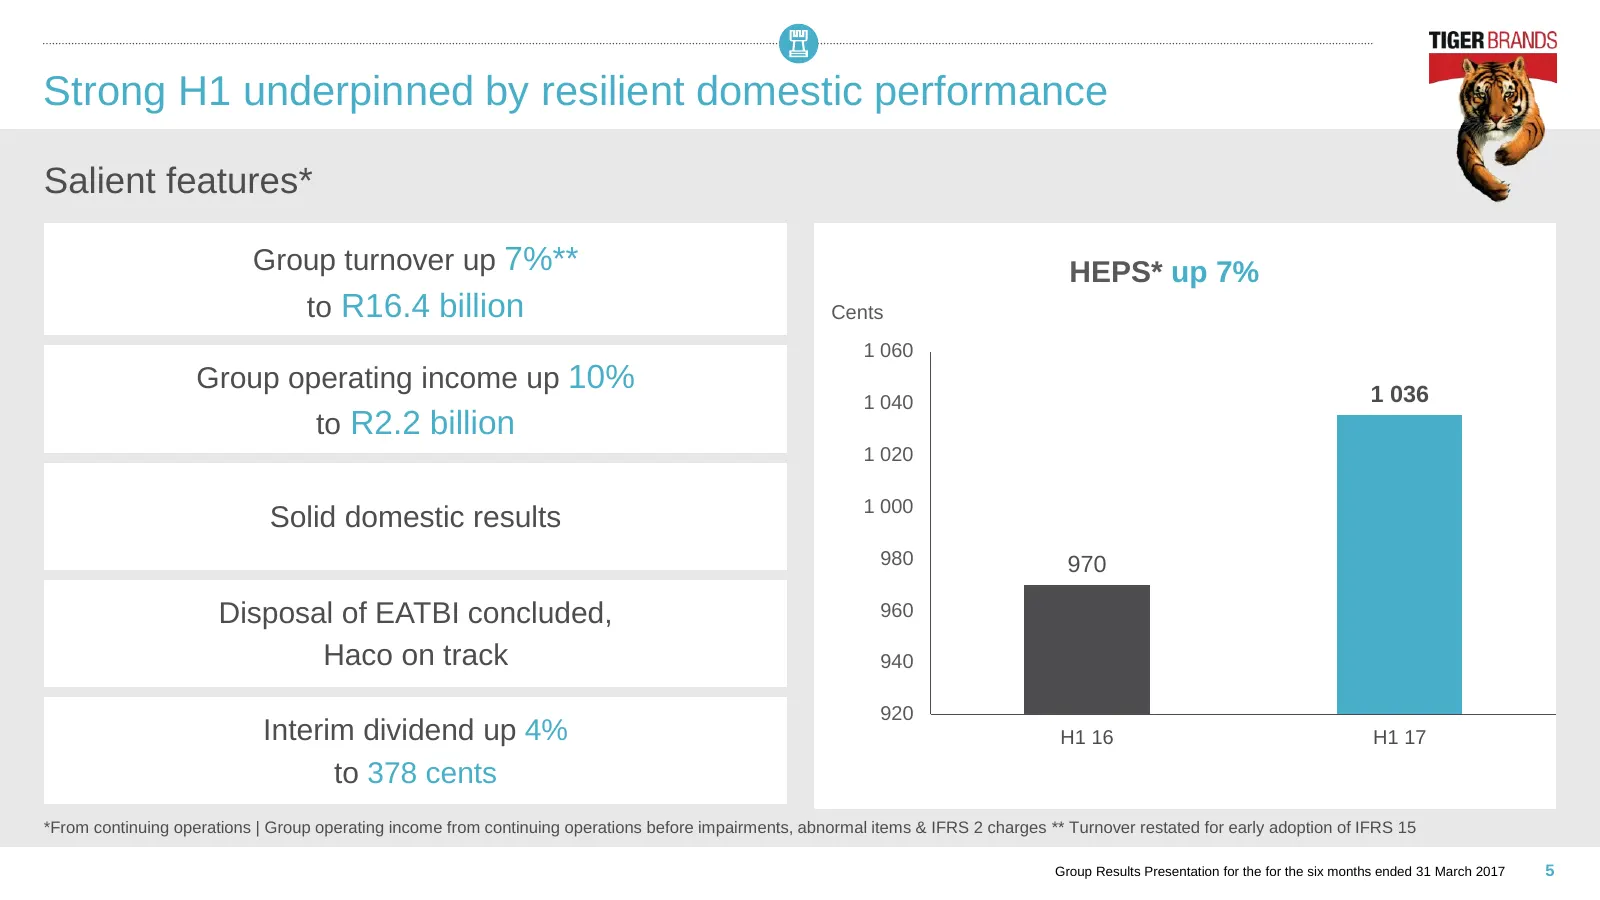
Strong H1 underpinned by resilient domestic performance Salient features* Group turnover up 7%** HEPS* up 7% to R16.4 billion Cents 1 060 Group operating income up 10% 1 036 1 040 to R2.2 billion 1 020 1 000 Solid domestic results 980 970 Disposal of EATBI concluded, 960 Haco on track 940 920 Interi
Slide 6: Turnover growth driven by pricing
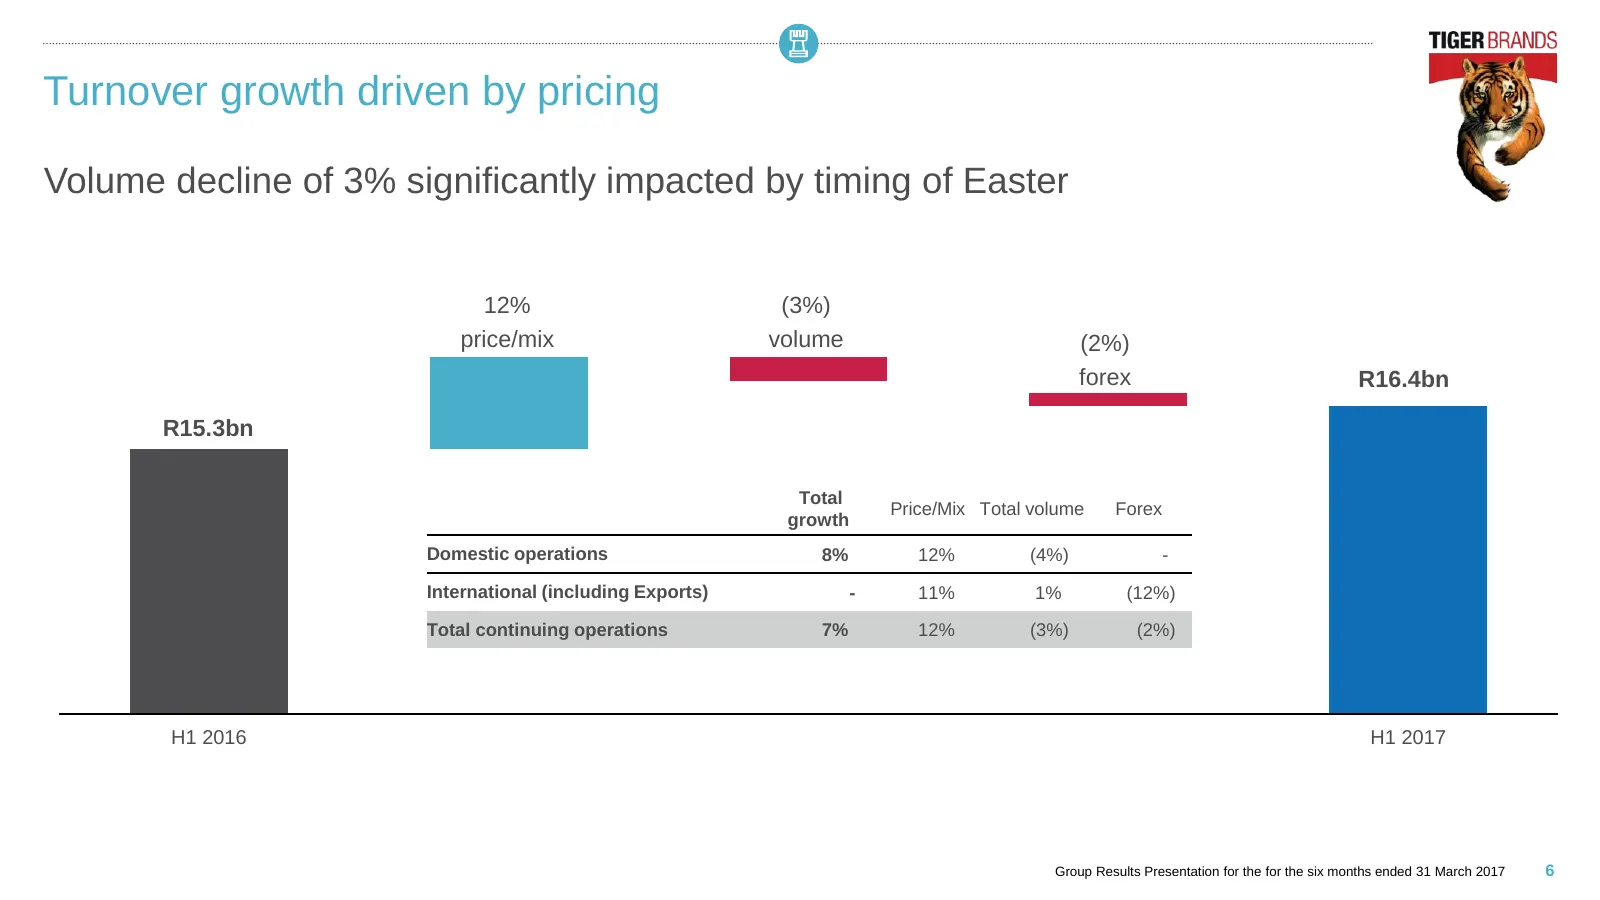
Turnover growth driven by pricing Volume decline of 3% significantly impacted by timing of Easter 12% (3%) price/mix volume (2%) forex R16.4bn R15.3bn Total Price/Mix Total volume Forex growth Domestic operations 8% 12% (4%) - International (including Exports) - 11% 1% (12%) Total continuing operati
Slide 7: Robust domestic performance partially offset by international operations
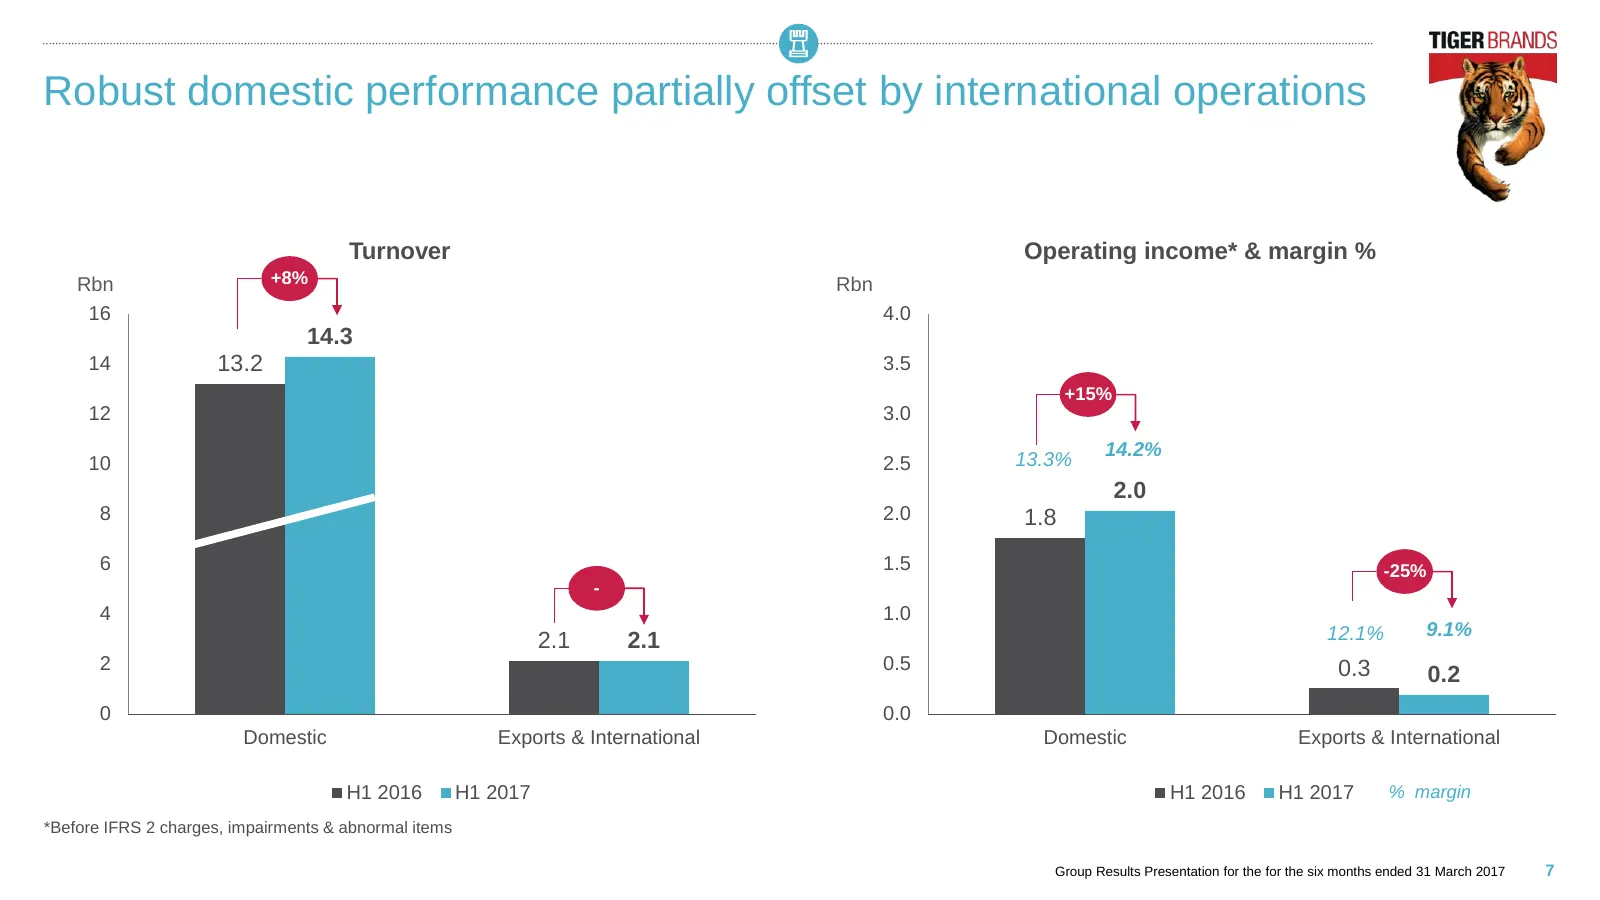
Robust domestic performance partially offset by international operations Turnover Operating income* & margin % Rbn +8% Rbn 16 4.0 14.3 14 13.2 3.5 +15% 12 3.0 13.3% 14.2% 10 2.5 2.0 8 2.0 1.8 6 1.5 -25% - 4 1.0 12.1% 9.1% 2.1 2.1 2 0.5 0.3 0.2 0 0.0 Domestic Exports & International Domestic Exports
Slide 8: Operational excellence sustained
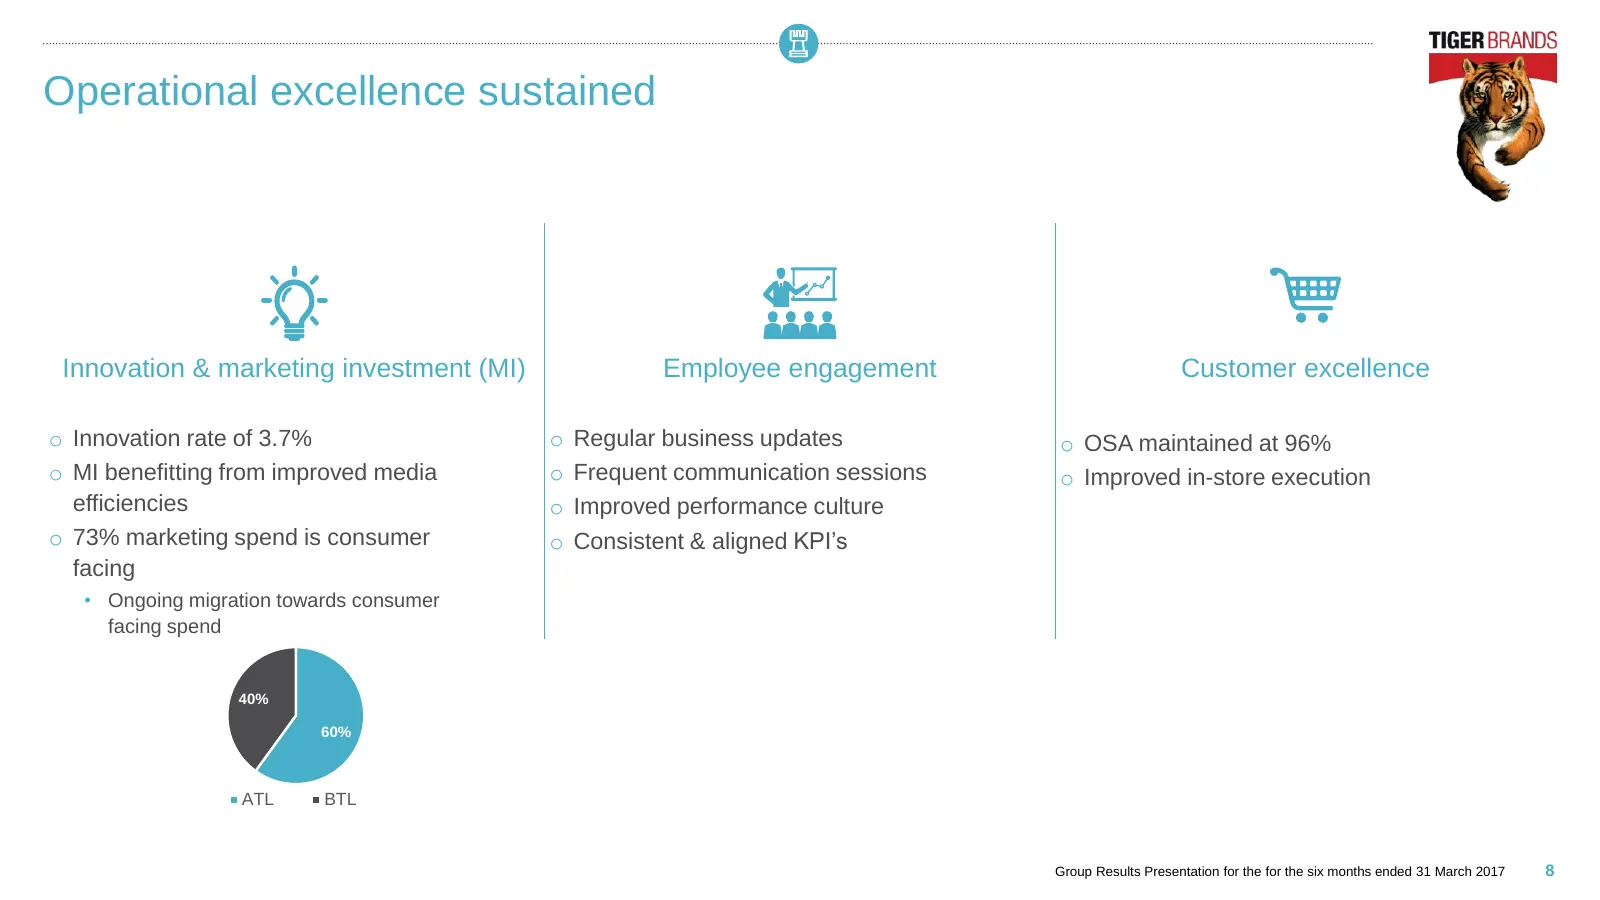
Operational excellence sustained Innovation & marketing investment (MI) Employee engagement Customer excellence o Innovation rate of 3.7% o Regular business updates o OSA maintained at 96% o MI benefitting from improved media o Frequent communication sessions o Improved in-store execution efficienci
Slide 9: Sustained market leadership in power brands
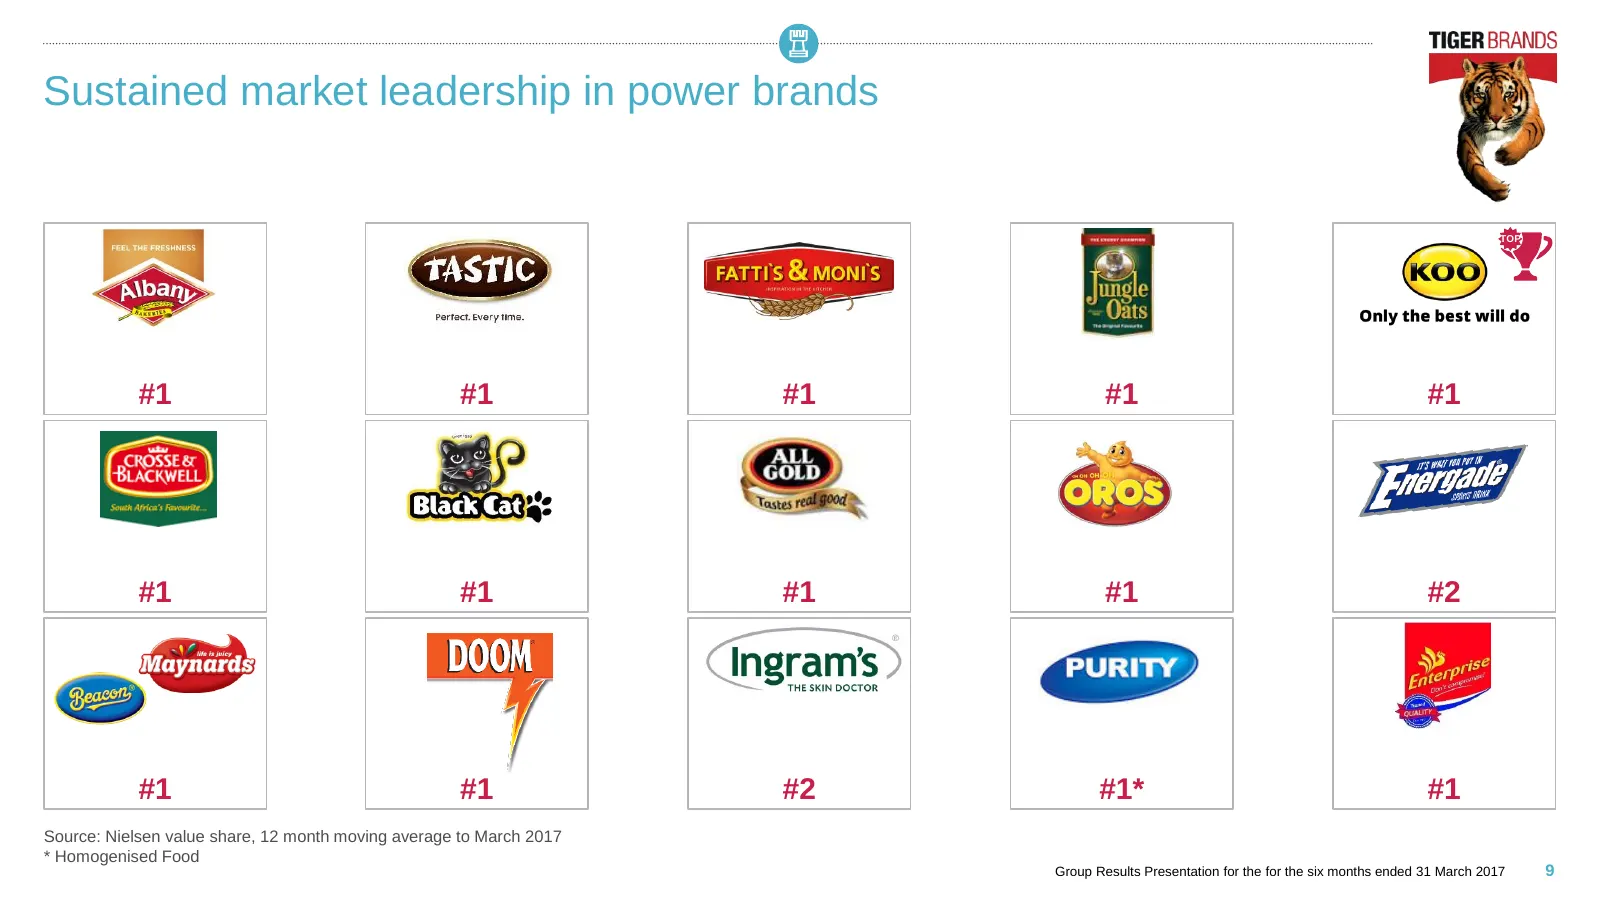
Sustained market leadership in power brands TOP #1 #1 #1 #1 #1 #1 #1 #1 #1 #2 #1 #1 #2 #1* #1 Source: Nielsen value share, 12 month moving average to March 2017 * Homogenised Food Group Results Presentation for the for the six months ended 31 March 2017 9
Slide 10: Delivered on key focus areas
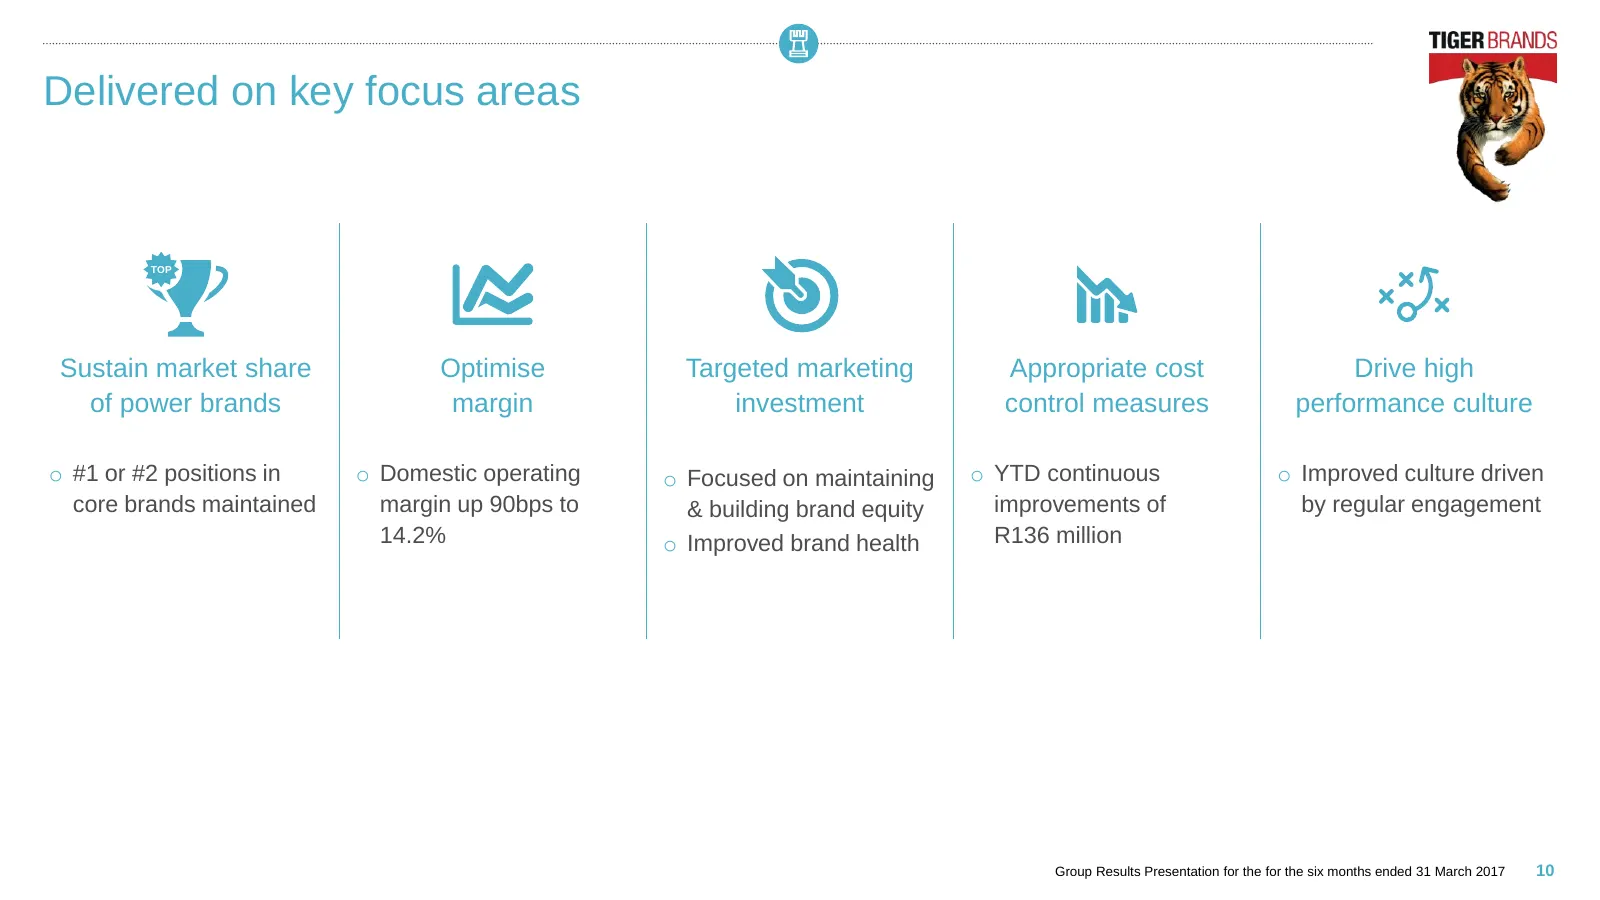
Delivered on key focus areas TOP Sustain market share Optimise Targeted marketing Appropriate cost Drive high of power brands margin investment control measures performance culture o #1 or #2 positions in o Domestic operating o Focused on maintaining o YTD continuous o Improved culture driven core b
Slide 11: Financial & operational performance
Financial & operational performance Noel Doyle Chief Financial Officer
Slide 12: Solid operating results
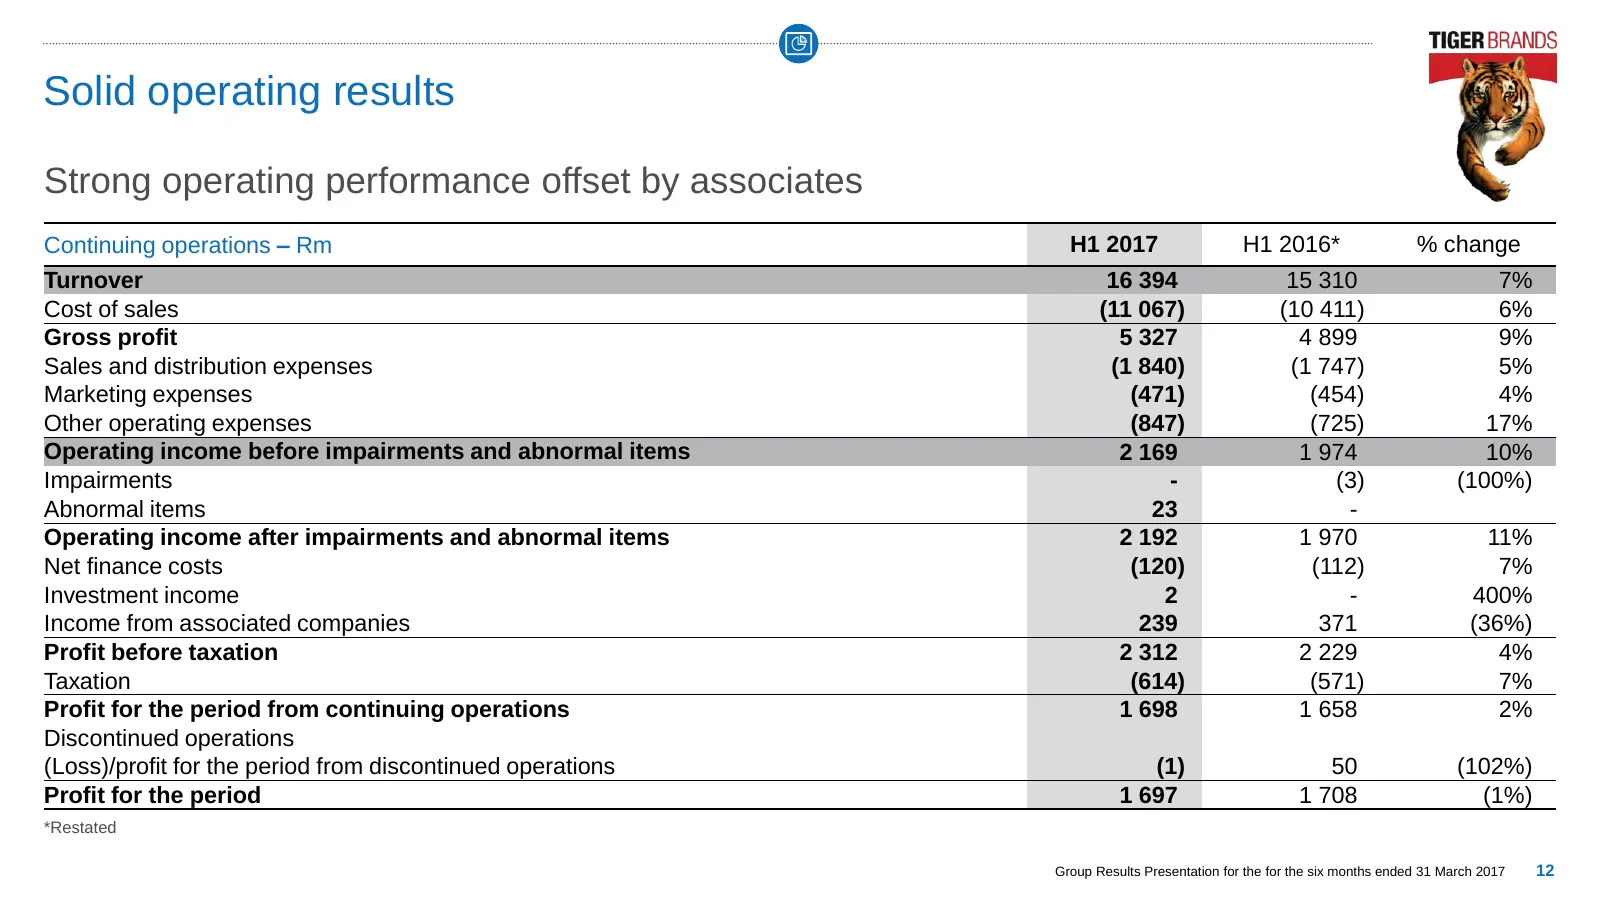
Solid operating results Strong operating performance offset by associates Continuing operations – Rm H1 2017 H1 2016* % change Turnover 16 394 15 310 7% Cost of sales (11 067) (10 411) 6% Gross profit 5 327 4 899 9% Sales and distribution expenses (1 840) (1 747) 5% Marketing expenses (471) (454) 4%
Slide 13: Solid operating results | continued
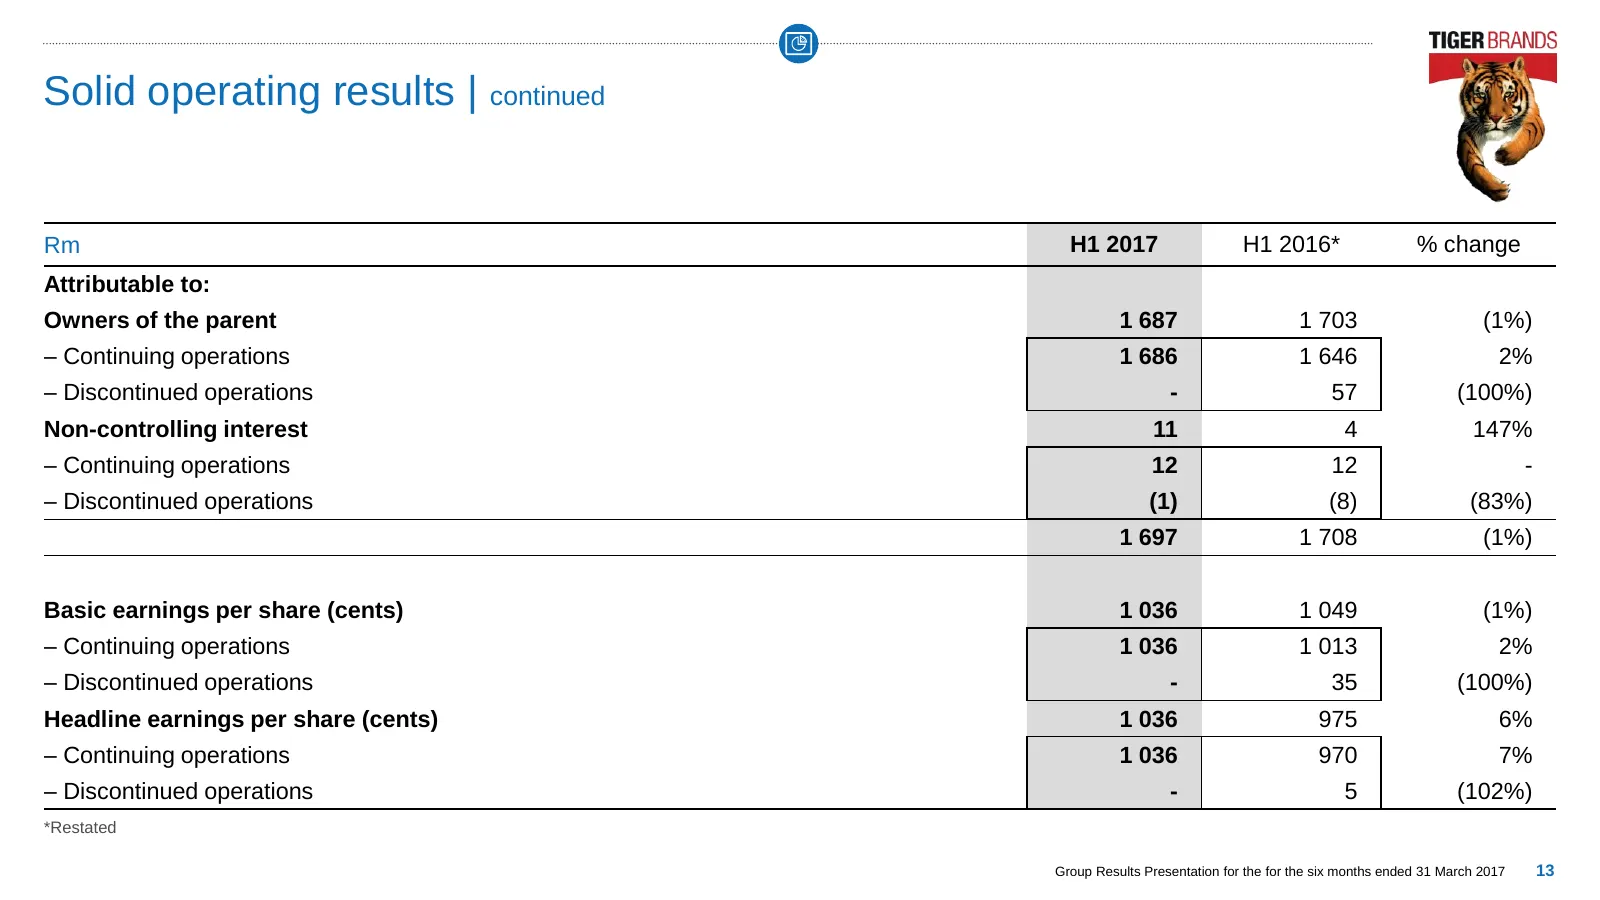
Solid operating results | continued Rm H1 2017 H1 2016* % change Attributable to: Owners of the parent 1 687 1 703 (1%) – Continuing operations 1 686 1 646 2% – Discontinued operations - 57 (100%) Non-controlling interest 11 4 147% – Continuing operations 12 12 - – Discontinued operations (1) (8) (8
Slide 14: HEPS growth diluted by associates underperformance
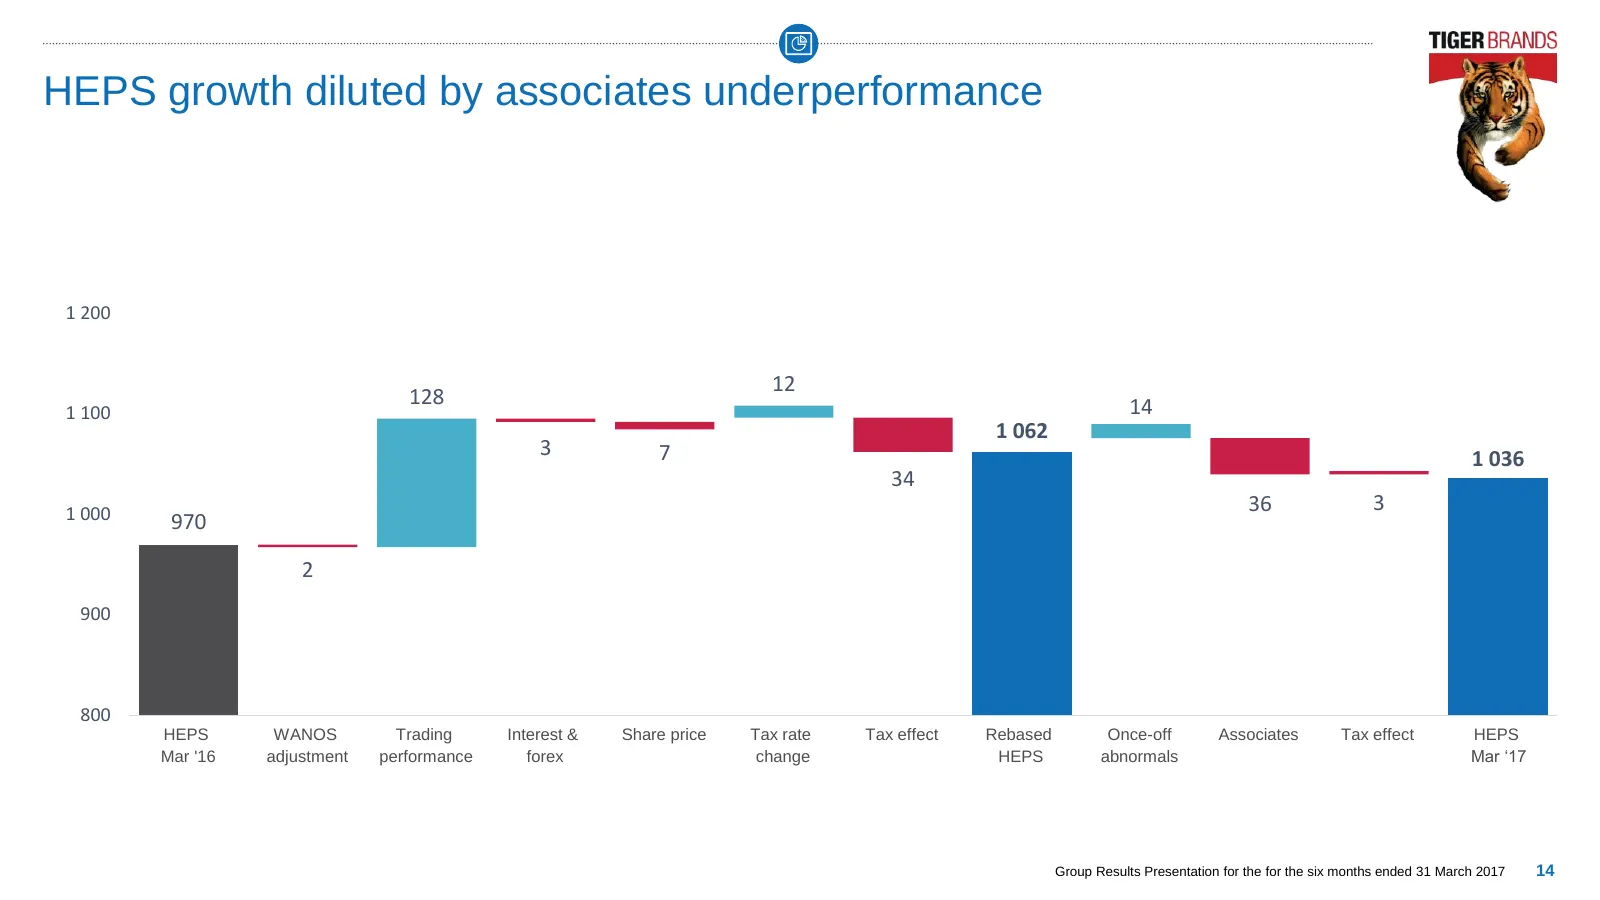
HEPS growth diluted by associates underperformance 1 200 12 128 14 1 100 1 062 3 7 1 036 34 1 000 36 3 970 2 900 800 HEPS WANOS Trading Interest & Share price Tax rate Tax effect Rebased Once-off Associates Tax effect HEPS Mar '16 adjustment performance forex change HEPS abnormals Mar ‘17 Group Resu
Slide 15: Progress made on improving margins in a challenging environment
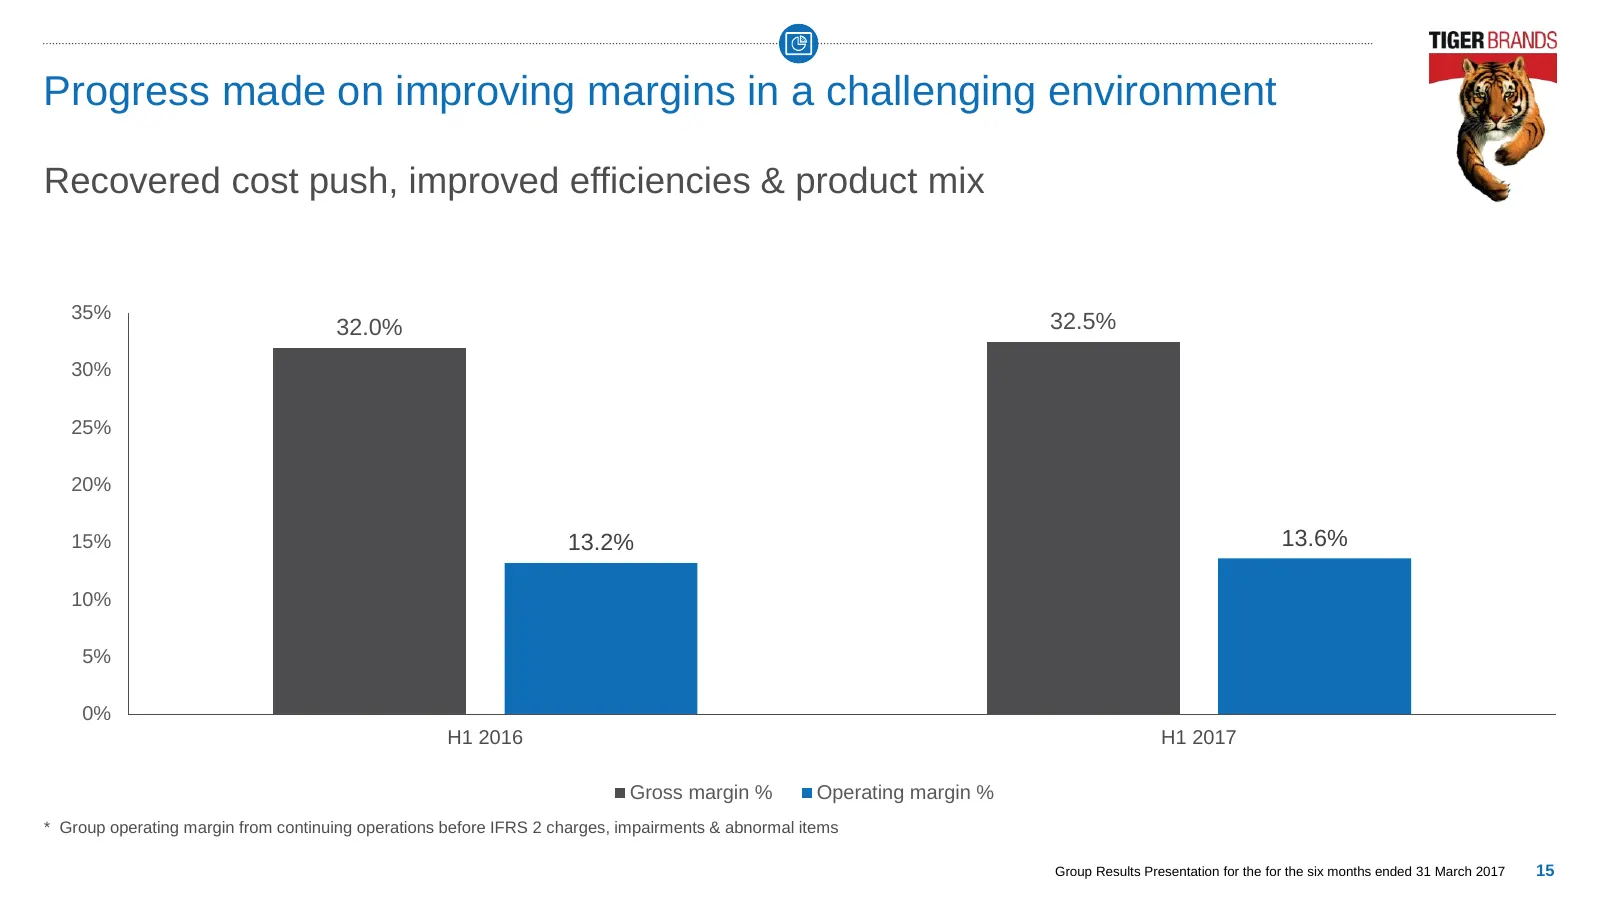
Progress made on improving margins in a challenging environment Recovered cost push, improved efficiencies & product mix 35% 32.5% 32.0% 30% 25% 20% 15% 13.2% 13.6% 10% 5% 0% H1 2016 H1 2017 Gross margin % Operating margin % * Group operating margin from continuing operations before IFRS 2 charges,
Slide 16: Strong domestic performance
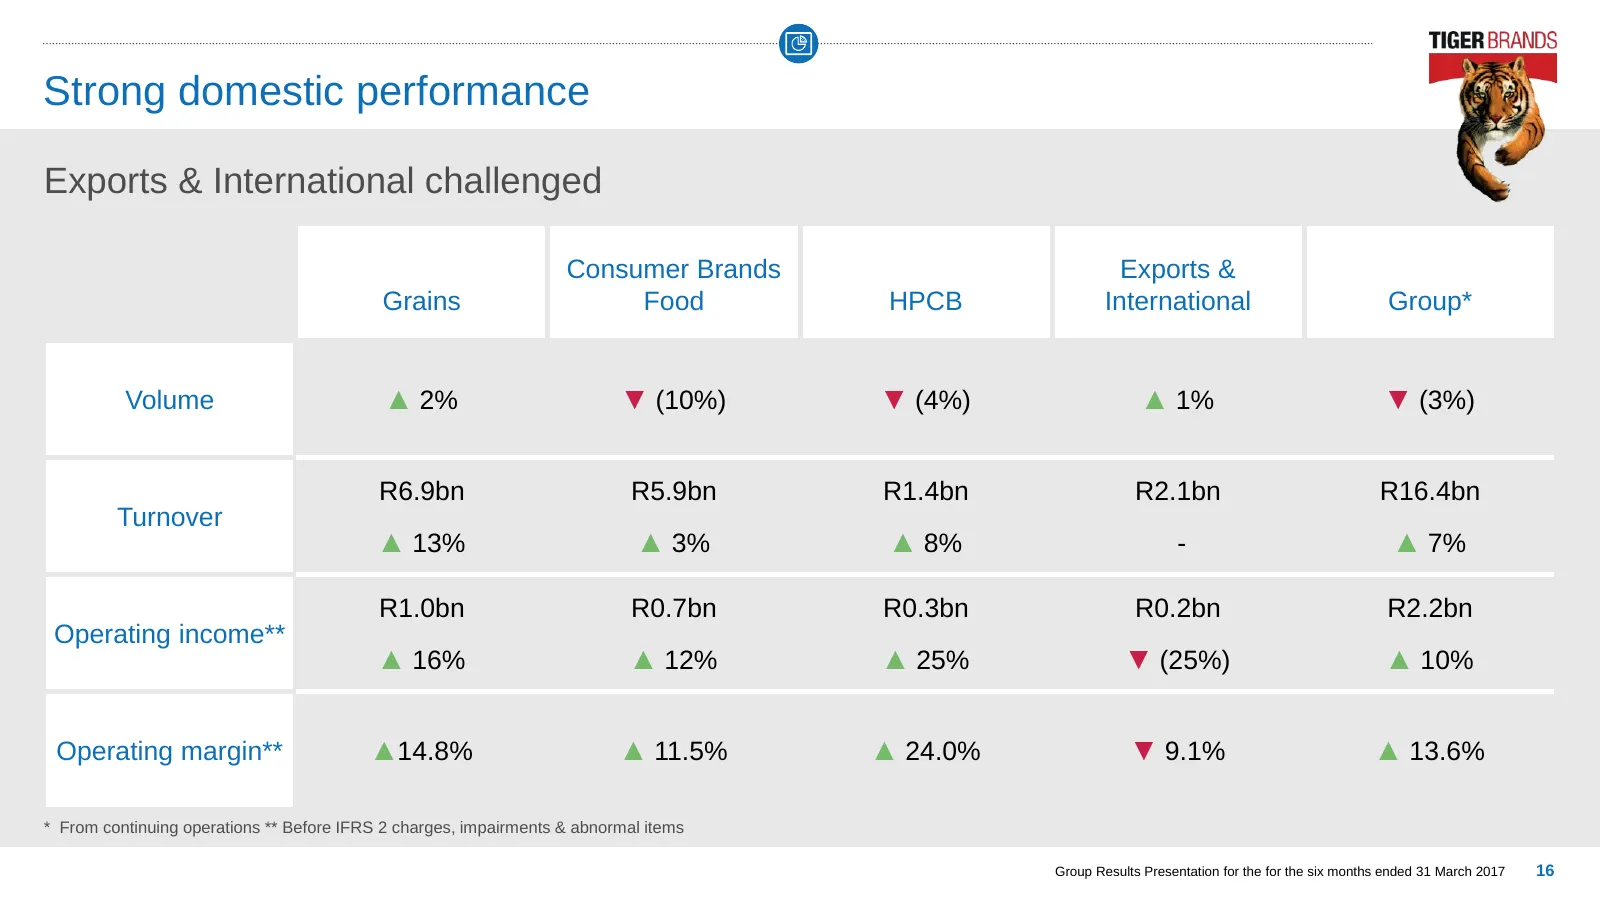
Strong domestic performance Exports & International challenged Consumer Brands Exports & Grains Food HPCB International Group* Volume ▲ 2% ▼ (10%) ▼ (4%) ▲ 1% ▼ (3%) R6.9bn R5.9bn R1.4bn R2.1bn R16.4bn Turnover ▲ 13% ▲ 3% ▲ 8% - ▲ 7% R1.0bn R0.7bn R0.3bn R0.2bn R2.2bn Operating income** ▲ 16% ▲ 12%
Slide 17: Grains
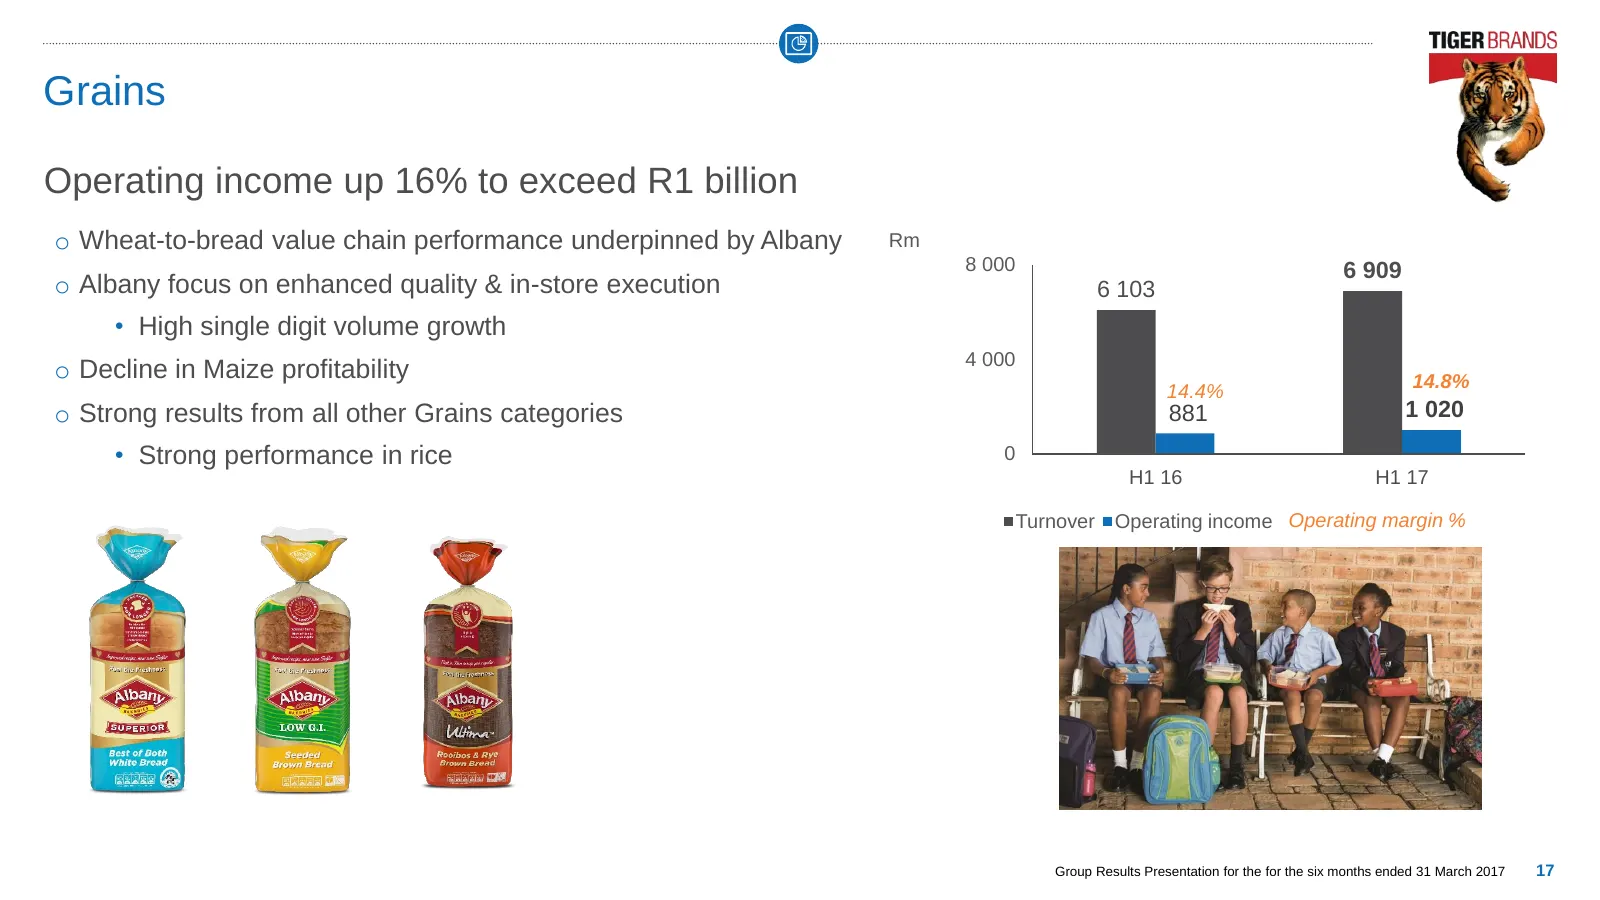
Grains Operating income up 16% to exceed R1 billion o Wheat-to-bread value chain performance underpinned by Albany Rm 8 000 6 909 o Albany focus on enhanced quality & in-store execution 6 103 • High single digit volume growth 4 000 o Decline in Maize profitability 14.8% 14.4% o Strong results from a
Slide 18: Groceries
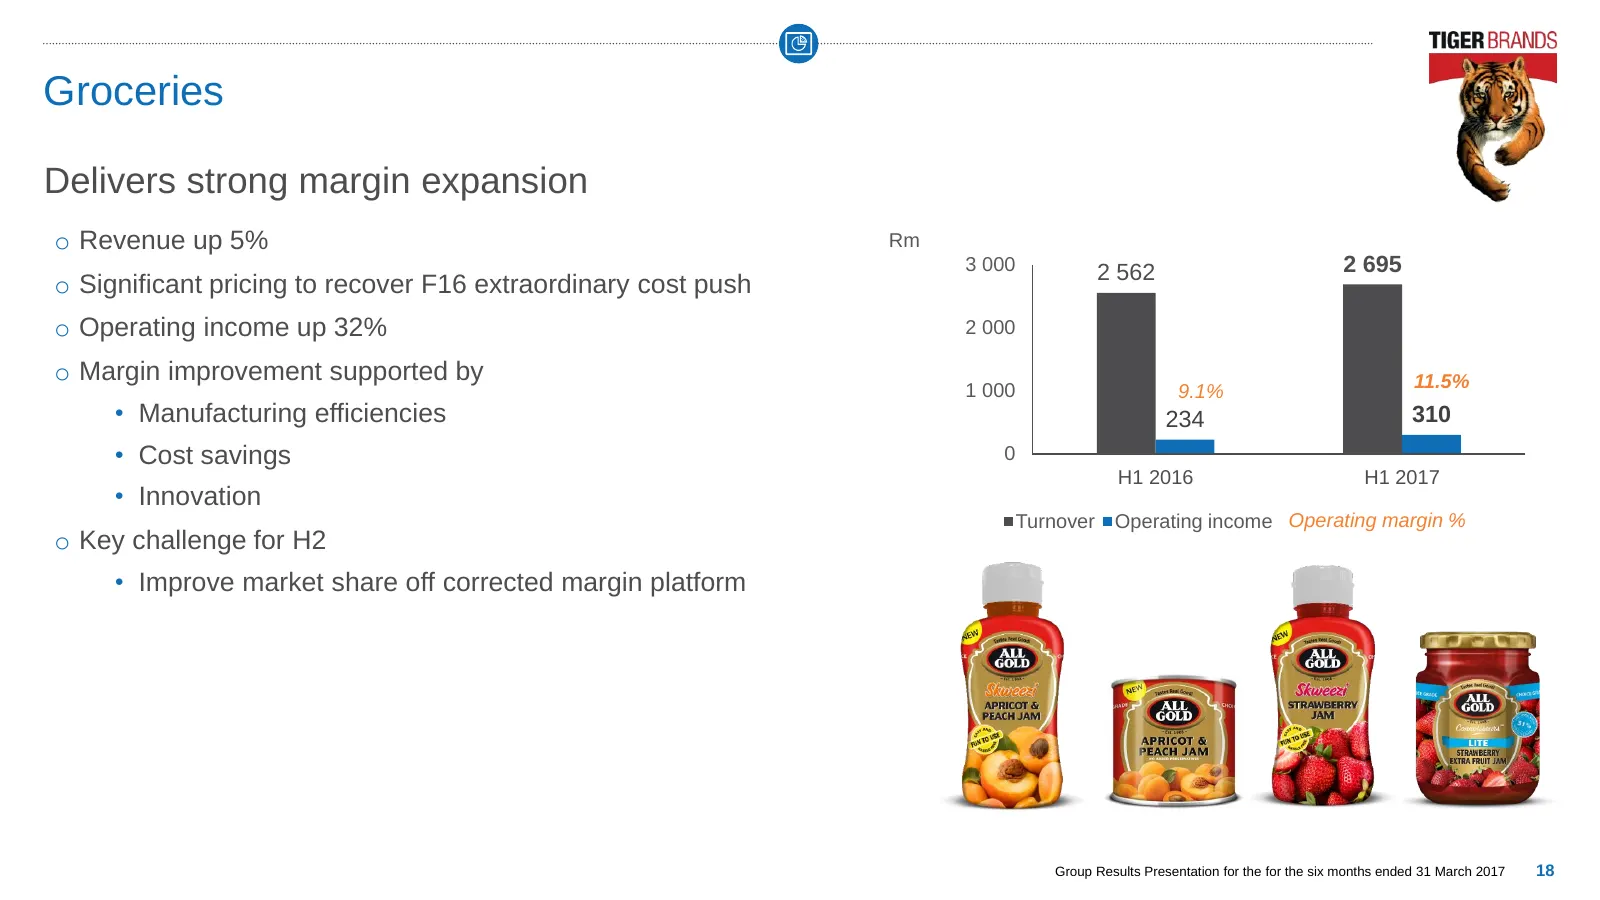
Groceries Delivers strong margin expansion o Revenue up 5% Rm 3 000 2 562 2 695 o Significant pricing to recover F16 extraordinary cost push o Operating income up 32% 2 000 o Margin improvement supported by 11.5% 1 000 9.1% • Manufacturing efficiencies 234 310 • Cost savings 0 H1 2016 H1 2017 • Inno
Slide 19: Snacks, Treats & Beverages
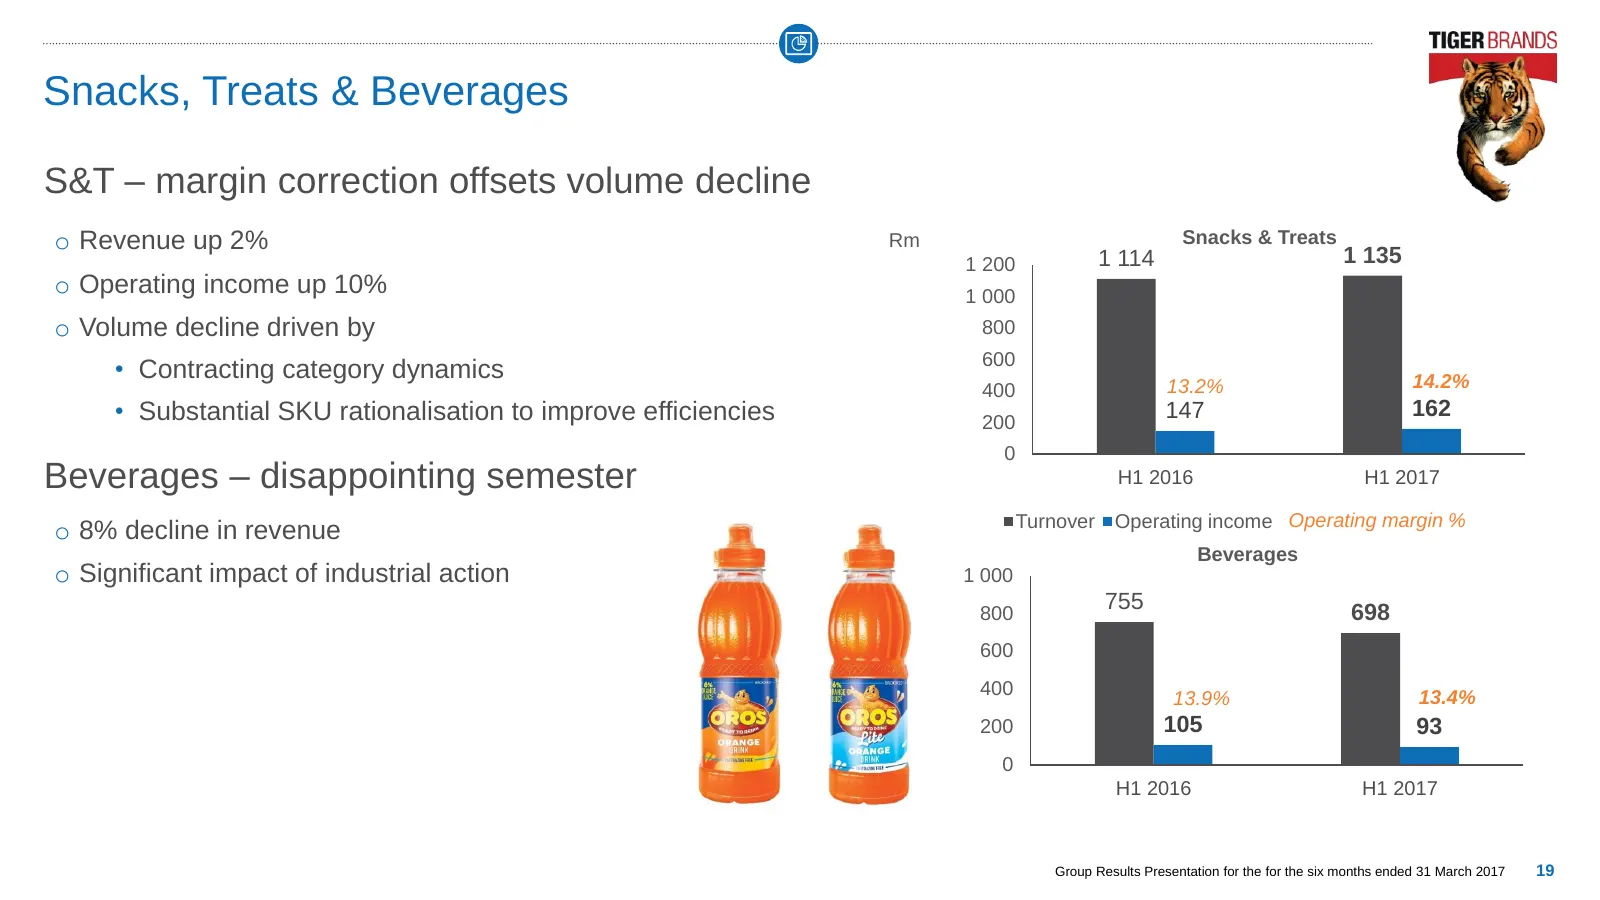
Snacks, Treats & Beverages S&T – margin correction offsets volume decline o Revenue up 2% Rm Snacks & Treats 1 200 1 114 1 135 o Operating income up 10% 1 000 o Volume decline driven by 800 600 • Contracting category dynamics 14.2% 400 13.2% • Substantial SKU rationalisation to improve efficiencies
Slide 20: Home, Personal & Baby Care (HPCB)
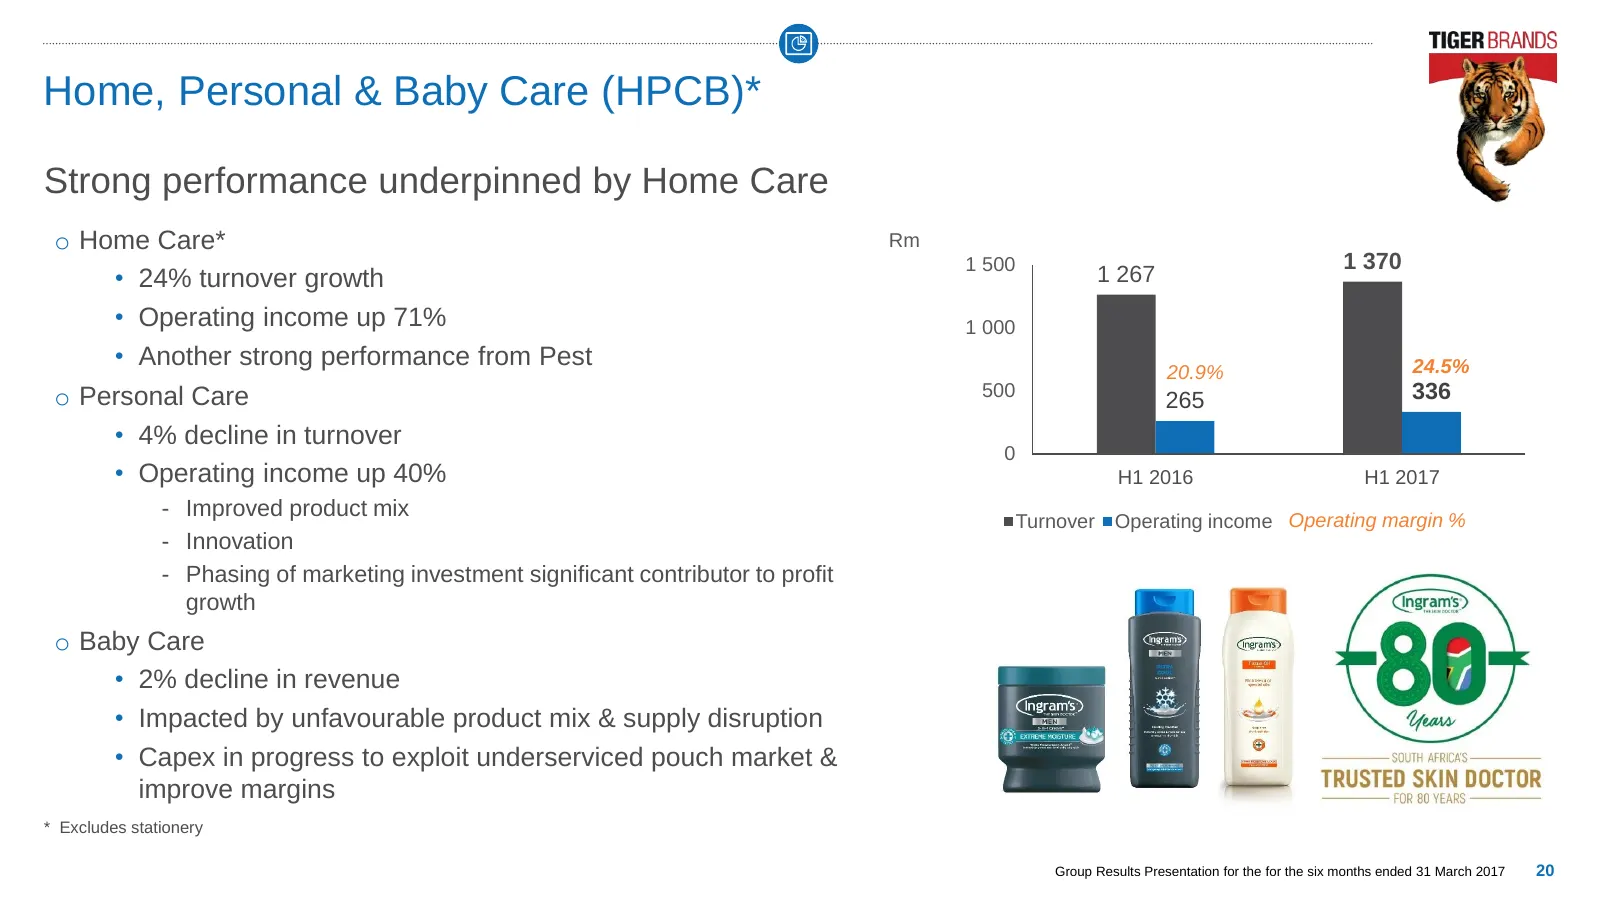
Home, Personal & Baby Care (HPCB)* Strong performance underpinned by Home Care o Home Care* Rm 1 500 1 370 • 24% turnover growth 1 267 • Operating income up 71% 1 000 • Another strong performance from Pest 24.5% 20.9% o Personal Care 500 265 336 • 4% decline in turnover 0 • Operating income up 40% H
Slide 21: Exports & International
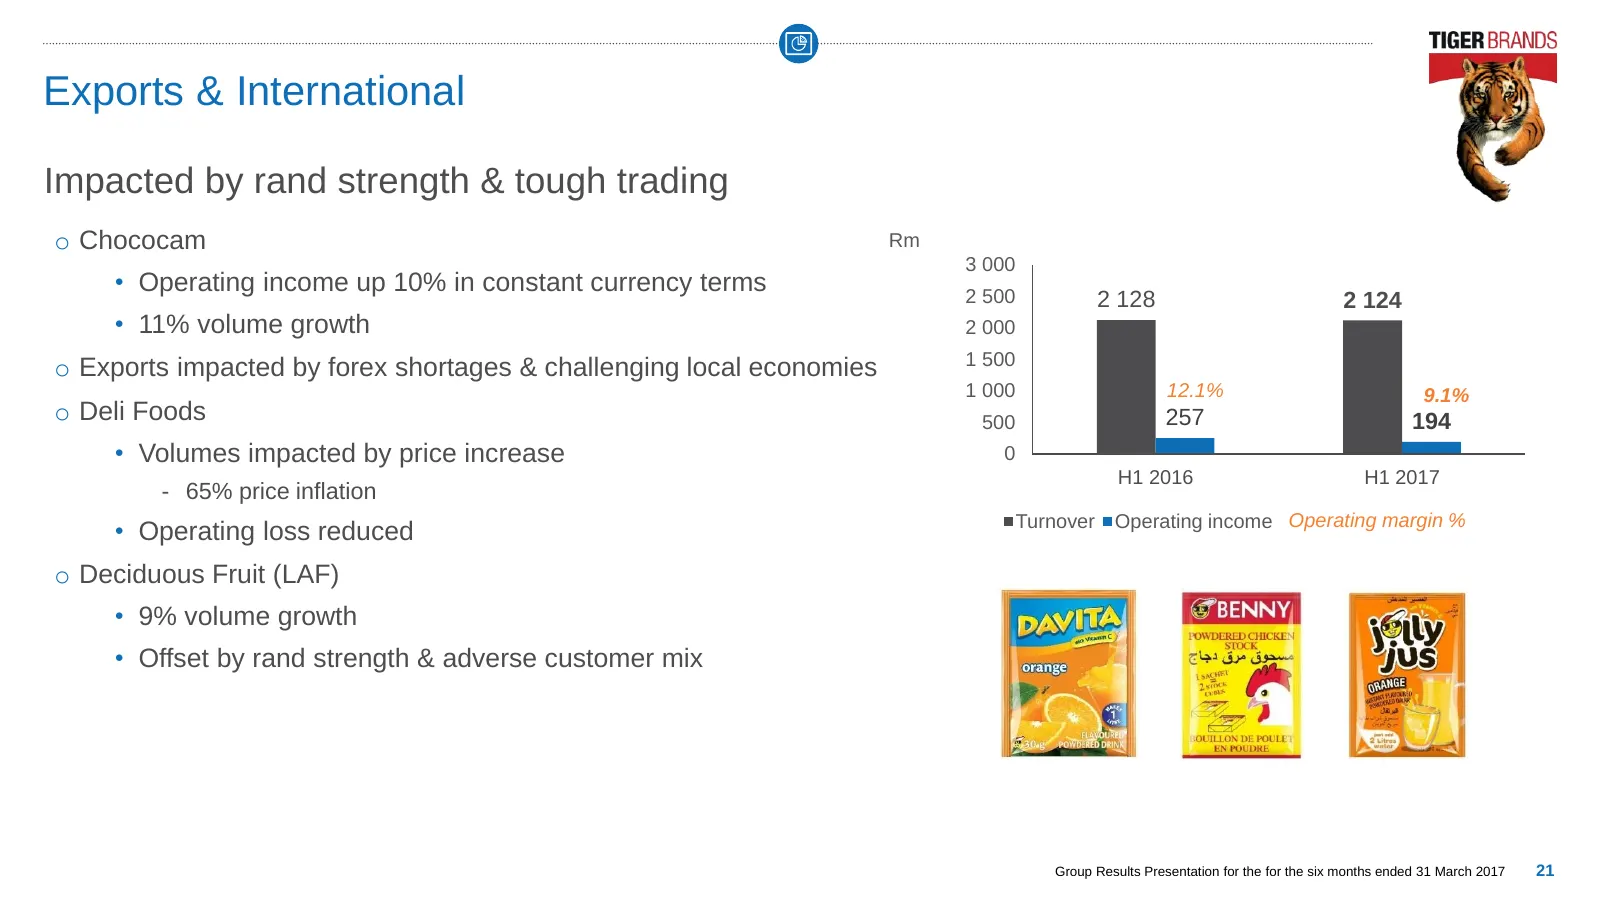
Exports & International Impacted by rand strength & tough trading o Chococam Rm 3 000 • Operating income up 10% in constant currency terms 2 500 2 128 2 124 • 11% volume growth 2 000 1 500 o Exports impacted by forex shortages & challenging local economies 1 000 12.1% 9.1% o Deli Foods 500 257 194 •
Slide 22: Cash from operations up 63% to R3 billion
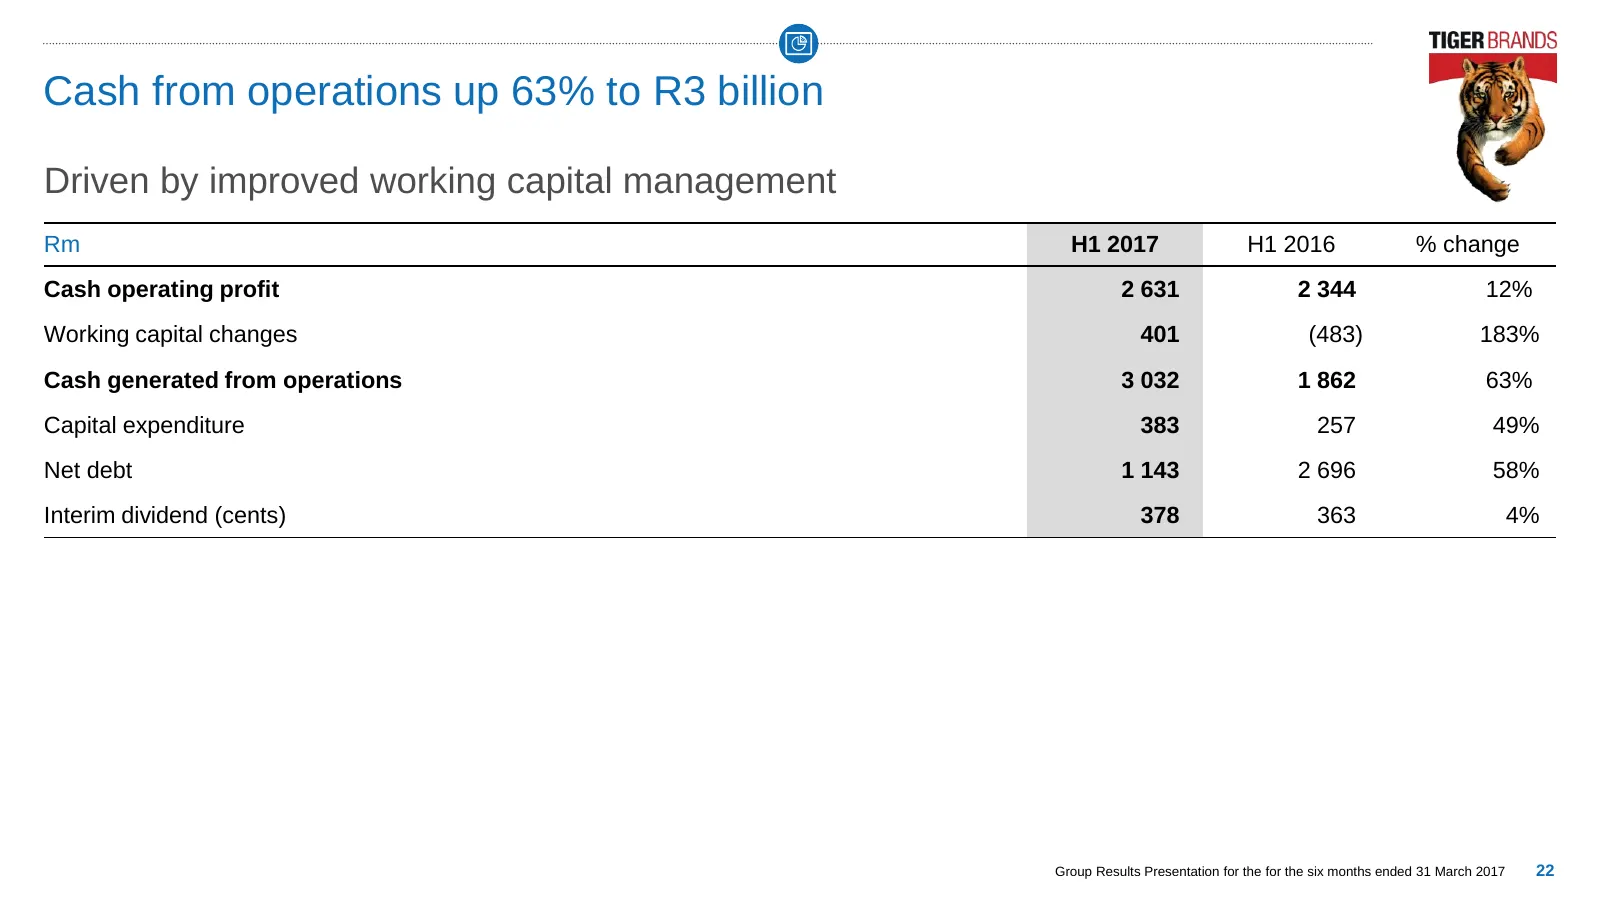
Cash from operations up 63% to R3 billion Driven by improved working capital management Rm H1 2017 H1 2016 % change Cash operating profit 2 631 2 344 12% Working capital changes 401 (483) 183% Cash generated from operations 3 032 1 862 63% Capital expenditure 383 257 49% Net debt 1 143 2 696 58% Int
Slide 23: Strong cash generation & lower than anticipated capex
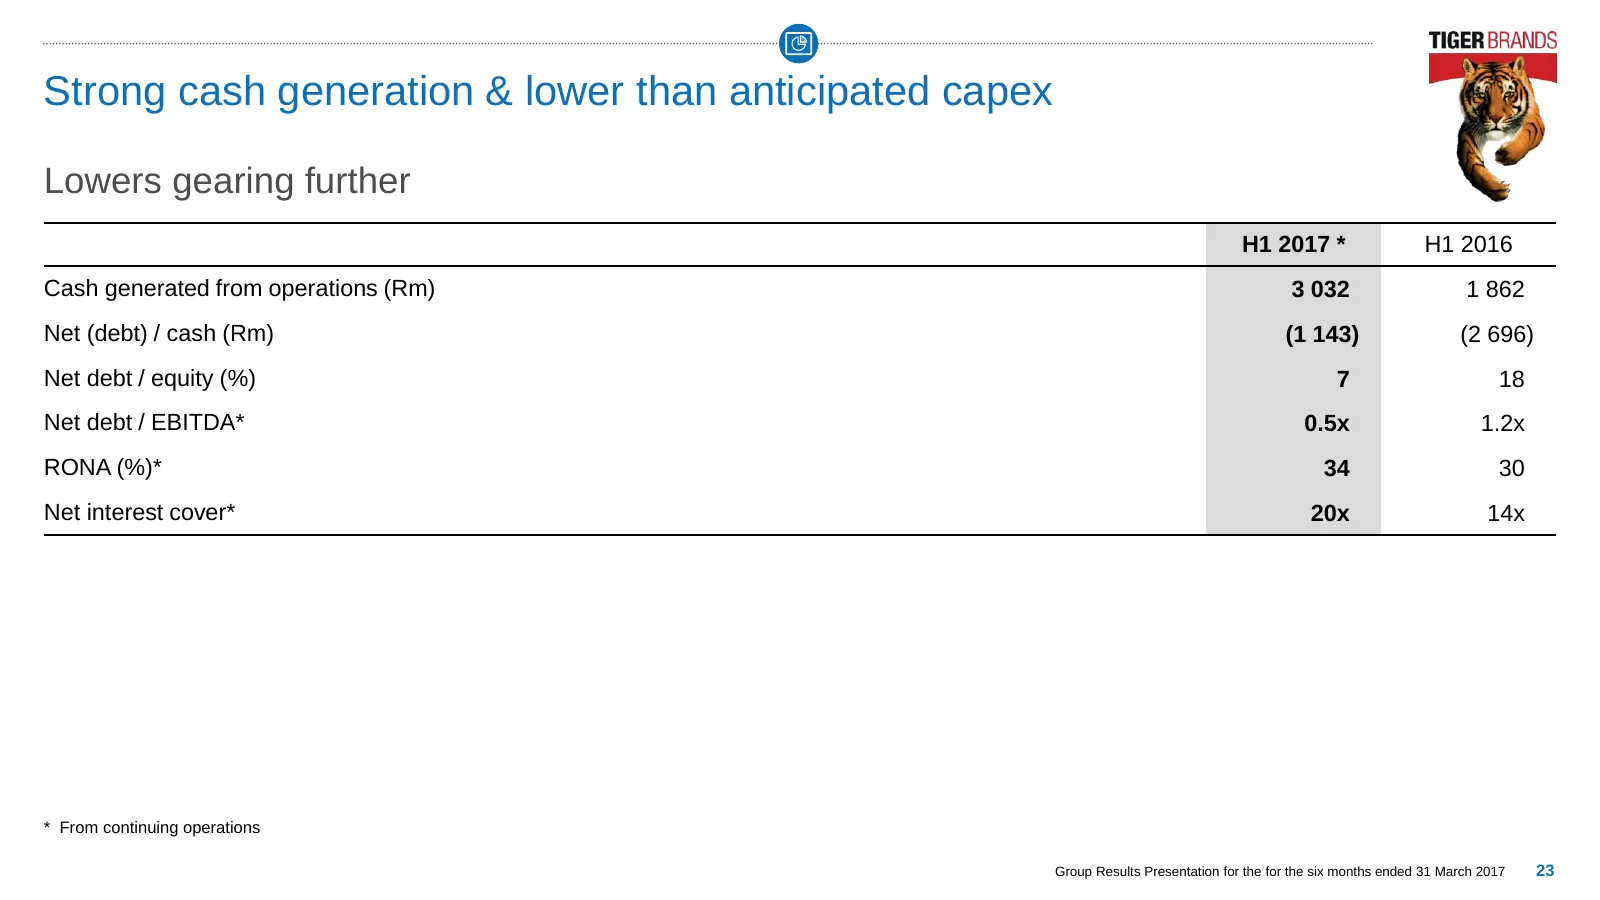
Strong cash generation & lower than anticipated capex Lowers gearing further H1 2017 * H1 2016 Cash generated from operations (Rm) 3 032 1 862 Net (debt) / cash (Rm) (1 143) (2 696) Net debt / equity (%) 7 18 Net debt / EBITDA* 0.5x 1.2x RONA (%)* 34 30 Net interest cover* 20x 14x * From continuing
Slide 24: Continuous improvement programme on track
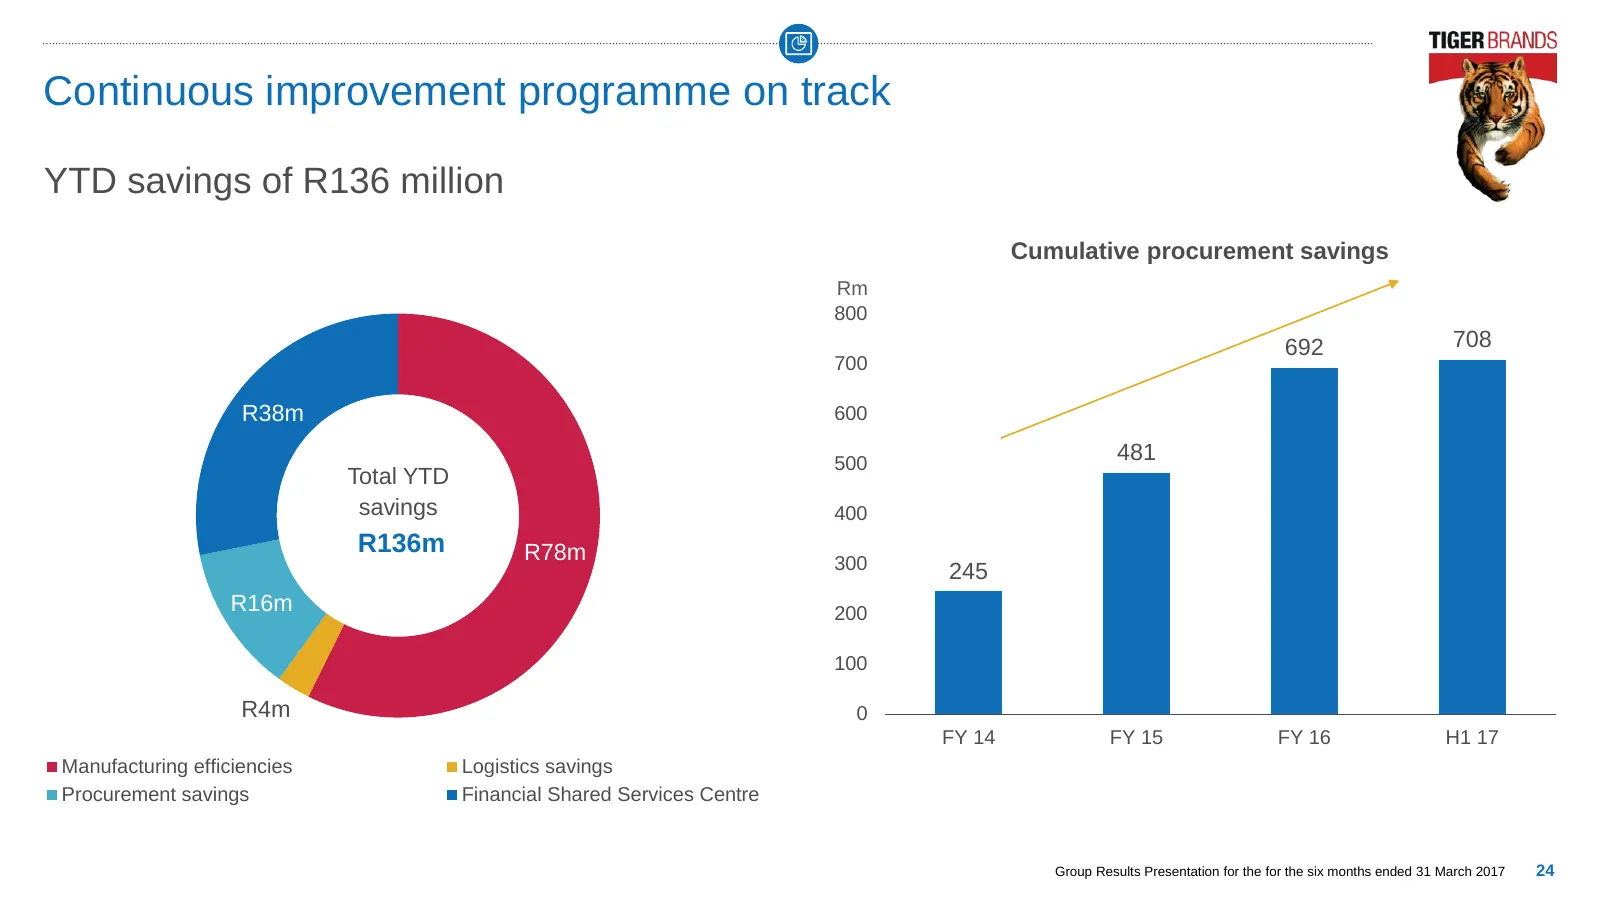
Continuous improvement programme on track YTD savings of R136 million Cumulative procurement savings Rm 800 692 708 700 R38m 600 500 481 Total YTD savings 400 R136m R78m 300 245 R16m 200 100 R4m 0 FY 14 FY 15 FY 16 H1 17 Manufacturing efficiencies Logistics savings Procurement savings Financial Shar
Slide 25: H2 Outlook
H2 Outlook Balance of the year remains challenging o Domestic category volumes challenged o Trading conditions on the rest of the continent remain tough Focus areas o Grow market share & volumes without compromising profitability Driven by o Superior execution o Targeted marketing investment o Appro

Slide 26: Strategic review
Strategic review Lawrence Mac Dougall & Noel Doyle
Slide 27: Strategic review
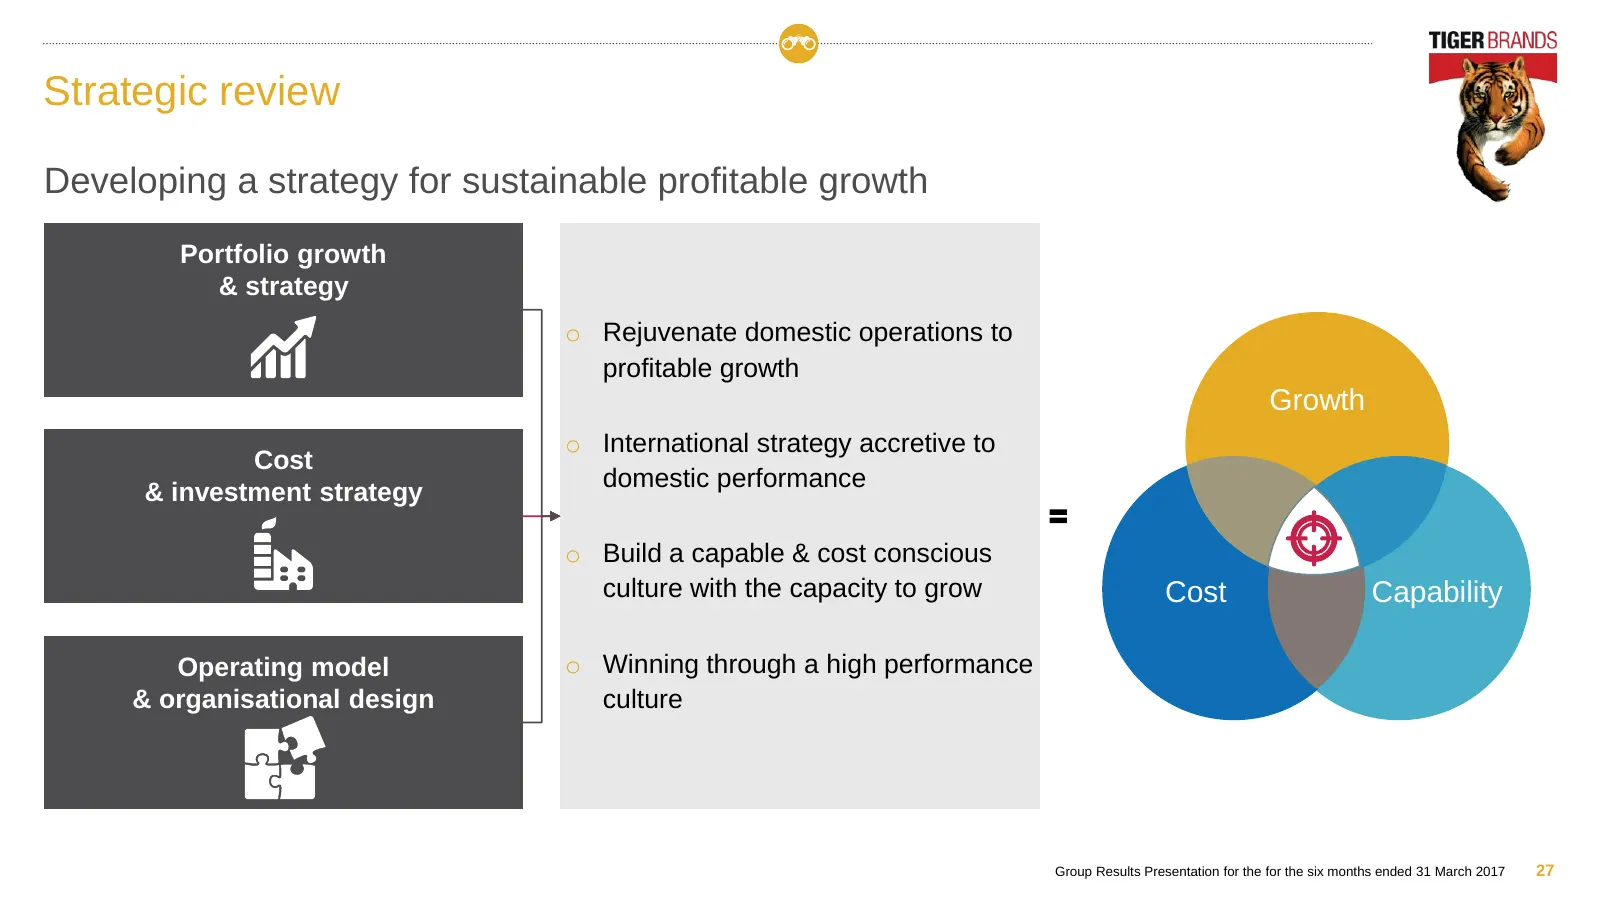
Strategic review Developing a strategy for sustainable profitable growth Portfolio growth & strategy o Rejuvenate domestic operations to profitable growth Growth o International strategy accretive to Cost domestic performance & investment strategy o Build a capable & cost conscious culture with the
Slide 28: Drive sustainable growth
Drive sustainable growth Key highlights o Drive sustainable growth by growing the core & expanding adjacent categories o Adopt a category driven approach in the rest of Africa o Build sustainable capabilities required to win with consumers, customers & partners o Deploy an operating model that provi
Slide 29: Our vision
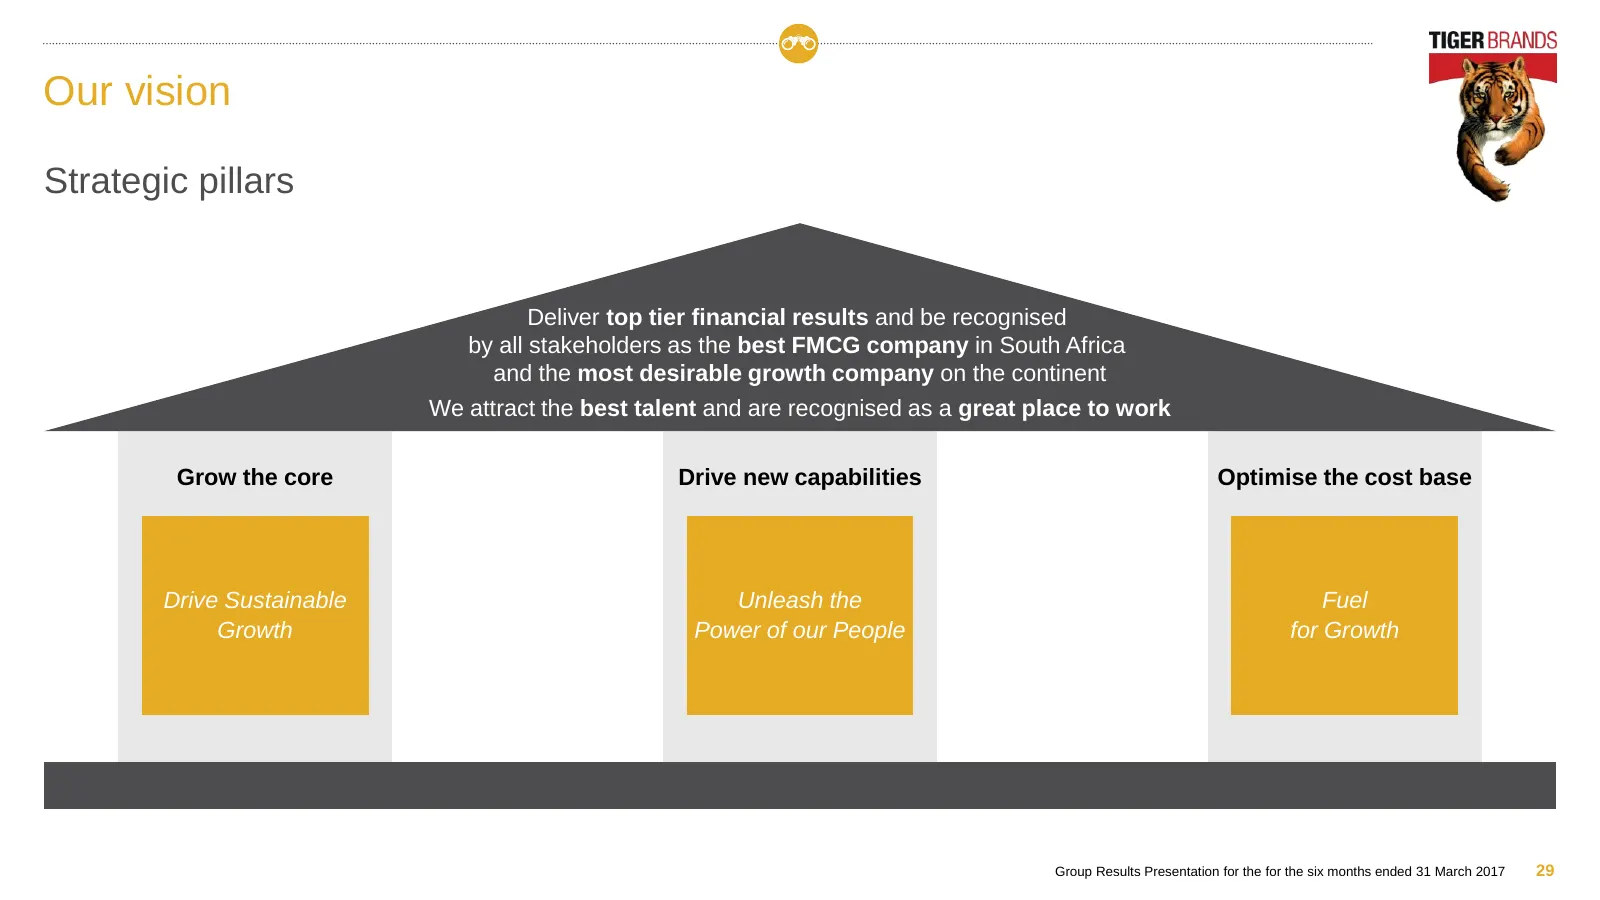
Our vision Strategic pillars Deliver top tier financial results and be recognised by all stakeholders as the best FMCG company in South Africa and the most desirable growth company on the continent We attract the best talent and are recognised as a great place to work Grow the core Drive new capabil
Slide 30: Portfolio growth & strategy
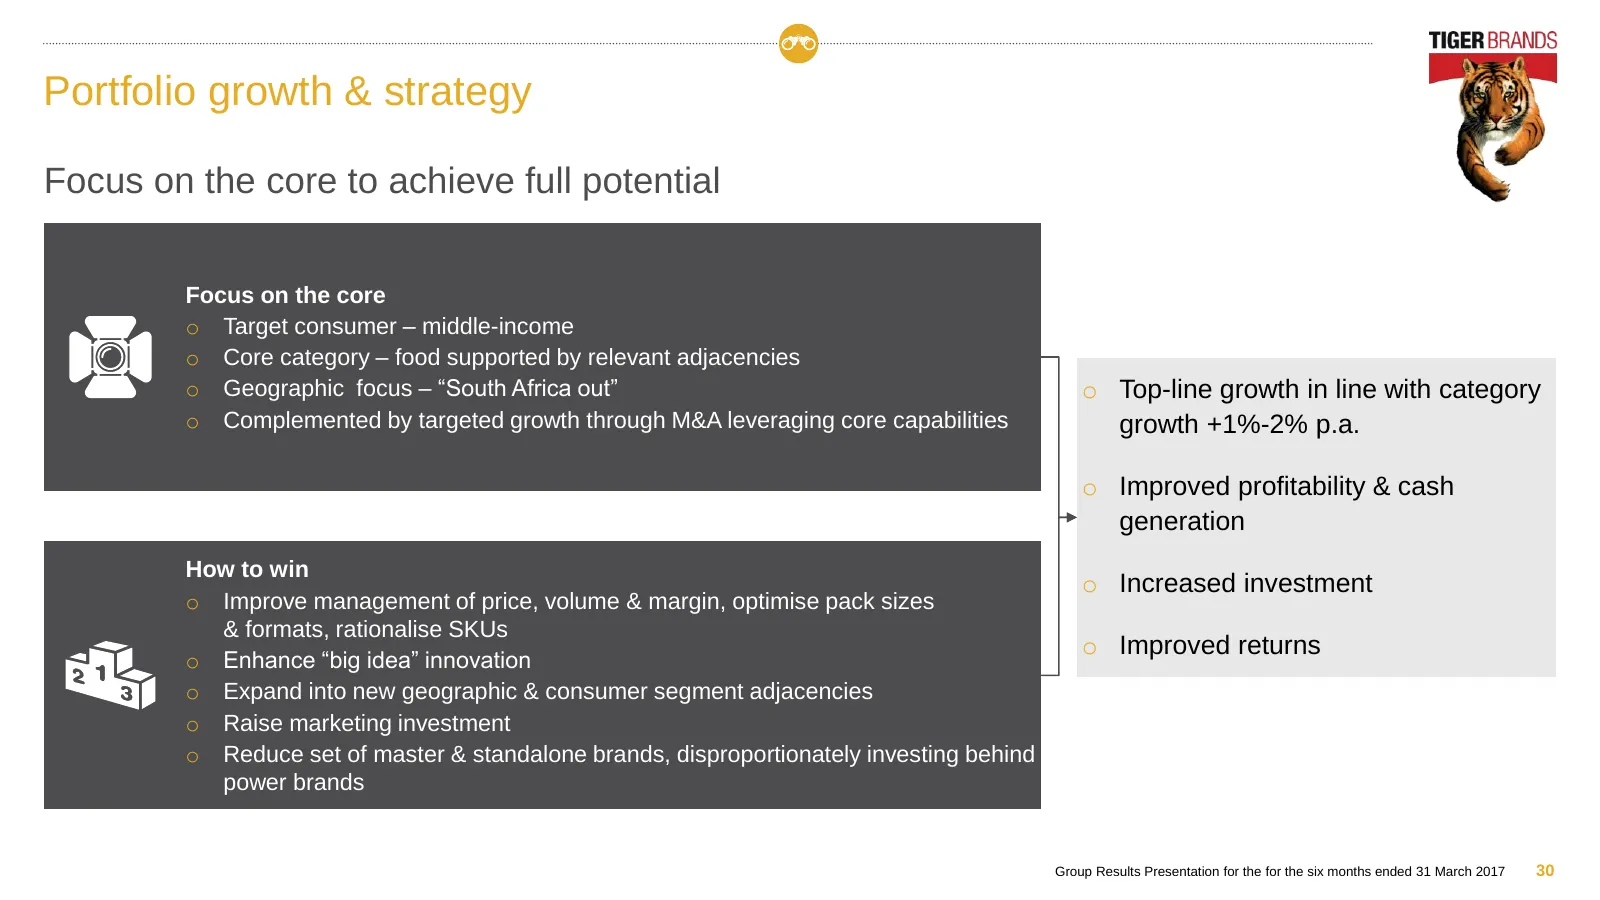
Portfolio growth & strategy Focus on the core to achieve full potential Focus on the core o Target consumer – middle-income o Core category – food supported by relevant adjacencies o Geographic focus – “South Africa out” o Top-line growth in line with category o Complemented by targeted growth throu
Slide 31: Defining the core
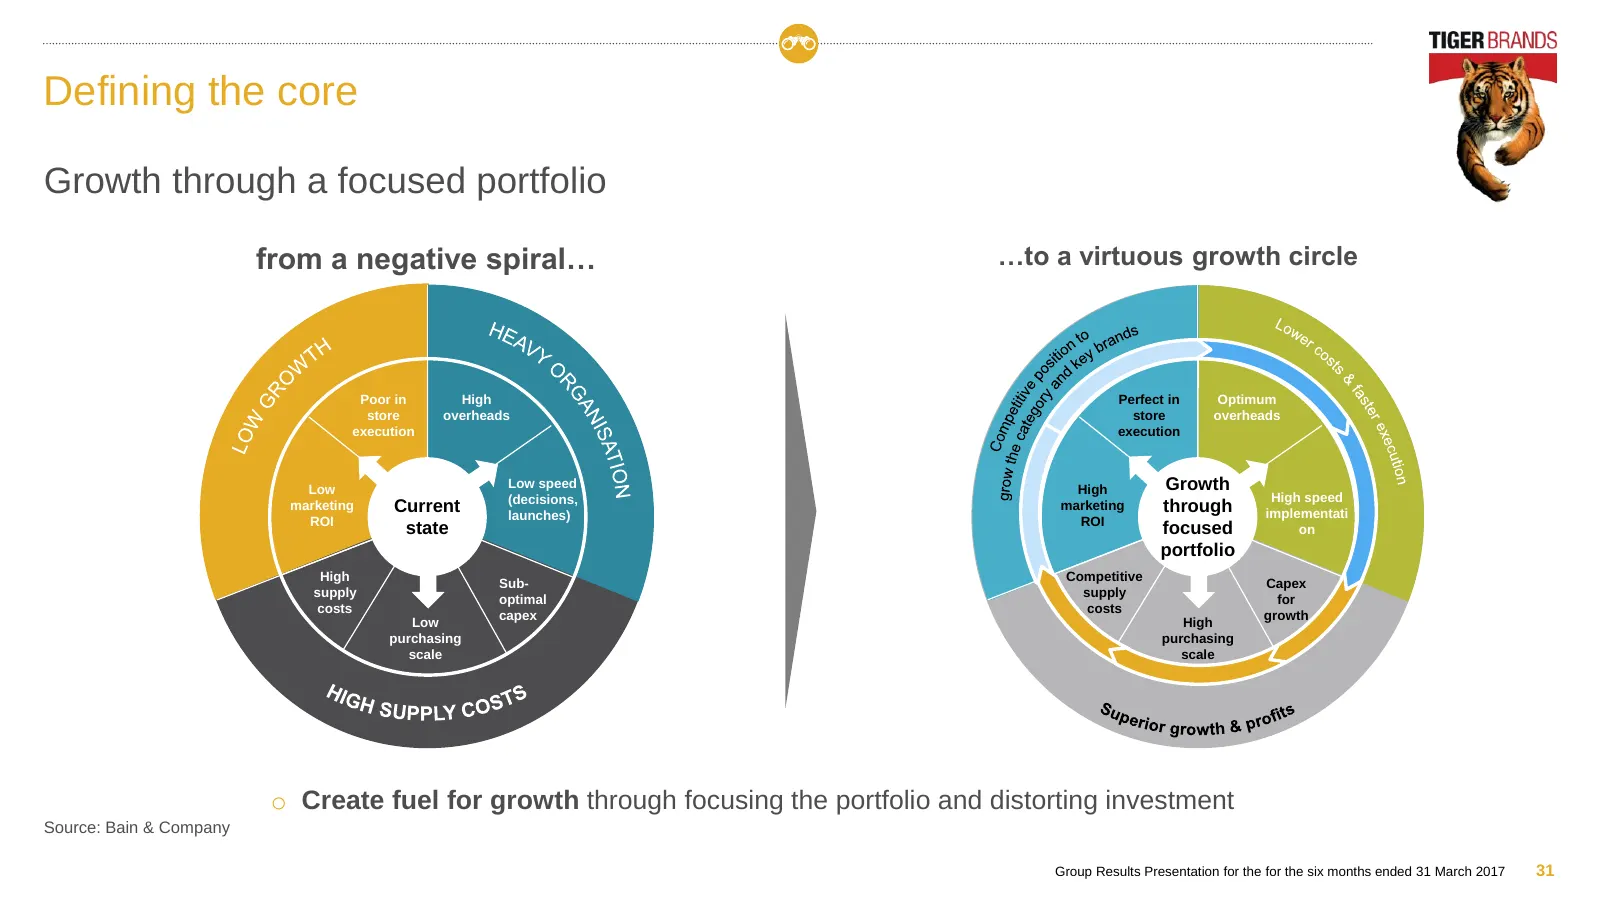
Defining the core Growth through a focused portfolio from a negative spiral… …to a virtuous growth circle Poor in High Perfect in Optimum store overheads store overheads execution execution Low Low speed High Growth (decisions, High speed marketing Current launches) marketing through implementati RO
Slide 32: Target consumer – the growing middle market
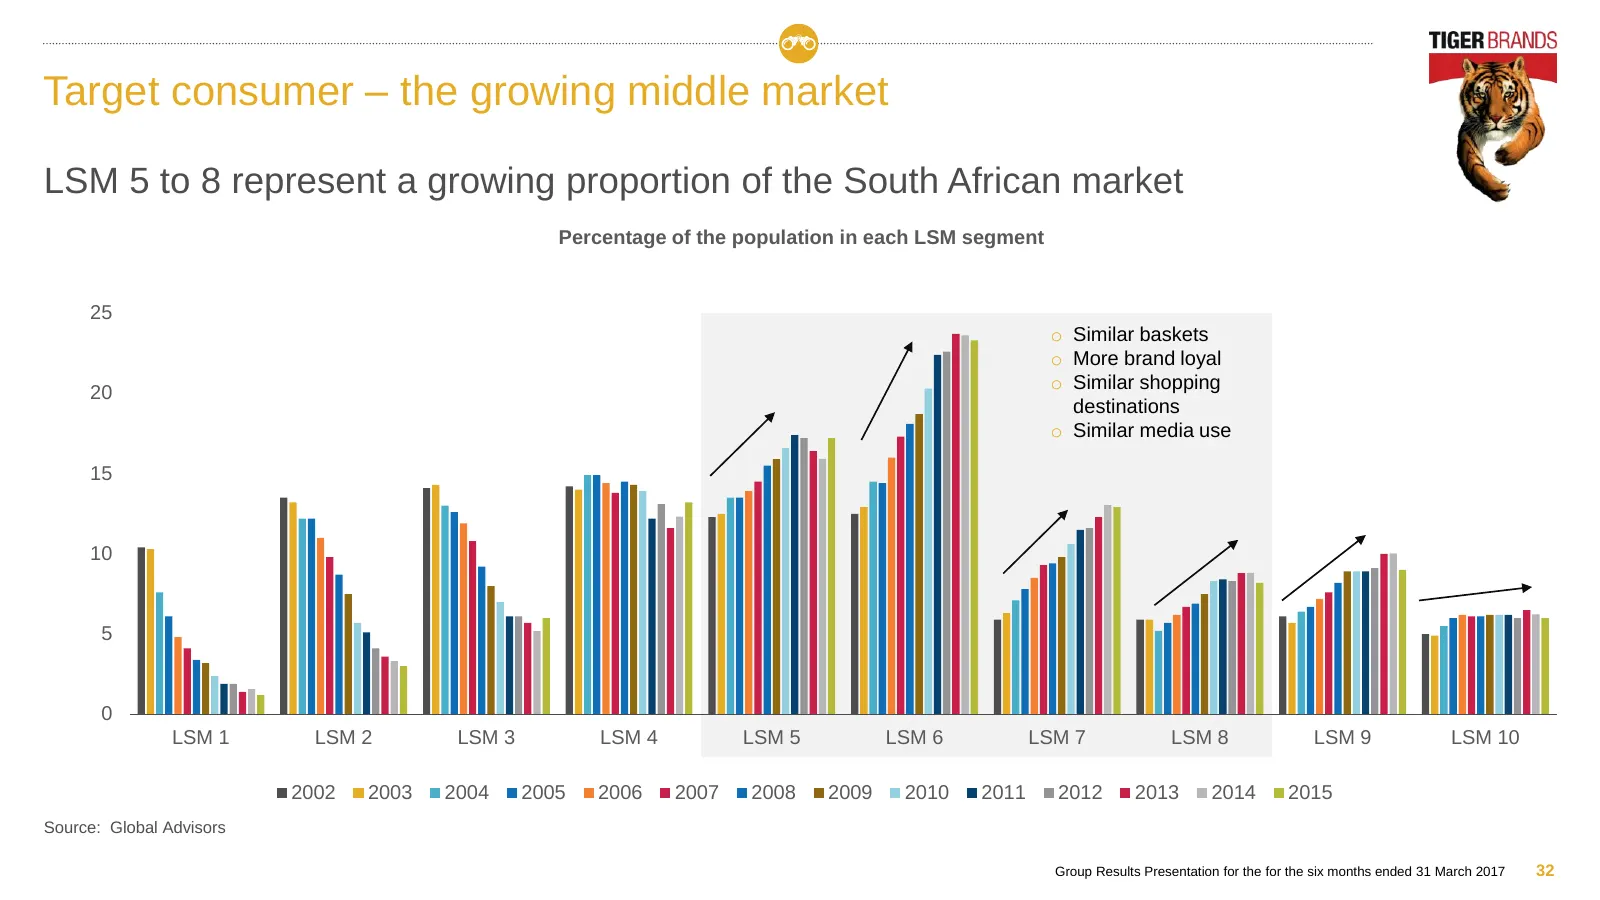
Target consumer – the growing middle market LSM 5 to 8 represent a growing proportion of the South African market Percentage of the population in each LSM segment 25 o Similar baskets o More brand loyal 20 o Similar shopping destinations o Similar media use 15 10 5 0 LSM 1 LSM 2 LSM 3 LSM 4 LSM 5 LS
Slide 33: Tiger's core consumer
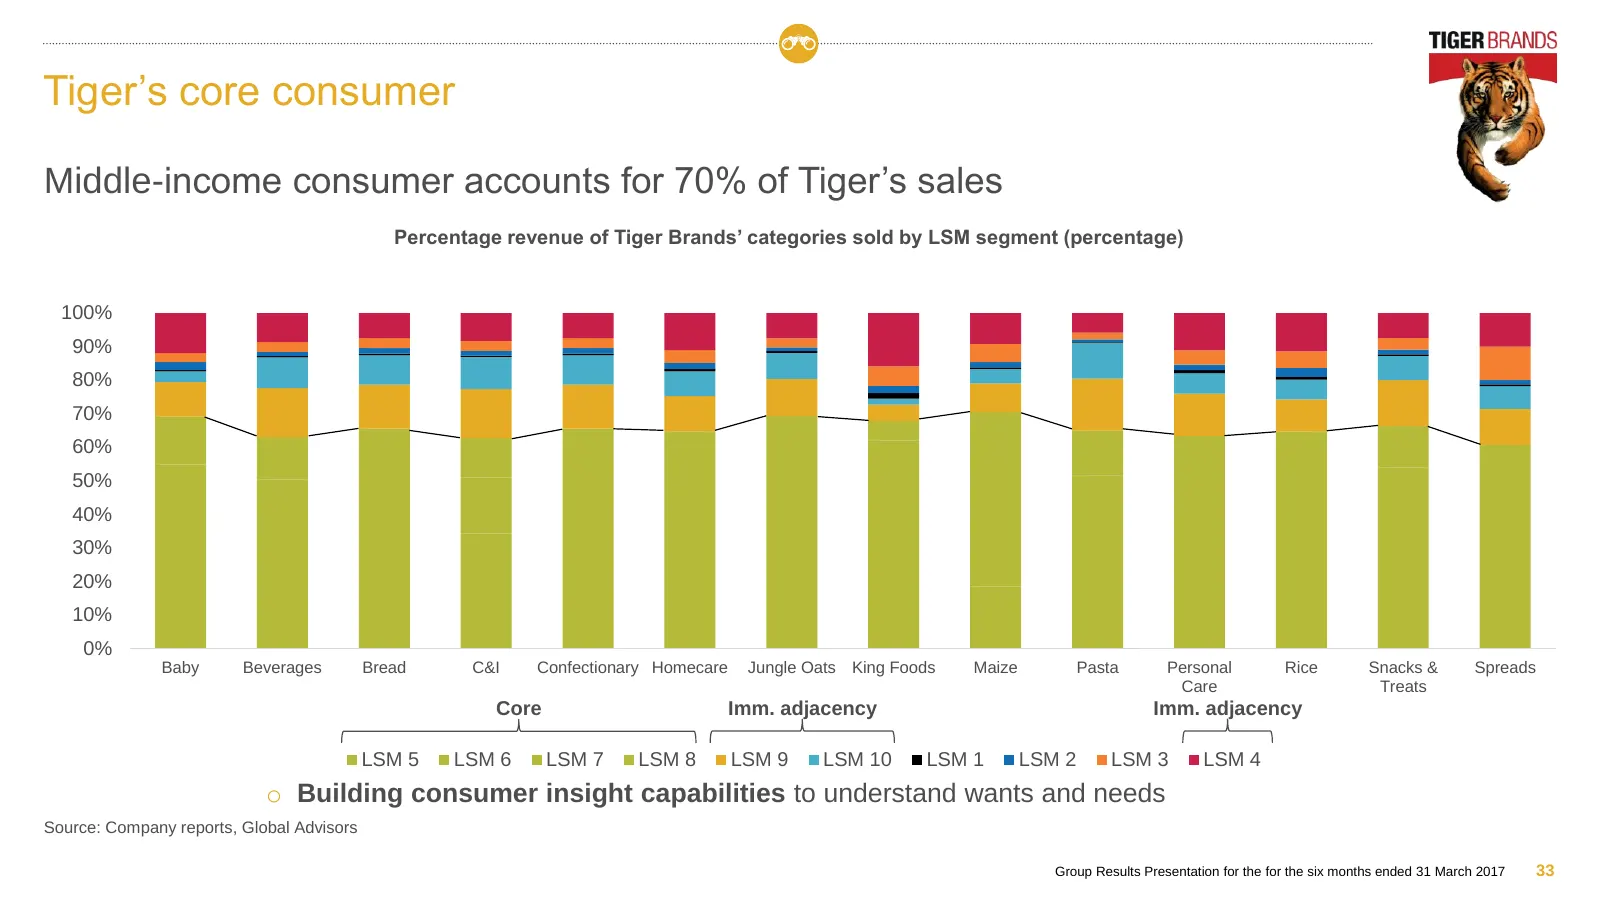
Tiger’s core consumer Middle-income consumer accounts for 70% of Tiger’s sales Percentage revenue of Tiger Brands’ categories sold by LSM segment (percentage) 100% 90% 80% 70% 60% 50% 40% 30% 20% 10% 0% Baby Beverages Bread C&I Confectionary Homecare Jungle Oats King Foods Maize Pasta Personal Rice
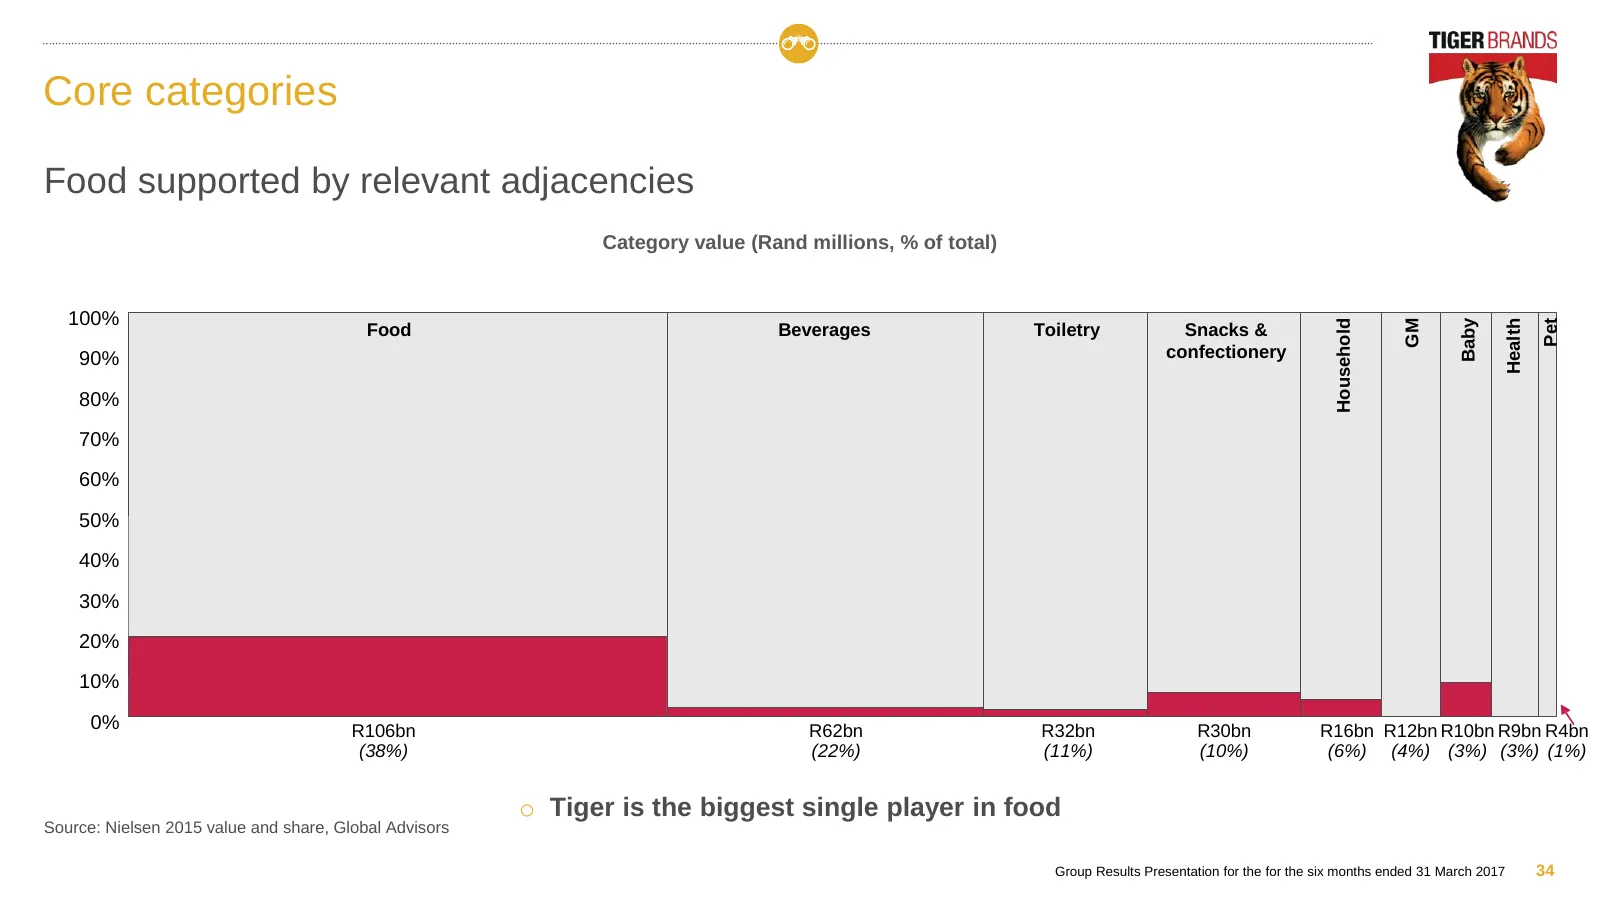
Slide 34: Core categories
Core categories Food supported by relevant adjacencies Category value (Rand millions, % of total) 100% Baby Health Household Pet GM Food Beverages Toiletry Snacks & 90% confectionery 80% 70% 60% 50% 40% 30% 20% 10% 0% R106bn R62bn R32bn R30bn R16bn R12bn R10bn R9bn R4bn (38%) (22%) (11%) (10%) (6%)
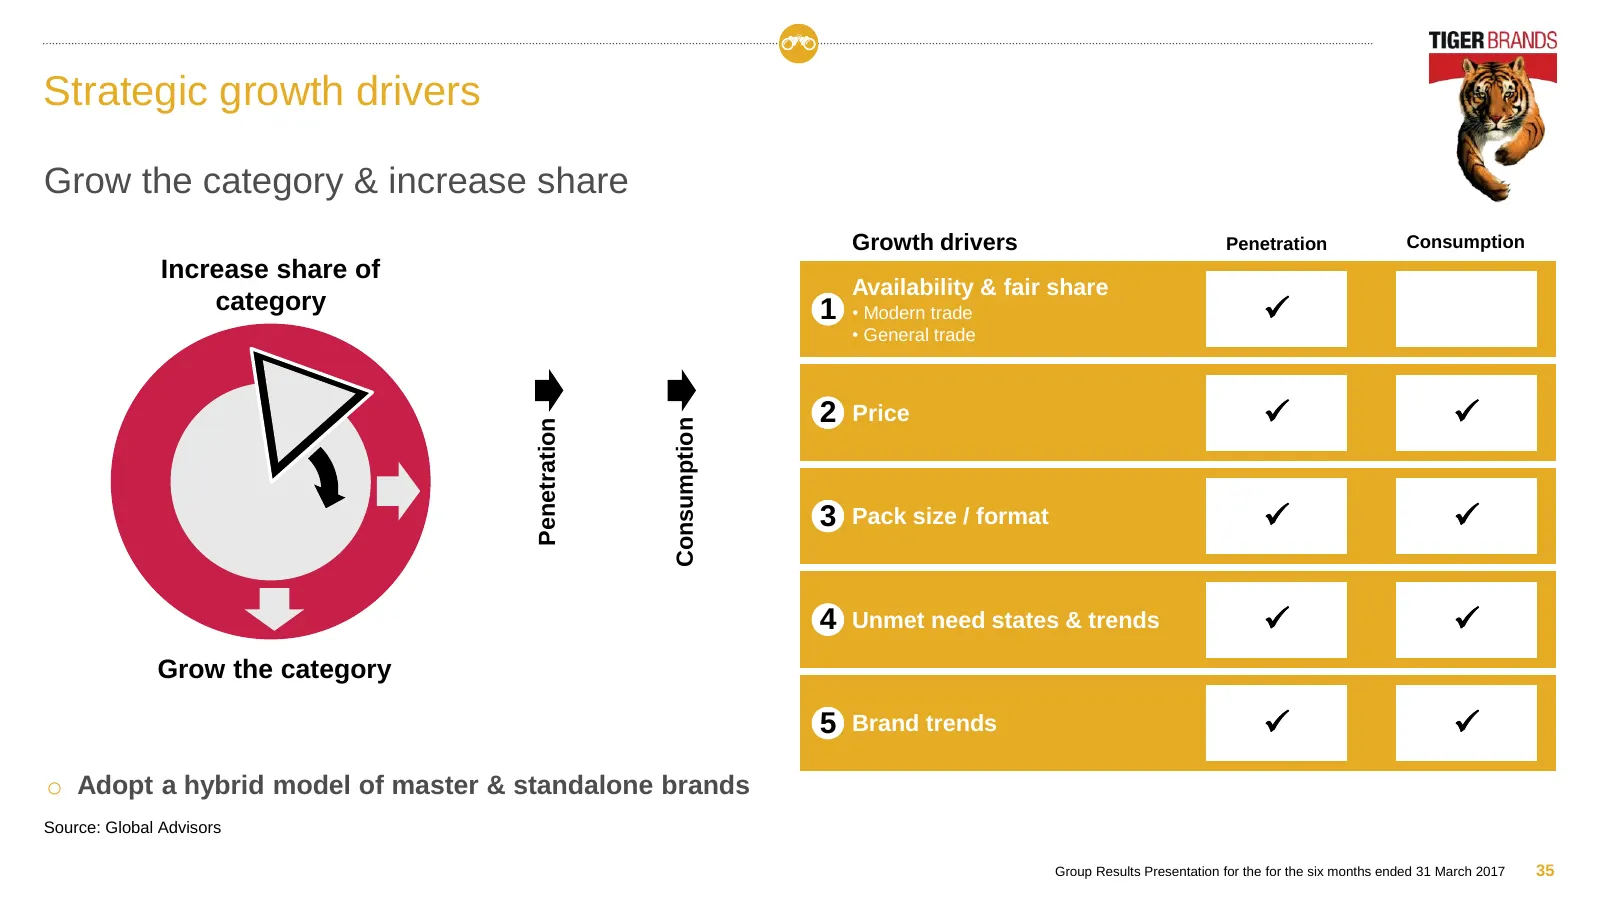
Slide 35: Strategic growth drivers
Strategic growth drivers Grow the category & increase share Growth drivers Penetration Consumption Increase share of Availability & fair share category 1 • Modern trade • General trade 2 Price Consumption Penetration 3 Pack size / format 4 Unmet need states & trends Grow the category 5
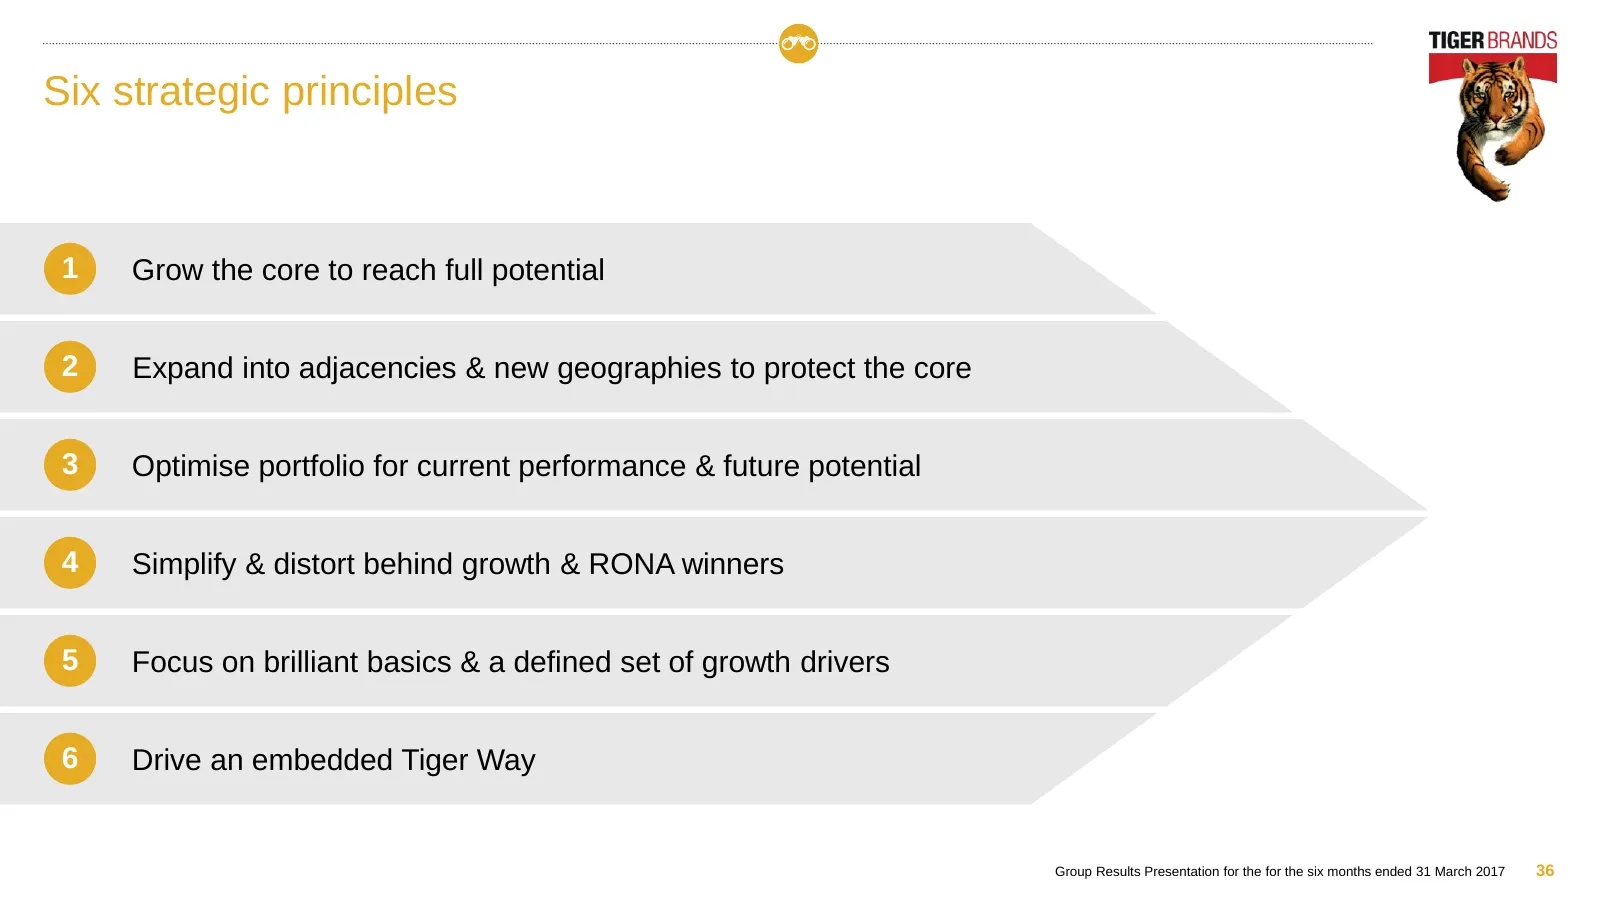
Slide 36: Six strategic principles
Six strategic principles 1 Grow the core to reach full potential 2 Expand into adjacencies & new geographies to protect the core 3 Optimise portfolio for current performance & future potential 4 Simplify & distort behind growth & RONA winners 5 Focus on brilliant basics & a defined set of growth dri
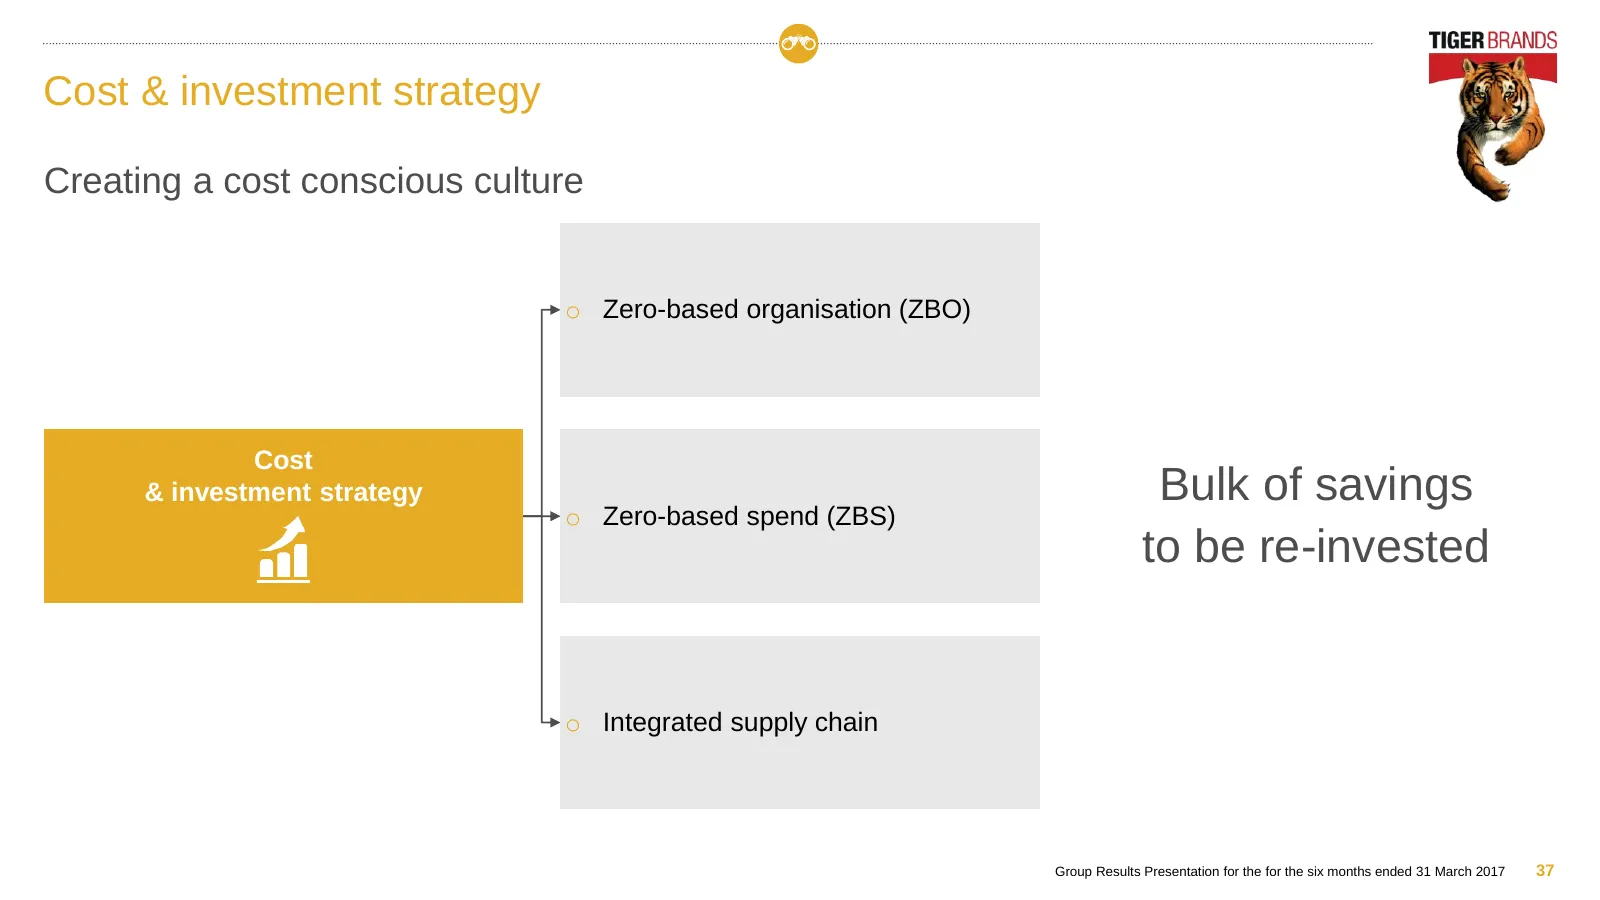
Slide 37: Cost & investment strategy
Cost & investment strategy Creating a cost conscious culture o Zero-based organisation (ZBO) Cost & investment strategy Bulk of savings o Zero-based spend (ZBS) to be re-invested o Integrated supply chain Group Results Presentation for the for the six months ended 31 March 2017 37
Slide 38: Zero Based Spend (ZBS)
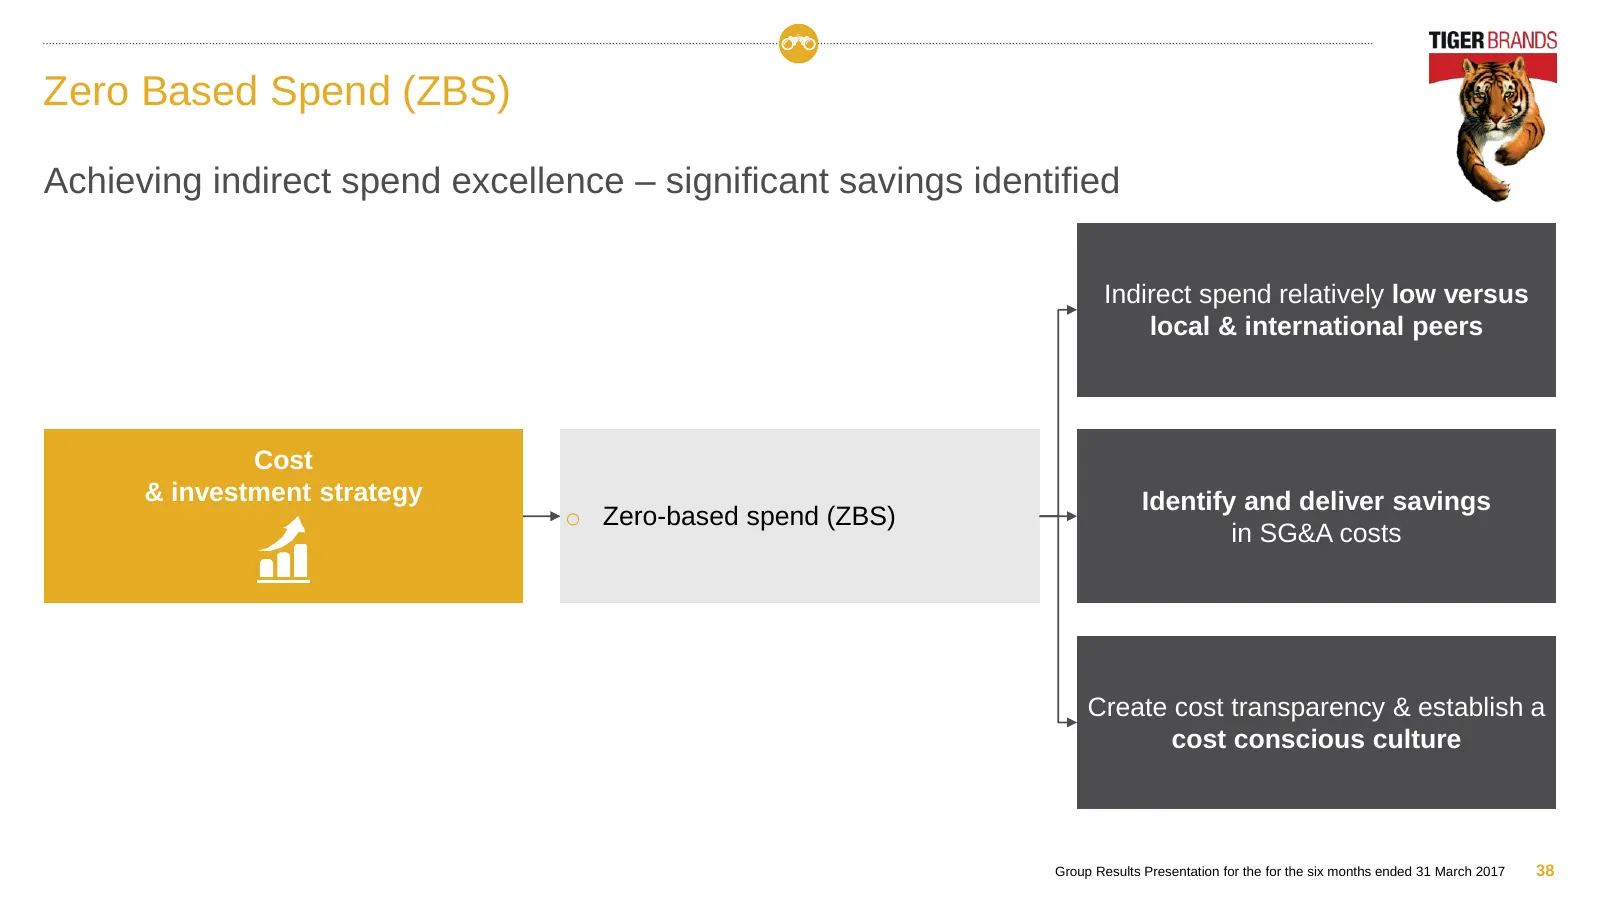
Zero Based Spend (ZBS) Achieving indirect spend excellence – significant savings identified Indirect spend relatively low versus local & international peers Cost & investment strategy Identify and deliver savings o Zero-based spend (ZBS) in SG&A costs Create cost transparency & establish a cost cons
Slide 39: Making it stick
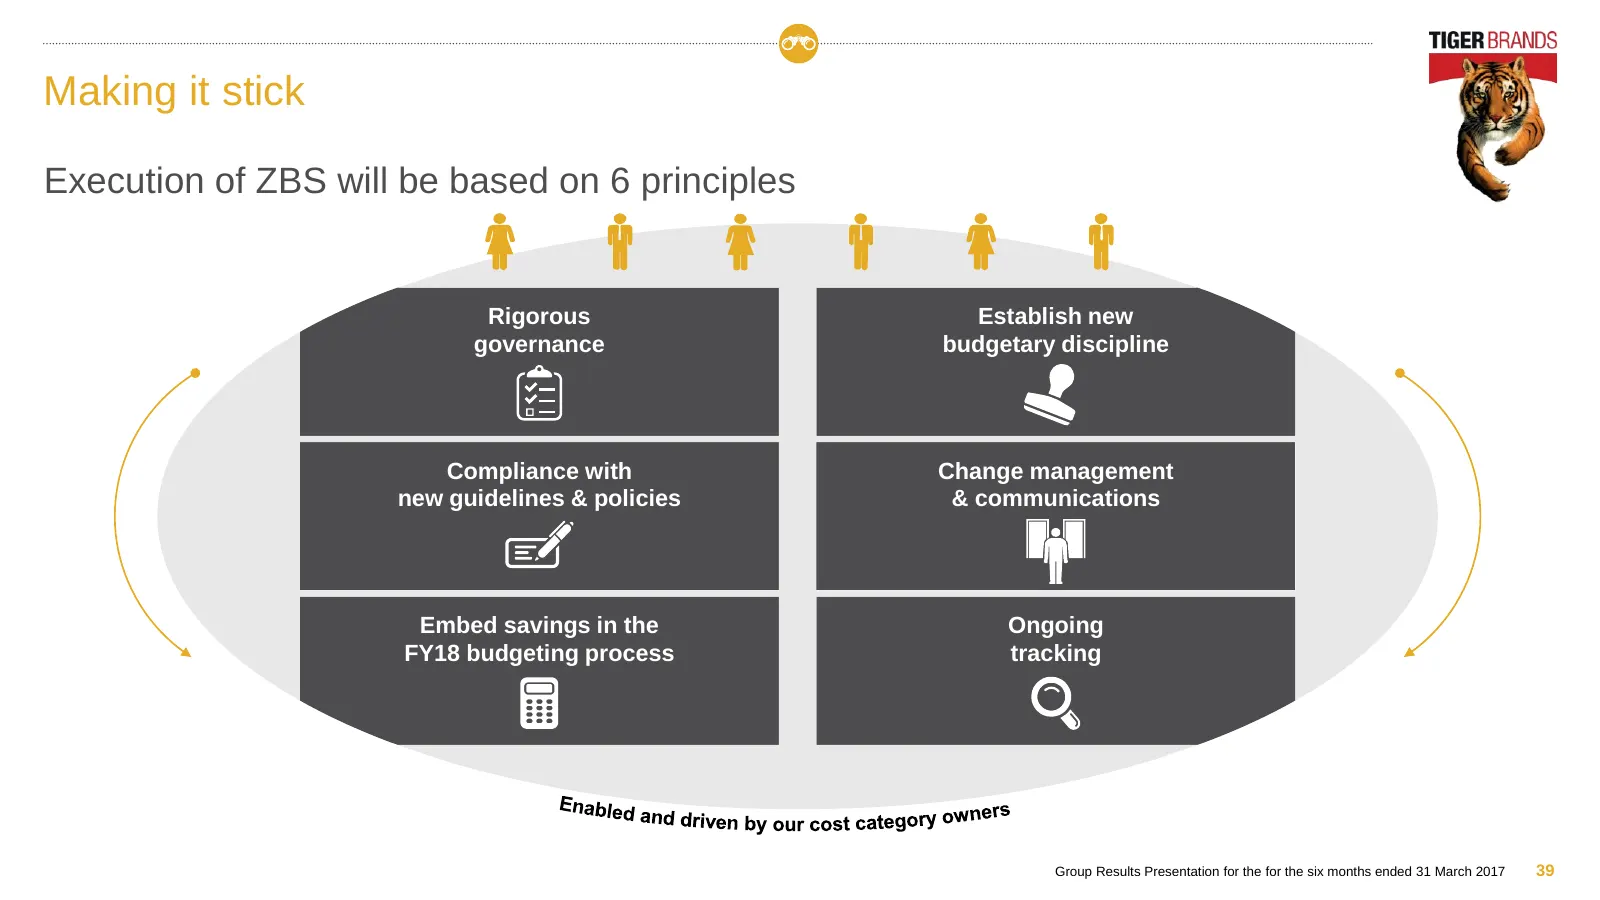
Making it stick Execution of ZBS will be based on 6 principles Rigorous Establish new governance budgetary discipline Compliance with Change management new guidelines & policies & communications Embed savings in the Ongoing FY18 budgeting process tracking Group Results Presentation for the for the s
Slide 40: Integrated Supply Chain
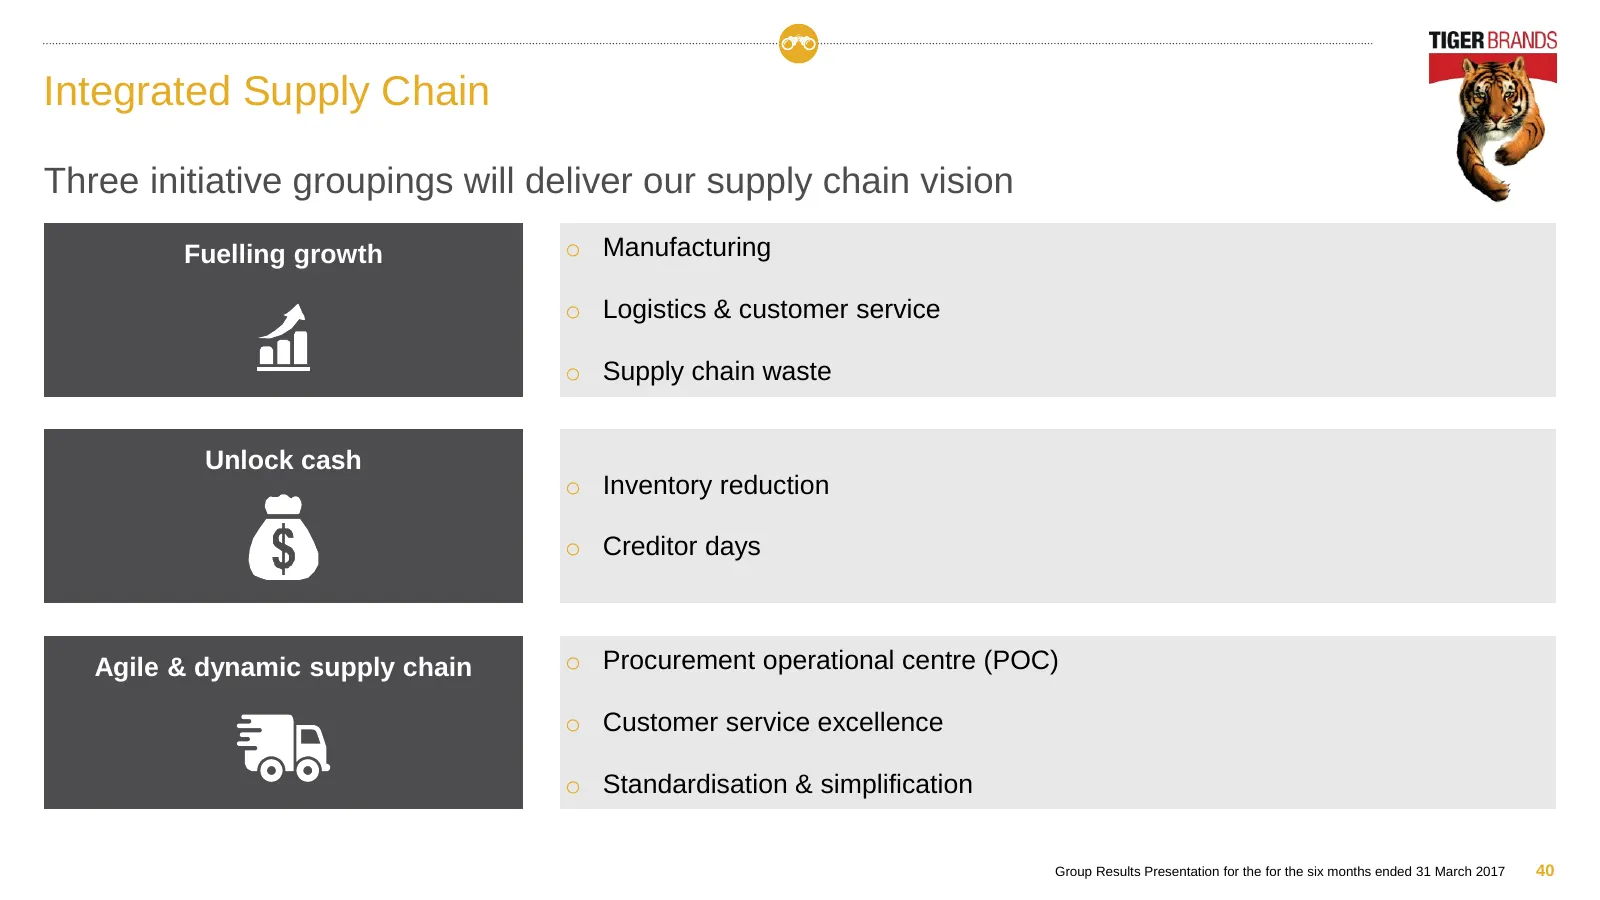
Integrated Supply Chain Three initiative groupings will deliver our supply chain vision Fuelling growth o Manufacturing o Logistics & customer service o Supply chain waste Unlock cash o Inventory reduction o Creditor days Agile & dynamic supply chain o Procurement operational centre (POC) o Customer
Slide 41: The big opportunities…
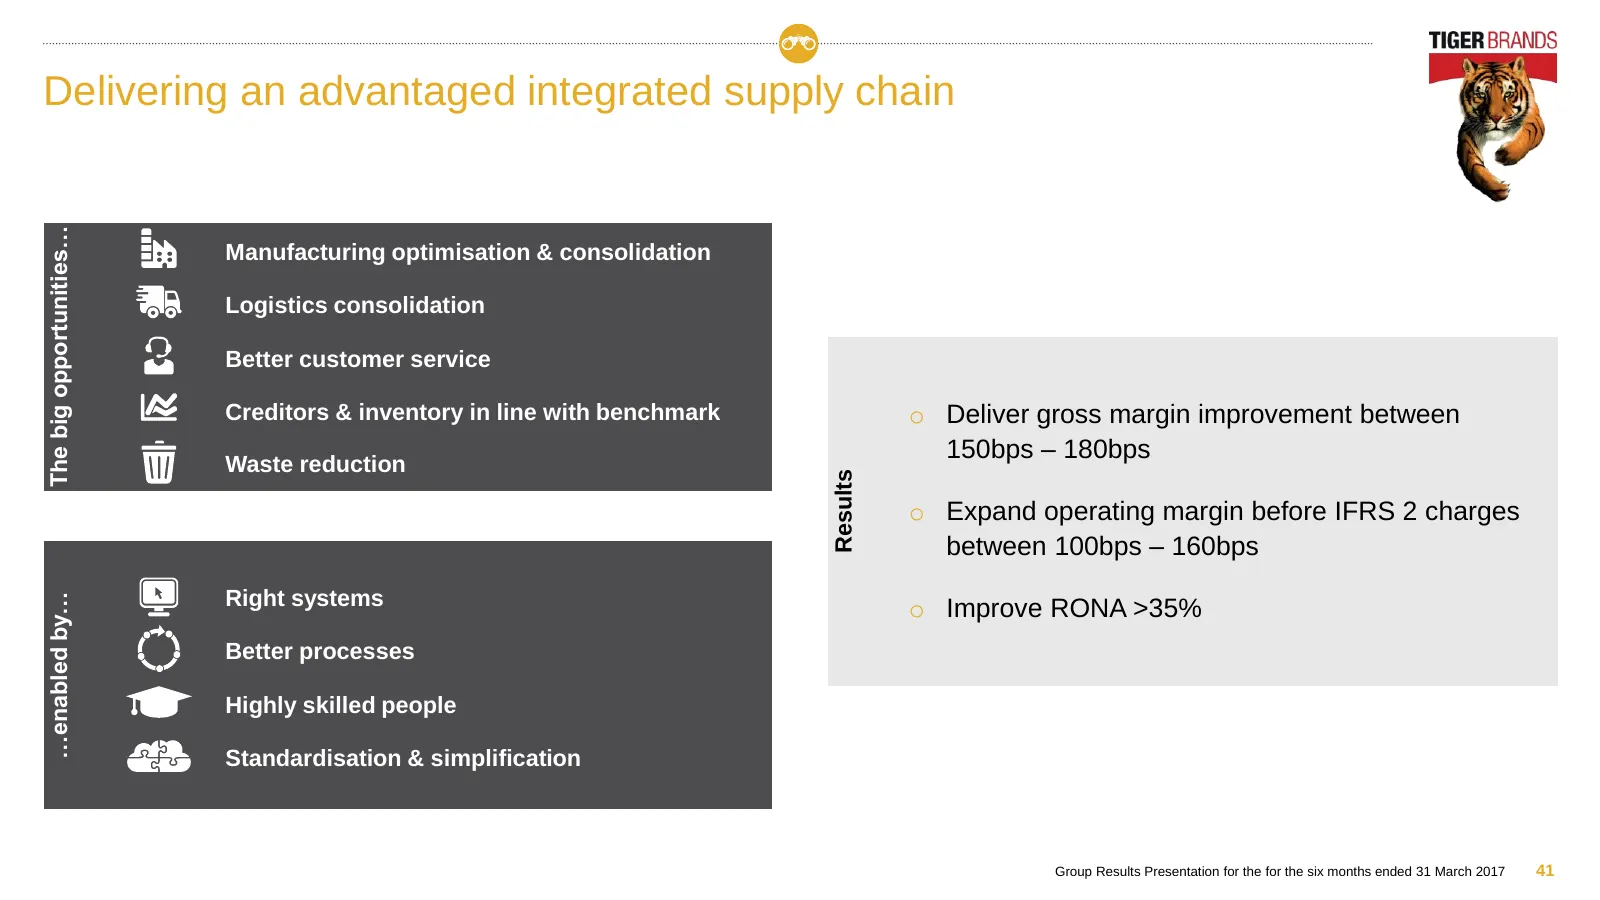
Delivering an advantaged integrated supply chain The big opportunities… Manufacturing optimisation & consolidation Logistics consolidation Better customer service Creditors & inventory in line with benchmark o Deliver gross margin improvement between 150bps – 180bps Waste reduction Results o Expand
Slide 42: Operating model & organisational design
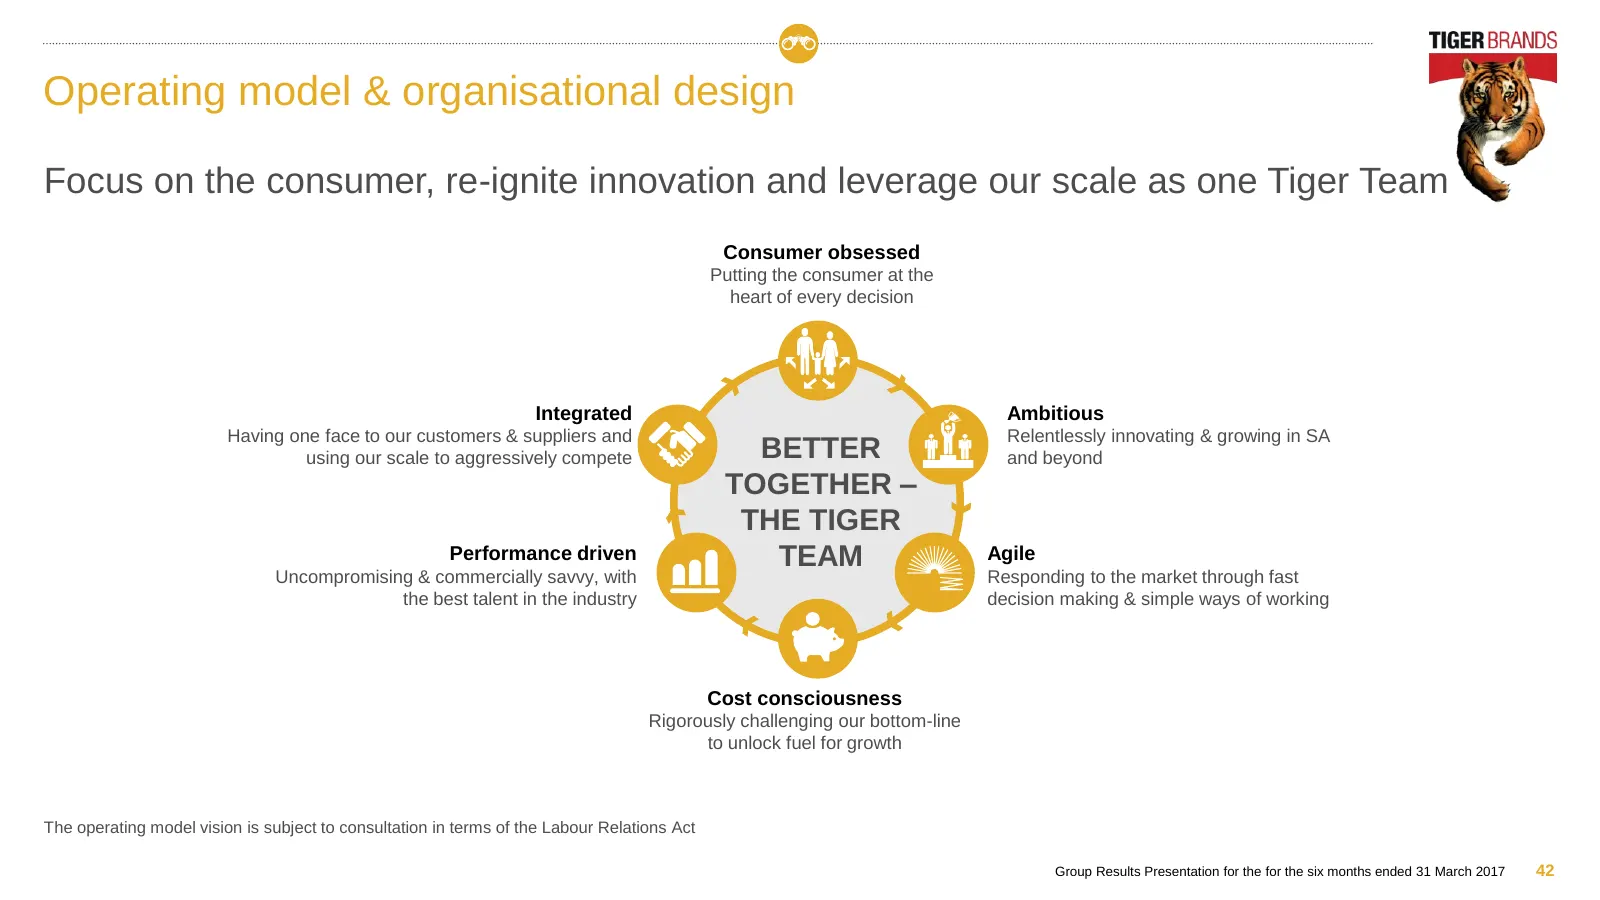
Operating model & organisational design Focus on the consumer, re-ignite innovation and leverage our scale as one Tiger Team Consumer obsessed Putting the consumer at the heart of every decision Integrated Ambitious Having one face to our customers & suppliers and Relentlessly innovating & growing i
Slide 43: From federated to integrated
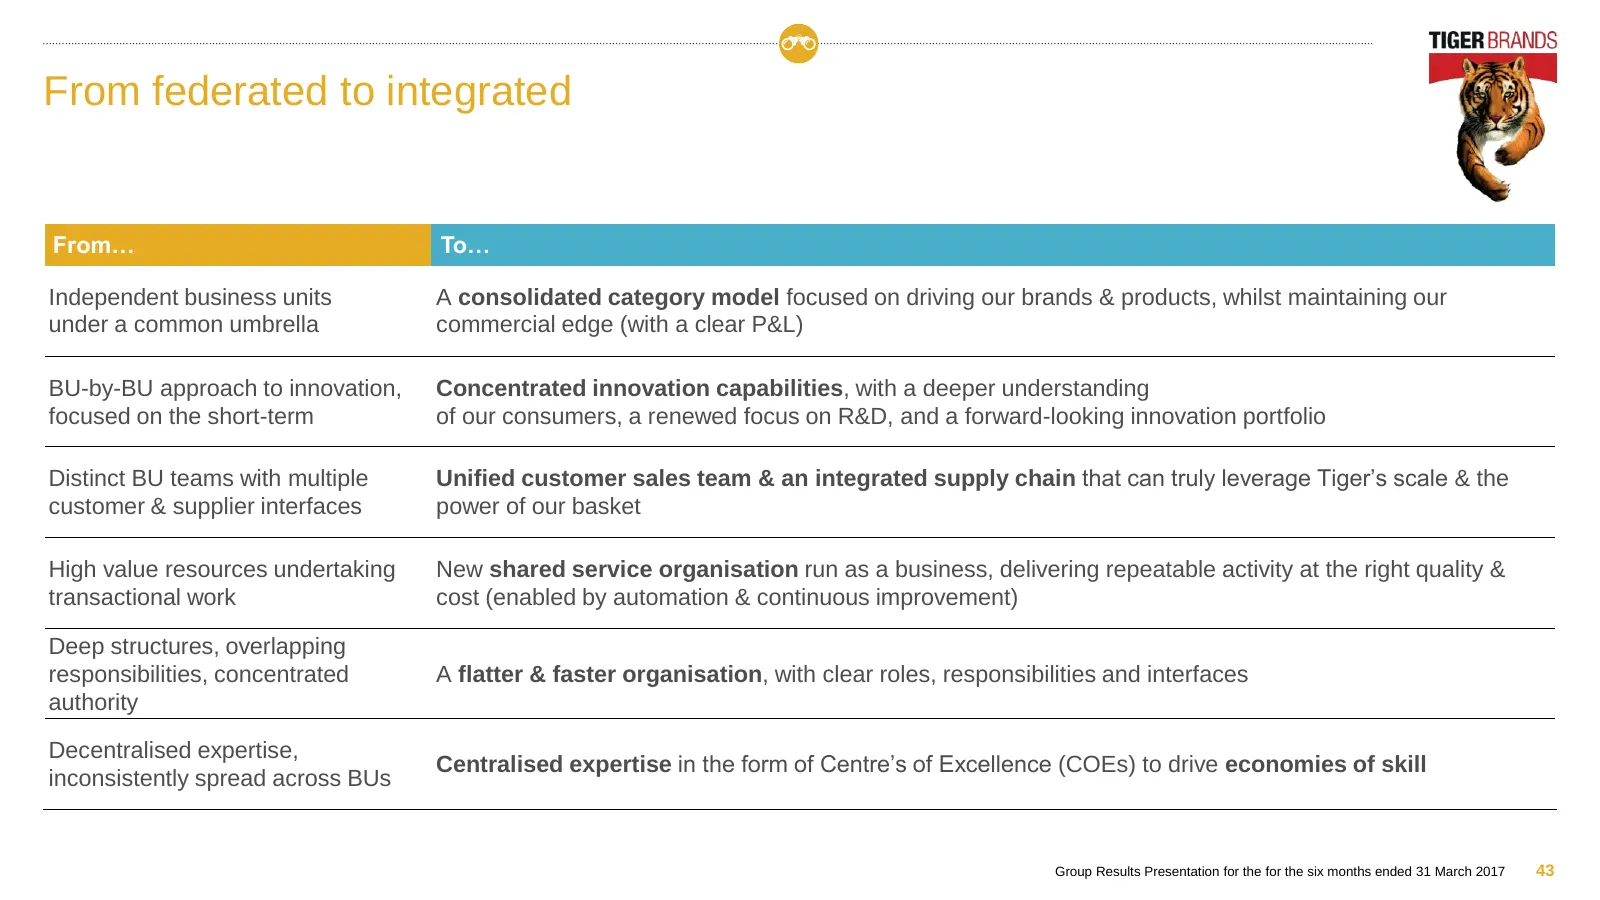
From federated to integrated From… To… Independent business units A consolidated category model focused on driving our brands & products, whilst maintaining our under a common umbrella commercial edge (with a clear P&L) BU-by-BU approach to innovation, Concentrated innovation capabilities, with a de
Slide 44: Strategic review
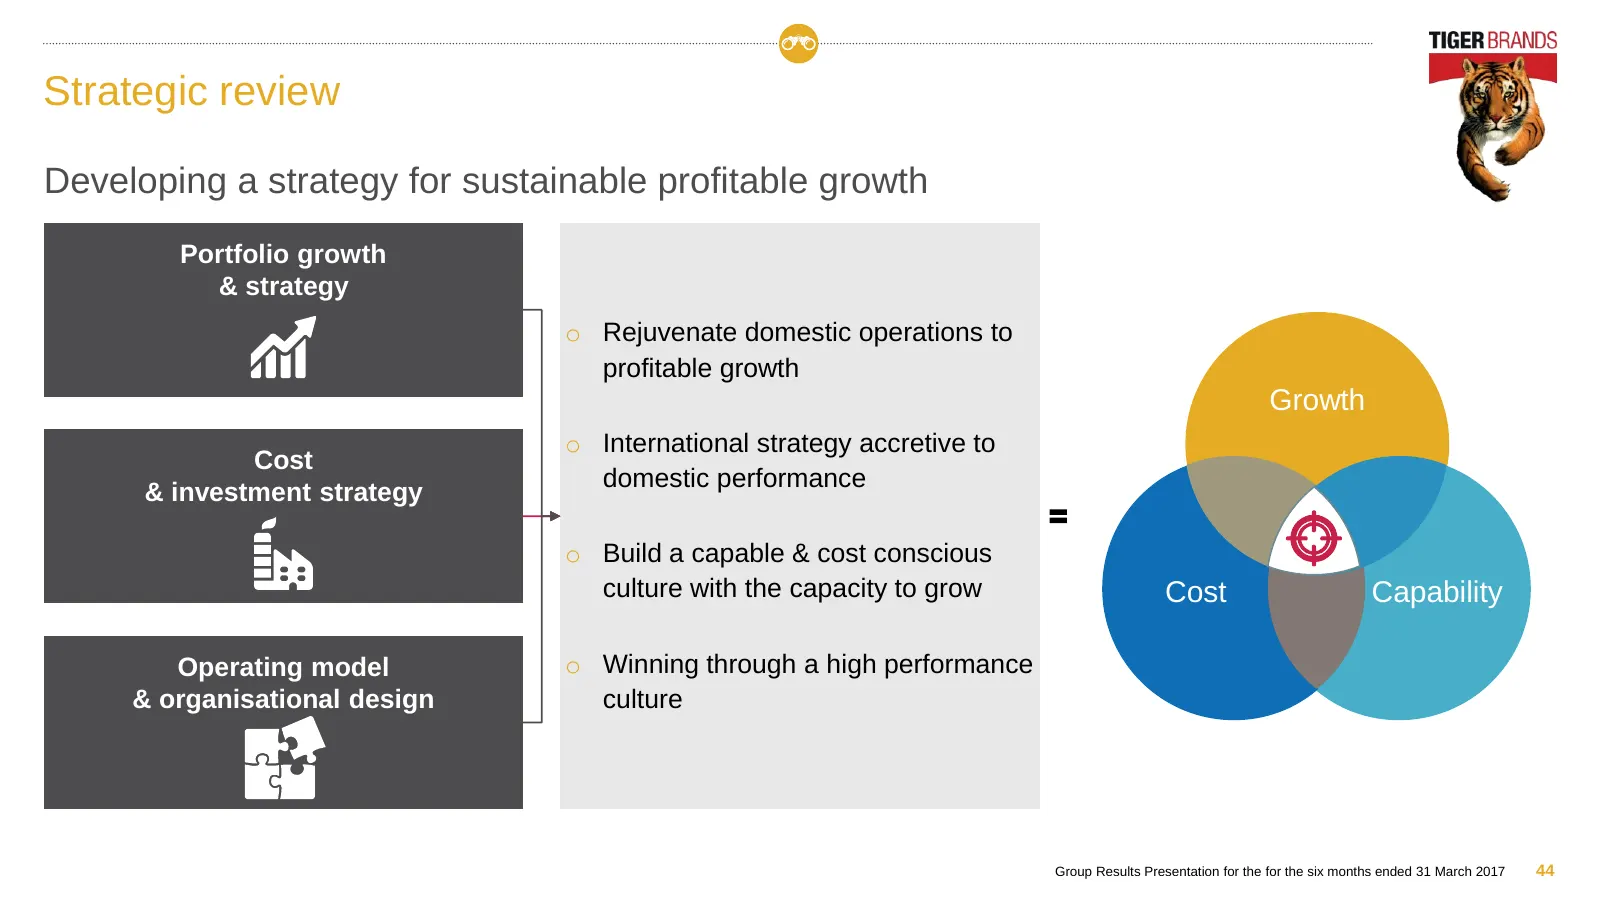
Strategic review Developing a strategy for sustainable profitable growth Portfolio growth & strategy o Rejuvenate domestic operations to profitable growth Growth o International strategy accretive to Cost domestic performance & investment strategy o Build a capable & cost conscious culture with the
Slide 45: Appendices
Appendices
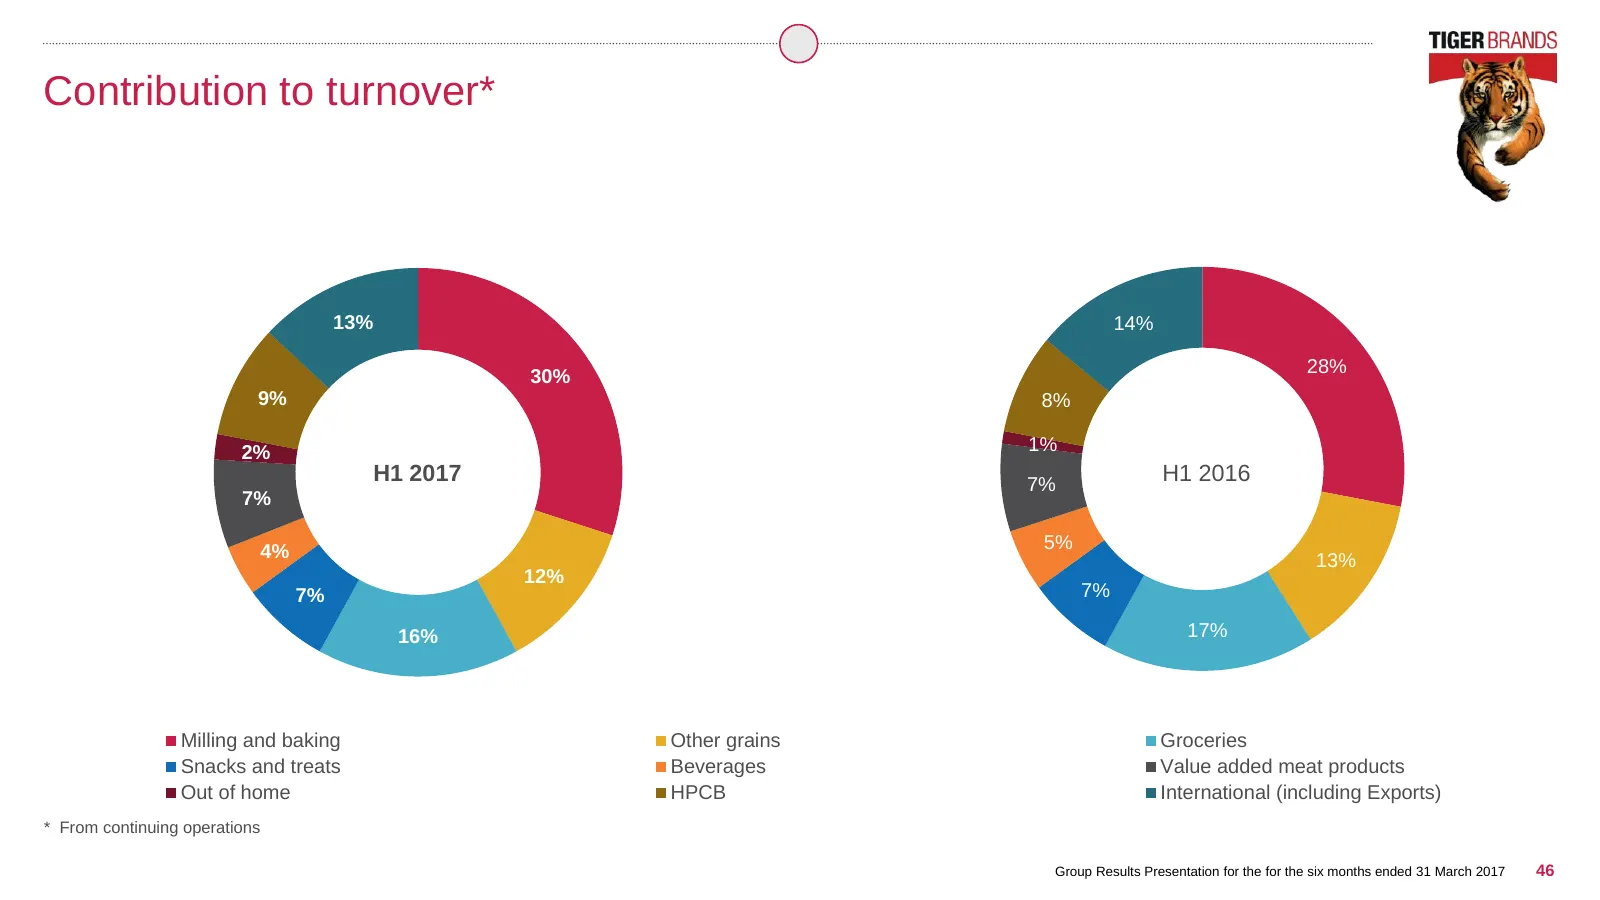
Slide 46: Contribution to turnover
Contribution to turnover* 13% 14% 28% 30% 9% 8% 2% 1% H1 2017 7% H1 2016 7% 4% 5% 13% 12% 7% 7% 16% 17% Milling and baking Other grains Groceries Snacks and treats Beverages Value added meat products Out of home HPCB International (including Exports) * From continuing operations Group Results Presen
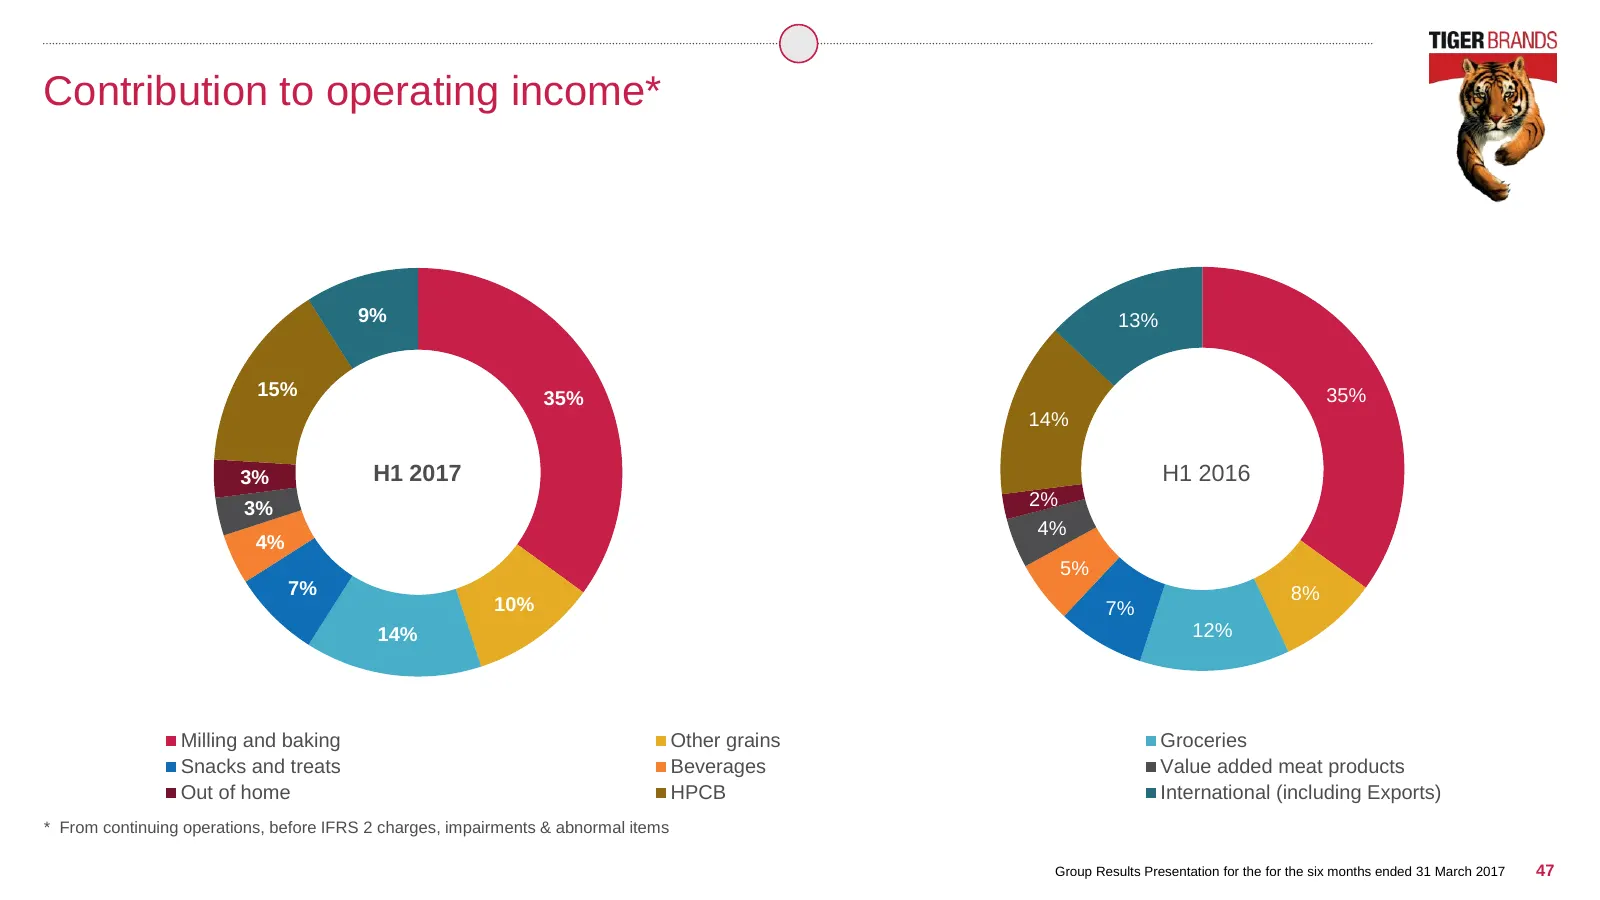
Slide 47: Contribution to operating income
Contribution to operating income* 9% 13% 15% 35% 35% 14% 3% H1 2017 H1 2016 3% 2% 4% 4% 5% 7% 8% 10% 7% 14% 12% Milling and baking Other grains Groceries Snacks and treats Beverages Value added meat products Out of home HPCB International (including Exports) * From continuing operations, before IFRS
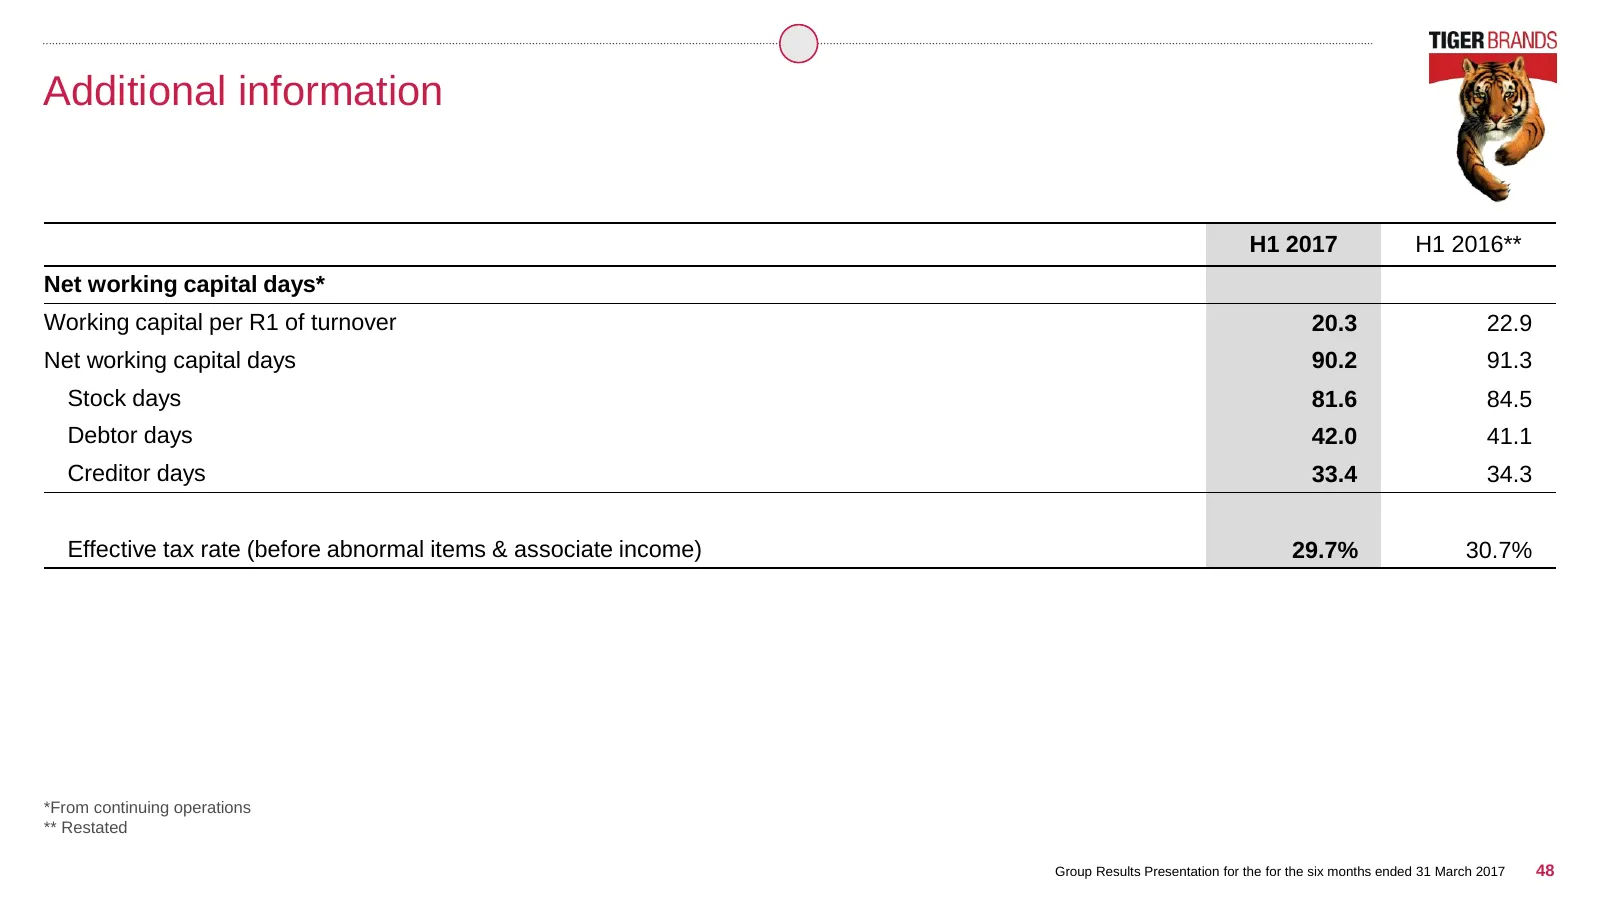
Slide 48: Additional information
Additional information H1 2017 H1 2016** Net working capital days* Working capital per R1 of turnover 20.3 22.9 Net working capital days 90.2 91.3 Stock days 81.6 84.5 Debtor days 42.0 41.1 Creditor days 33.4 34.3 Effective tax rate (before abnormal items & associate income) 29.7% 30.7% *From contin
Slide 49: Investor Relations
Investor Relations Nikki Catrakilis-Wagner Group Investor Relations Executive investorrelations@tigerbrands.com T: +27 11 840 4841
Source: Internet Archive copy of tigerbrands.com
More decks from Tiger Brands Limited
 H1 2026 Earnings Presentation37 slides · Jun 1, 2026
 H1 2026 Earnings Presentation38 slides · Jun 1, 2026
 FY2025 Earnings Presentation38 slides · Nov 26, 2025
 H1 2025 Earnings Presentation43 slides · May 28, 2025
 H1 FY2024 Earnings Presentation38 slides · May 27, 2024
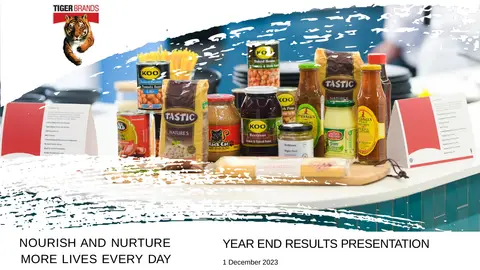 FY2023 Earnings Presentation45 slides · Dec 1, 2023