Old Mutual Ltd. · JSE:OMU
Old Mutual — Q1 2015 Earnings Presentation
19 slides from Old Mutual's earnings presentation, May 14, 2015
Slide 1: Q1 2015 Investor Update
Q1 2015 INVESTOR UPDATE May 2015 INVESTMENT | SAVINGS | INSURANCE | BANKING
Slide 2: Disclaimer
DISCLAIMER This presentation may contain certain forward-looking statements with respect to certain of Old Mutual plc’s plans and its current goals and expectations relating to its future financial condition, performance and results. By their nature, all forward-looking statements involve risk and u
Slide 3: Good Trading Performance and Further Strategic Progress
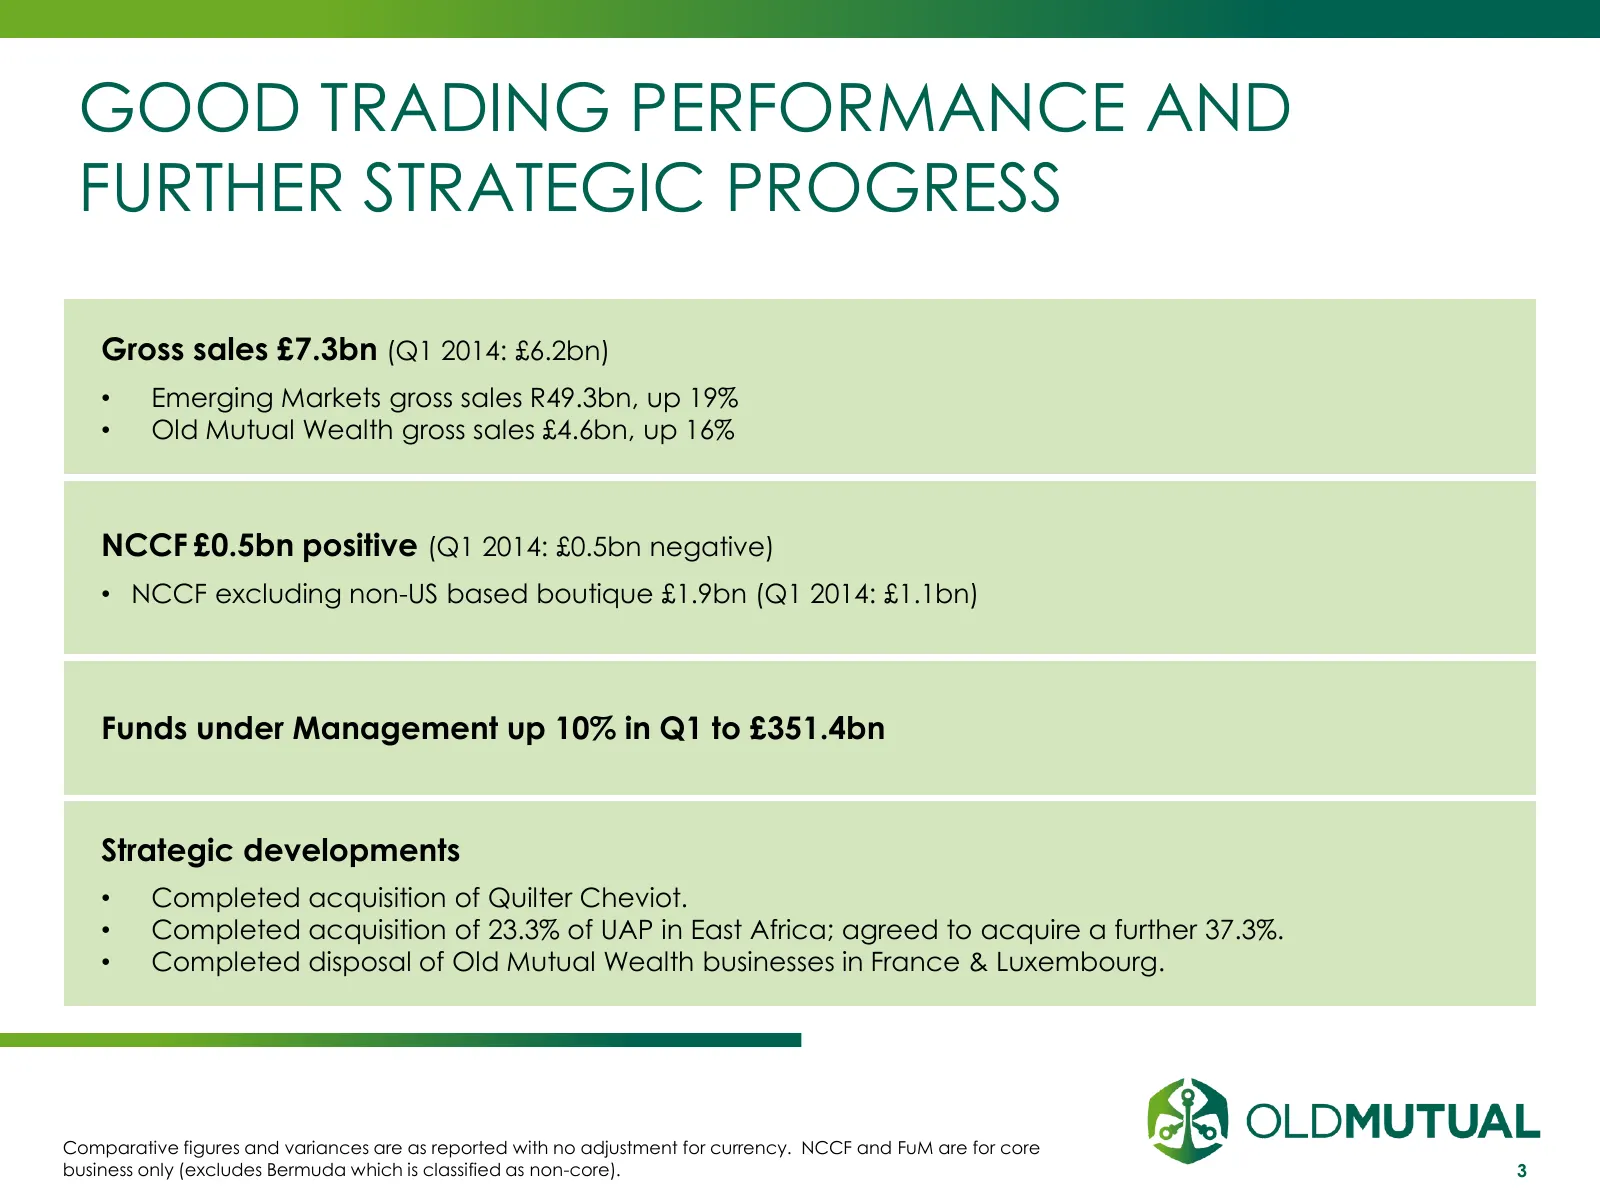
GOOD TRADING PERFORMANCE AND FURTHER STRATEGIC PROGRESS Gross sales £7.3bn (Q1 2014: £6.2bn) • Emerging Markets gross sales R49.3bn, up 19% • Old Mutual Wealth gross sales £4.6bn, up 16% NCCF £0.5bn positive (Q1 2014: £0.5bn negative) • NCCF excluding non-US based boutique £1.9bn (Q1 2014: £1.1bn) F
Slide 4: Group Overview: Sales & NCCF
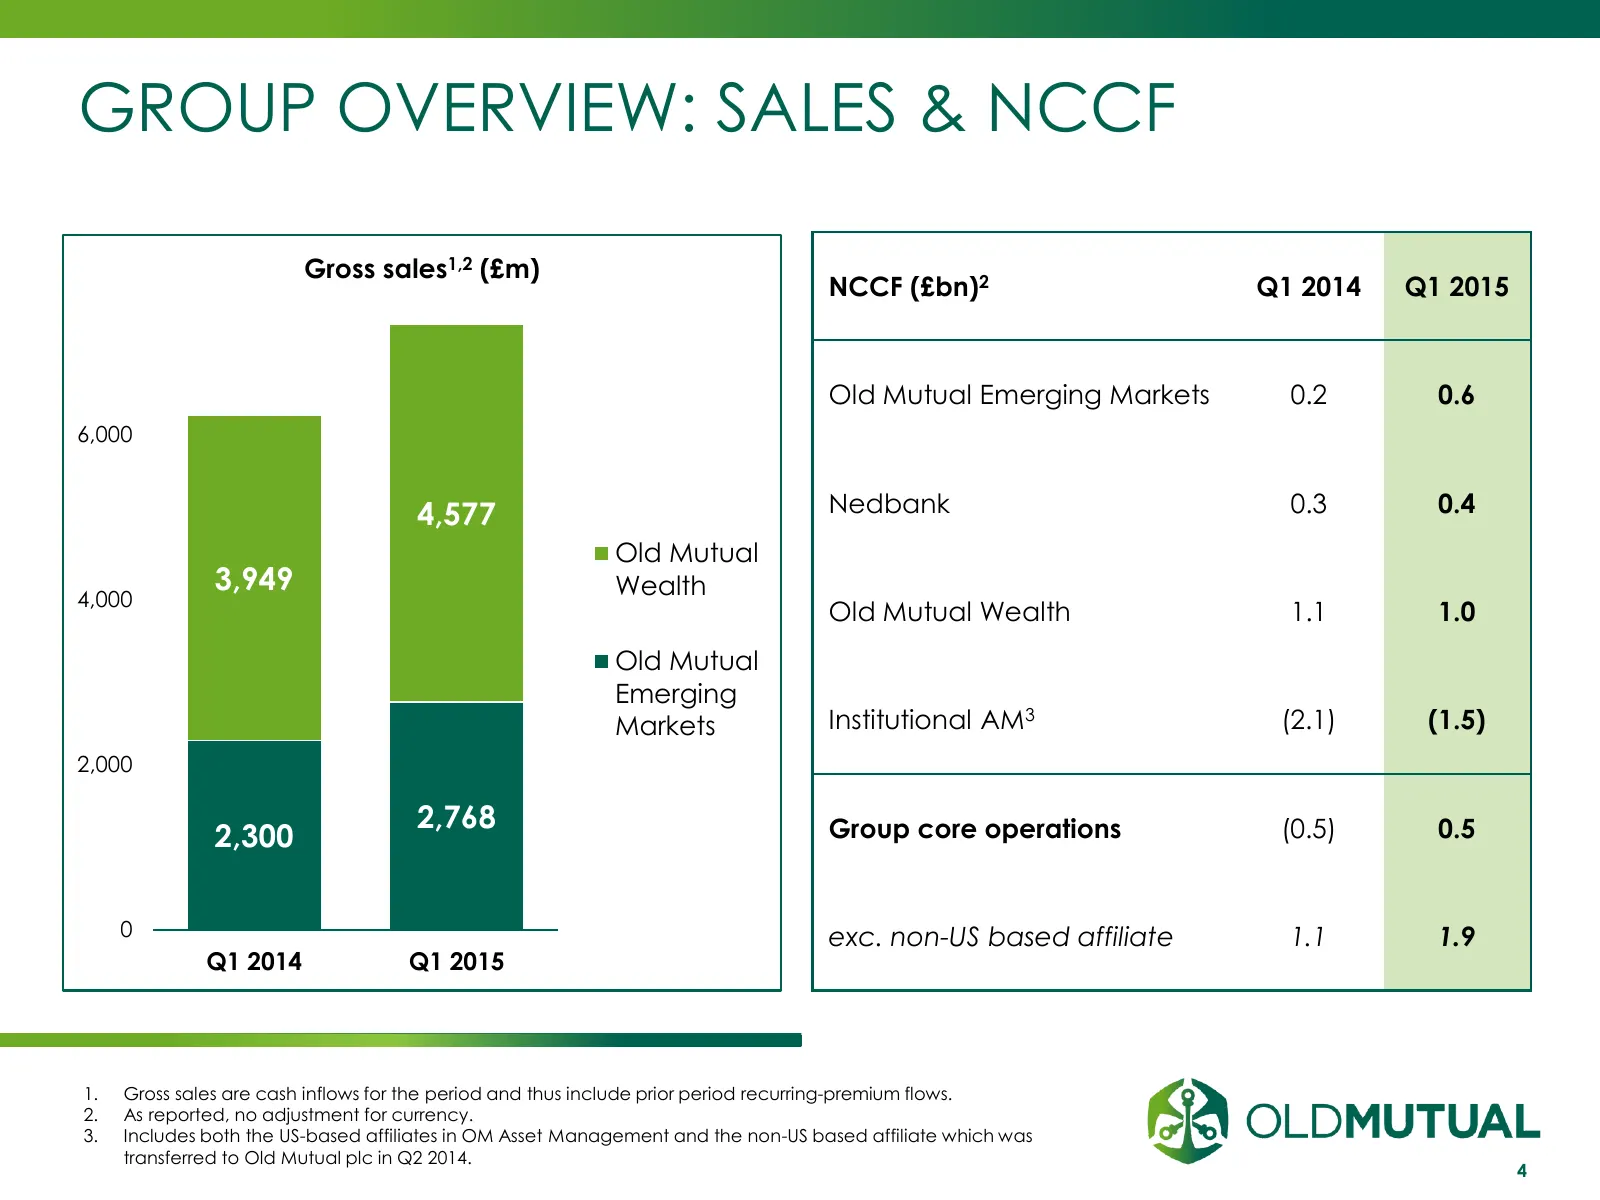
GROUP OVERVIEW: SALES & NCCF Gross sales1,2 (£m) NCCF (£bn)2 Q1 2014 Q1 2015 Old Mutual Emerging Markets 0.2 0.6 6,000 4,577 Nedbank 0.3 0.4 Old Mutual 3,949 Wealth 4,000 Old Mutual Wealth 1.1 1.0 Old Mutual Emerging Markets Institutional AM3 (2.1) (1.5) 2,000 2,768 Group core operations (0.5) 0.5 2
Slide 5: Group Overview: FuM
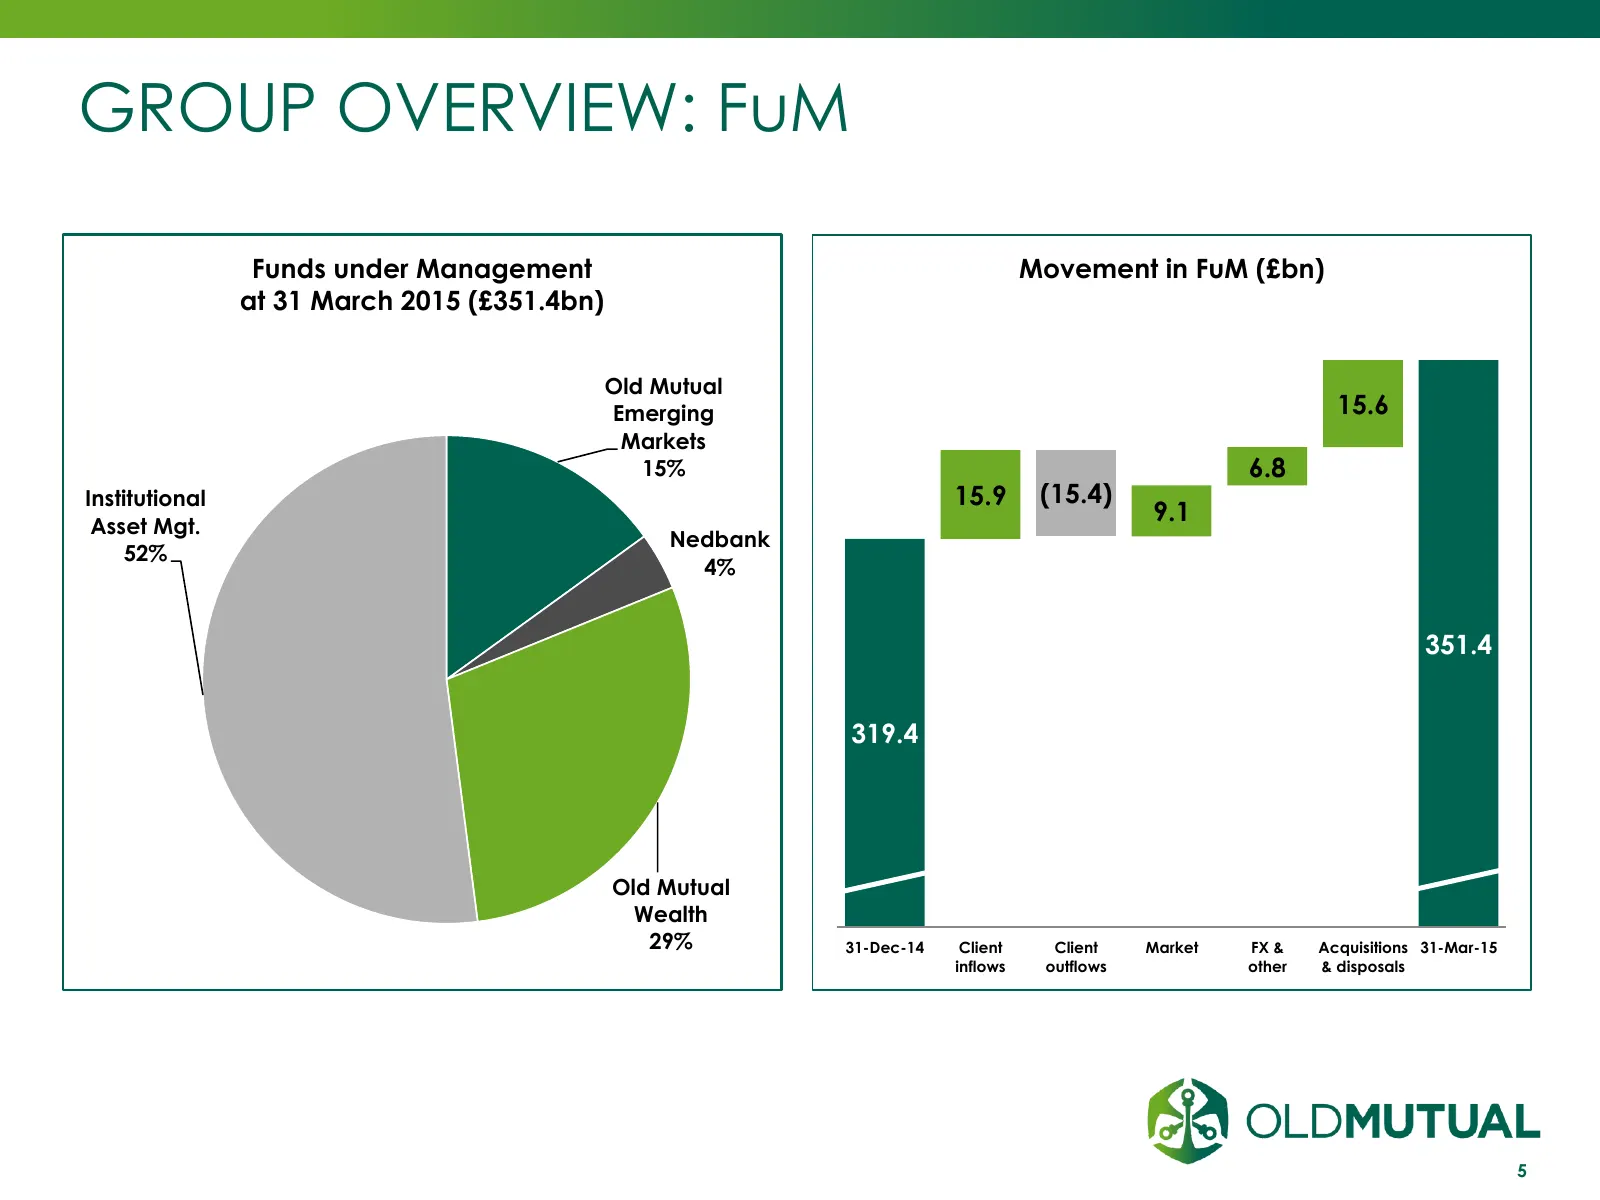
GROUP OVERVIEW: FuM Funds under Management Movement in FuM (£bn) at 31 March 2015 (£351.4bn) Old Mutual Emerging 15.6 Markets 15% 6.8 Institutional 15.9 (15.4) Asset Mgt. 9.1 Nedbank 52% 4% 351.4 319.4 Old Mutual Wealth 29% 31-Dec-14 Client Client Market FX & Acquisitions 31-Mar-15 inflows outflows
Slide 6: Old Mutual Emerging Markets
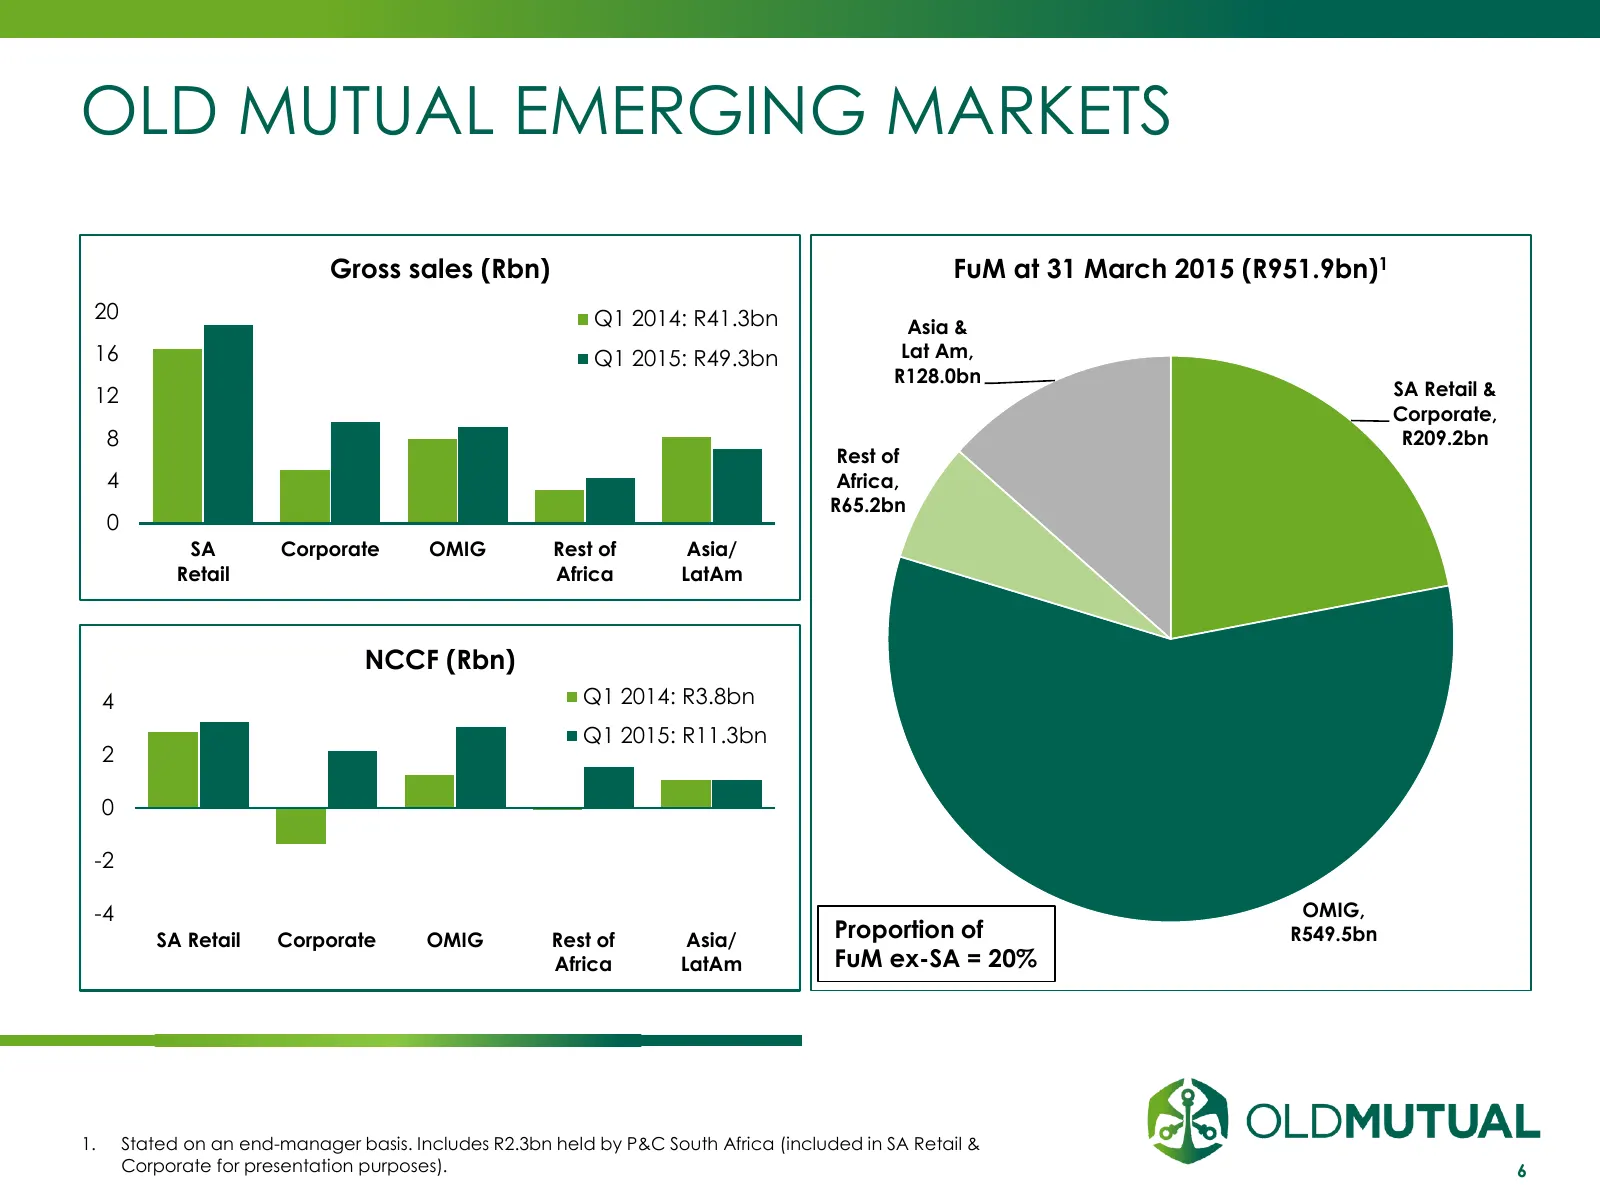
OLD MUTUAL EMERGING MARKETS Gross sales (Rbn) FuM at 31 March 2015 (R951.9bn)1 20 Q1 2014: R41.3bn Asia & 16 Q1 2015: R49.3bn Lat Am, R128.0bn 12 SA Retail & Corporate, 8 R209.2bn Rest of 4 Africa, R65.2bn 0 SA Corporate OMIG Rest of Asia/ Retail Africa LatAm NCCF (Rbn) 4 Q1 2014: R3.8bn Q1 2015: R1
Slide 7: Old Mutual Emerging Markets
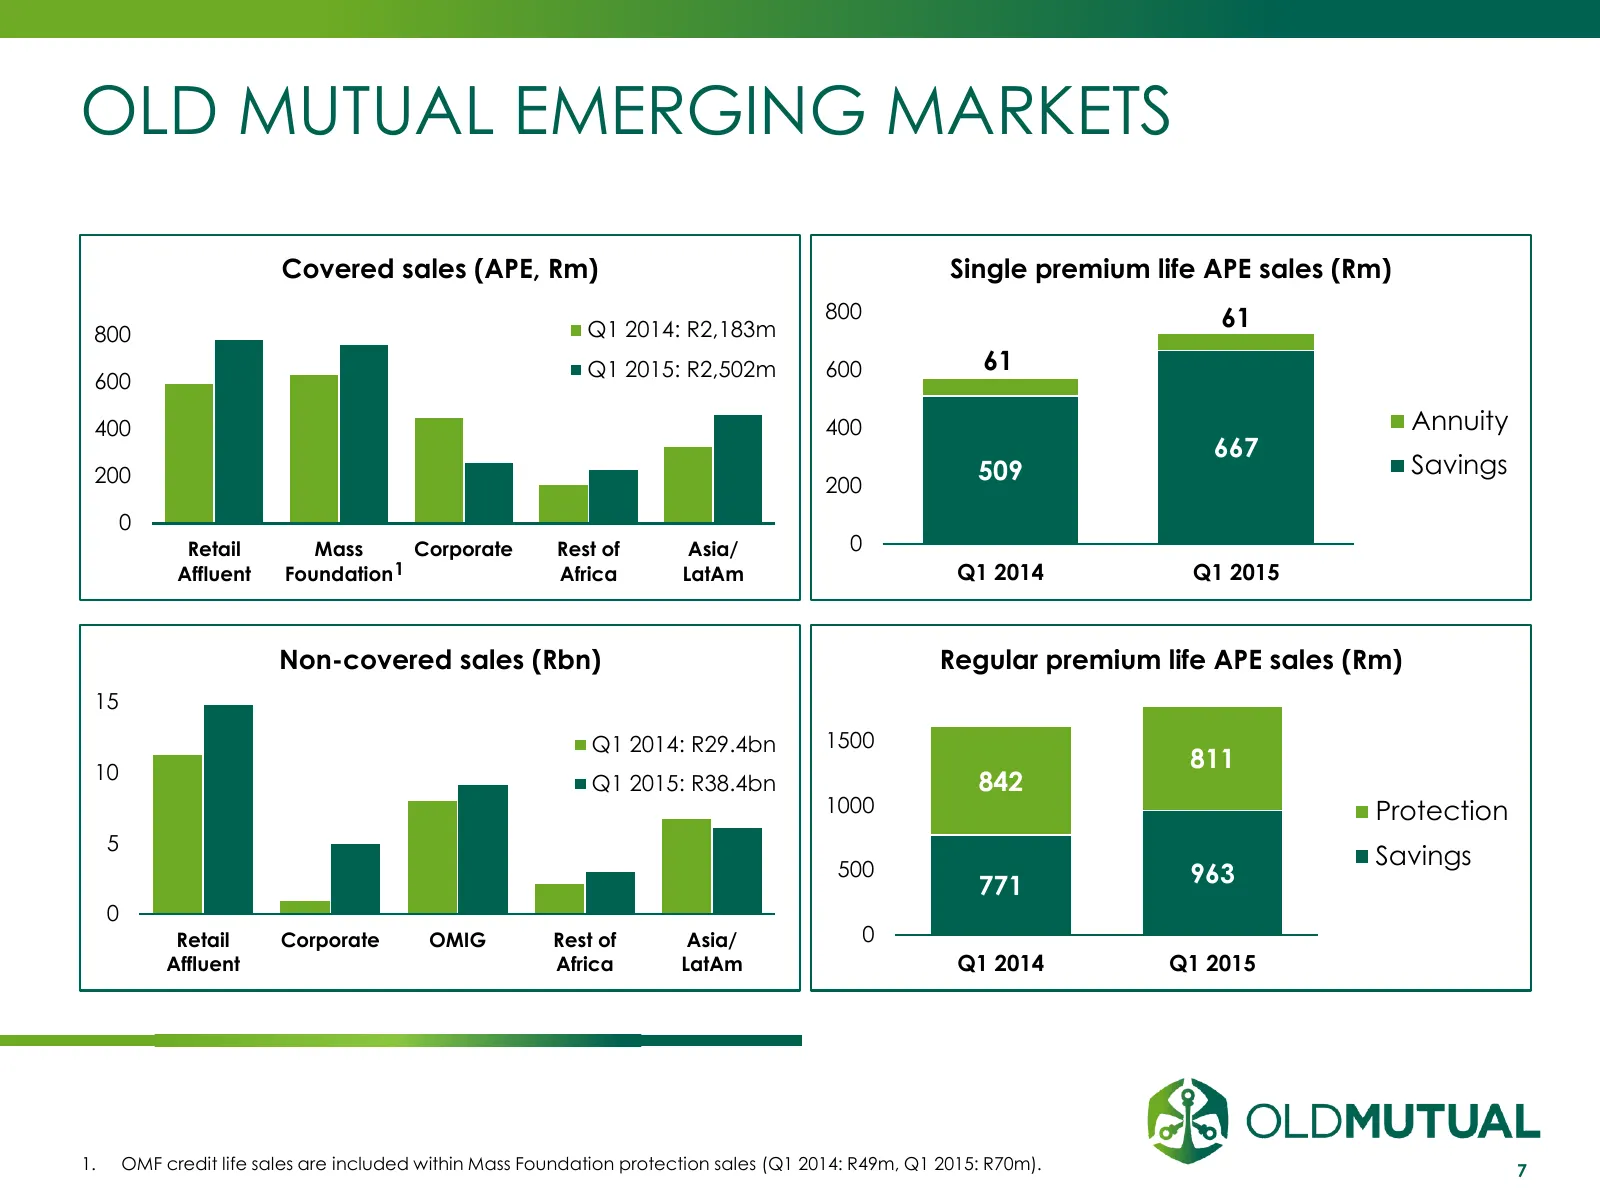
OLD MUTUAL EMERGING MARKETS Covered sales (APE, Rm) Single premium life APE sales (Rm) 800 61 800 Q1 2014: R2,183m Q1 2015: R2,502m 600 61 600 400 400 Annuity 667 200 509 Savings 200 0 Retail Mass Corporate Rest of Asia/ 0 Affluent Foundation 1 Africa LatAm Q1 2014 Q1 2015 Non-covered sales (Rbn) Re
Slide 8: Nedbank
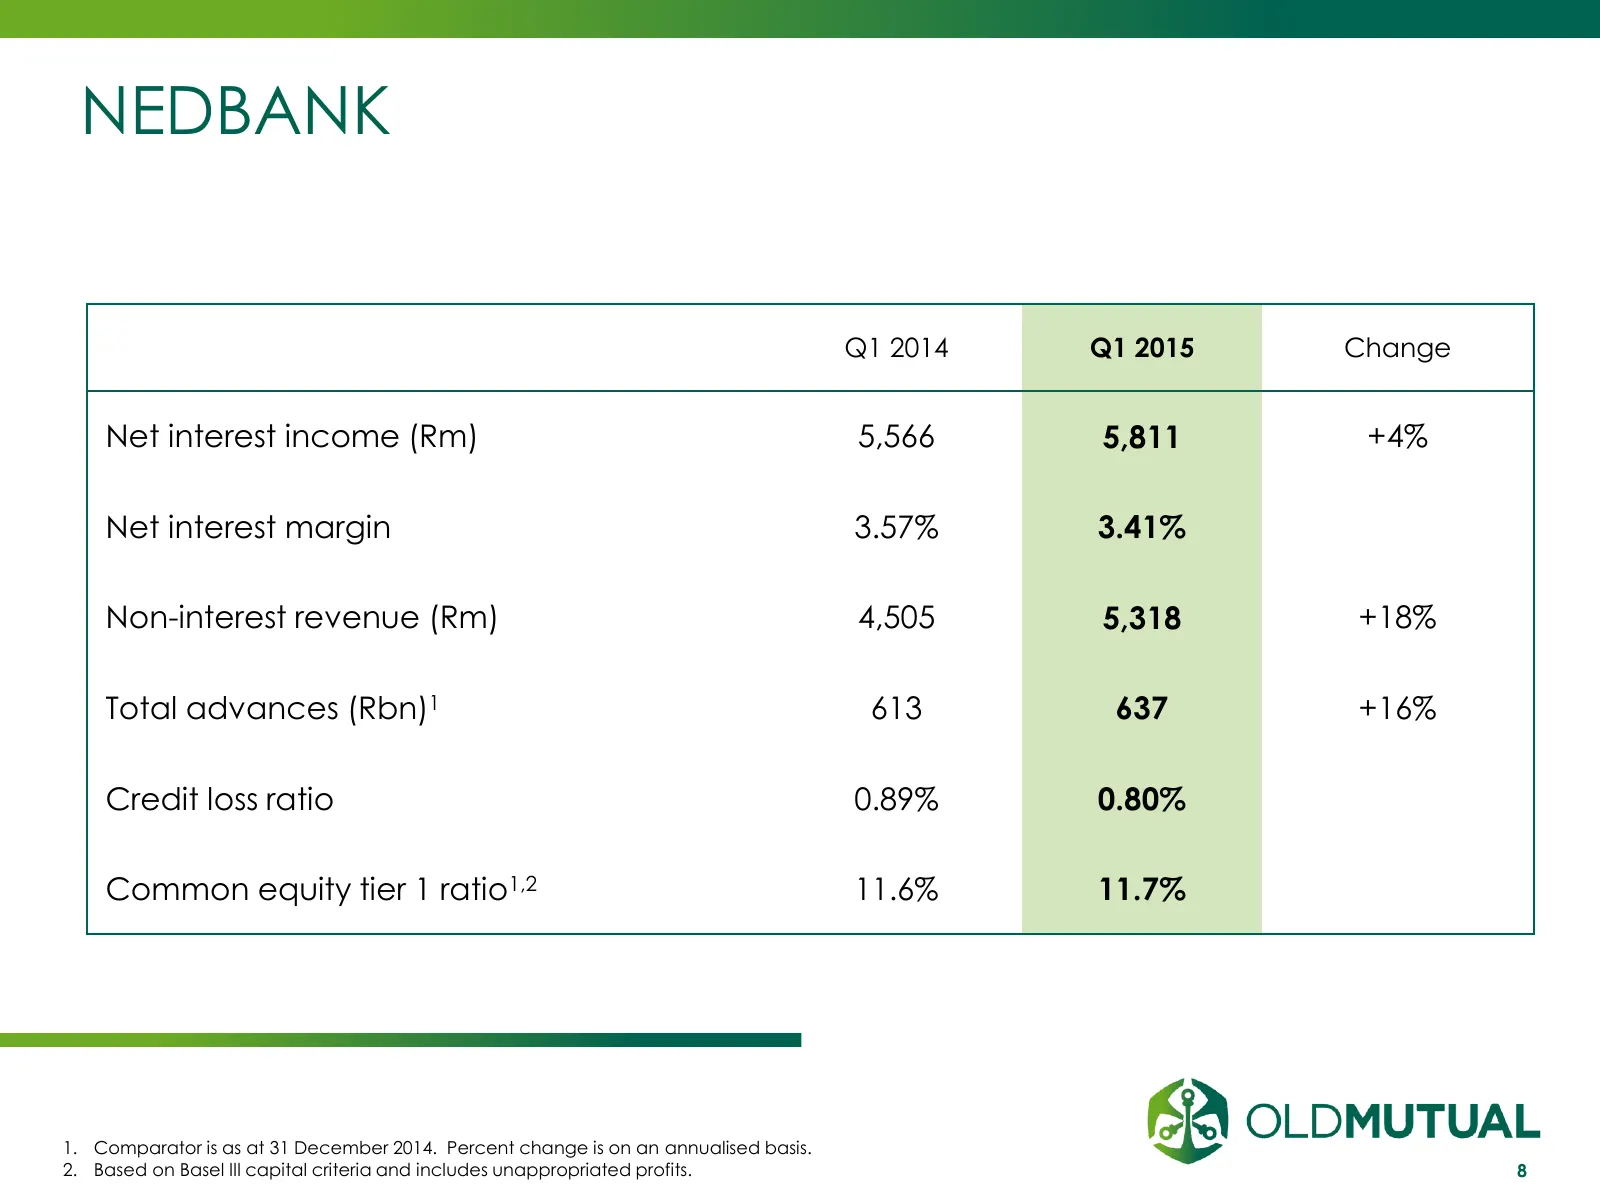
NEDBANK Q1 2014 Q1 2015 Change Net interest income (Rm) 5,566 5,811 +4% Net interest margin 3.57% 3.41% Non-interest revenue (Rm) 4,505 5,318 +18% Total advances (Rbn)1 613 637 +16% Credit loss ratio 0.89% 0.80% Common equity tier 1 ratio1,2 11.6% 11.7% 1. Comparator is as at 31 December 2014. Perce
Slide 9: Old Mutual Wealth
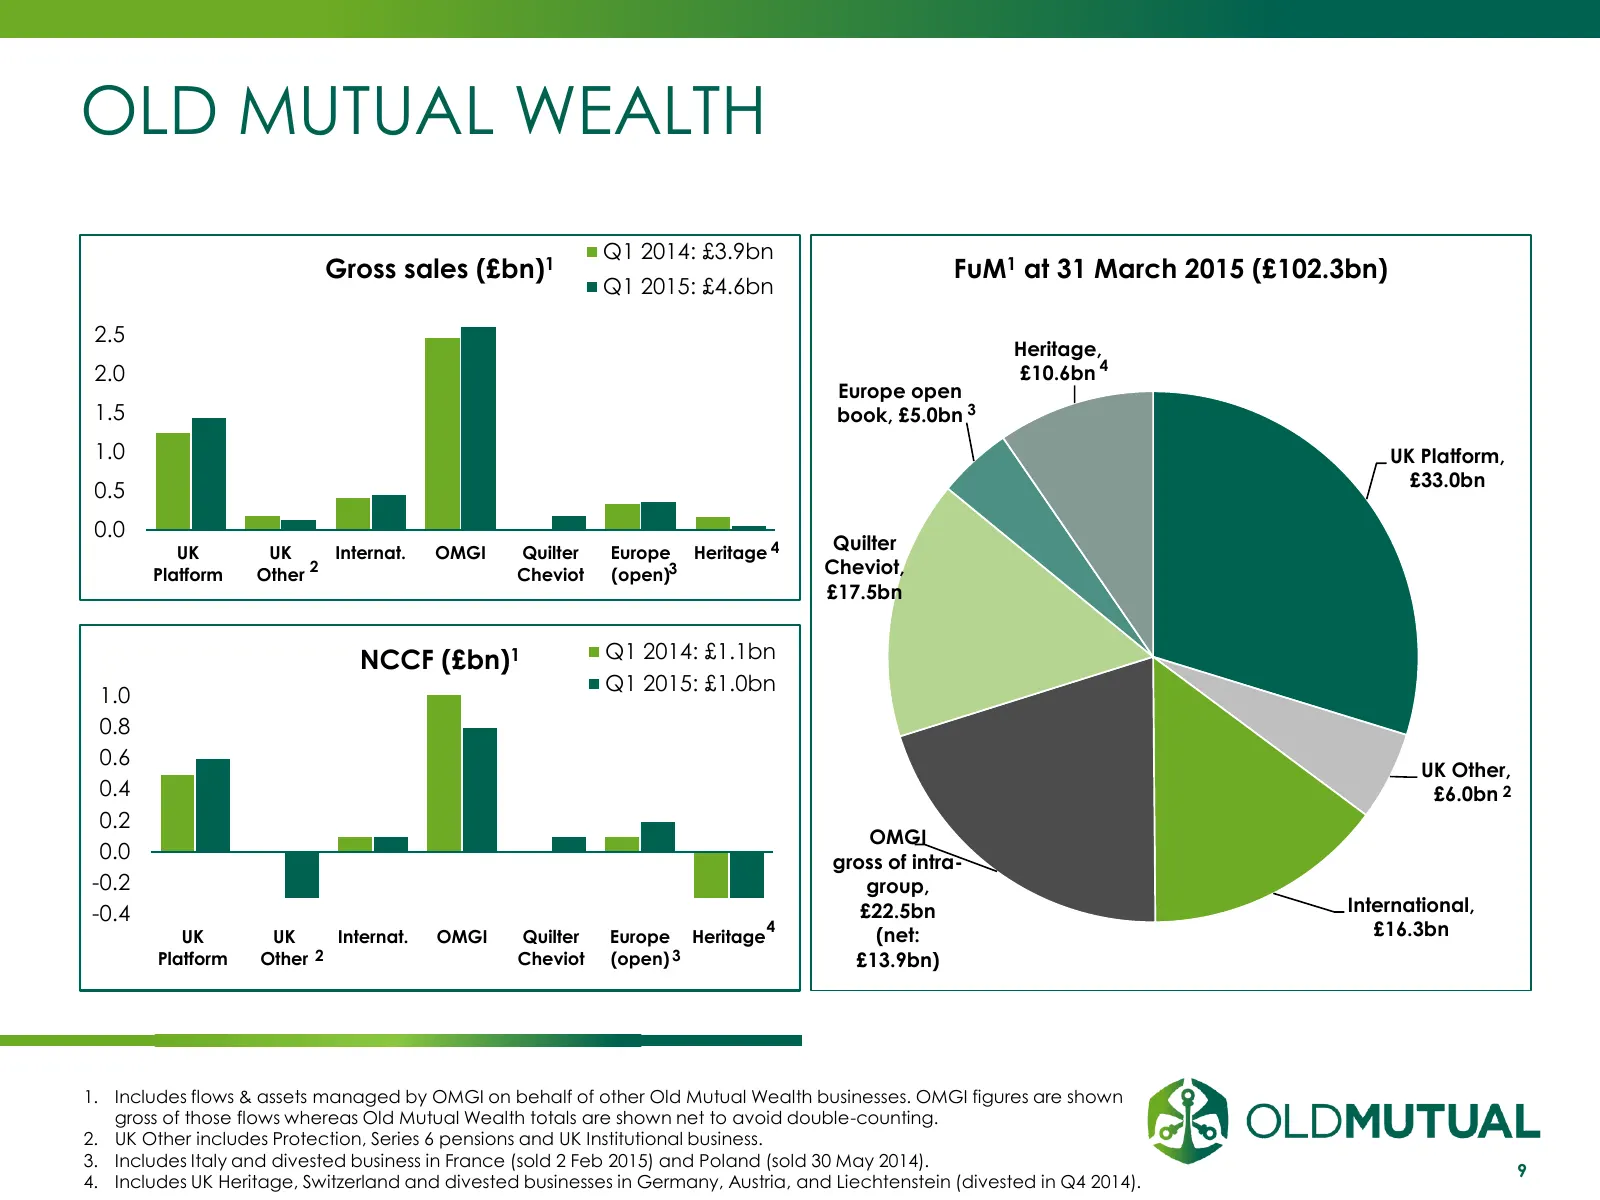
OLD MUTUAL WEALTH Q1 2014: £3.9bn Gross sales (£bn)1 FuM1 at 31 March 2015 (£102.3bn) Q1 2015: £4.6bn 2.5 Heritage, 2.0 £10.6bn 4 Europe open 1.5 book, £5.0bn 3 1.0 UK Platform, £33.0bn 0.5 0.0 UK UK Internat. OMGI Quilter Europe Heritage 4 Quilter Platform Other 2 Cheviot (open)3 Cheviot, £17.5bn N
Slide 10: Institutional Asset Management
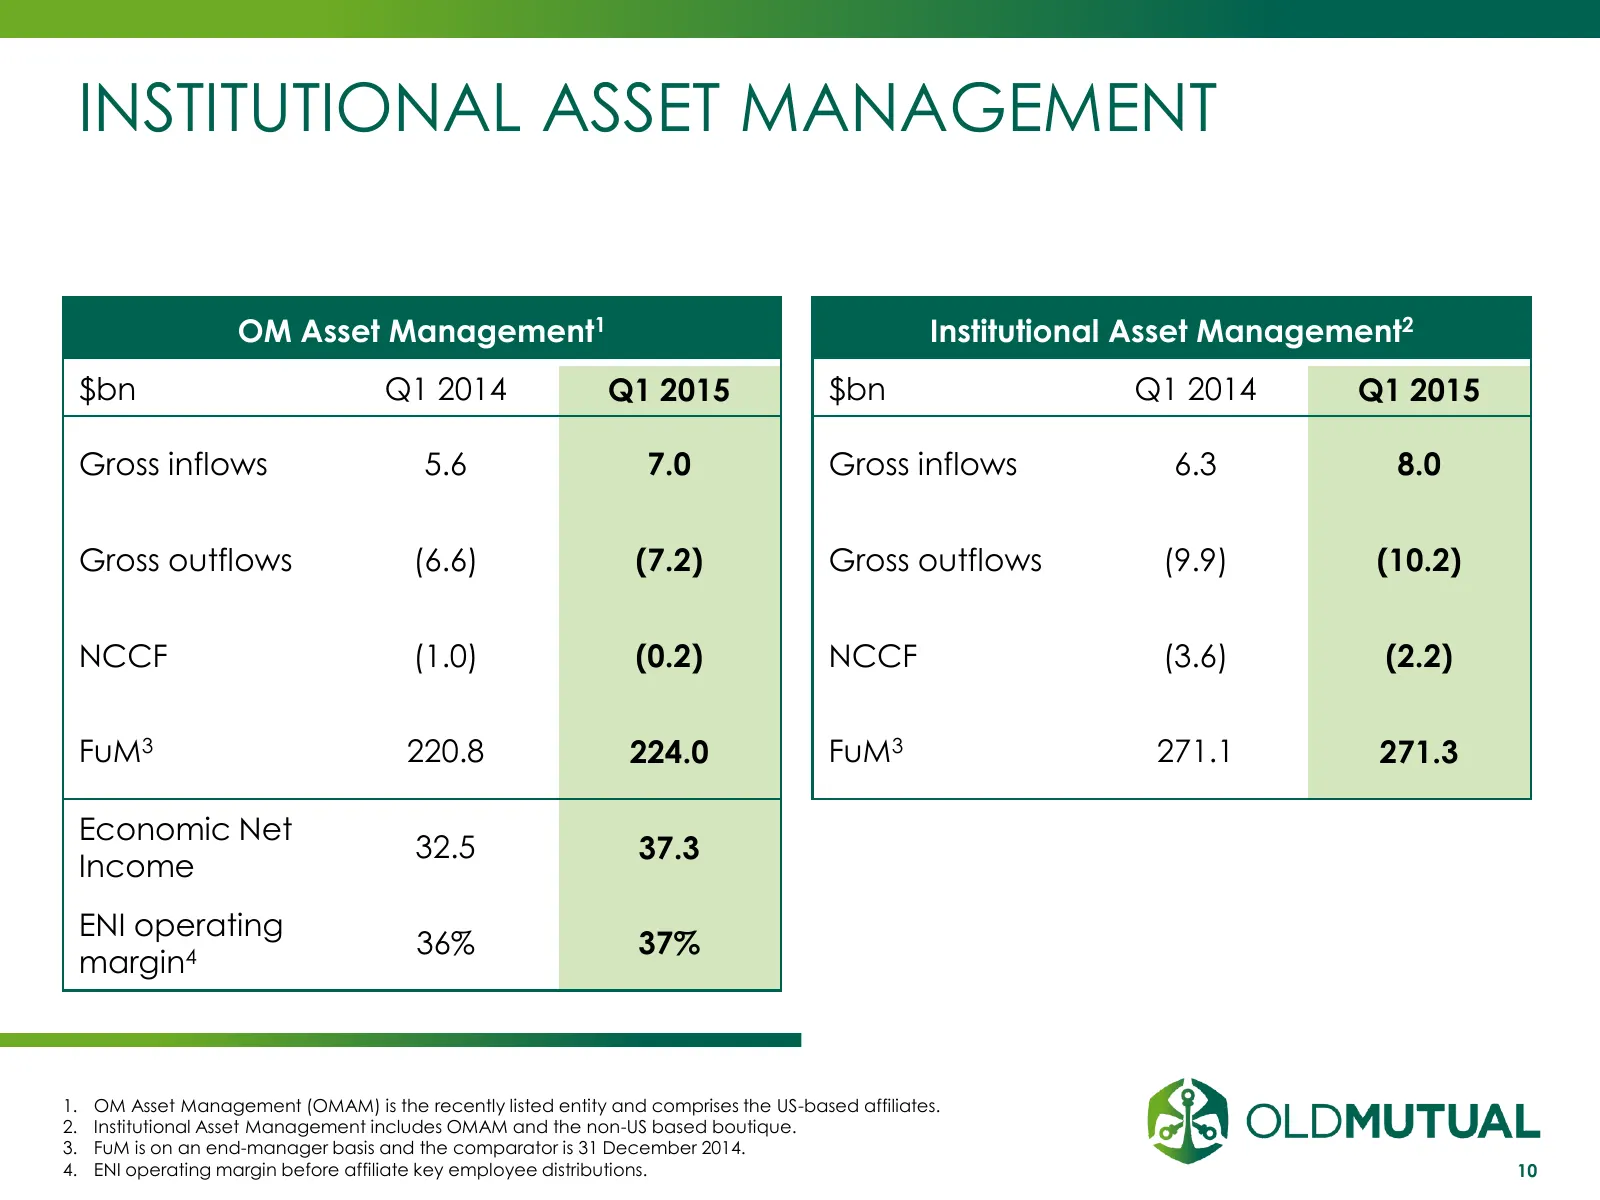
INSTITUTIONAL ASSET MANAGEMENT OM Asset Management1 Institutional Asset Management2 $bn Q1 2014 Q1 2015 $bn Q1 2014 Q1 2015 Gross inflows 5.6 7.0 Gross inflows 6.3 8.0 Gross outflows (6.6) (7.2) Gross outflows (9.9) (10.2) NCCF (1.0) (0.2) NCCF (3.6) (2.2) FuM3 220.8 224.0 FuM3 271.1 271.3 Economic
Slide 11: Our Strategy for Growth
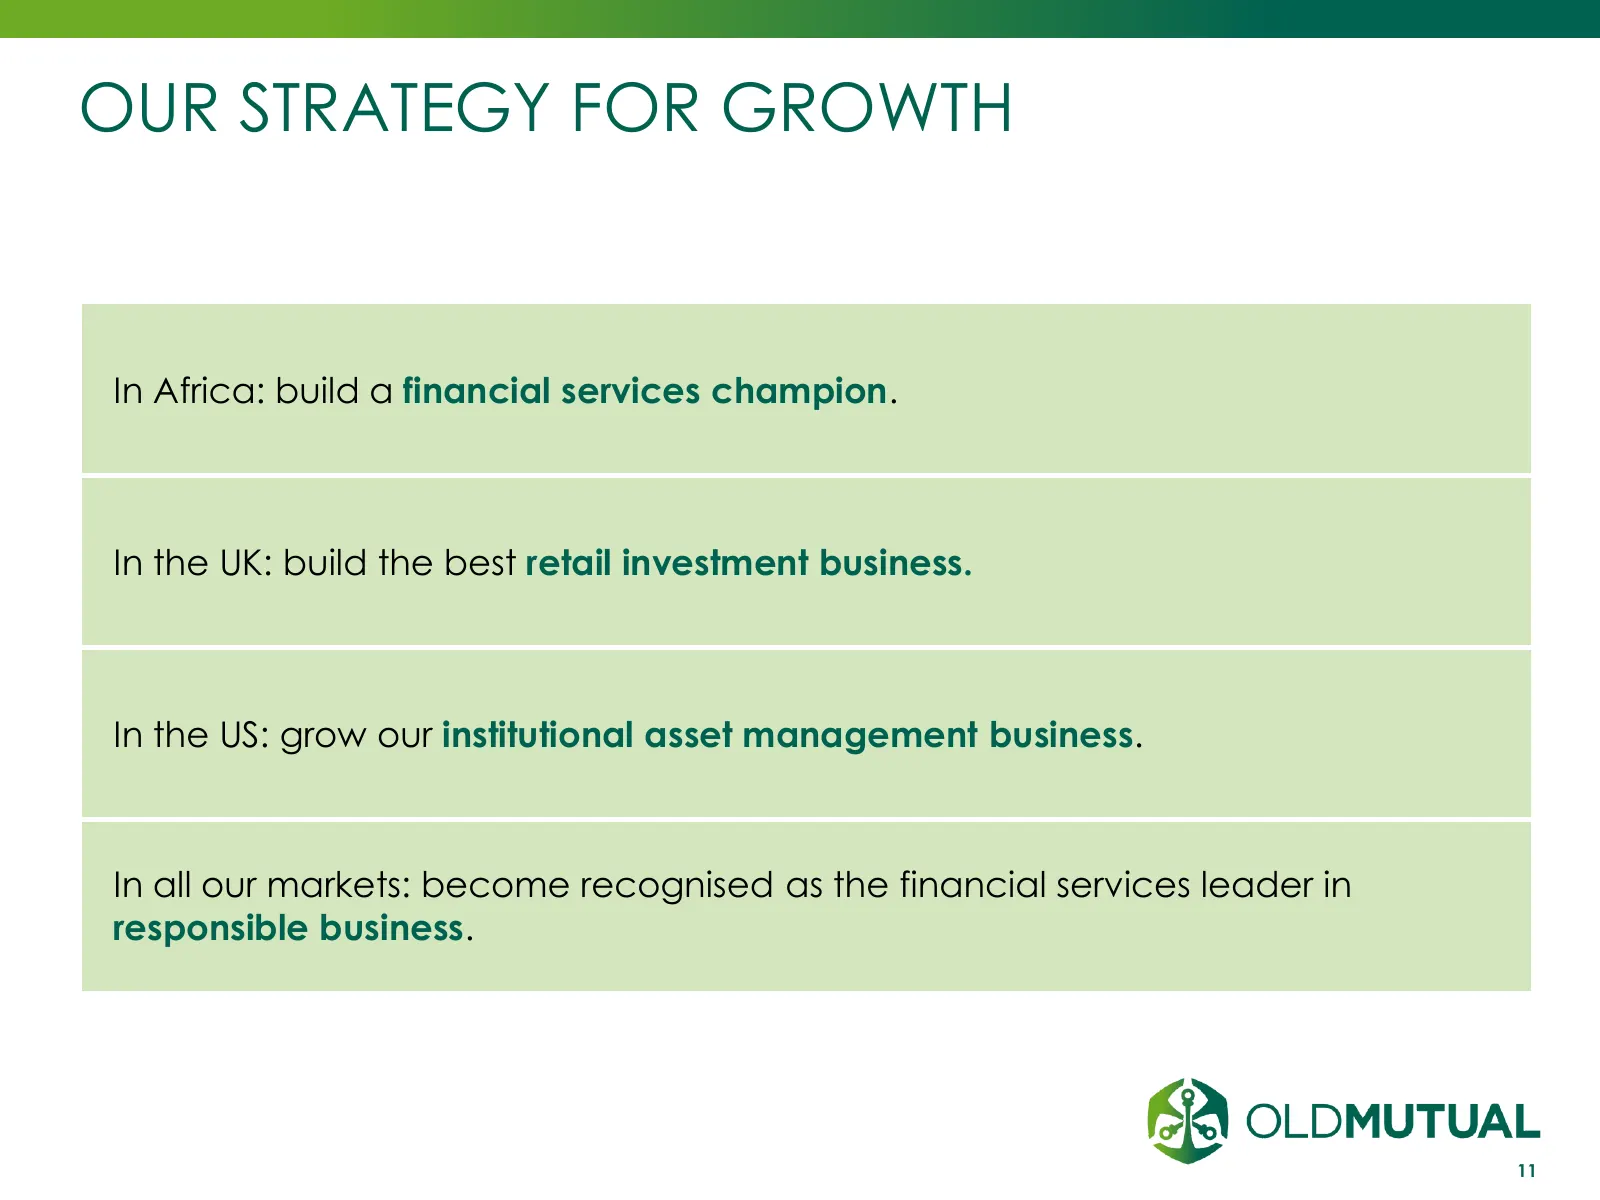
OUR STRATEGY FOR GROWTH In Africa: build a financial services champion. In the UK: build the best retail investment business. In the US: grow our institutional asset management business. In all our markets: become recognised as the financial services leader in responsible business. 11

Slide 12: Appendix
APPENDIX INVESTMENT | SAVINGS | INSURANCE | BANKING
Slide 13: Macro Environment
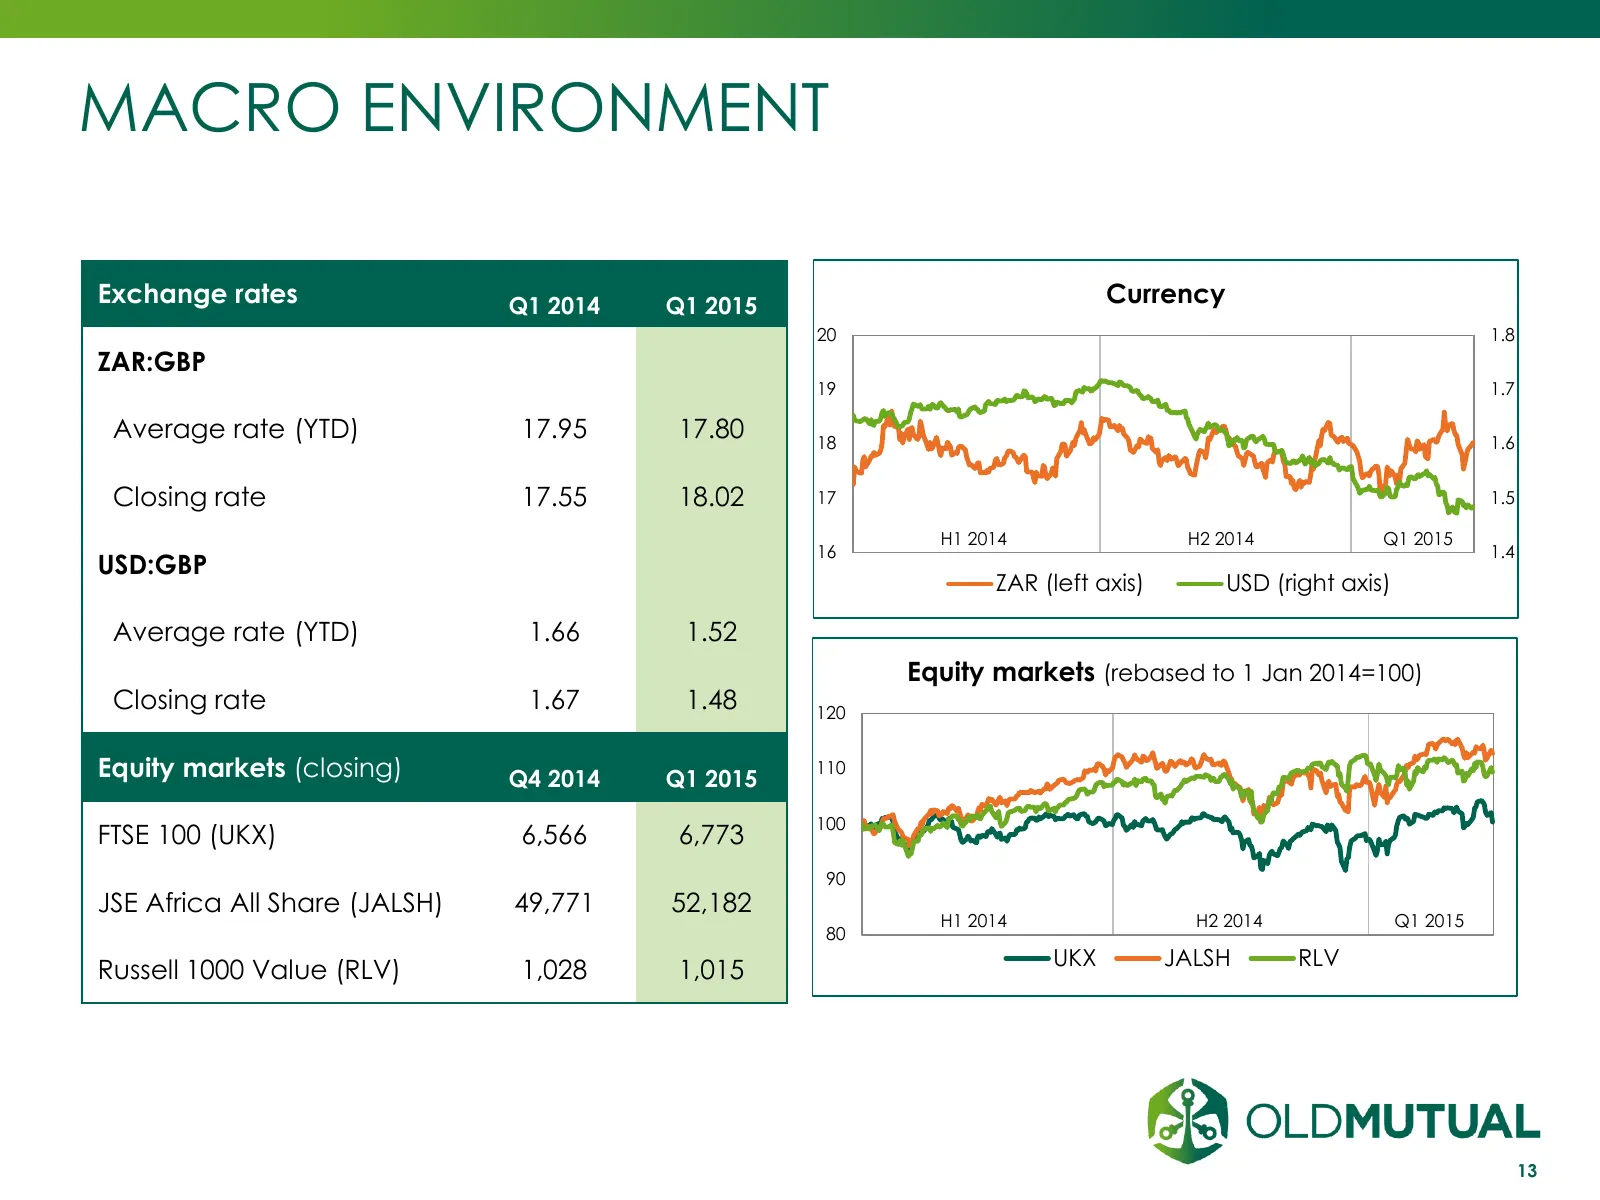
MACRO ENVIRONMENT Exchange rates Q1 2014 Q1 2015 Currency 20 1.8 ZAR:GBP 19 1.7 Average rate (YTD) 17.95 17.80 18 1.6 Closing rate 17.55 18.02 17 1.5 H1 2014 H2 2014 Q1 2015 16 1.4 USD:GBP ZAR (left axis) USD (right axis) Average rate (YTD) 1.66 1.52 Equity markets (rebased to 1 Jan 2014=100) Closin
Slide 14: Old Mutual Emerging Markets
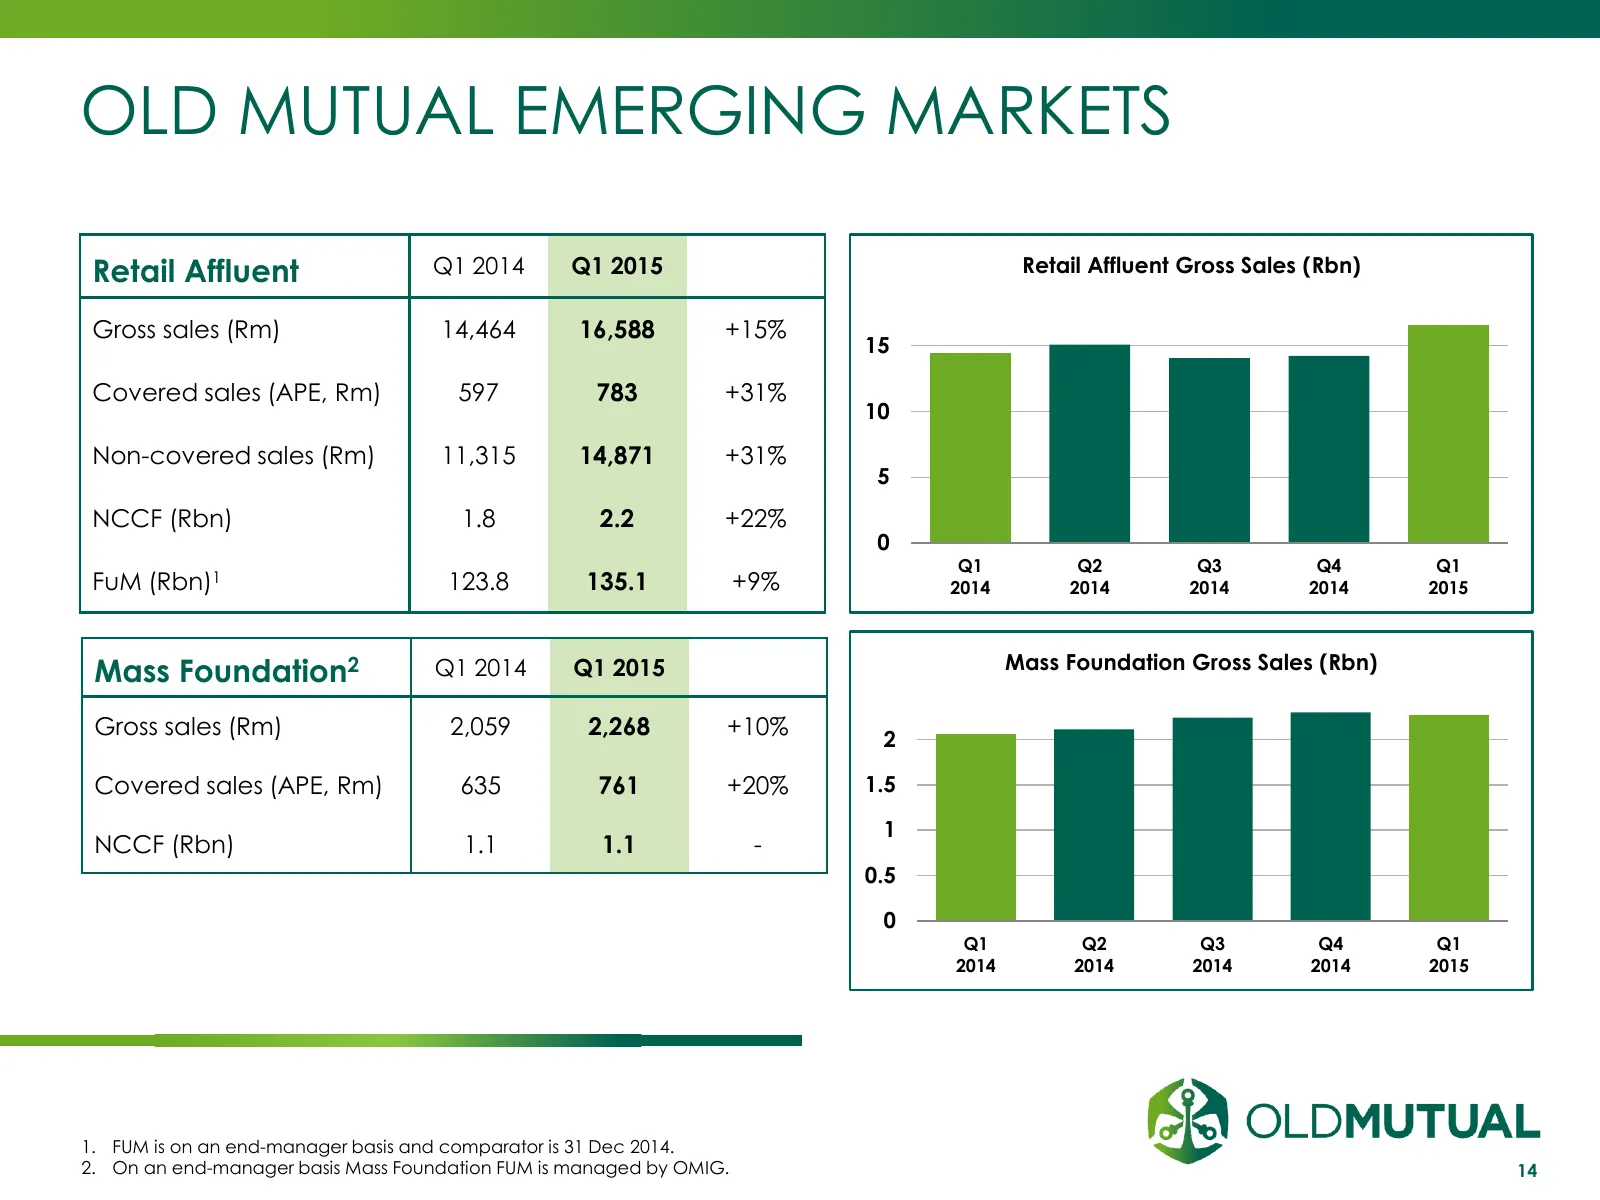
OLD MUTUAL EMERGING MARKETS Retail Affluent Q1 2014 Q1 2015 Retail Affluent Gross Sales (Rbn) Gross sales (Rm) 14,464 16,588 +15% 15 Covered sales (APE, Rm) 597 783 +31% 10 Non-covered sales (Rm) 11,315 14,871 +31% 5 NCCF (Rbn) 1.8 2.2 +22% 0 Q1 Q2 Q3 Q4 Q1 FuM (Rbn)1 123.8 135.1 +9% 2014 2014 2014
Slide 15: Old Mutual Emerging Markets
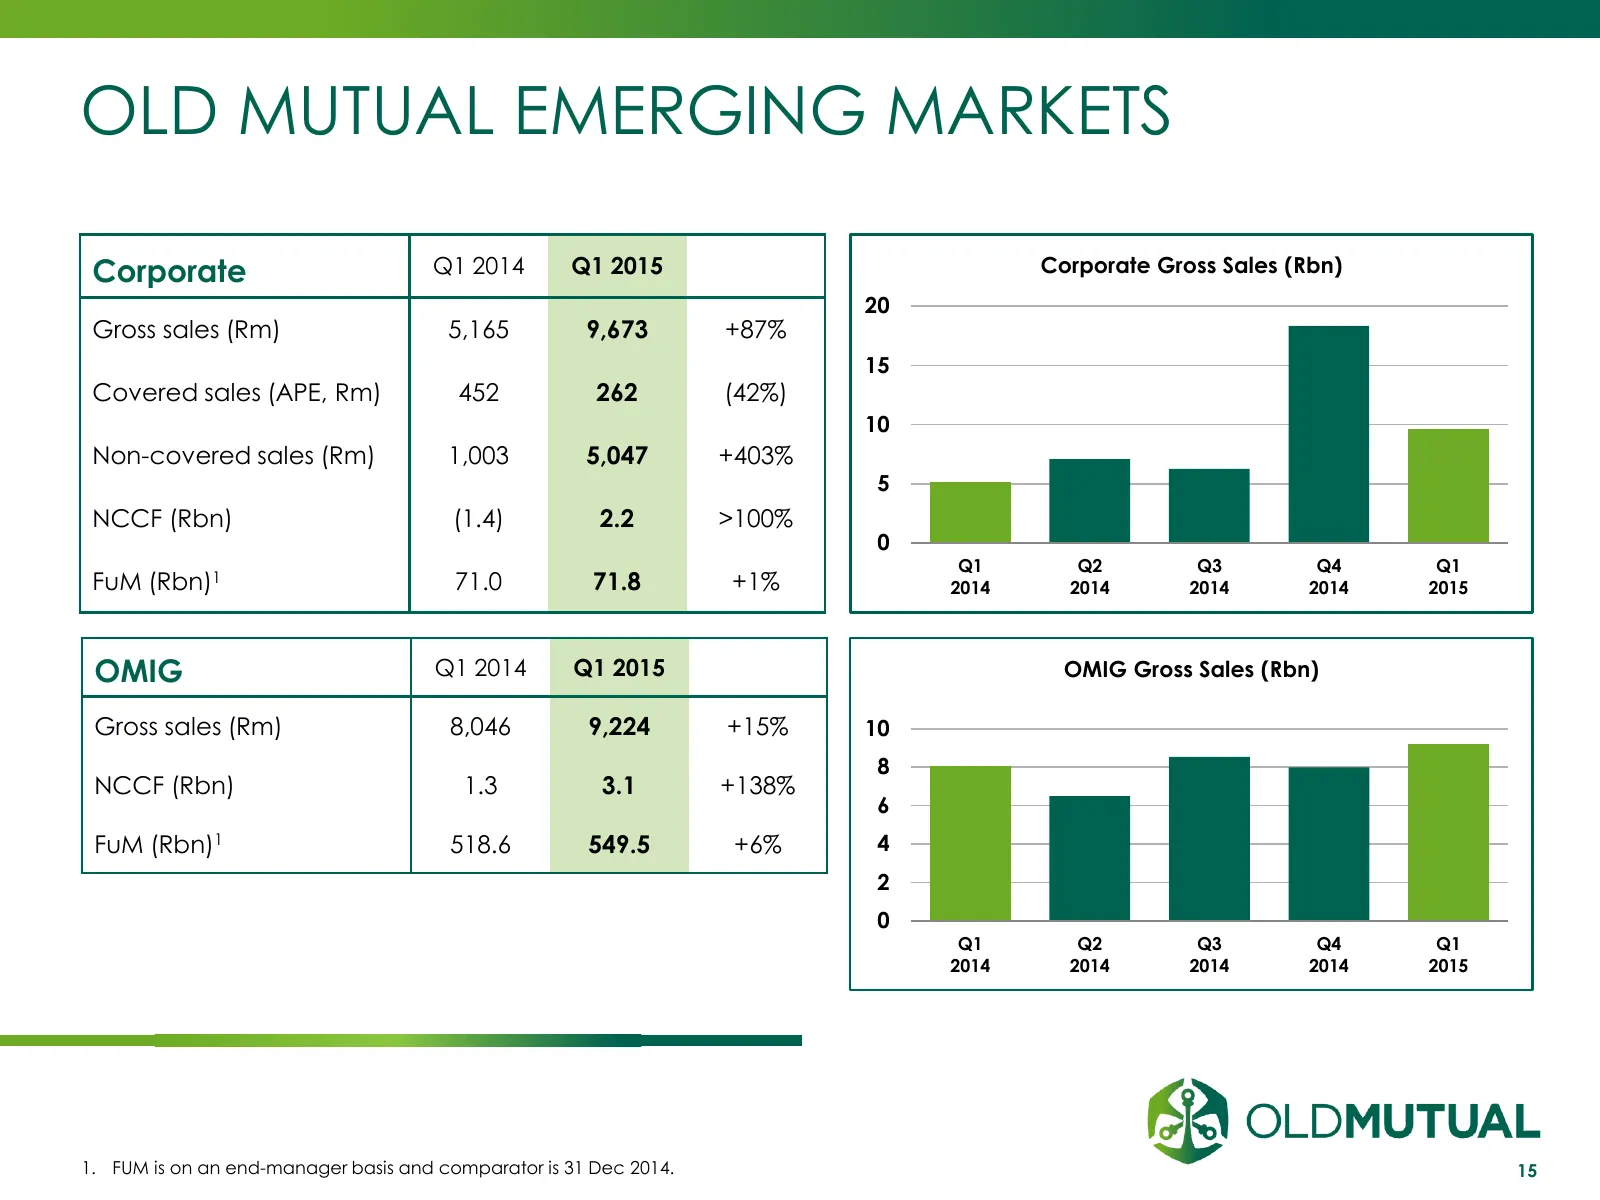
OLD MUTUAL EMERGING MARKETS Corporate Q1 2014 Q1 2015 Corporate Gross Sales (Rbn) 20 Gross sales (Rm) 5,165 9,673 +87% 15 Covered sales (APE, Rm) 452 262 (42%) 10 Non-covered sales (Rm) 1,003 5,047 +403% 5 NCCF (Rbn) (1.4) 2.2 >100% 0 Q1 Q2 Q3 Q4 Q1 FuM (Rbn)1 71.0 71.8 +1% 2014 2014 2014 2014 2015
Slide 16: Old Mutual Emerging Markets
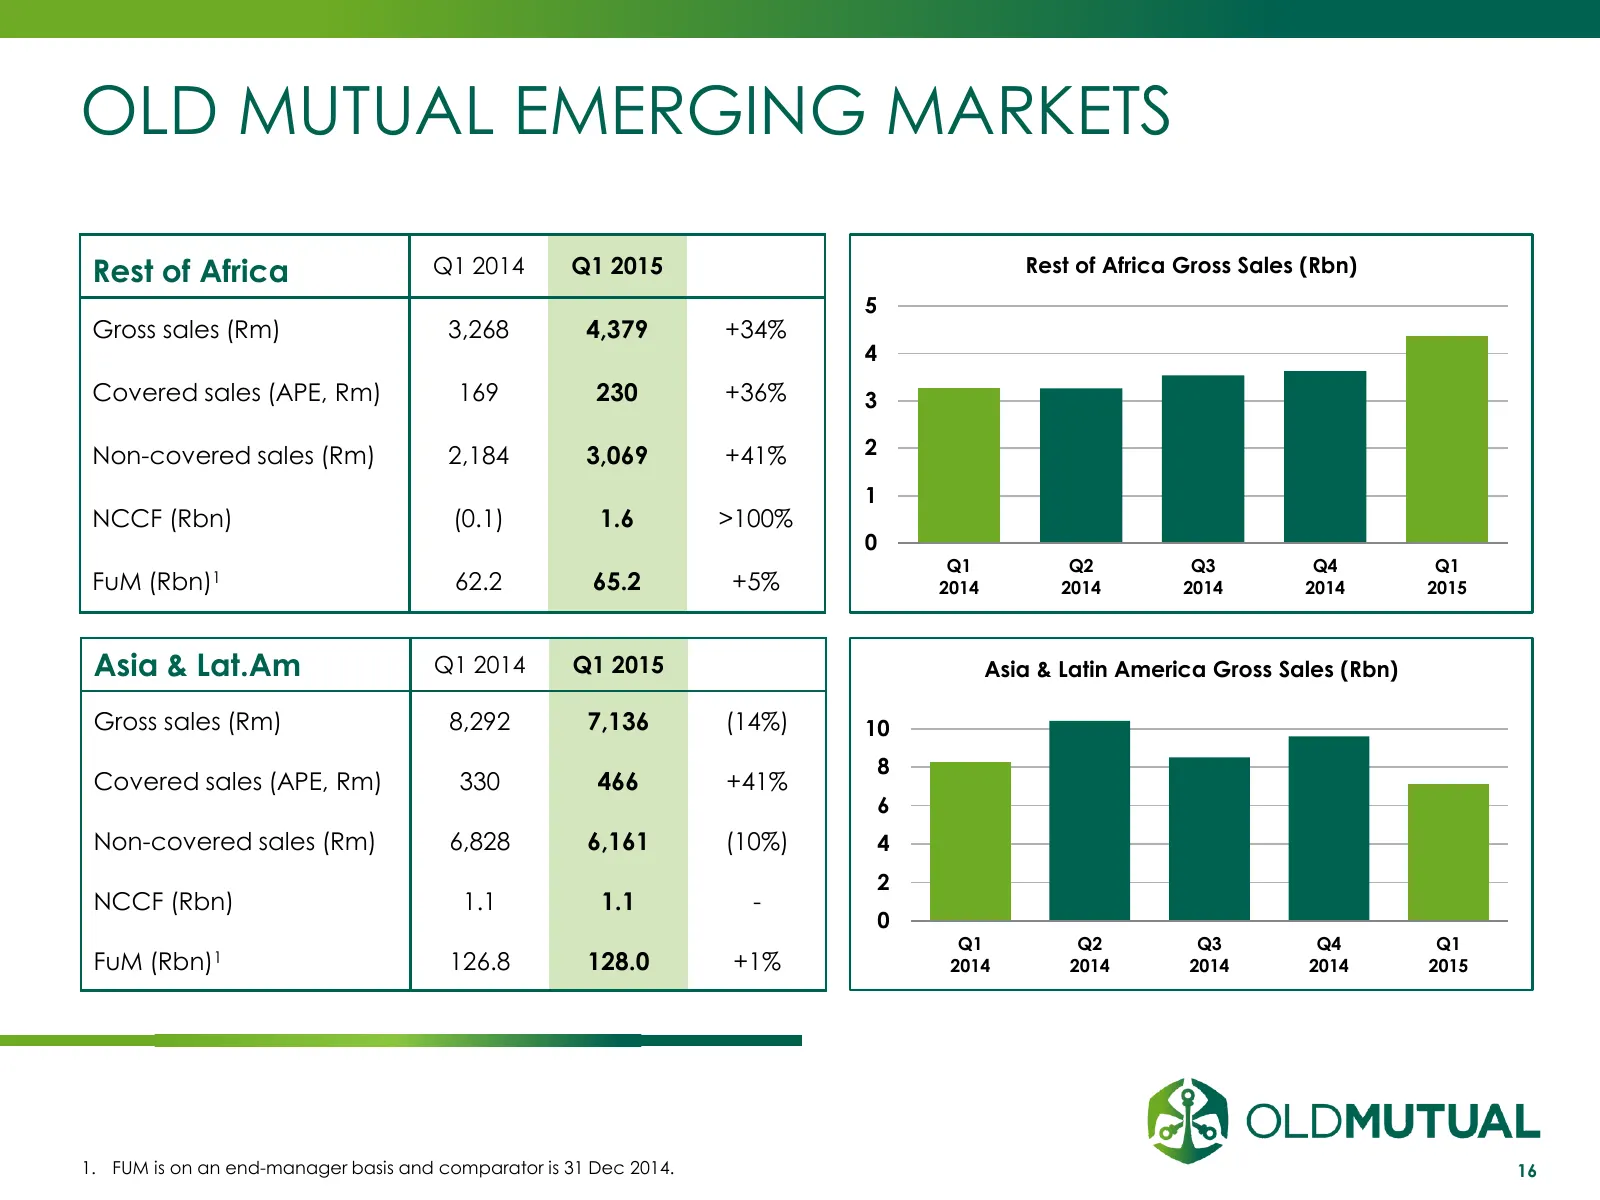
OLD MUTUAL EMERGING MARKETS Rest of Africa Q1 2014 Q1 2015 Rest of Africa Gross Sales (Rbn) 5 Gross sales (Rm) 3,268 4,379 +34% 4 Covered sales (APE, Rm) 169 230 +36% 3 Non-covered sales (Rm) 2,184 3,069 +41% 2 1 NCCF (Rbn) (0.1) 1.6 >100% 0 Q1 Q2 Q3 Q4 Q1 FuM (Rbn)1 62.2 65.2 +5% 2014 2014 2014 201
Slide 17: Old Mutual Wealth
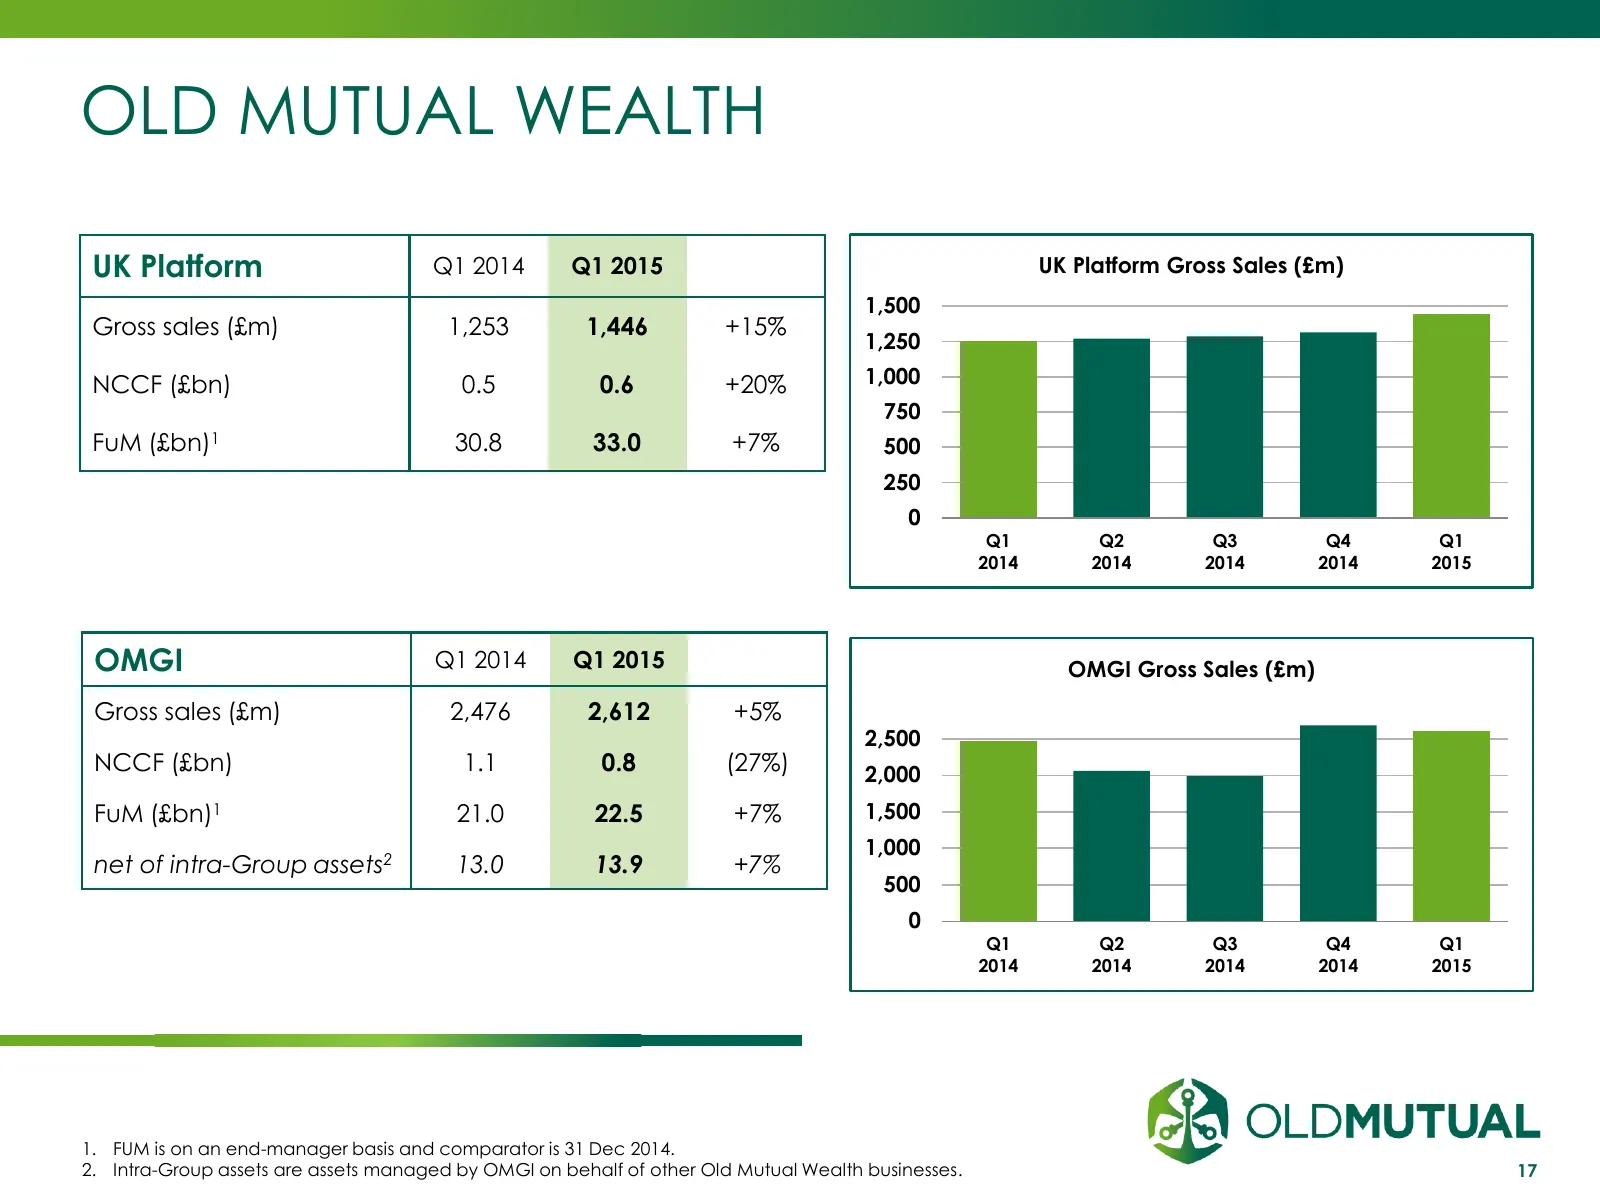
OLD MUTUAL WEALTH UK Platform Q1 2014 Q1 2015 UK Platform Gross Sales (£m) 1,500 Gross sales (£m) 1,253 1,446 +15% 1,250 NCCF (£bn) 0.5 0.6 +20% 1,000 750 FuM (£bn)1 30.8 33.0 +7% 500 250 0 Q1 Q2 Q3 Q4 Q1 2014 2014 2014 2014 2015 OMGI Q1 2014 Q1 2015 OMGI Gross Sales (£m) Gross sales (£m) 2,476 2,61
Slide 18: Old Mutual Wealth
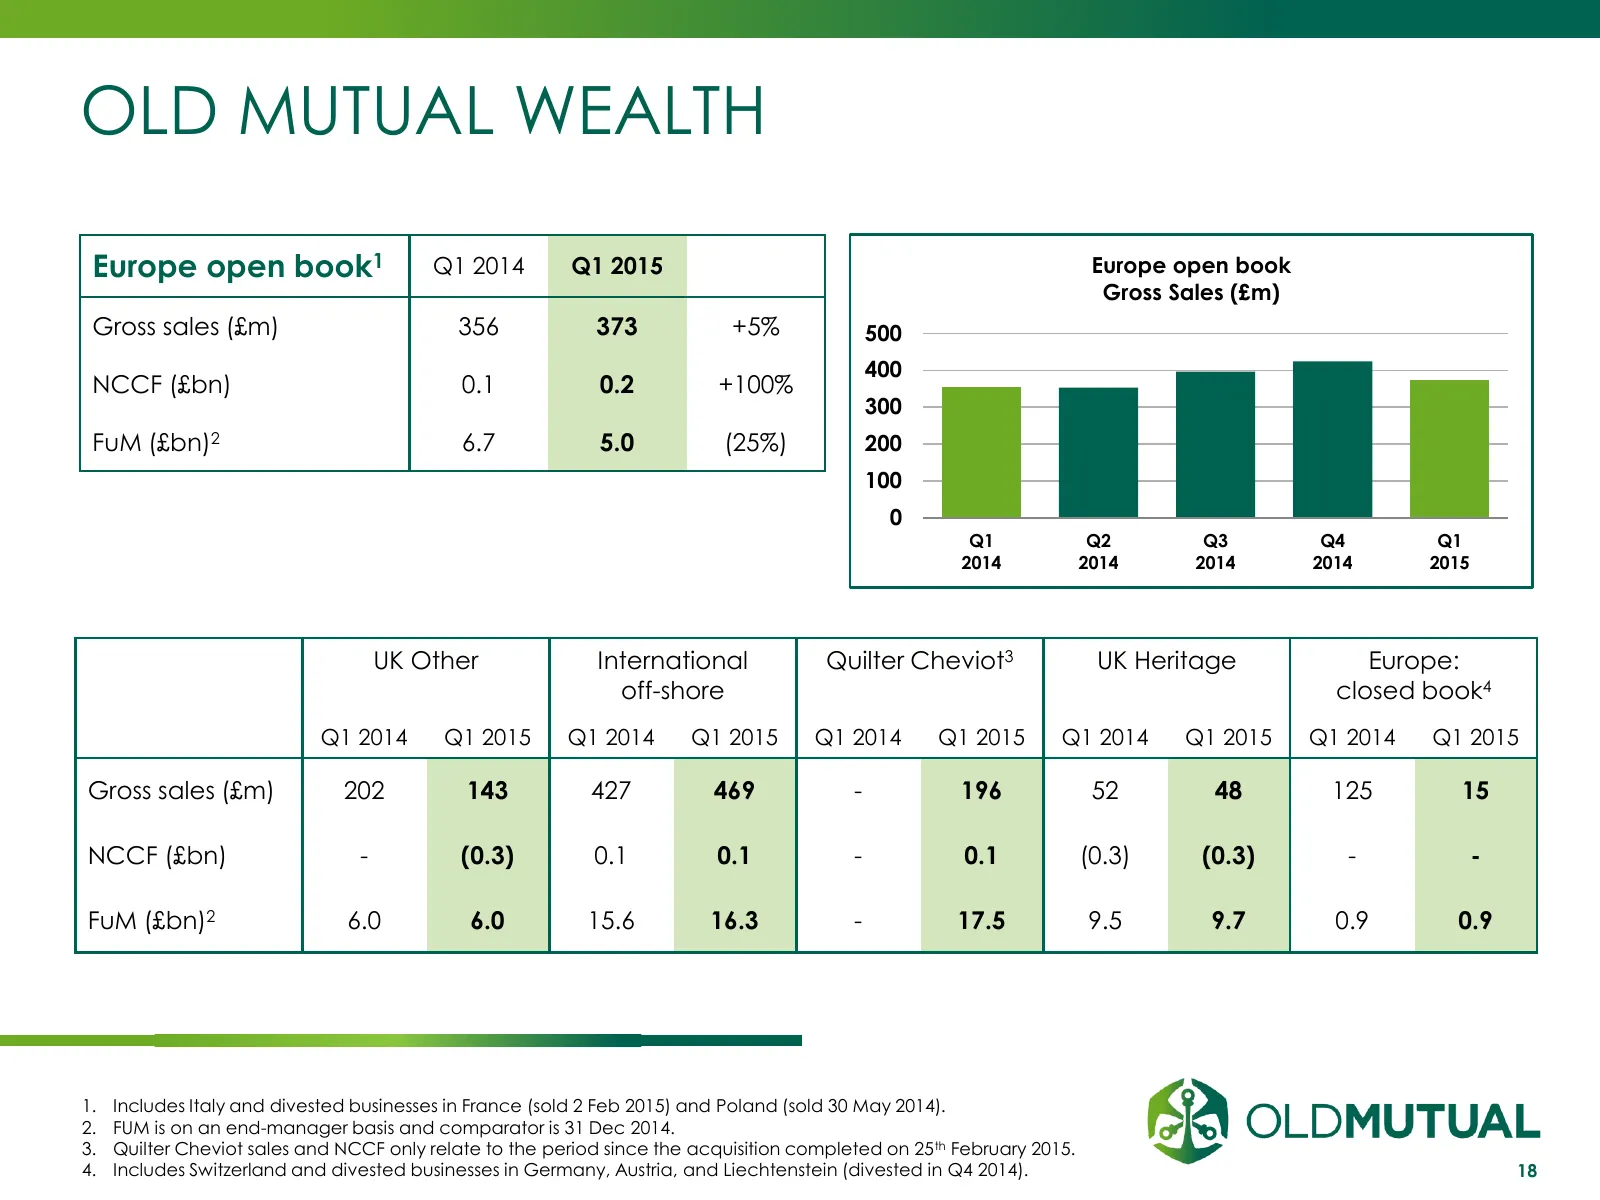
OLD MUTUAL WEALTH Europe open book1 Q1 2014 Q1 2015 Europe open book Gross Sales (£m) Gross sales (£m) 356 373 +5% 500 400 NCCF (£bn) 0.1 0.2 +100% 300 FuM (£bn)2 6.7 5.0 (25%) 200 100 0 Q1 Q2 Q3 Q4 Q1 2014 2014 2014 2014 2015 UK Other International Quilter Cheviot3 UK Heritage Europe: off-shore clo

Slide 19: Contacts
CONTACTS For further information please visit the Old Mutual website at: www.oldmutual.com/ir The Investor Relations team can be contacted on: +44 (0)20 7002 7367 Or by email at: omg-ir@omg.co.uk 19
Source: Internet Archive copy of oldmutual.com
More decks from Old Mutual Ltd.
 FY2025 Earnings Presentation46 slides · Oct 12, 2026
 Q2 2026 Earnings Presentation48 slides · Sep 8, 2026
 H1 2025 Earnings Presentation45 slides · Sep 10, 2025
 FY2024 Earnings Presentation40 slides · Mar 18, 2025
 FY2023 Earnings Presentation39 slides · Mar 27, 2024
 H1 2024 Earnings Presentation33 slides · 2024