NTR Acquisition — SPAC Merger (November 2007)
17 slides from NTR Acquisition's SPAC merger presentation, Nov 5, 2007
Slide 1: Acquisition of Kern Oil & Refining Co.
ACQUISITION OF KERN OIL & REFINING CO. NOVEMBER 5, 2007 100 Mill Plain Road jo Danbury, CT 06811 (203) 546-3437 (212) 297-6251
Slide 2: Forward-Looking Statements
Forward-Looking Statements This presentation contains forward-looking statements about NTR Acquisition Co. (“NTR”), Kern Oil & Refining Co. (“Kern”) and their combined business after completion of NTR’s proposed acquisition of Kern, including statements relating to management's current objectives an
Slide 3: Additional Securities Law Information
Additional Securities Law Information NTR intends to file with the U.S. Securities and Exchange Commission (the “SEC”) a preliminary proxy statement in connection with the proposed acquisition of Kern and to mail a definitive proxy statement and other relevant documents to NTR stockholders. Stockhol
Slide 4: Transaction Highlights
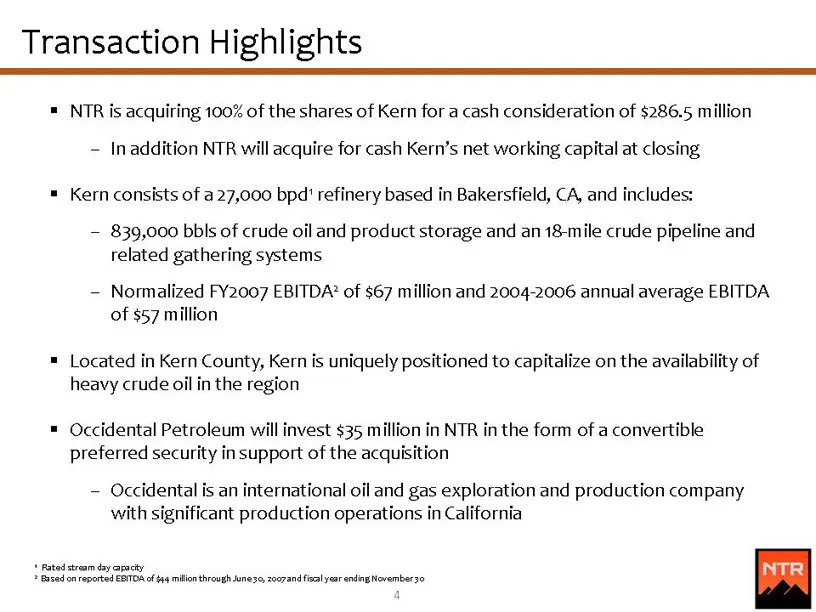
Transaction Highlights = NTR is acquiring 100% of the shares of Kern for a cash consideration of $286.5 million = Inaddition NTR will acquire for cash Kern’s net working capital at closing = Kern consists of a 27,000 bpd' refinery based in Bakersfield, CA, and includes: = 839,000 bbls of crude oil a
Slide 5: Transaction Summary
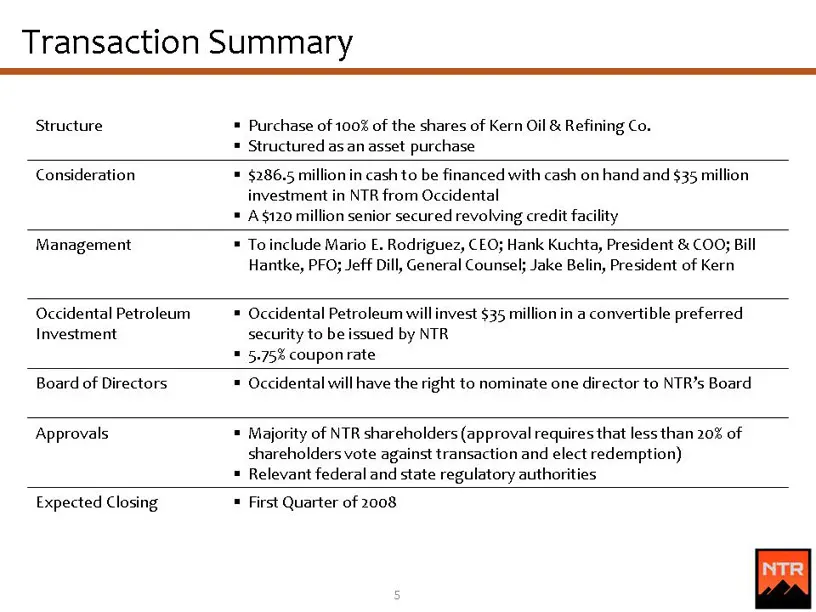
Transaction Summary Structure * Purchase of 100% of the shares of Kern Oil & Refining Co. = Structured as an asset purchase Consideration * $286.5 million in cash to be financed with cash on hand and $35 million investment in NTR from Occidental * A120 million senior secured revolving credit facilit
Slide 6: Comparable Transaction Metrics
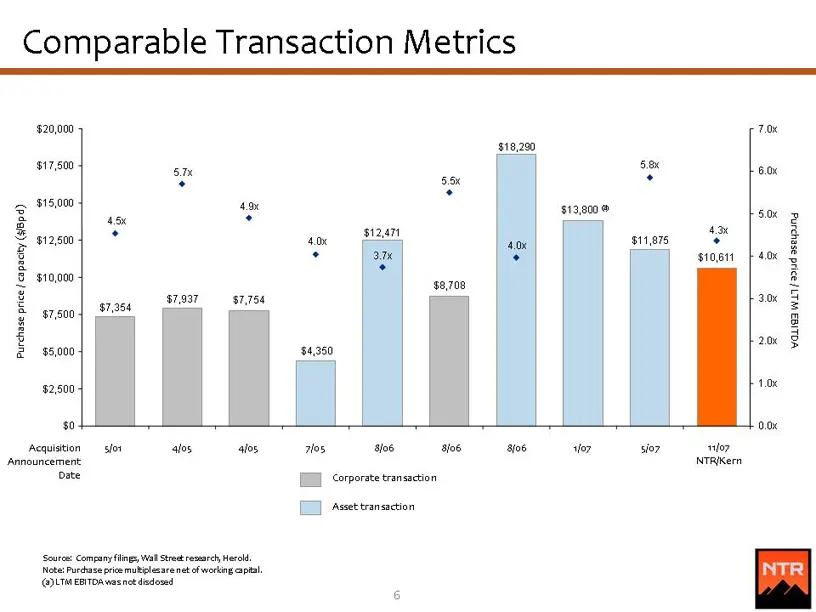
Comparable Transaction Metrics $20,000 $17,500 $18,000 12,500 $10,000 $7937 $1,754 srs00} $7254 $5,000 Purchase price capacity ($8pd) $2,500 30 5.5« ° 12471 $8,708 34,360 $13,290 3,800 8 58 * 1 11,875 43x . stot Acquistion ‘Announcement ate sor alos aos Sera Compan flings, Wal Strat resmareh Hel Not
Slide 7: Publicly Traded Comparables
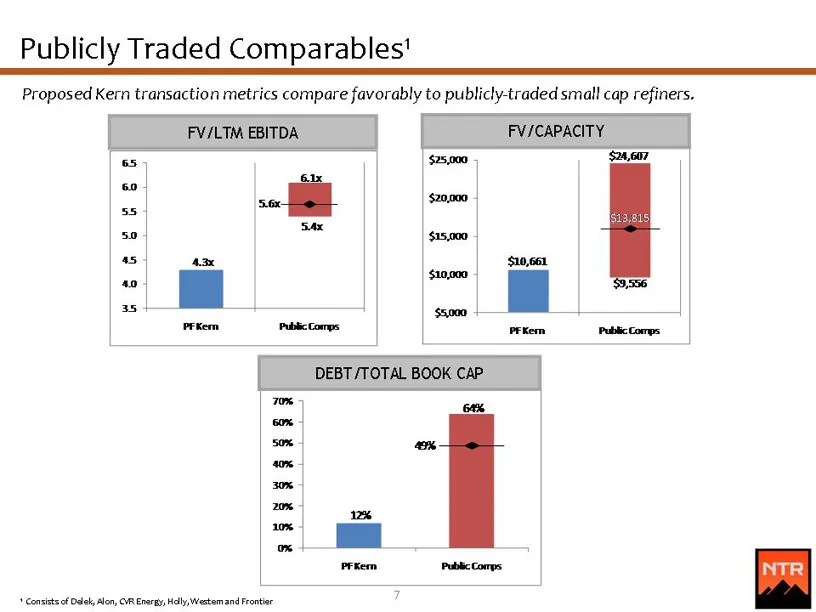
Publicly Traded Comparables' Proposed Kern transaction metrics compare favorably to publicly-traded smal! cap =a FV/LTM EBITDA stn 61x a Pubic Comps == DEBT /TOTAL BOOK CAP. saRa ah hs Prem + Consists of Dek, Alon, CVR Energy, Hall, Wastem and Frontier
Slide 8: Refinery Overview
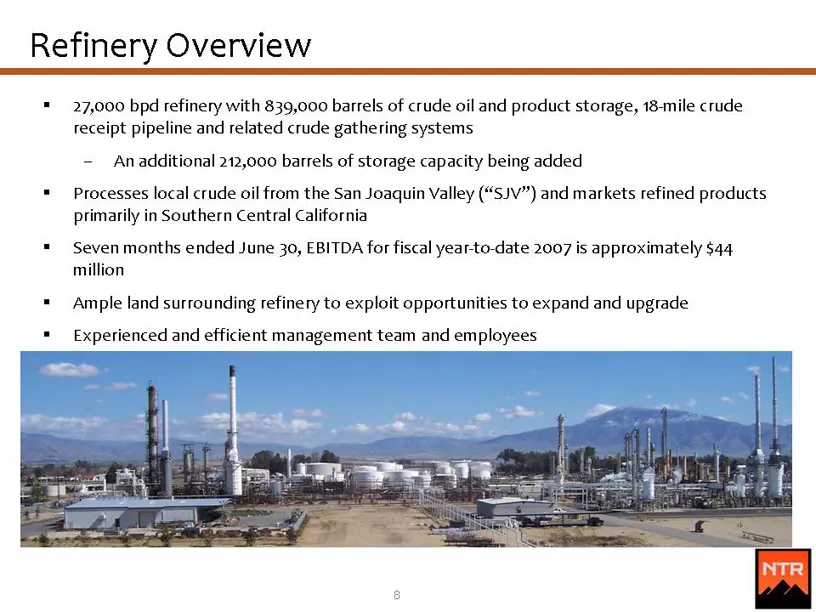
Refinery Overview * 27,000 bpd refinery with 839,000 barrels of crude oil and product storage, 18-mile crude receipt pipeline and related crude gathering systems - Anadditional 212,000 barrels of storage capacity being added = Processes local crude oil from the San Joaquin Valley (“SJV”) and markets
Slide 9: High Value Light Products
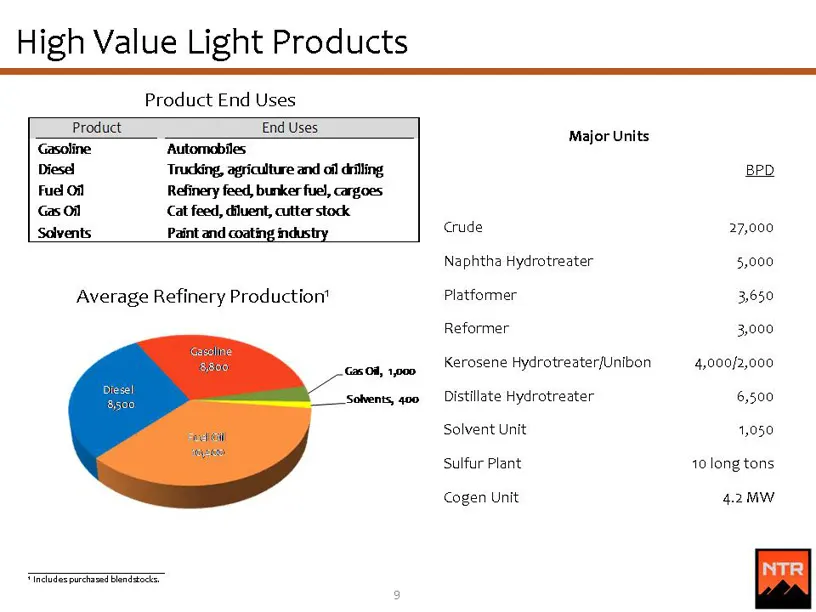
High Value Light Products Product End Uses Product End Uses Major Units Gasoline ‘Automobiles Diesel ‘Trucking, agriculture and ofl drilling BPD Fuel Of Refinery feed, bunker fuel, cargoes Gasoal Cat feed, diluent, cutter stock Solvents Paint and coating industry Crude 27,000 Naphtha Hydrotreater 5,
Slide 10: Strong PADD V Market
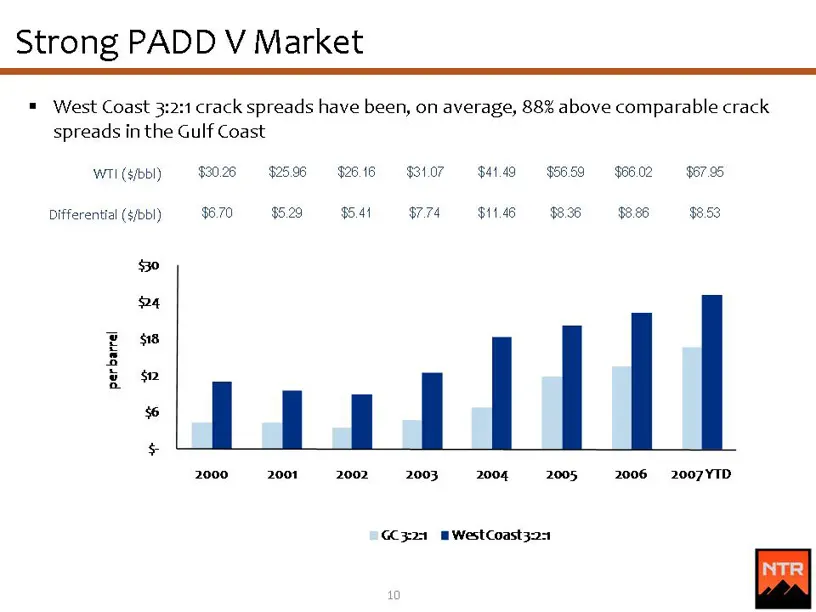
Strong PADD V Market = West Coast 3:2:1 crack spreads have been, on average, 88% above comparable crack spreads in the Gulf Coast WTI (s/bbl) Differential (&/bbl) perbarrel $0 gn $20.26 $670 “ot Ul $25.96 $5.29 $26.16 $31.07 41.49 $56.59 $5.44 $774 $11.48 $8.36 966.02 $8.86 $67.95 $8.53 2000 2001 20
Slide 11: Regional Crude Oil Supply
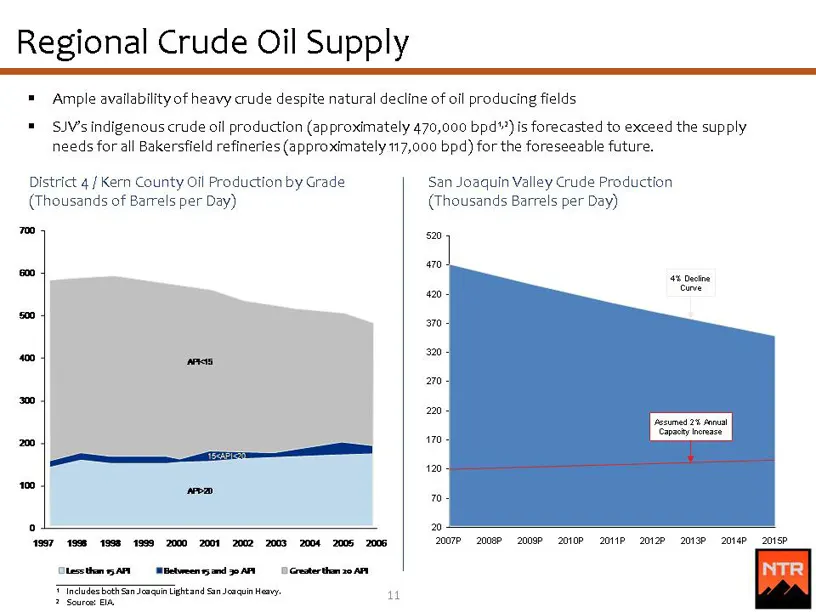
Regional Crude Oil Supply = Ample availability of heavy crude despite natural decline of oil producing fields "SUV's indigenous crude oll production (approximately 470,000 bpd) is forecasted to exceed the supply needs for all Bakersfield refineries (approximately 117,000 bpd) for the foreseeable fut
Slide 12: Growing Market for Products
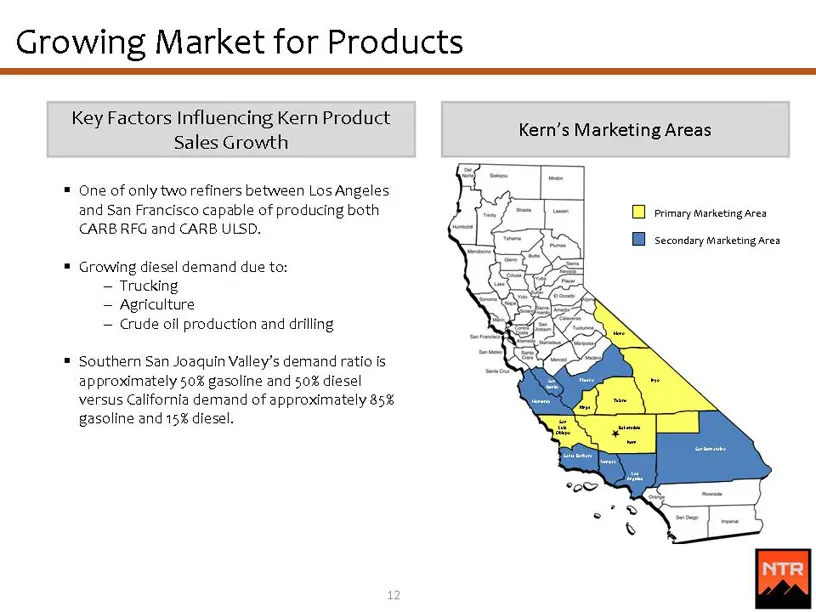
Growing Market for Products Key Factors Influencing Kern Product Sales Growth = One of only two refiners between Los Angeles and San Francisco capable of producing both CARB RFG and CARB ULSD. * Growing diesel demand due to: ~ Trucking — Agriculture = Crude oil production and drilling = Southern San
Slide 13: Significant Improvement Opportunities
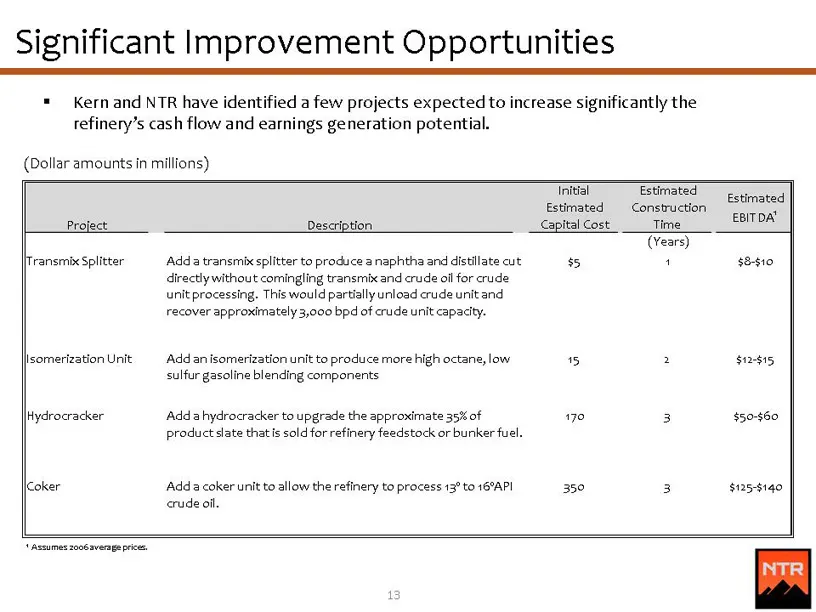
Significant Improvement Opportunities "Kern and NTR have identified a few projects expected to increase significantly the refinery’s cash flow and earnings generation potential. (Dollar amounts in millions) crude oil, Taal Estinated Estimated Construction “sxe Project Description CapitalCost___Time
Slide 14: Strong Historical Performance
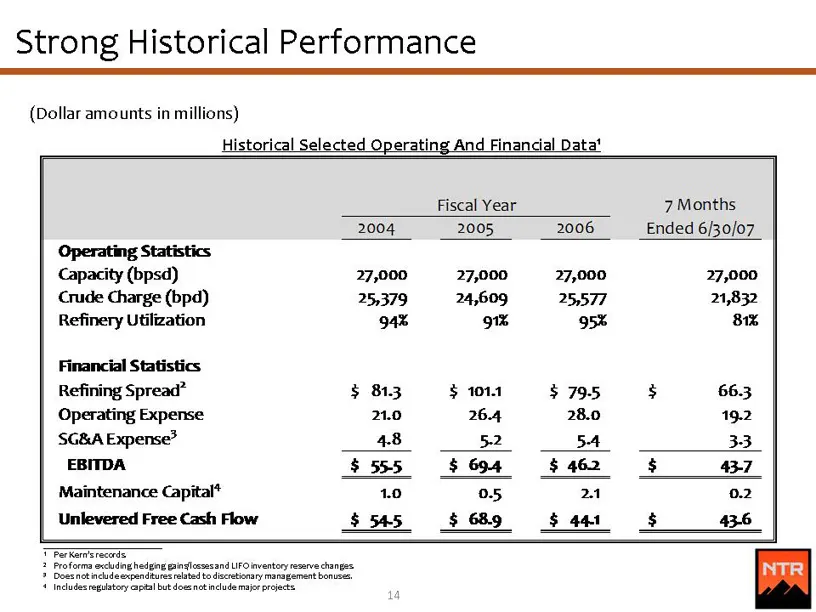
Strong Historical Performance (Dollar amounts in millions) Historical Selected Operating And Financial Data‘ Operating Statistics Capacity (bpsd) Crude Charge (bpd) Refinery Utilization Financial Statistics Refining Spread” Operating Expense SG&A Expense® EBITDA Maintenance Capital* Unlevered Free C
Slide 15: What We Told You and What We Did
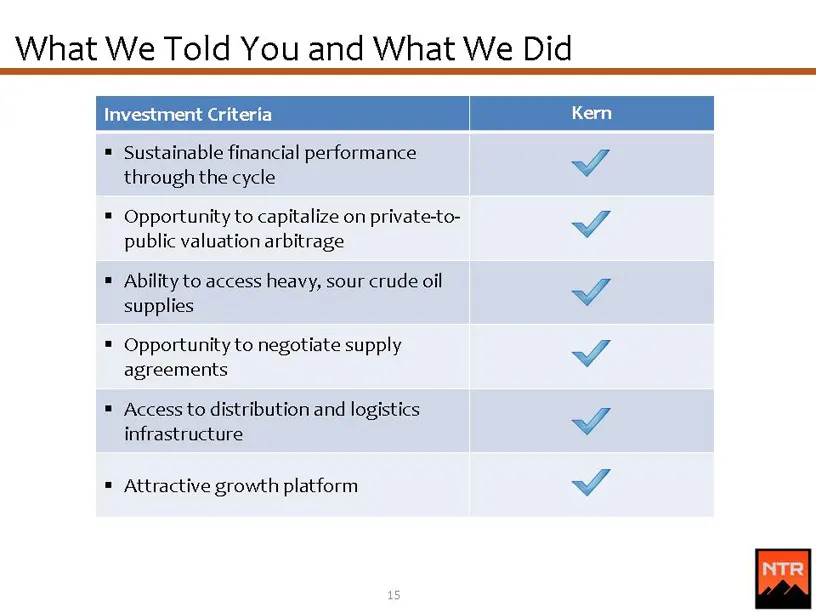
What We Told You and What We Did Fivestmentcrtera | Kem | = Sustainable financial performance through the cycle = Opportunity to capitalize on private-to- public valuation arbitrage = Ability to access heavy, sour crude oil supplies = Opportunity to negotiate supply agreements = Access to distributi
Slide 16: Appendix
APPENDIX
Slide 17: Historical Selected Operating and Financial Data
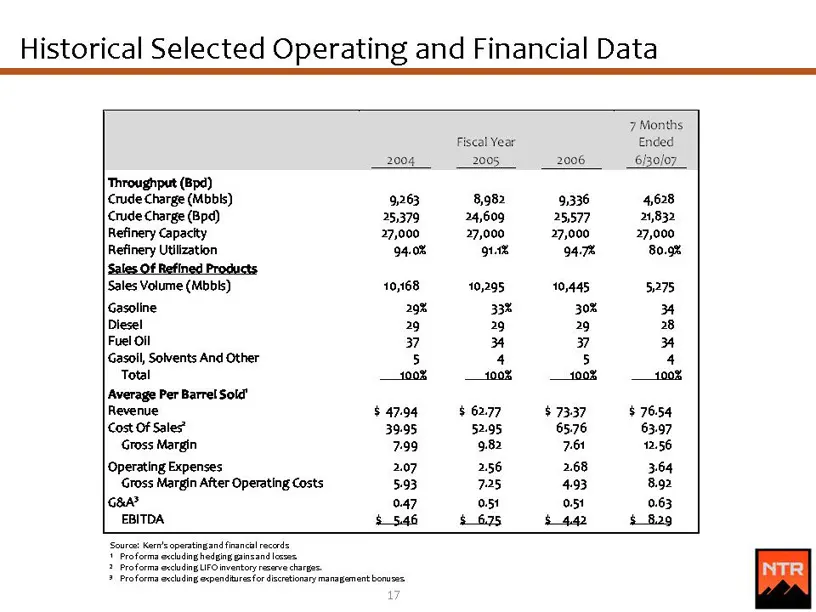
Historical Selected Operating and Financial Data 7 Months Fiscal Year Ended 2004 2005 2006 6/30/07 ‘Throughput (Bpd) ‘Crude Charge (Mbbls) 9.263 8,982 9,336 4,628 ‘Crude Charge (Bpd) 25379 24,609 25577 24,832 Refinery Capacity 27,000 27,000 27,000 27,000 Refinery Utilization 94.0% ge 4 80.9% Sales O
Source: SEC EDGAR · 8-K filed Nov 5, 2007