Kerr Mcgee — A.G. Edwards Energy Conference 2005
39 slides from Kerr Mcgee's conference presentation, Mar 15, 2005
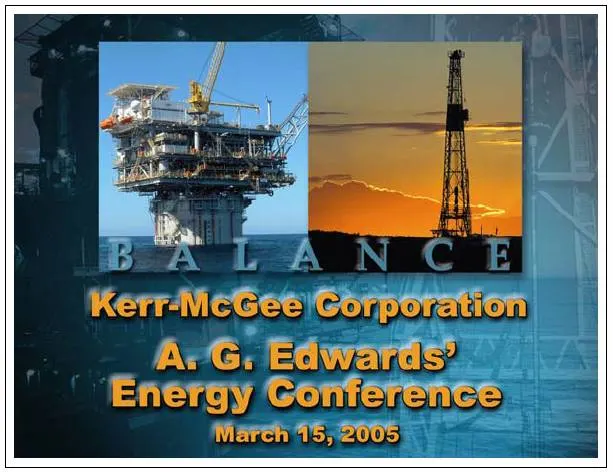
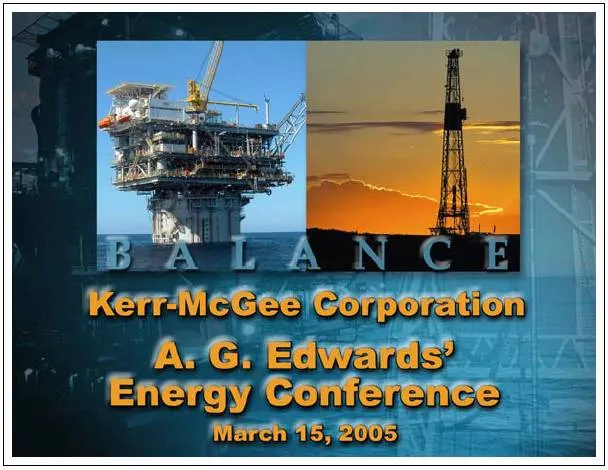
Slide 1: Kerr-McGee Corporation A.G. Edwards Energy Conference
Kerr-Me€Gee|/Corporation AvG: Edwaras: Energy Gontérence March 1552005:
Slide 2: Forward-Looking Statement
‘The company makes certain forward.Jooking statements in this presentation that are subject to risks ‘and uncertainties. Future results and developments discussed in these statements may be affected by numerous factors and risks, such as the accuracy of the assumptions that undertie the statements,
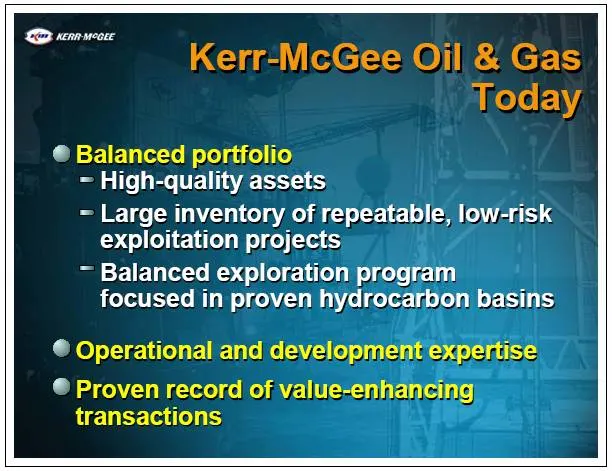
Slide 3: Kerr-McGee Oil & Gas Today
Kerr-McGee Oj] & Gas Today @ Balanced portfolio = High-quality assets = Large inventory of repeatable, low-risk exploitation projects ~ Balanced exploration program focused in proven hydrocarbon basins © Operational and development expertise ®@ Proven record of, value-enhaneing transactions
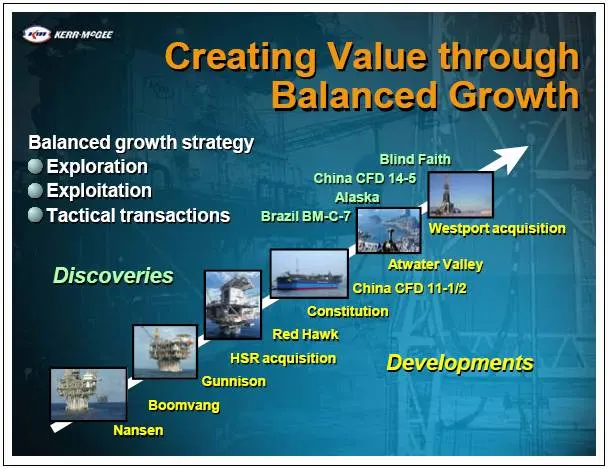
Slide 4: Creating Value through Balanced Growth
QD ccm meoce Creating Value through Balanced) Growth Balanced growth strategy : S Exploration China ee ela WW @ Exploitation Alaska | A @Tactical transactions Brazil BM-C7 (a 4 i; | Westpertacquisition 1 Discoveries g aia = ee i Constitution se “¥ "Red Hawk HSRacquisition Ear Gunnison . Boomvang © N
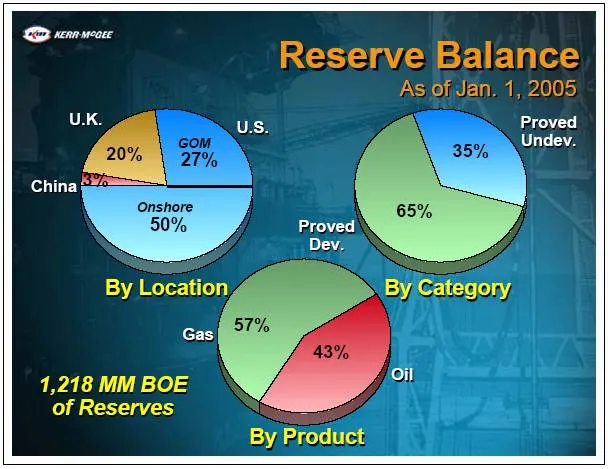
Slide 5: Reserve Balance
Reserve Balance As of Jan. 1, 2005 Proved Undev. By Location 1,218 MM BOE of Reserves By Product
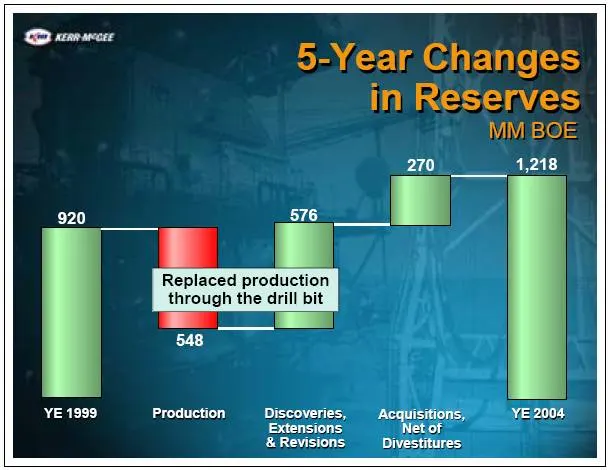
Slide 6: Replaced production through the drill bit
Replaced production through the drill bit AN YE 1999 Production Discoveries, nae Extensions & Revisions
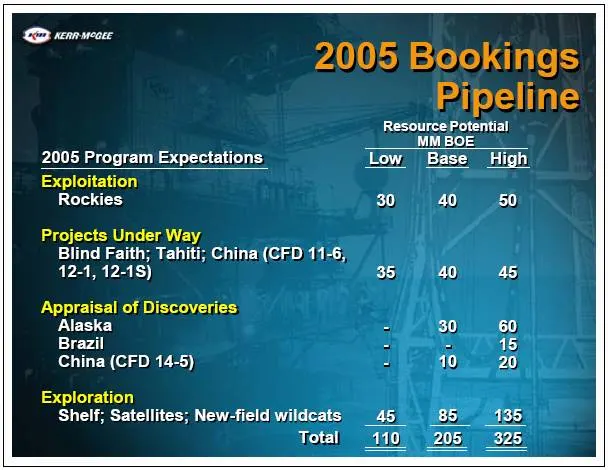
Slide 7: 2005 Bookings
2005 Bookings Pipeline Resource Potential MM BOE 2005 Program Expectations Low) Base High Exploitation Rockies 30 40 «50 Projects Under Way Blind Faith; Tahiti; China (CFD 11-6, 12-4, 12-18) Appraisal of Discoveries Alaska Brazil China (CFD 14-5) Exploration Shelf; Satellites; New-field wildcats Tot
Slide 8: Exploitation
Exploitation Large inventory for, PEPCAaTADIE; N6W7T1Sk jproyects
Slide 9: Rocky Mountain
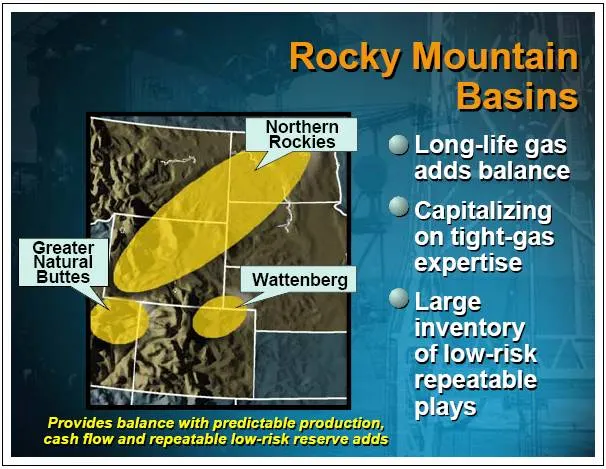
Rocky Mountain Basins Northern Rockies @ Long-life gas 4 adds balance © Capitalizing on tight-gas Natural ] expertise Buttes Wattenberg P © Large inventory of low-risk repeatable plays Greater Provides balance with predictable production, cash flow and repeatable low-risk reserve adds,
Slide 10: Exploitation: Rockies
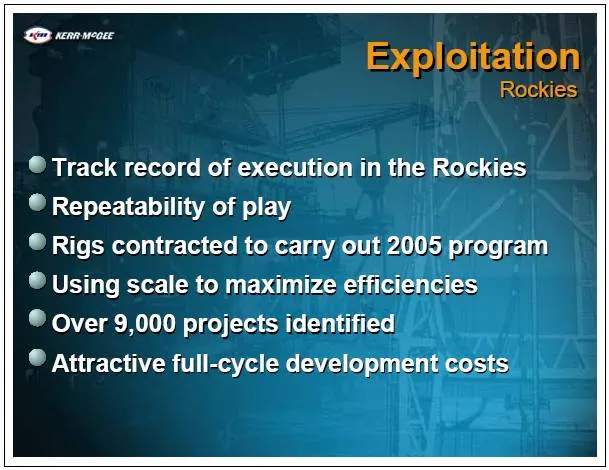
Exploitation Rockies ® Track record of execution in the Rockies © Repeatability of play ® Rigs contracted to carry out 2005 program © Using scale to maximize efficiencies ® Over 9,000 projects identified © Attractive full-cycle development costs
Slide 11: Exploitation: Greater Natural Buttes Key Program Statistics
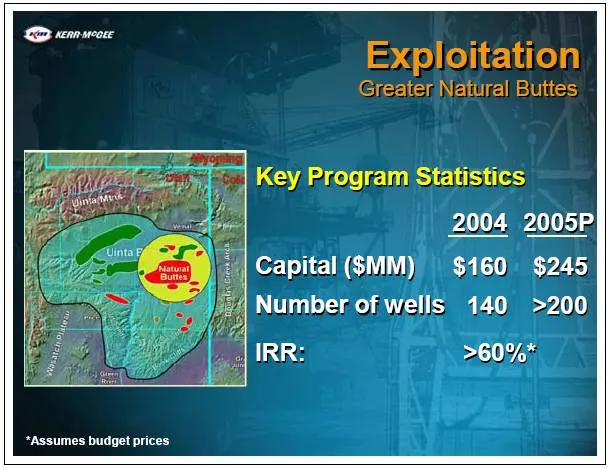
“Assumes budget prices Exploitation GreatenNatiral Buttes Key Program Statistics 2004 2005P; Capital (SMM) $160 $245 Number of wells 140 >200 60%"
Slide 12: Estimated Full-Cycle Development Costs
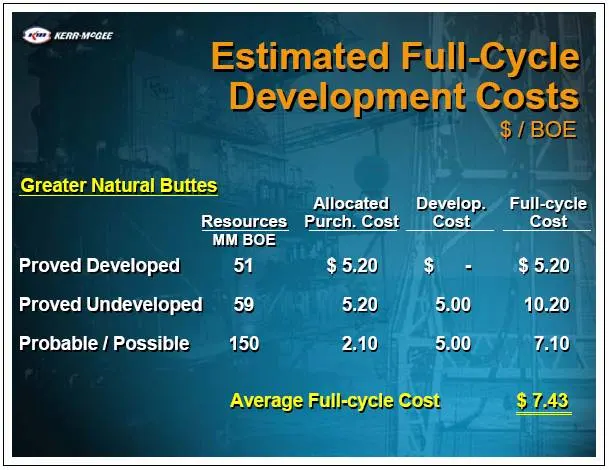
Estimated Full-Cycle Development Costs $/BOE Greater Natural Buttes Allocated) Develop, Full-cycle Resources Purch. Cost | Cost Cost MM BOE Proved Developed 51 $5.20 $i - $5.20 Proved Undeveloped 59 5.20, 5.00 10.20: Probable / Possible 150 2.10 5,00 7.10 Average Full-cycle Gost $7.43
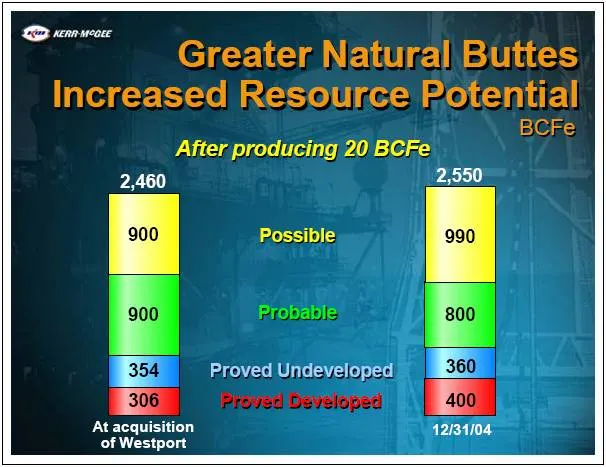
Slide 13: Greater Natural Buttes Increased Resource Potential
, ol Greater Natural Buttes Increased Resource Potential BCFe After producing 20 BCFe 2,460 2,550 5 Possible on | | Probable: 800 | 354" Proved Undeveloped | 360 Proved Developed At acquisition of Westport
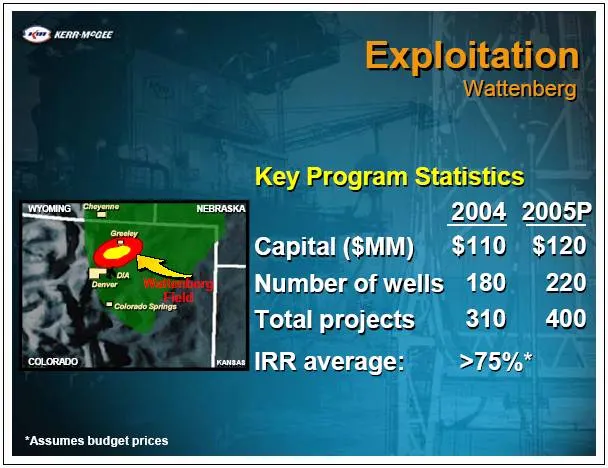
Slide 14: Exploitation: Wattenberg Key Program Statistics
Ee Exploitation Wattenberg) Key Program Statistics sere = 2004 2005P <4) Capital ($MM) $110 $120 ex Ut" |" Number ofwells 180 220 €4 pra Total projects | 310 400 ae | jw IRR average: 215%" “Assumes budget prices
Slide 15: Exploration
Exploration Fotused 6n proveninyarocarpon basins With track recora Or Success
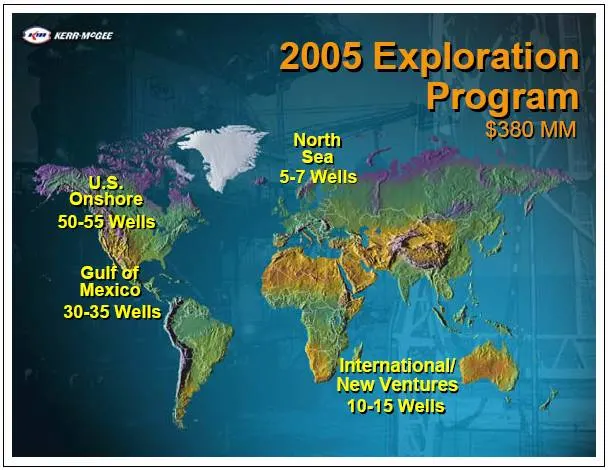
Slide 16: 2005 Exploration Program
2005 Exploration Program $380 MM North Sea) 5-7Wells
Slide 17: Deepwater Gulf of Mexico
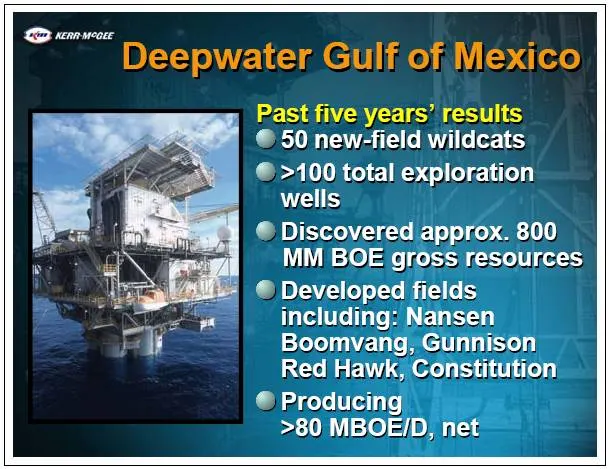
QD ccm ncoce Deepwater Gulf of Mexico , Past five years’ results © 50 new-field wildcats ® >100 total exploration wells ® Discovered approx. 800 MM BOE gross resources = ® Developed fields including: Nansen Boomvang, Gunnison Red Hawk) Constitution ® Producing >80 MBOE/D; net
Slide 18: Deepwater Gulf of Mexico Lookback Assumptions
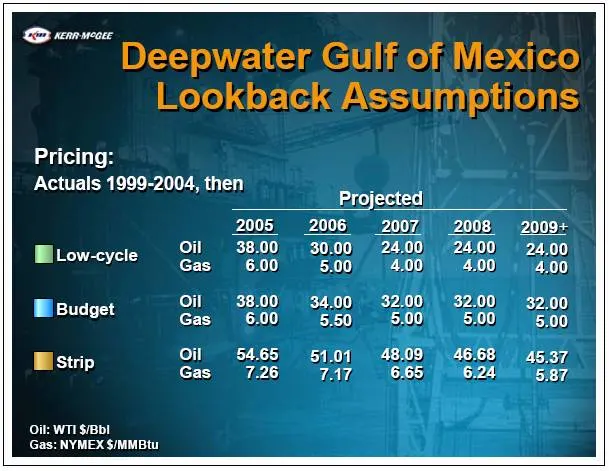
rs Deepwater Gulf of Mexico Lookback Assumptions Pricing: Actuals 1999-2004, then . Projected 2005 2006 2007, Oil = 38.00 30.00 24.00 6.00 5.00 4.00 BiLow-cycle Oil 38.00 34.00 32.00 Bibudget Gas 600 550 5.00 - Oil «54.65 54.04 48,09, Mistip Gas 726 747 6.65 Oi: WTI SBI Gas: NYMEX $/MMBtu
Slide 19: Nansen
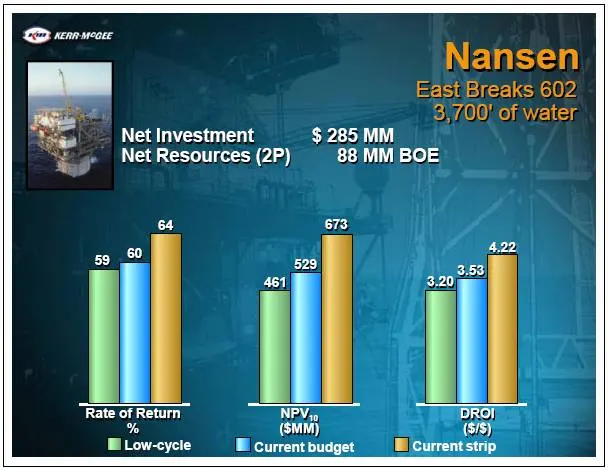
Nansen East Breaks 602 8, 7/00) of water. Net Investment $285 MM =" ye s Net Resources (2P) 88 MM BOE 4.22 3.53 ill 3,20 Rate of Return NE DROT % (SMM) (SiS), Bi Low-cycle current budget E Current strip
Slide 20: Boomvang
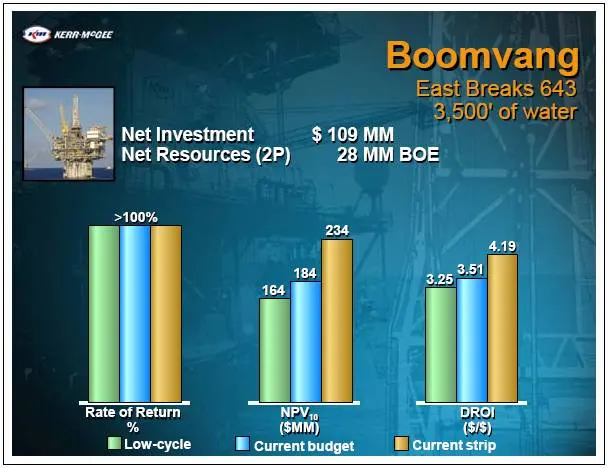
QD ccm meoce Boomvang East Breaks 643) 8,500) of water Net Investment $109 MM Net Resources (2P) 28 MM BOE lll al “Rate ofReturn of Return TNE aed "ROL (sm) (SiS), a Low tele EB current budget Ei currentstrip
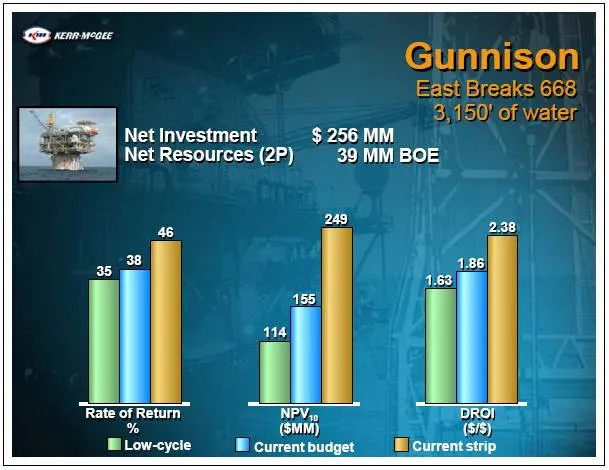
Slide 21: Gunnison
Gunnison East Breaks 668 3; 150) of water Net Investment $ 256 MM Net Resources (2P) 39 MM BOE il al il “Rate ofReturn of Return NPV, 7 pRor (sm) (S'S) it wee & current budget E Current strip
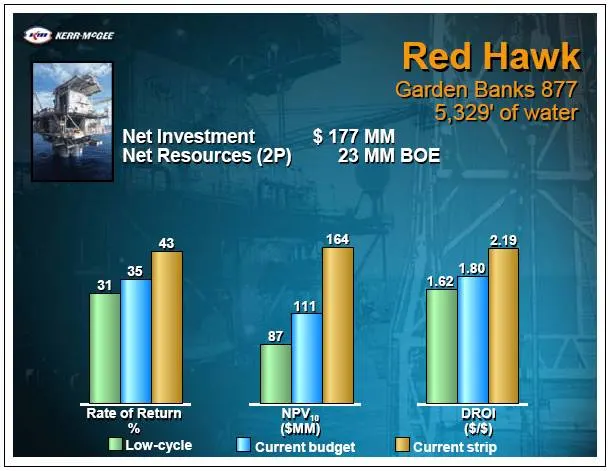
Slide 22: Red Hawk
QD ccm neose Red Hawk i A Garden Banks 877 4 51329) of water. = Net Investment $177 MM Fal Net Resources (2P) 23 MM BOE “Rate of Return oft LJ rene
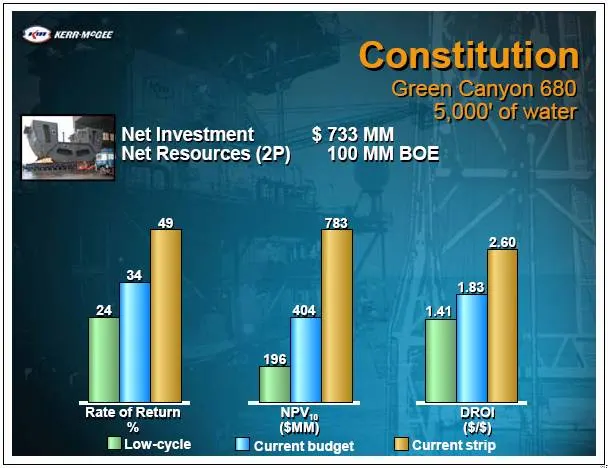
Slide 23: Constitution
SE Gonstitution Green Canyon 680) 5,000) of water. WR Net Investment $733 MM a= Net Resources (2P) 100 MM BOE | Emr | - ill “Rate of Return ci Return NPY sn) a fee, EB current budget
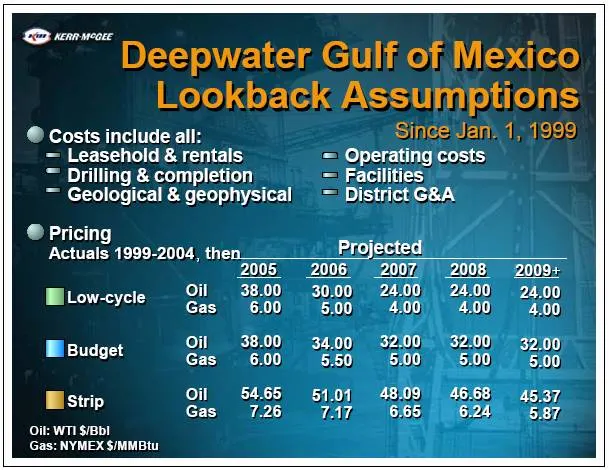
Slide 24: Deepwater Gulf of Mexico Lookback Assumptions
QDecvnwecse J Deepwater Gulf of Mexico Lookback Assumptions @ Costs include all: Since Jan 1), 1999 — Leasehold & rentals = Operating costs = Drilling & completion = Facilities: = Geological & geophysical — Di @ Pricing ‘ Actuals 1999-2004, then Projected 2005 2006 | 2007, Oil 38.00 30,00 24:00 Gas
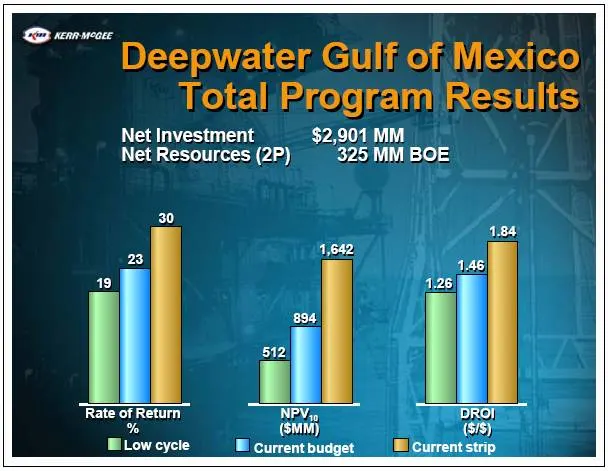
Slide 25: Deepwater Gulf of Mexico Total Program Results
rs Deepwater Gulf of Mexico Total Program Results Net Investment $2,901 MM Net Resources (2P) 325 MM BOE ill wl “Rate ofReturn of Return NE TpRor (sm) (SIS) LJ io cycle EE current budget Current strip
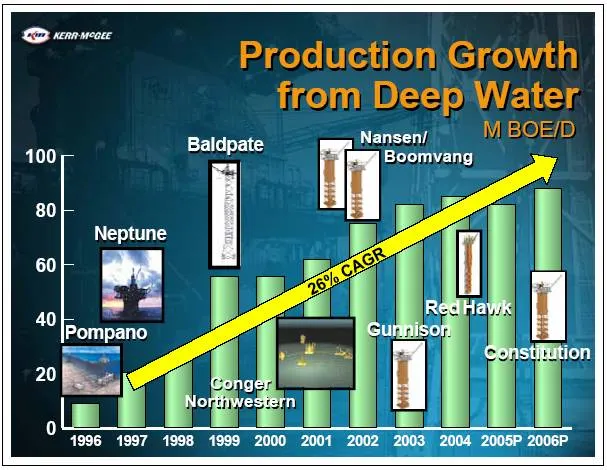
Slide 26: Production Growth from Deep Water
Production Growth from Deep Water. MM BOE/D Nansen/. iM, Boomvang Ta oped Bg Ee 1 1996 1997 1998 1999 2000 2001 2002 2003, 2004 2005P 2006P
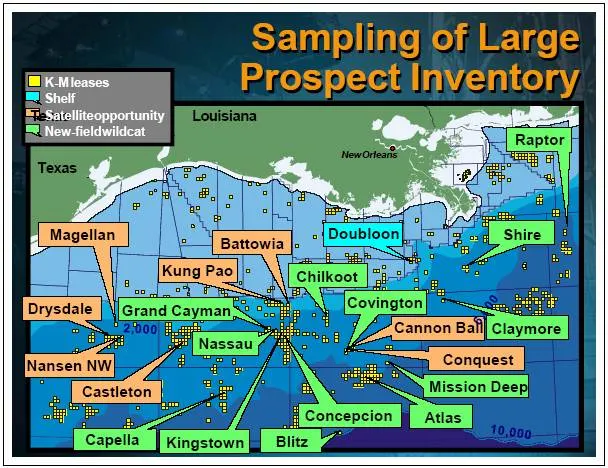
Slide 27: Sampling of Large Prospect Inventory
Sampling of Large = Kcsee Prospect Inventory
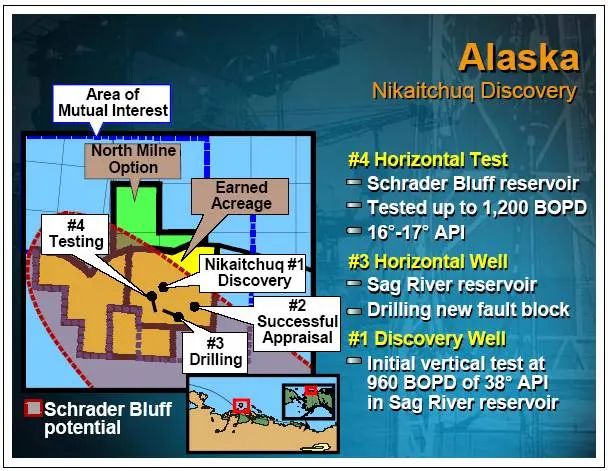
Slide 28: Alaska
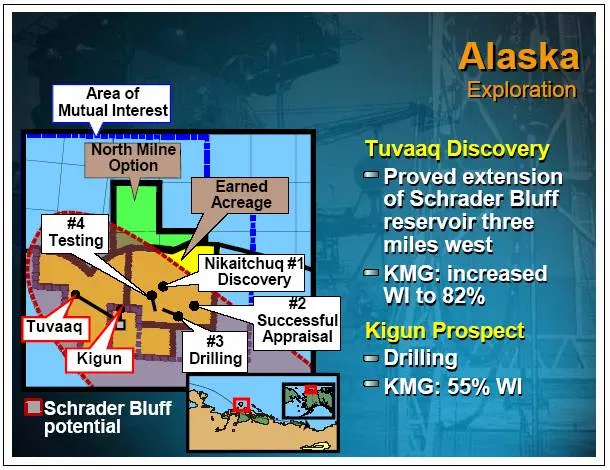
Alaska Area of Nikaitchug| Discovery Mutual Interest} #4 Horizontal Test = Schrader Bluff reservoir — Tested up to 1,200 BOPD — wo 7° API PI ; vel Well of TESErvoir les Schrader Bluff 2 potential
Slide 29: Schrader Bluff potential
‘Schrader Bluff potential piling Py Successful zo Appraisal Alaska Exploration Tuvaag Discovery = Proved extension of Schrader Bluff reservoir three miles west =KMG; increased WiI\to 82% Kigun Prospect = Dalling = KMG: 55% WI
Slide 30: Alaska Exploration: Atarug Prospect
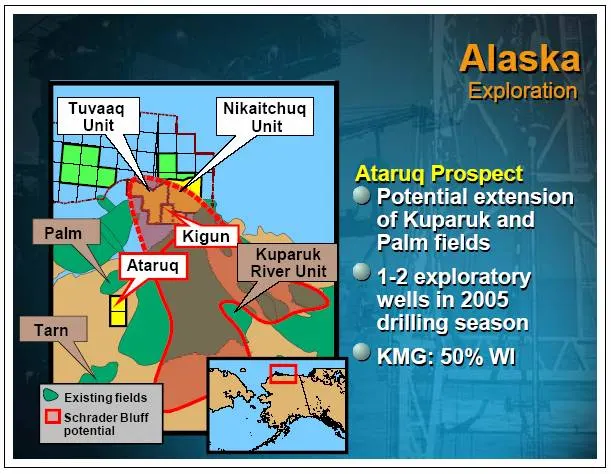
isting fields oe Dschrasersiuir [| potential pag Alaska Exploration: Atarug Prospect ® Potential extension of Kuparuk and Palm fi
Slide 31: Transactions
TranSaGuons Capitalizing on COTE COMPETENCIES LO enhance vale
Slide 32: Comparative Rockies Transactions
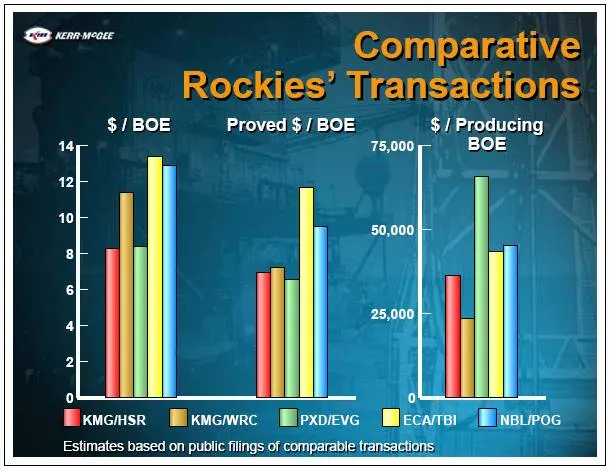
Comparative Rockies: Iiransactions $/ BOE Proved $/ BOE $/ Producing 75,000 BOE Exwcnsrk Mixwcwrc Mipxpeve Mleca Estimates based on public flings of comparable fransat
Slide 33: HSR Acquisition
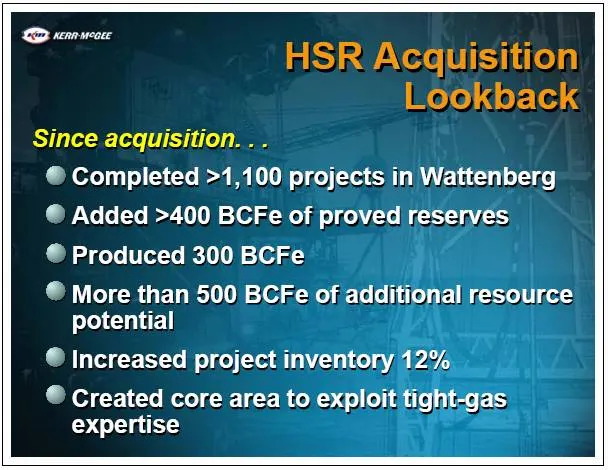
HSR Acquisition Lookback Since acquisition. . . @ Completed >1,100 projects in Wattenberg @ Added >400 BCFe of proved reserves @ Produced 300 BGFe ® More than 500 BCFe of additional resource potential @ Increased project inventory 42% . © Created core area to exploit fight-gas expertise
Slide 34: Blind Faith Discovery
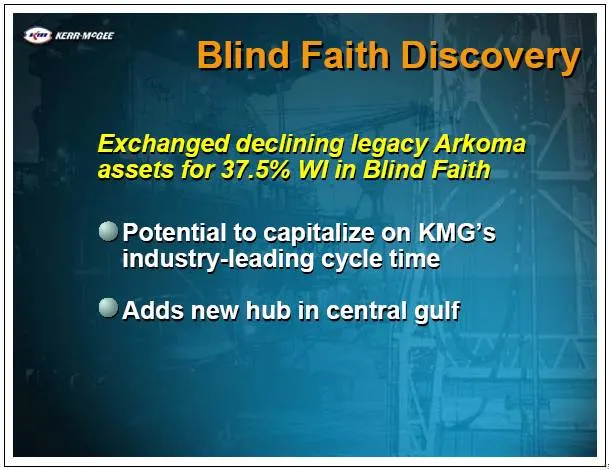
Blind Faith Discovery Exchanged declining legacy Arkoma assets for 37.5% Whin Blind Faith ® Potential to capitalize on KMG’s industry-leading cycle time ® Adds new hub in central gulf
Slide 35: 2003 2004 2005P 2006 2007P
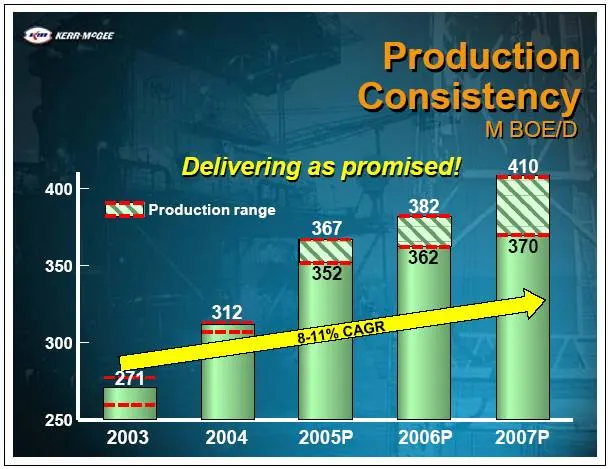
2003 2004 2005P 2006 2007P
Slide 36: Gross Production Margin
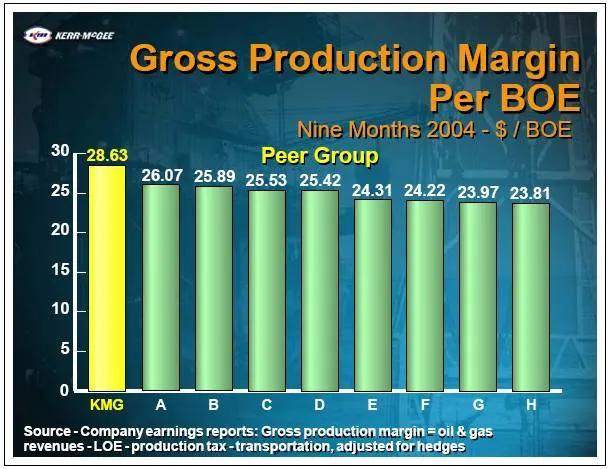
= Gross Production Margin Per BOE Nine Months 2004 9$ / BOE 30,-28.63 Peer Group 26.07 25.89 2553 25.42 : : : 24.31 24.22 23.97 23.81 « D = F G H A B ‘Source - Company earnings reports: Gross production margin=oll&ga5 revenues -LOE - production tax- transportation, adjusted for hedges
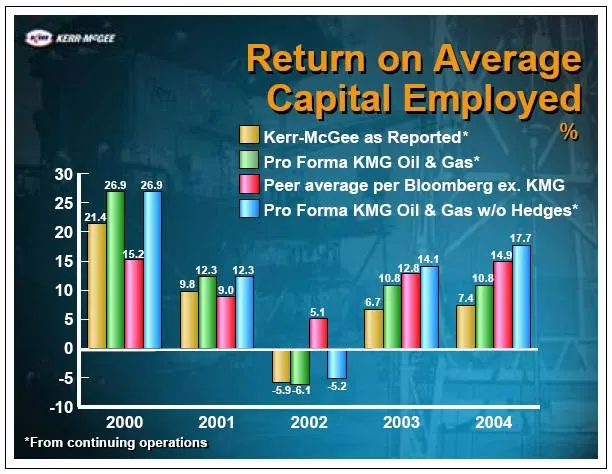
Slide 37: Return on Average Capital Employed
Return) on Average Gapital Eniploysd i kerr-McGee as Reported” Bi pro Forma KMG Oil & Gas* IE Peer average per Bloomberg ex. KMG i Pro Forma KMG Oil & Gas w/o Hedges* 23° 123 -10 2000 2001 *From continuing operations 2002
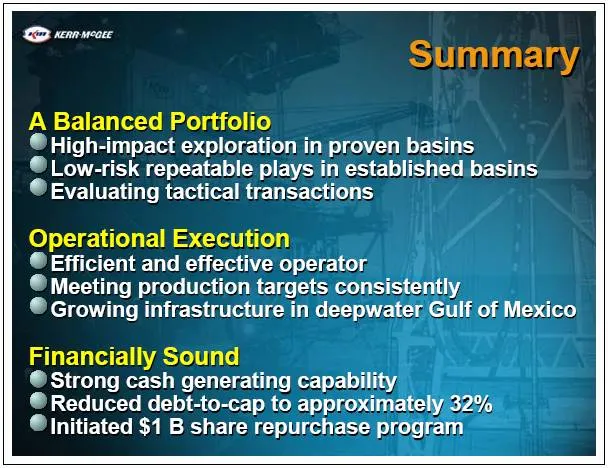
Slide 38: Summary
QDerconueoe Summary a Balanced Portfolio @ High-impact exploration in proven basins SLow-risk repeatable plays in established basins © Evaluating tactical transactions Operational Execution © Efficient and effective operator, . Meeting production targets consistently © Growing infrastructure in deep
Slide 39: Link to searchable text of slides
Link to searchable text of slide shown abov e Searchable text section of graphics shown above [ GRA PHIC] Kerr-McGee Corporation A.G. Edwards’ Energy Conference March 15, 2005 [ LOG O] Forward-Looking Statement The company makes certain forward-looking statements in this presentation that are subjec
Source: SEC EDGAR · 8-K filed Mar 15, 2005
More decks from Kerr Mcgee Corp
 Howard Weil Energy Conference 200533 slides · Apr 5, 2005
 Investor Presentation (March 2005)52 slides · Mar 16, 2005
 Westport Resources — Merger or Acquisition (May 2004)53 slides · May 12, 2004
 Kerr Mcgee — Merger or Acquisition (April 2004)49 slides · Apr 8, 2004
 Westport Resources — Merger or Acquisition (April 2004)49 slides · Apr 7, 2004