Massey Energy — Merger or Acquisition (January 2011)
19 slides from Massey Energy's merger presentation, Jan 31, 2011
Slide 1: Alpha + Massey: Creating an Industry Leader
Alpha Natural Resources Massey Energy Alpha + Massey: Creating an Industry Leader January 31, 2011
Slide 2: Forward Looking Statements and Additional Information
This communication does not constitute an offer to sell or the solicitation of an offer to buy any securities or a solicitation of any vote or approval. In connection with the proposed merger, Alpha will file with the SEC a registration statement on Form S-4 that will include a preliminary joint pro
Slide 3: Transaction Highlights
Consideration • Massey shareholders receive 1.025 Alpha shares + $10 in cash for each Massey share, for a total consideration of $69.33 per share based on Alpha closing price on 1/28/11 Premium • Implied premium to Massey: 21% as of 1/28/11 Ownership • 54% Alpha / 46% Massey Synergies • In excess of
Slide 4: A Compelling Combination
A global industry leader Unique, diversified platform for success Better able to navigate changing regulatory environment Immediate premium + full upside participation for Massey shareholders Significant value creation Industry-leading financial profile A Compelling Combination A Compelling Combinat
Slide 5: Unique Win-Win Opportunity
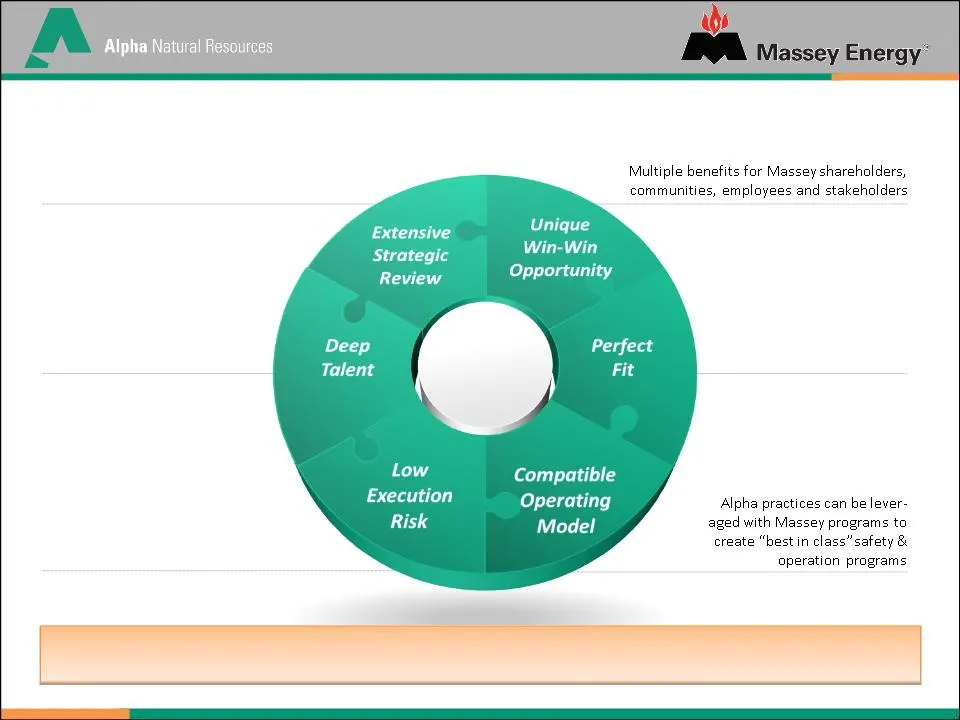
Unique Win-Win Opportunity Perfect Fit Compatible Operating Model Low Execution Risk Deep Talent Extensive Strategic Review “Right Partners, Right Way Forward” The most compelling path forward with tremendous upside Both companies provide a strong pool of talent in CAPP to effectively operate the co
Slide 6: Creating a Premier U.S. Coal Company
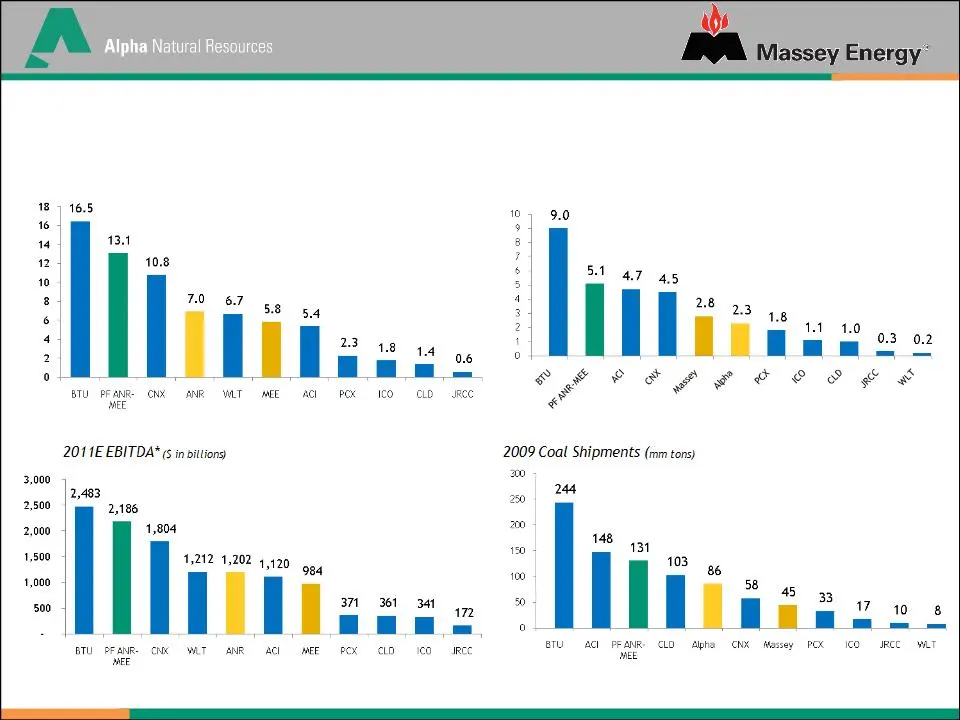
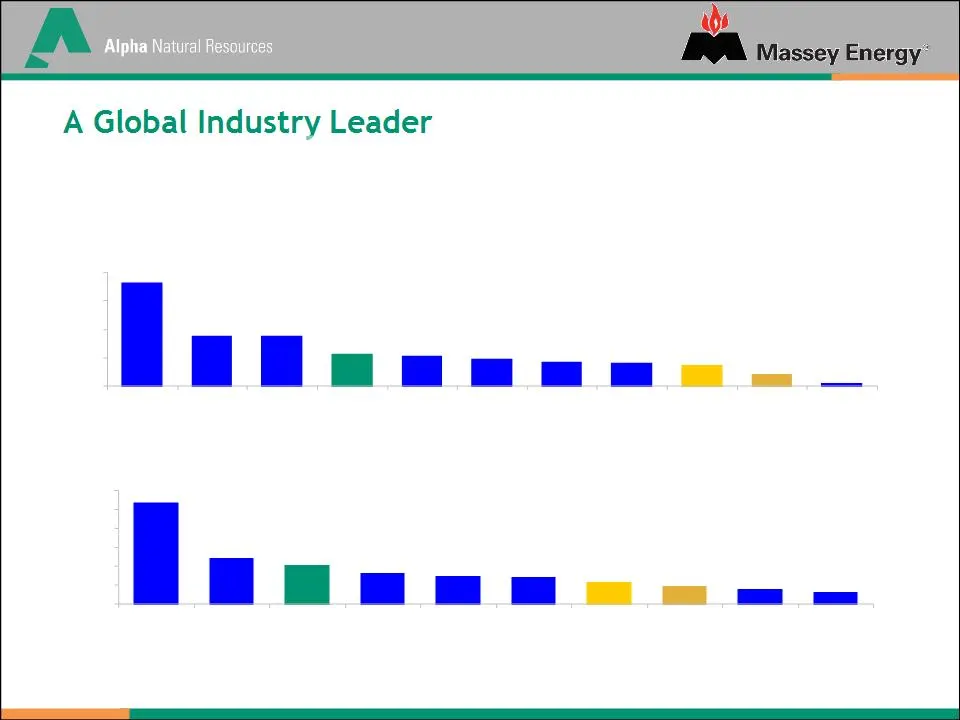
Creating a Premier U.S. Coal Company Market Capitalization ($ in billions) 18 16 14 12 10 8 6 4 2 0 16.5 13.1 10.8 7.0 6.7 5.8 5.4 2.3 1.8 1.4 0.6 BTU PF ANR-MEE CNX ANR WLT MEE ACI PCX ICO CLD JRCC Coal Reserves (in billions of tons) 10 9 8 7 6 5 4 3 2 1 0 9.0 5.1 4.7 4.5 2.8 2.3 1.8 1.1 1.0 0.3 0.
Slide 7: One of the world's largest and highest quality metallurgical reserve bases
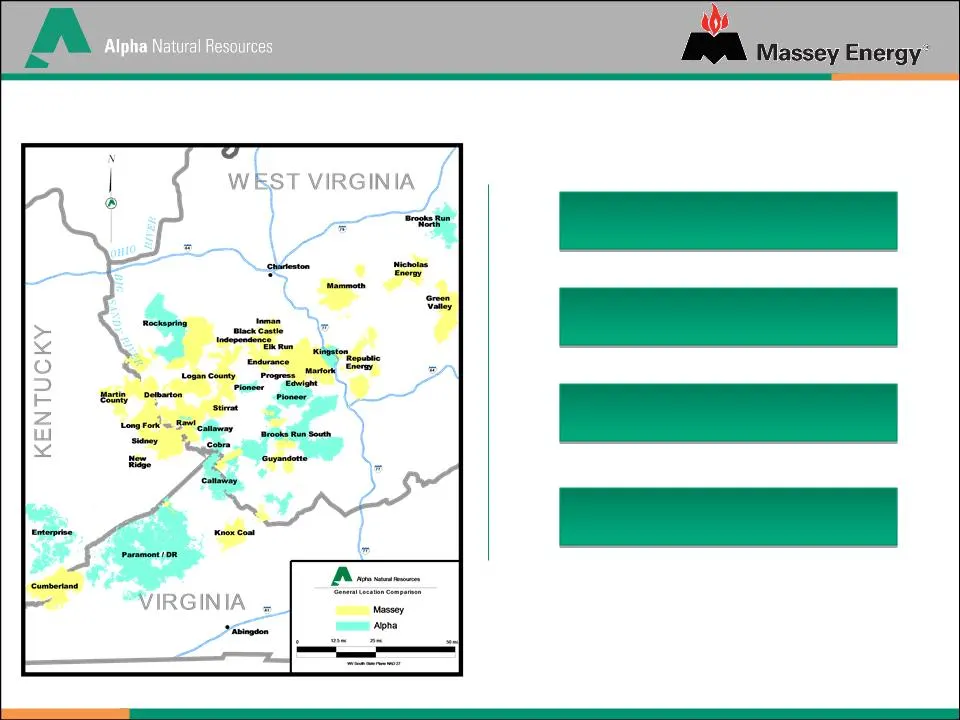
One of the world’s largest and highest quality metallurgical reserve bases #2 U.S. coal reserve base ~ 5.1 billion tons #3 US coal producer ~131 million tons shipped in 2009 Leading global met supplier - 24-26 mm tons of shipments in the first full year Complementary Footprint in Central Appalachia
Slide 8: Benefits of a Diversified Footprint
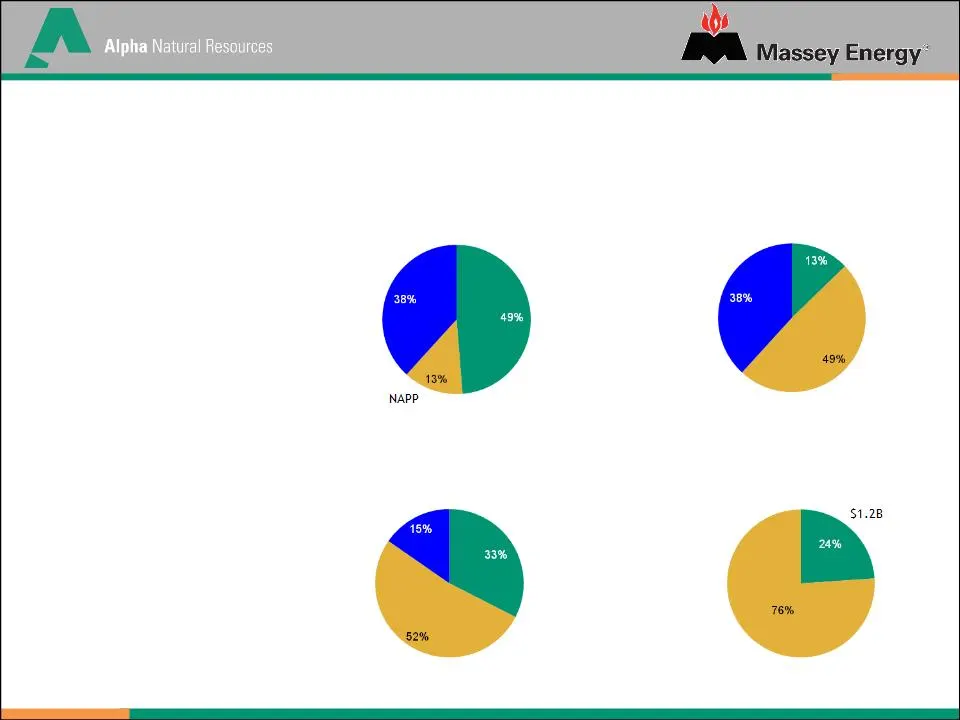
Source Alpha Management Analysis, based on 2009 Pro Forma shipments of 131MM tons, company reports 7 Benefits of a Diversified Footprint 2009 Pro Forma Shipment Mix 17MM Tons n Geographical diversification smoothes demand variations among regions n Thermal business provides stability to portfolio wh
Slide 9: Leading provider of total coal and met coal globally
n Combined company, a leading provider of total coal and met coal globally Notes: (1) Pro Forma for Foundation coal production/sales (2) Pro Forma for Cumberland; based on 2009 production and assumes 8MM tons of annual coal production and 360k tons of annual met sales 2008 & 2009 Total Coal Producti
Slide 10: Trends in Metallurgical Coal
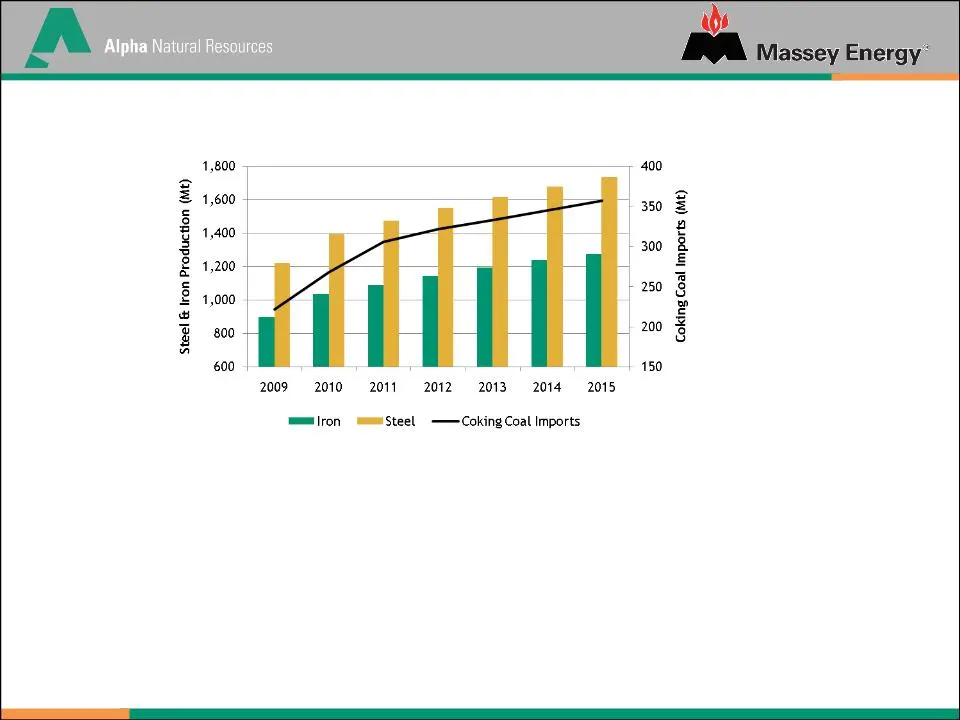
Steel & Iron Production (Mt) 1,800 1,600 1,400 1,200 1,000 800 600 2009 2010 2011 2012 2013 2014 2015 Coking Coal Imports (Mt) 400 350 300 250 200 150 —Iron Steel —Coking Coal —Imports Trends in Metallurgical Coal • World steel production is expected to increase by 42% to 1.7 billion tonnes by 2015
Slide 11: Committed and Priced Position
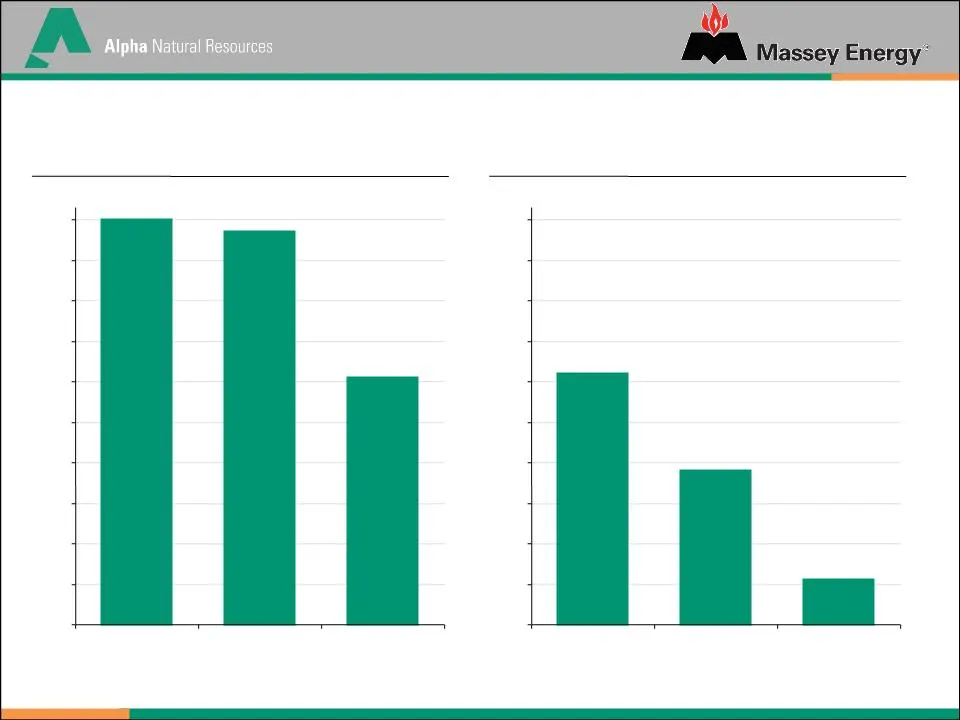
Committed and Priced Position Note : Based on company reports and management estimates 100% 61% 97% 0% 10% 20% 30% 40% 50% 60% 70% 80% 90% 100% Western Thermal Eastern Thermal Met 2011 Percentage Committed and Priced, Pro Forma 2012 Percentage Committed and Priced, Pro Forma 62% 11% 38% 0% 10% 20% 3
Slide 12: Industry Leading Safety Program: Running Right
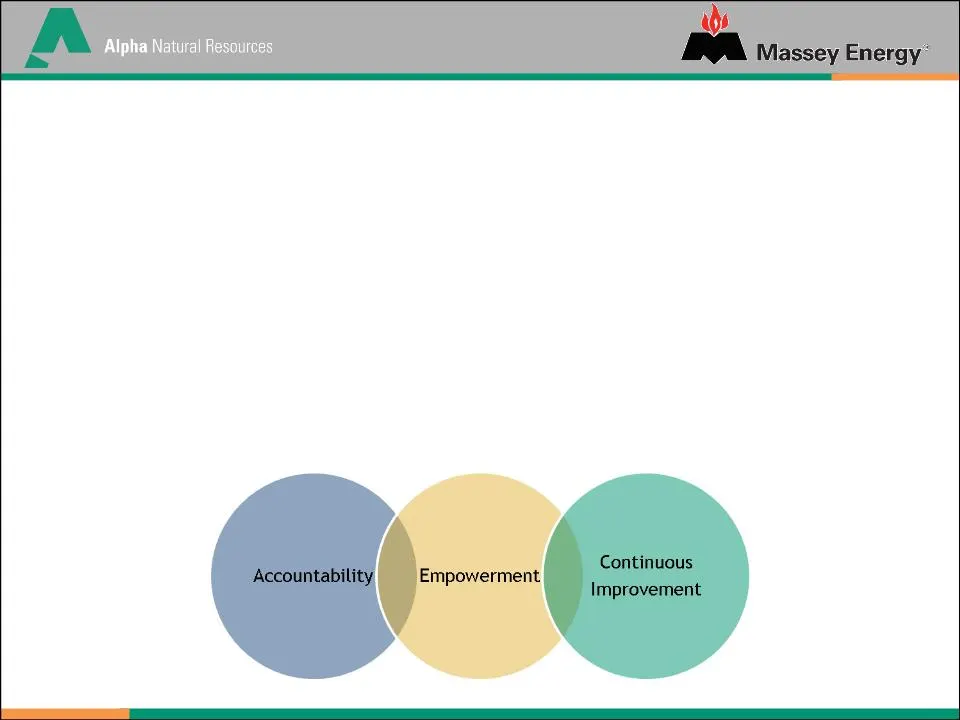
Industry Leading Safety Program: Running Right • Employee-driven process of continuous improvement in safety and environmental stewardship • Underpins best-in-class safety program • Combined company better positioned to: • Direct resources and commitment to safety, environment and workplace • Naviga
Slide 13: aby
aby A Alpha Natural Resources FA Massey Energy® uy FA Massey Energy®
Slide 14: Significant Expected Synergies
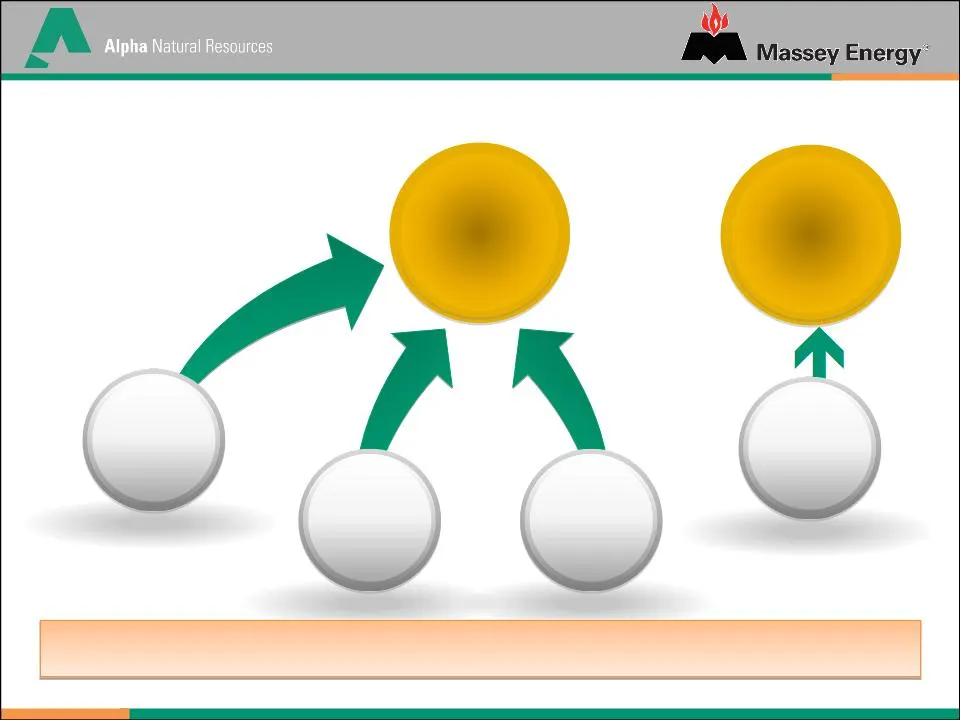
$150+ Million/yr $50+ Million/yr Significant Expected Synergies SG&A and Sourcing Marketing Operations Alpha & Massey Combination Offers Unique Synergy Opportunity Capital Allocation Efficiency
Slide 15: Strong 2011 Pro Forma Estimated Financial Outlook
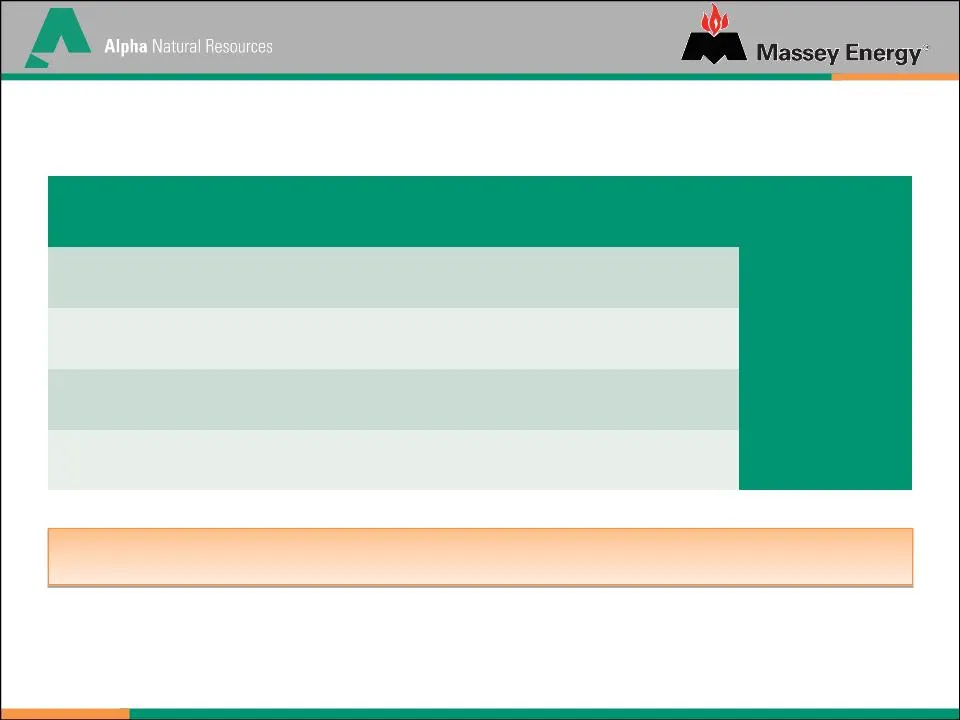
Alpha Massey Synergies Pro forma Production (mt)* 83.0 - 91.5 43 - 47 -- 126.0 - 138.5 Revenue ($ mm)** $4,492 $4,018 -- $8,510 EBITDA ($ mm)** $1,202 $984 $150 $2,336 CapEx ($ mm)* $340 - $440 $400 - $550 $740 - $990 Strong 2011 Pro Forma Estimated Financial Outlook Cash flow accretion expected in
Slide 16: Improved Capital Structure, Strong Liquidity and Free Cash Flow
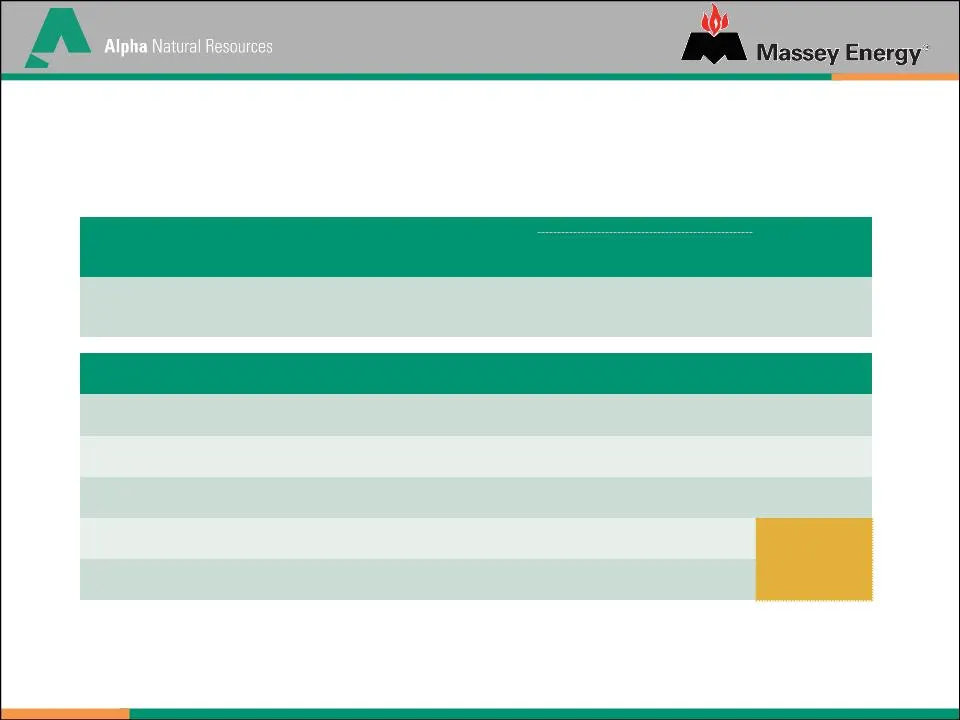
($ in millions) Alpha Massey Pro forma Post-closing LTM Adjusted EBITDA $786* $380* $1,166 Total Debt $820 $1,428 $2,900 Liquidity and Credit Statistics Cash & Equivalents & Marketable Securities $743 $477 $500 Available Revolver and A/R Securitization Facility** 831 124 850 Total Liquidity $1,574 $
Slide 17: Successful Integration Track Record
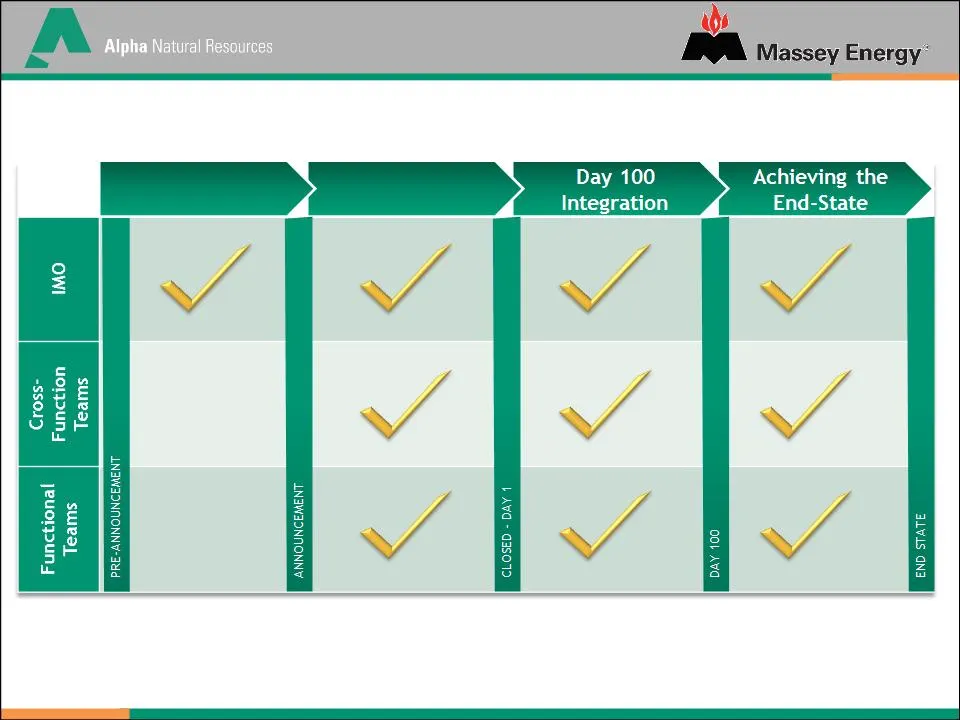
Day 1 Readiness (Signing to Closing) Preparation (Pre-Signing) Successful Integration Track Record • Foundation merger annual net synergies of more than $60 million have exceeded the targeted level of $45 million N/A N/A
Slide 18: A Compelling Combination
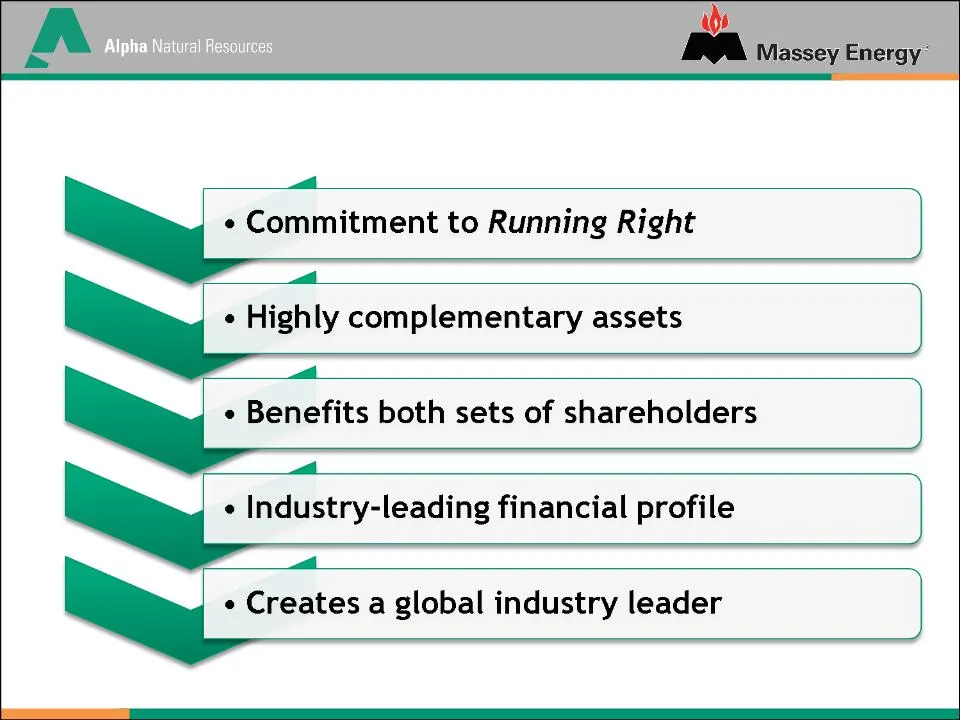
A Compelling Combination Commitment to Running Right Highly complementary assets Benefits both sets of shareholders Industry-leading financial profile Creates a global industry leader A Compelling Combination
Slide 19: Alpha + Massey: Creating an Industry Leader
Alpha + Massey: Creating an Industry Leader January 31, 2011
Source: SEC EDGAR · 8-K filed Jan 31, 2011
More decks from Massey Energy Co
 Merger or Acquisition (March 2011)18 slides · Mar 9, 2011
 BMO Capital Markets 2011 Global Metals & Mining Conference27 slides · Mar 1, 2011
 Credit Suisse Energy Summit 201126 slides · Feb 10, 2011
 Proxy Contest (May 2010)32 slides · May 5, 2010
 Proxy Contest (April 2010)26 slides · Apr 30, 2010
 Howard Weil Energy Conference 200851 slides · Apr 7, 2008