S&W Seed Company · OTC:SANW
S&W Seed — Investor Presentation (June 2017)
46 slides from S&W Seed's investor presentation, June 2017
Slide 1: Corporate Presentation Q2 FY17
NASDAQ: SANW CORPORATE PRESENTATION Q2 FY17
Slide 2: Forward-Looking Statements
Forward-Looking Statements This presentation may contain "forward-looking statements" within the meaning of Section 27A of the Securities Act of 1933, as amended, and Section 21E of the Securities Exchange Act of 1934, as amended, and such forward-looking statements are made pursuant to the safe har
Slide 3: S&W Seed Company
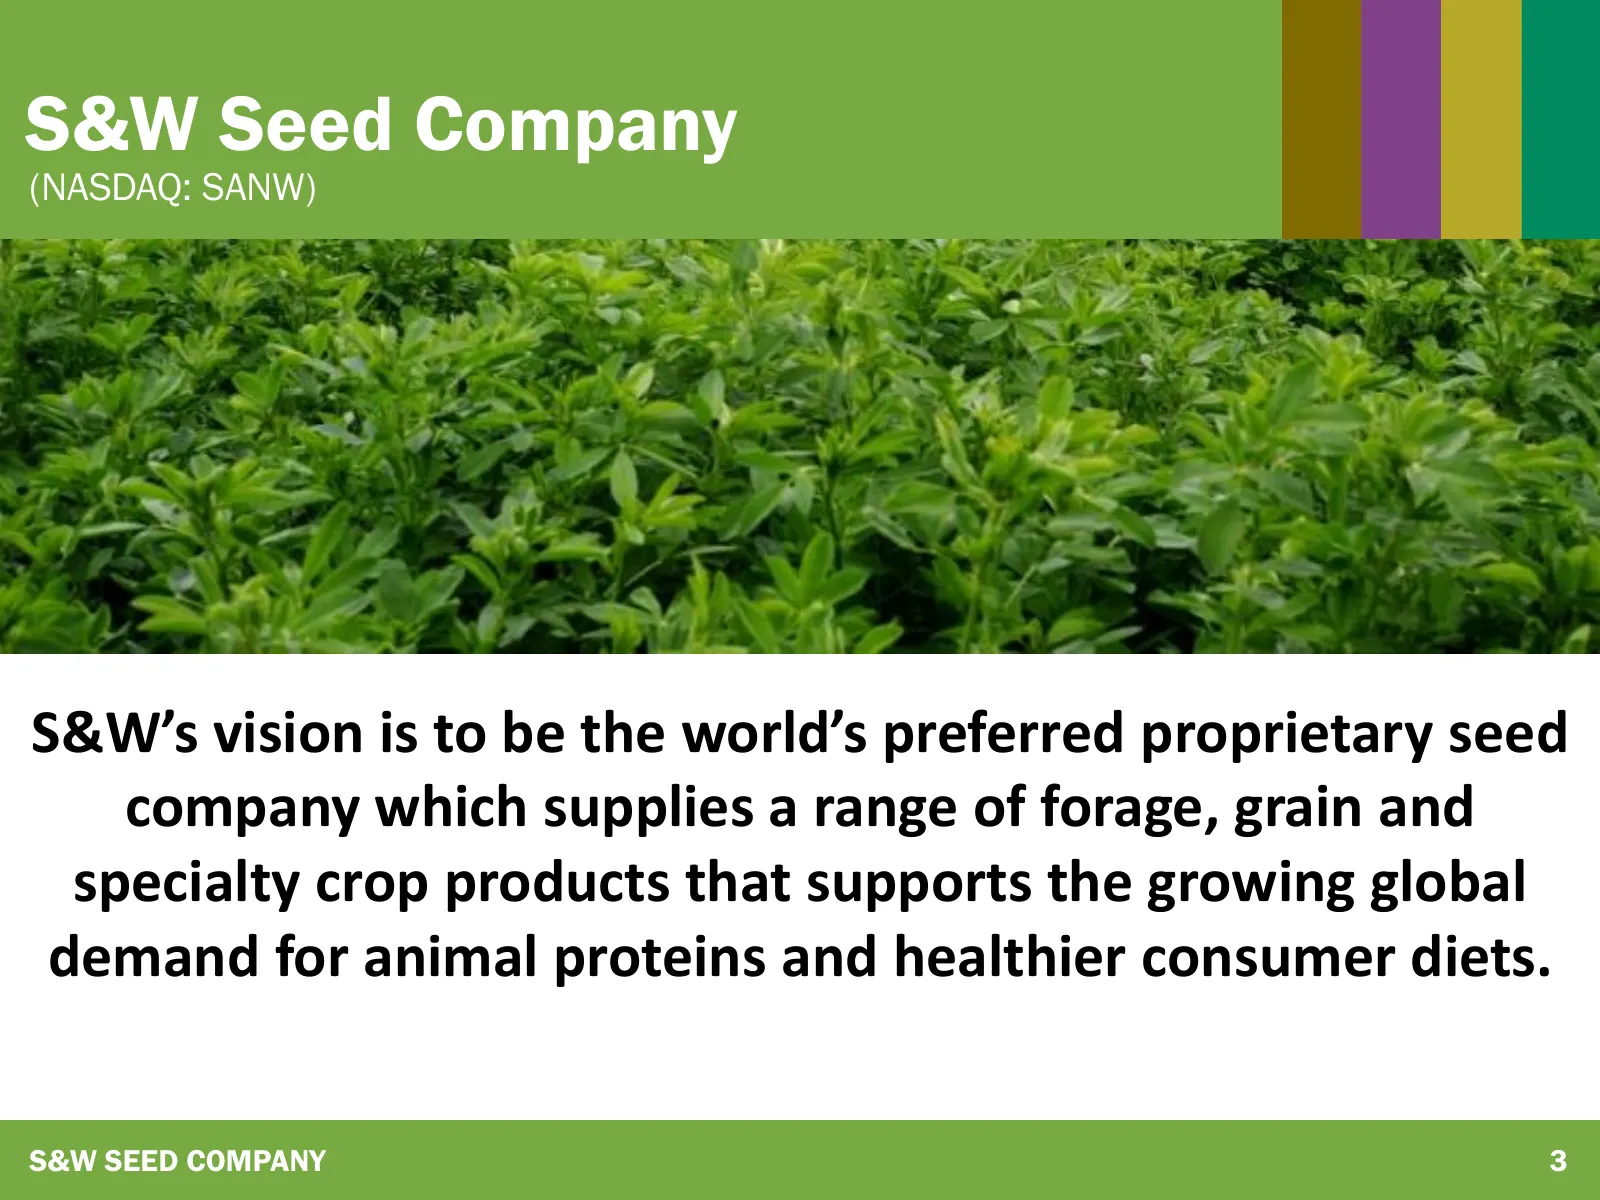
S&W Seed Company (NASDAQ: SANW) S&W’s vision is to be the world’s preferred proprietary seed company which supplies a range of forage, grain and specialty crop products that supports the growing global demand for animal proteins and healthier consumer diets. S&W SEED COMPANY 3
Slide 4: S&W Seed Company
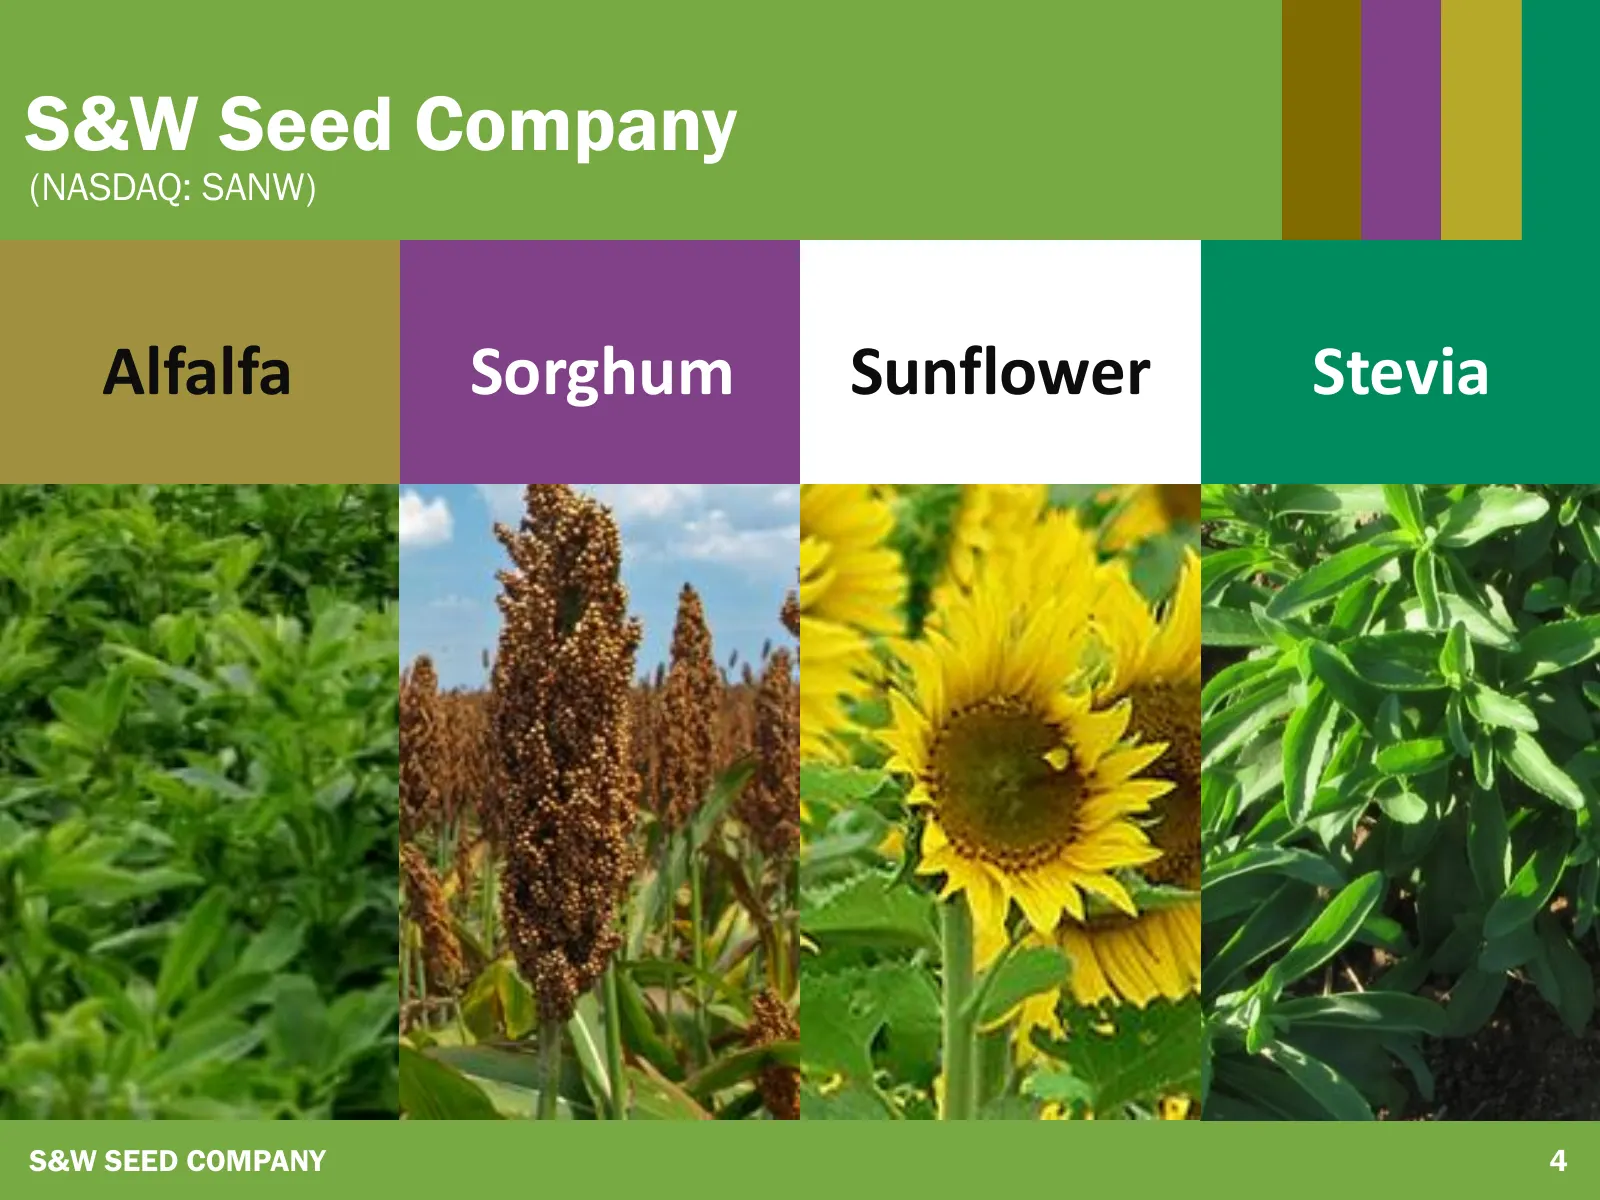
S&W Seed Company (NASDAQ: SANW) Alfalfa Sorghum Sunflower Stevia S&W SEED COMPANY 4
Slide 5: Strong Execution
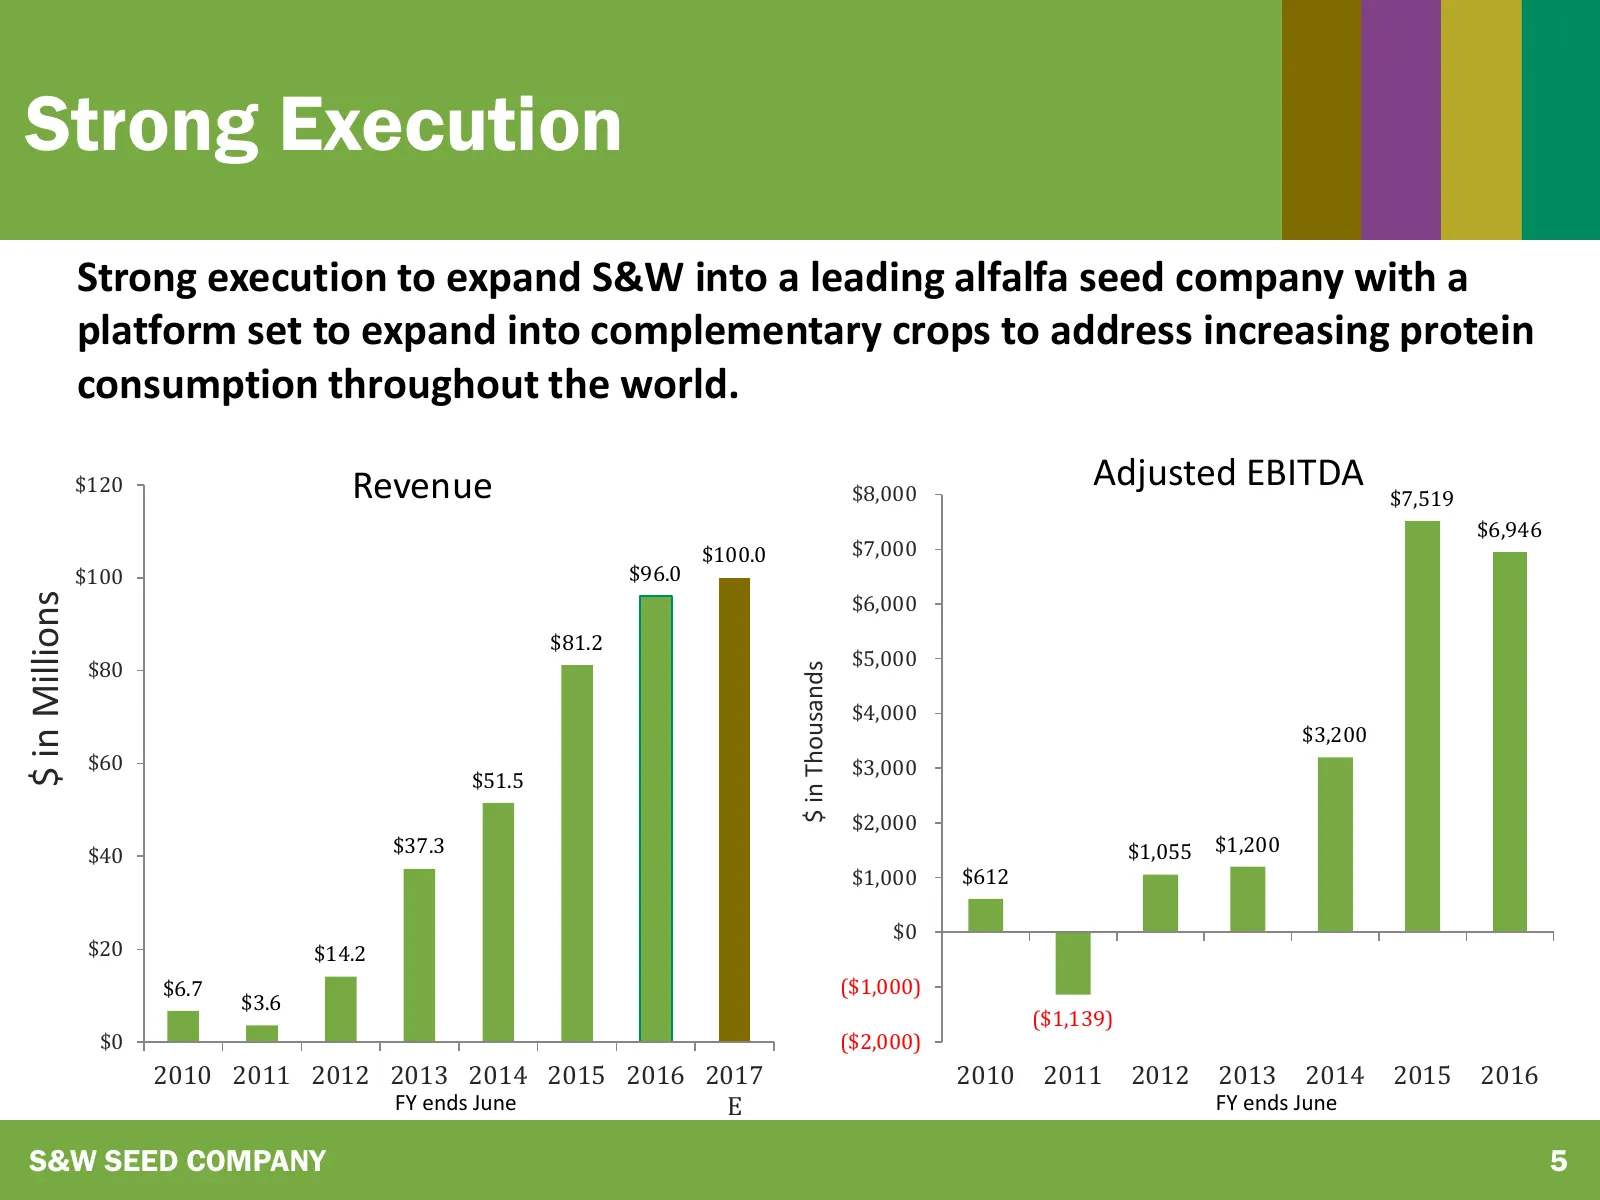
Strong Execution Strong execution to expand S&W into a leading alfalfa seed company with a platform set to expand into complementary crops to address increasing protein consumption throughout the world. $120 Revenue $8,000 Adjusted EBITDA $7,519 $6,946 $100.0 $7,000 $100 $96.0 $6,000 $ in Millions $
Slide 6: Compelling Market Trends
COMPELLING MARKET TRENDS
Slide 7: Alfalfa is a Highly Significant Crop
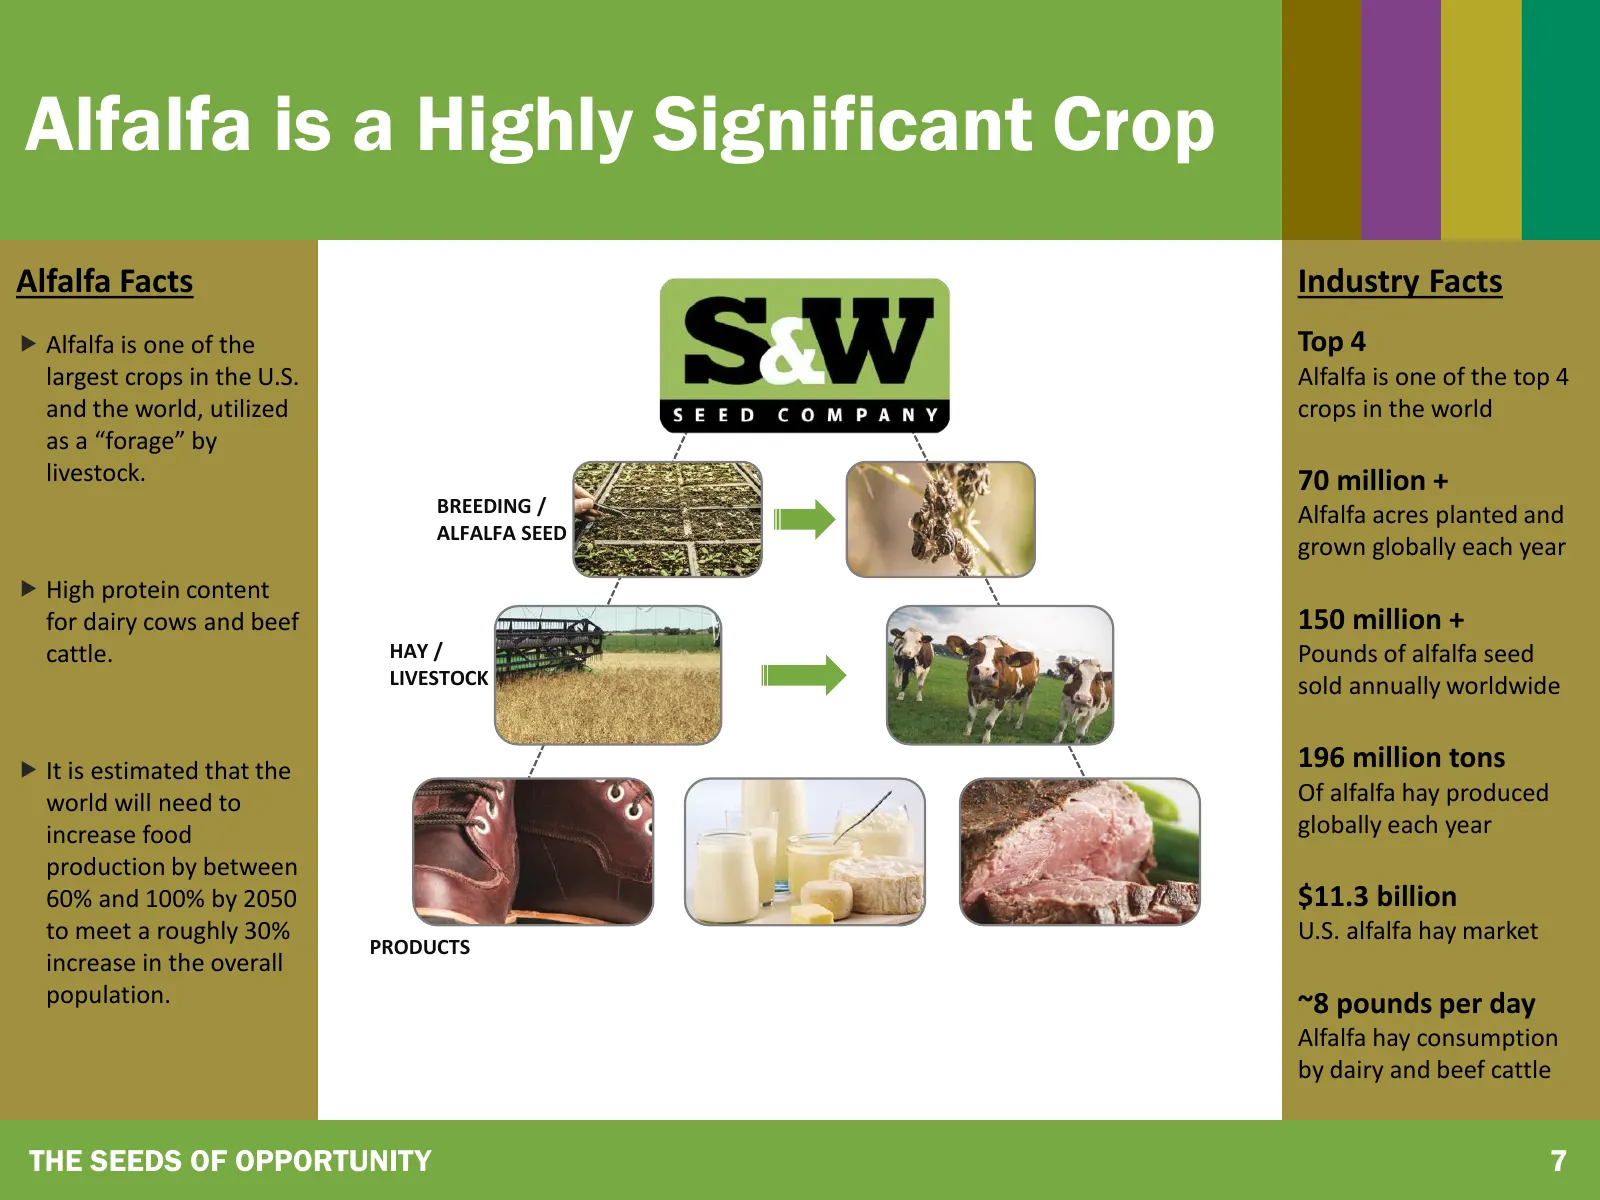
Alfalfa is a Highly Significant Crop Alfalfa Facts Industry Facts Alfalfa is one of the Top 4 largest crops in the U.S. Alfalfa is one of the top 4 and the world, utilized crops in the world as a “forage” by livestock. 70 million + BREEDING / Alfalfa acres planted and ALFALFA SEED grown globally e
Slide 8: Global Drivers
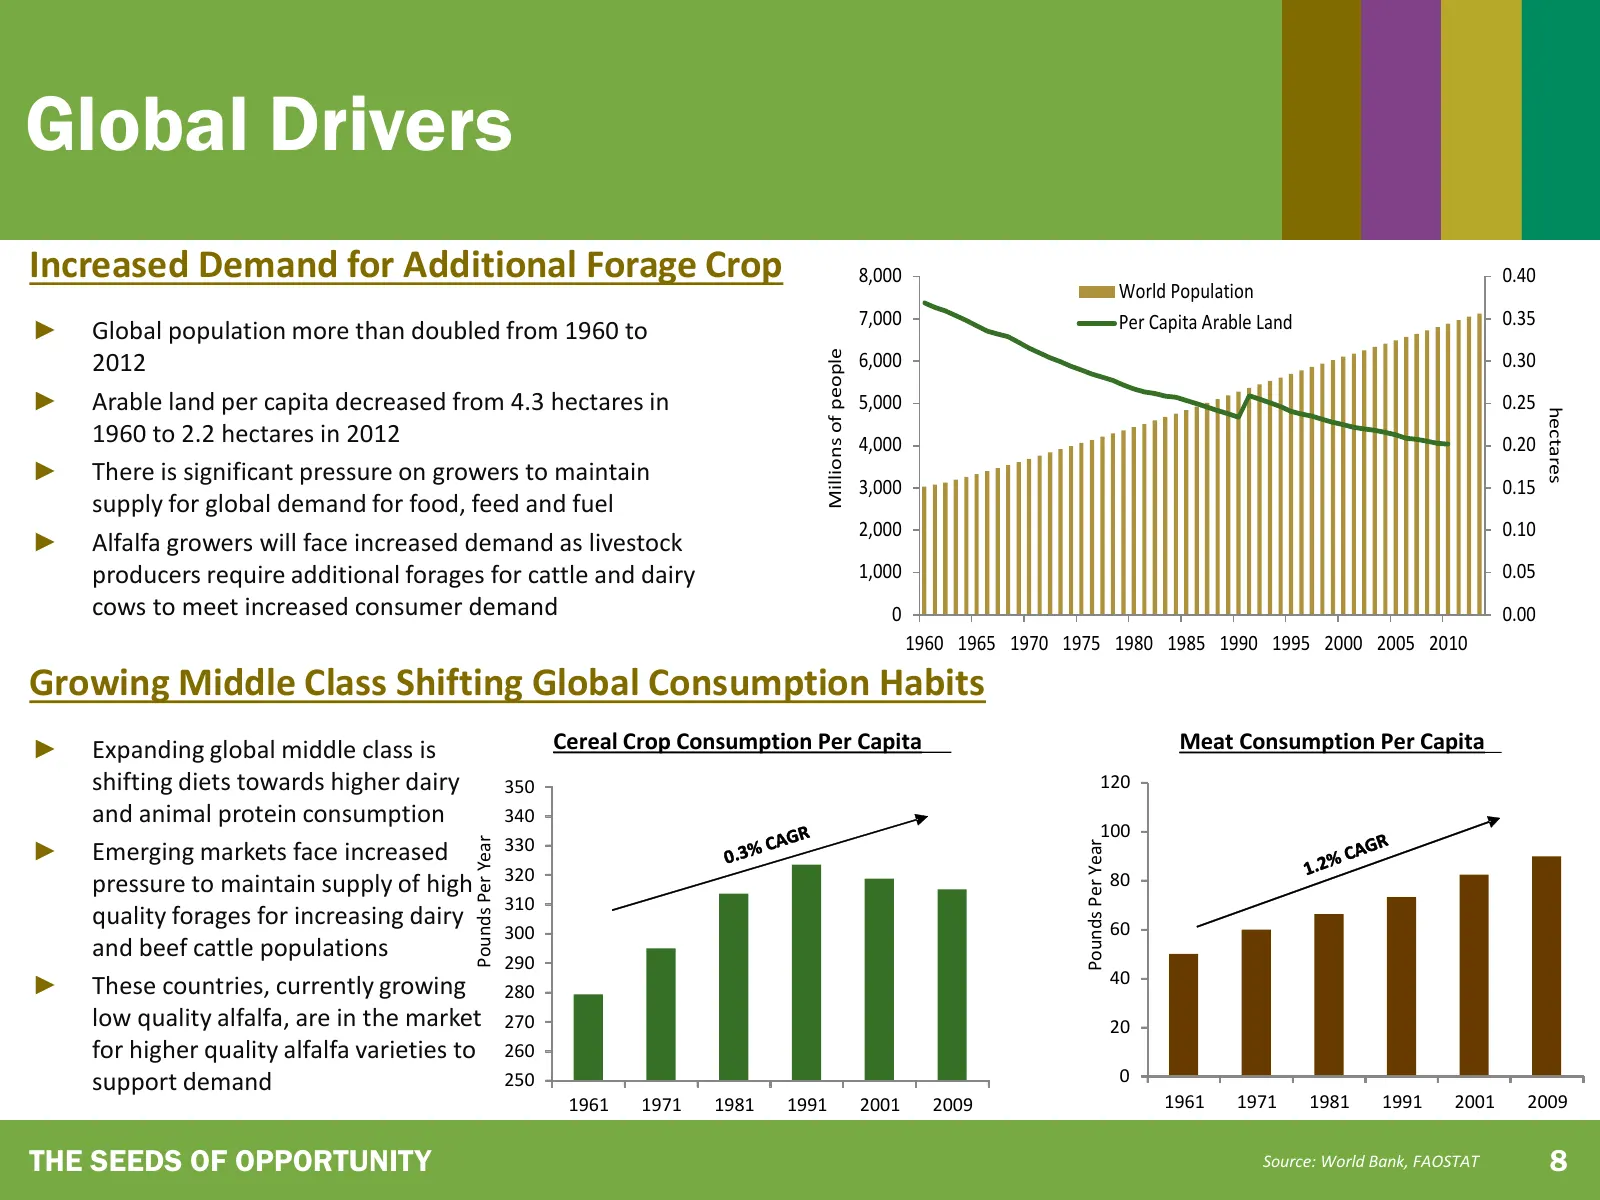
Global Drivers Increased Demand for Additional Forage Crop 8,000 0.40 World Population 7,000 Per Capita Arable Land 0.35 ► Global population more than doubled from 1960 to Millions of people 2012 6,000 0.30 ► Arable land per capita decreased from 4.3 hectares in 5,000 0.25 hectares 1960 to 2.2 hecta
Slide 9: Global Leaders in Alfalfa Seed
GLOBAL LEADERS IN ALFALFA SEED
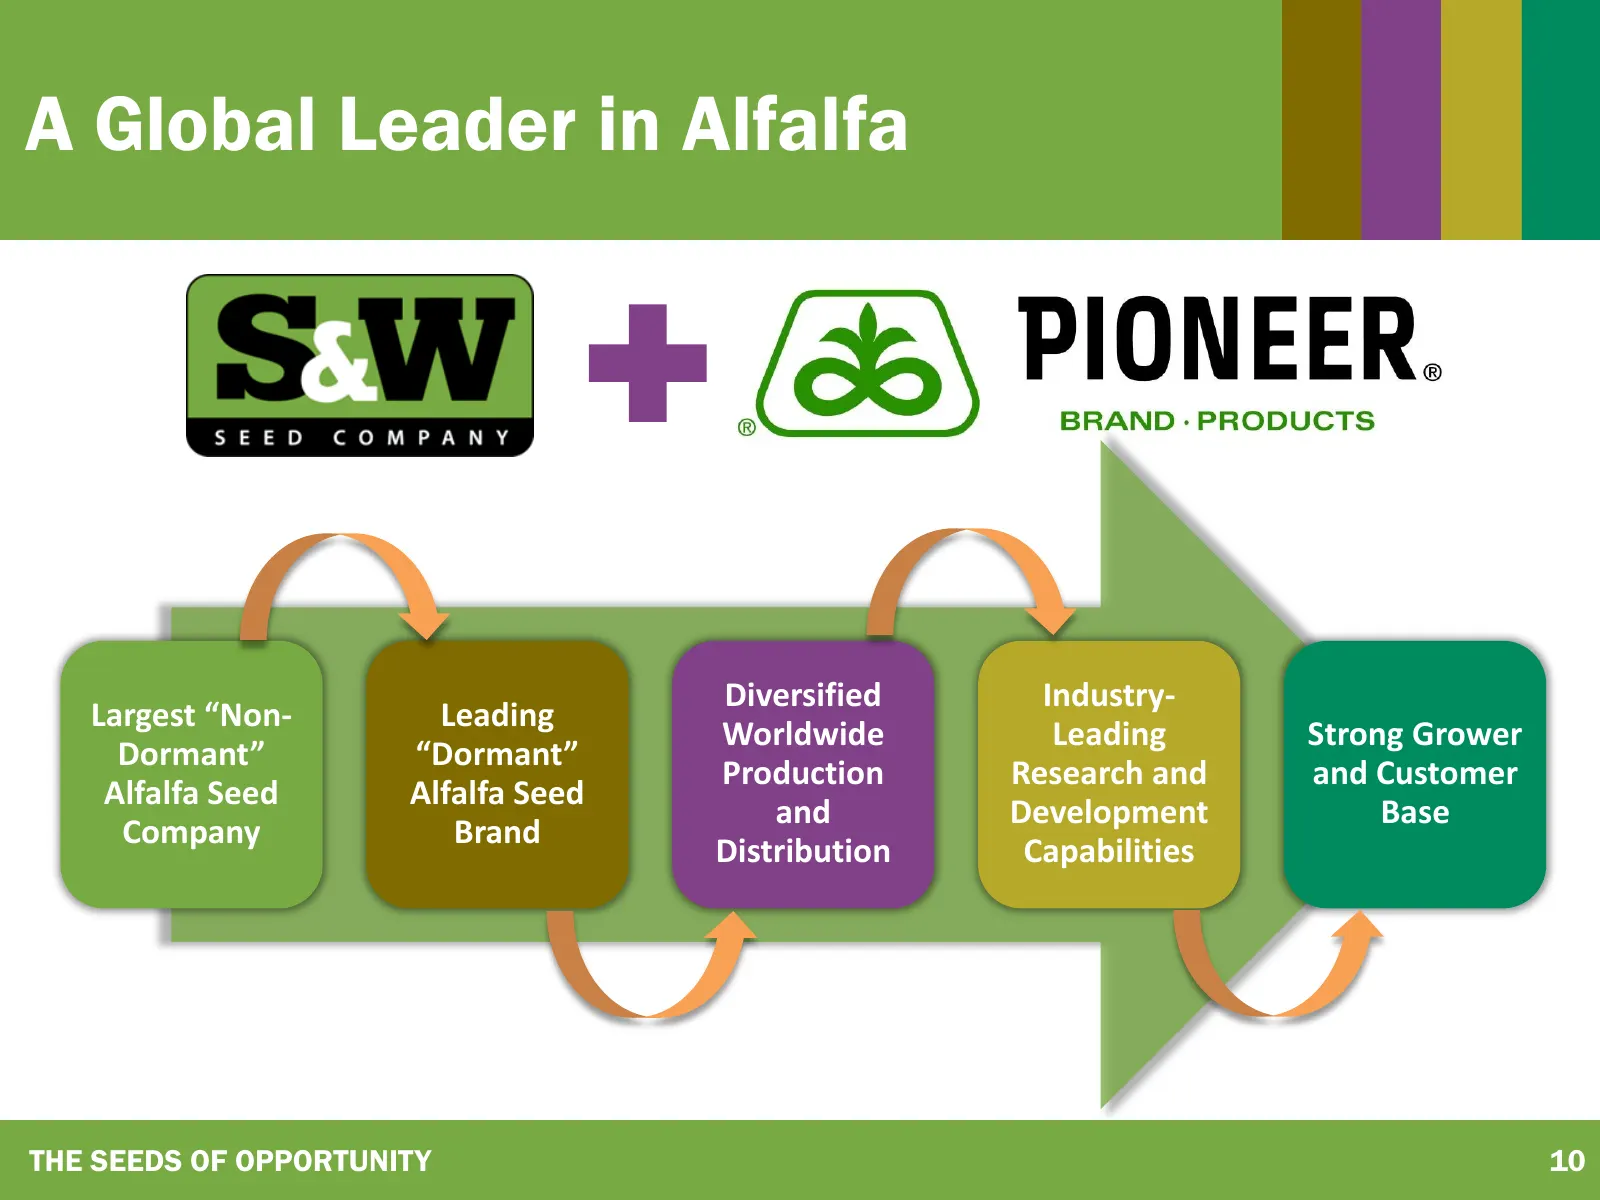
Slide 10: A Global Leader in Alfalfa
A Global Leader in Alfalfa Diversified Industry- Largest “Non- Leading Worldwide Leading Strong Grower Dormant” “Dormant” Production Research and and Customer Alfalfa Seed Alfalfa Seed and Development Base Company Brand Distribution Capabilities THE SEEDS OF OPPORTUNITY 10
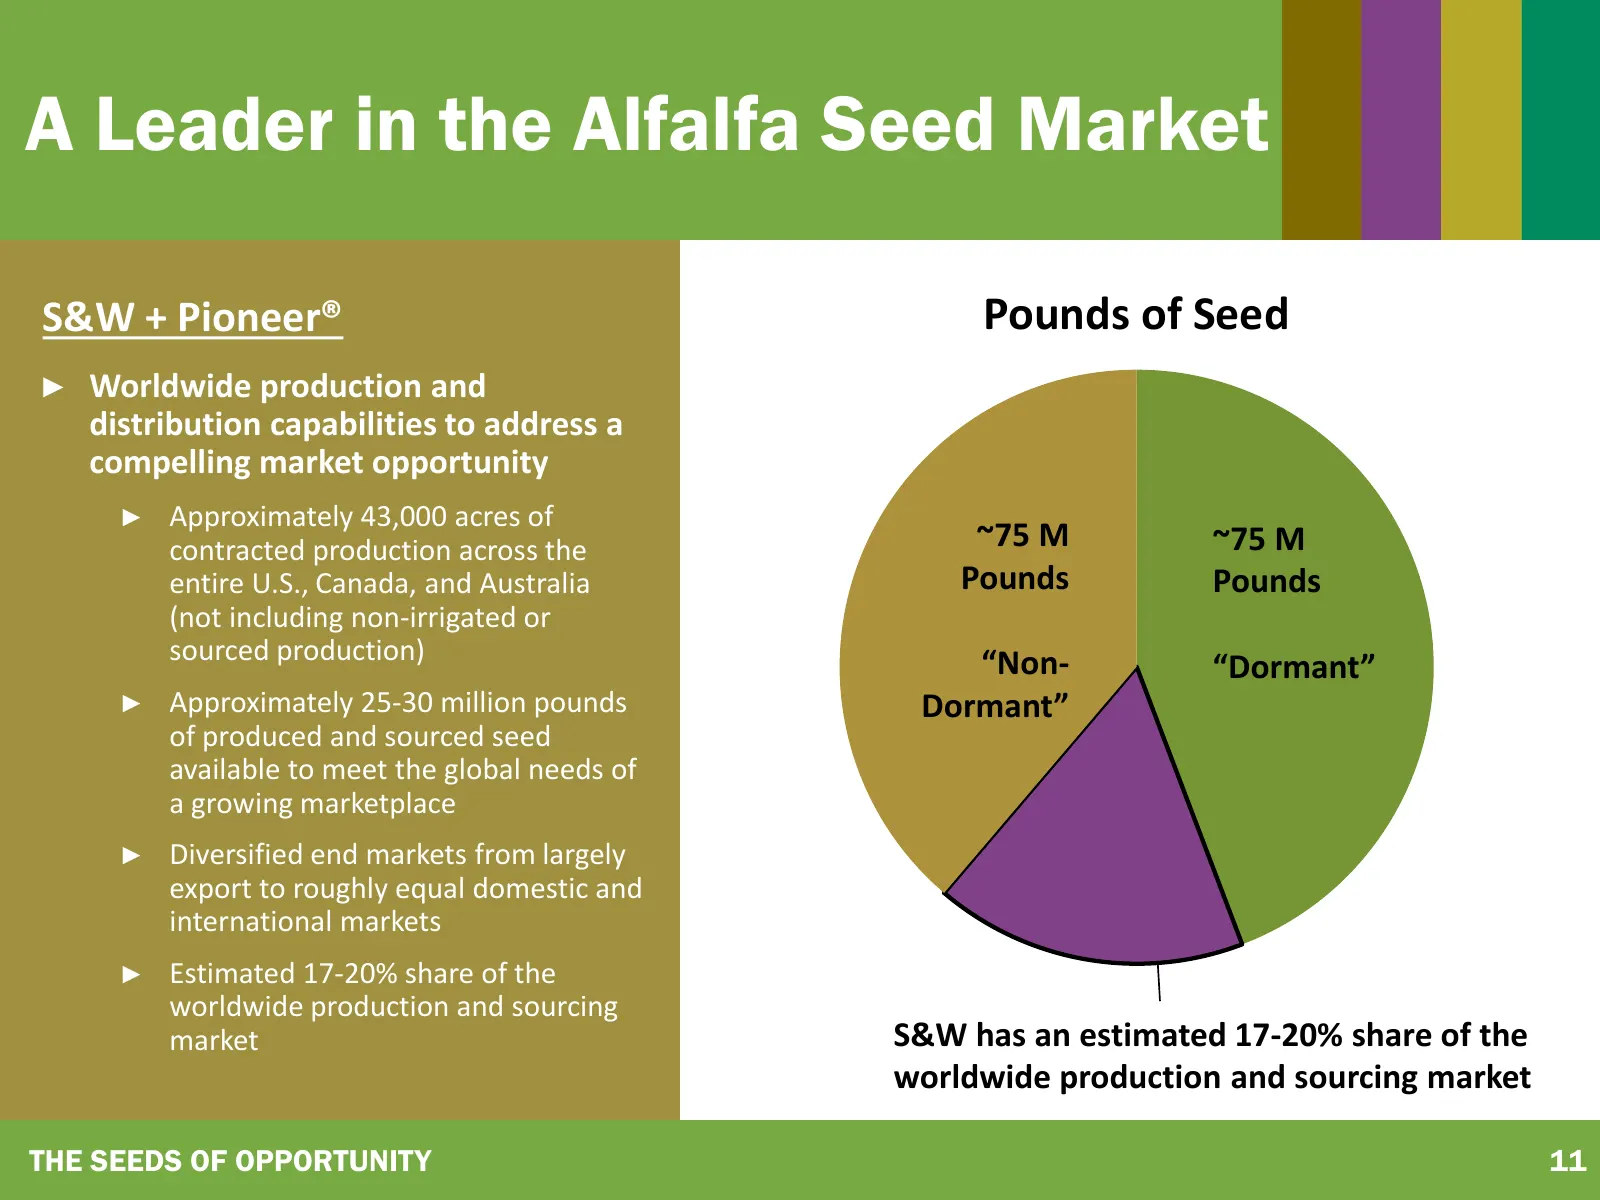
Slide 11: A Leader in the Alfalfa Seed Market
A Leader in the Alfalfa Seed Market S&W + Pioneer® Pounds of Seed ► Worldwide production and distribution capabilities to address a compelling market opportunity ► Approximately 43,000 acres of contracted production across the ~75 M ~75 M entire U.S., Canada, and Australia Pounds Pounds (not includi
Slide 12: Unparalleled Product Offerings
UNPARALLELED PRODUCT OFFERINGS
Slide 13: Strong IP (Product Portfolio)
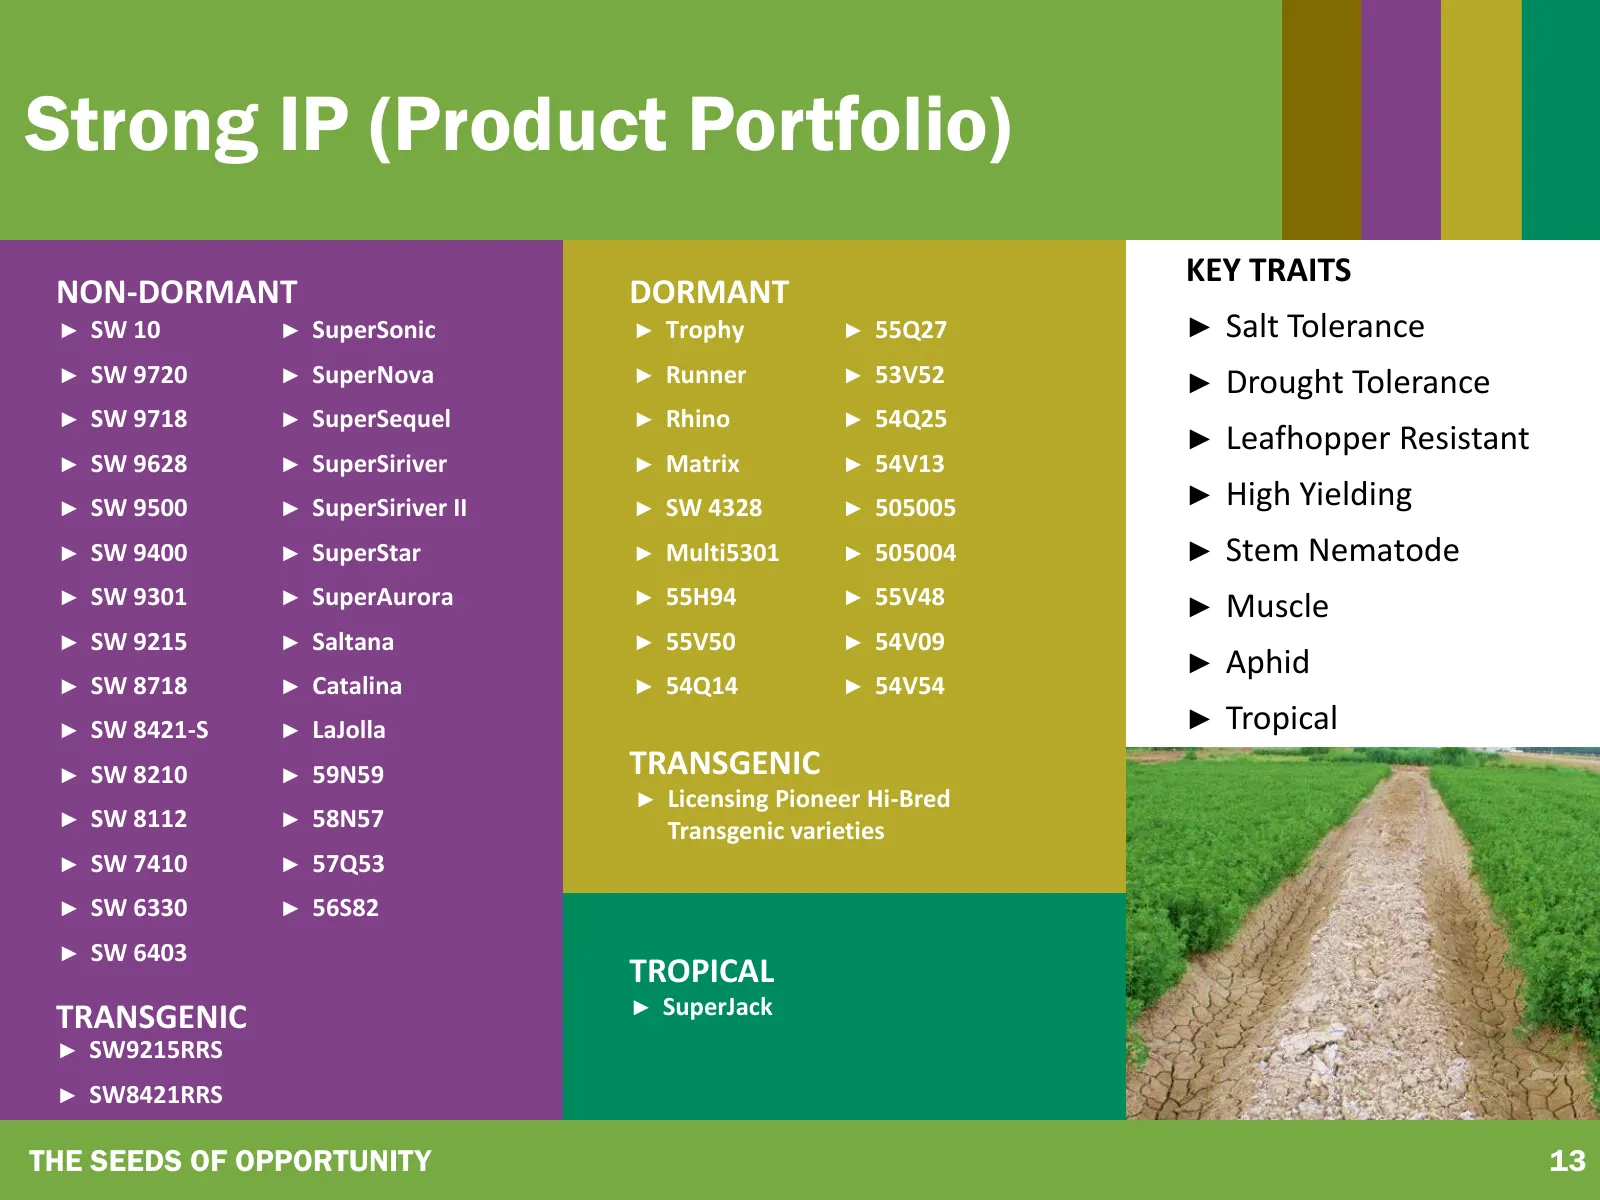
Strong IP (Product Portfolio) KEY TRAITS NON-DORMANT DORMANT ► SW 10 ► SuperSonic ► Trophy ► 55Q27 ► Salt Tolerance ► SW 9720 ► SuperNova ► Runner ► 53V52 ► Drought Tolerance ► SW 9718 ► SuperSequel ► Rhino ► 54Q25 ► Leafhopper Resistant ► SW 9628 ► SuperSiriver ► Matrix ► 54V13 ► SW 9500 ► SuperSir
Slide 14: Large Diversified Production
LARGE DIVERSIFIED PRODUCTION
Slide 15: Diversified Production
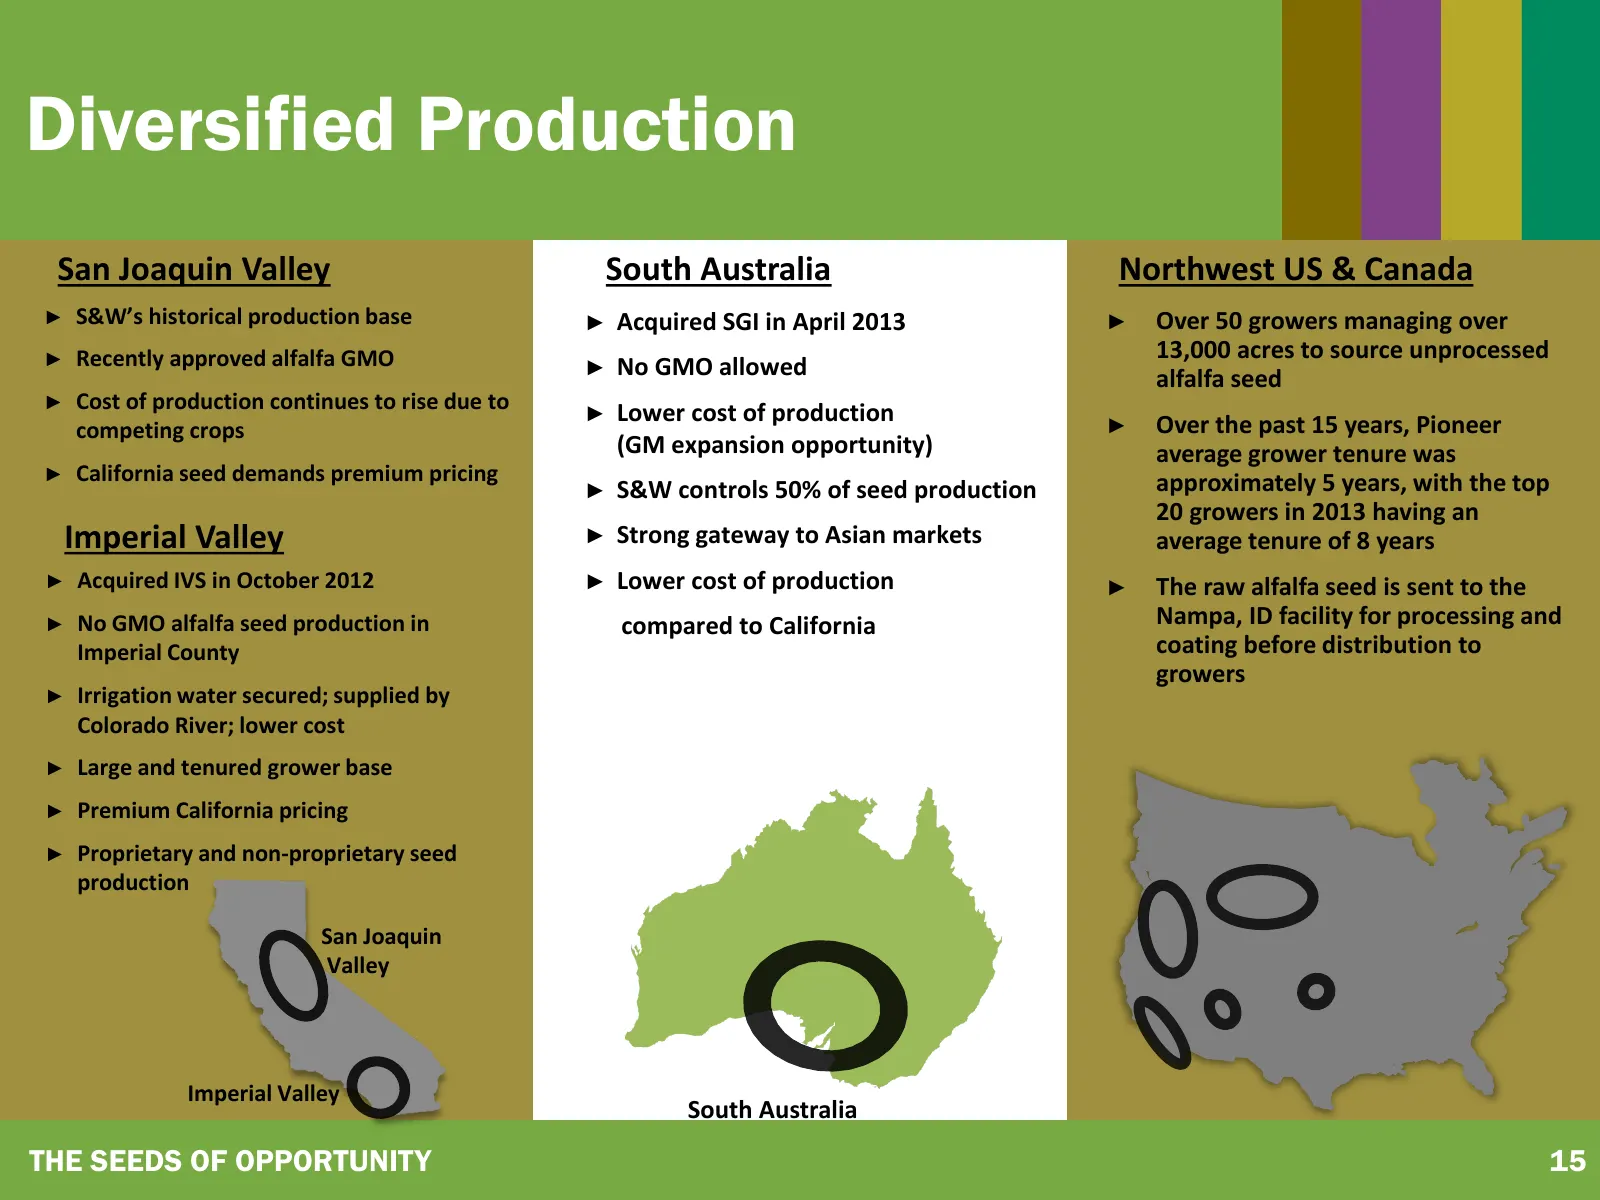
Diversified Production San Joaquin Valley South Australia Northwest US & Canada ► S&W’s historical production base ► Acquired SGI in April 2013 ► Over 50 growers managing over ► Recently approved alfalfa GMO 13,000 acres to source unprocessed ► No GMO allowed alfalfa seed ► Cost of production contin
Slide 16: Strong Production Platform
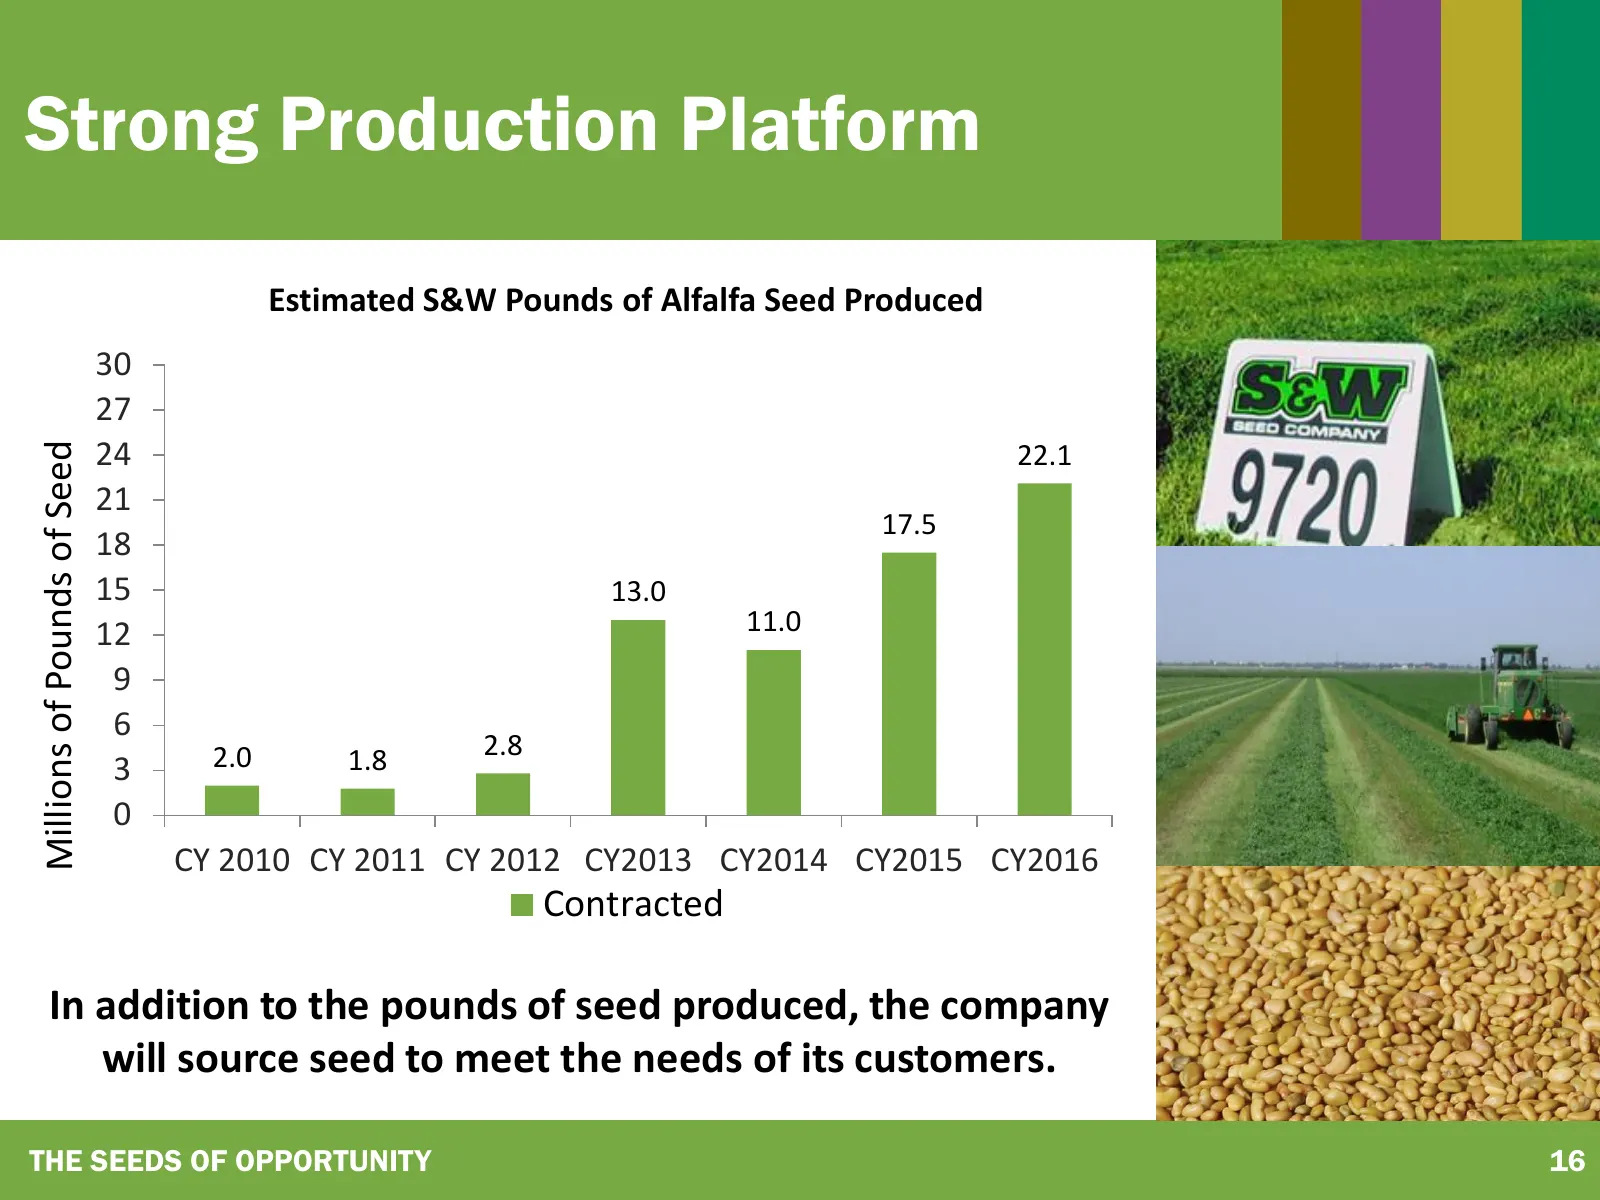
Strong Production Platform Estimated S&W Pounds of Alfalfa Seed Produced 30 27 24 Millions of Pounds of Seed 22.1 21 17.5 18 15 13.0 12 11.0 9 6 2.0 1.8 2.8 3 0 CY 2010 CY 2011 CY 2012 CY2013 CY2014 CY2015 CY2016 Contracted In addition to the pounds of seed produced, the company will source seed to
Slide 17: Global Distribution
ee Fy kal We SMa 7, 4 patel PP)?
Slide 18: Global Distribution Network
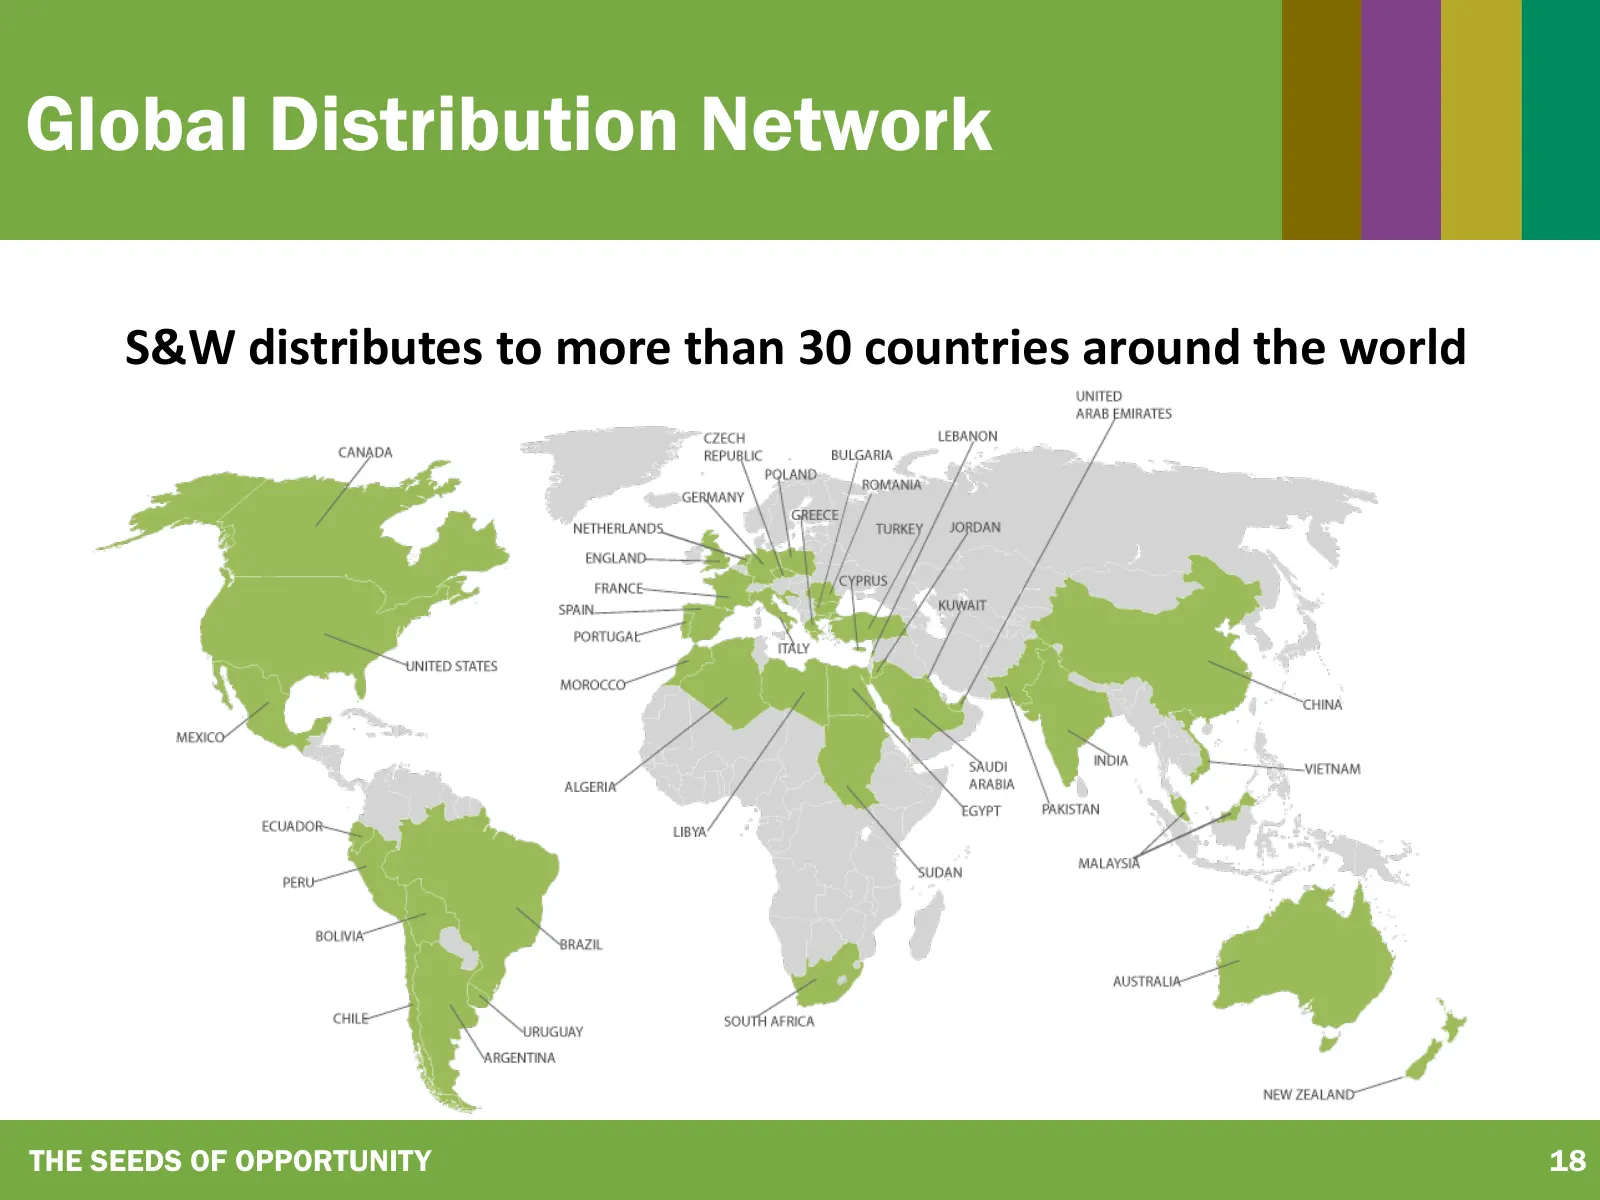
Global Distribution Network S&W distributes to more than 30 countries around the world THE SEEDS OF OPPORTUNITY 18
Slide 19: Distribution Agreements
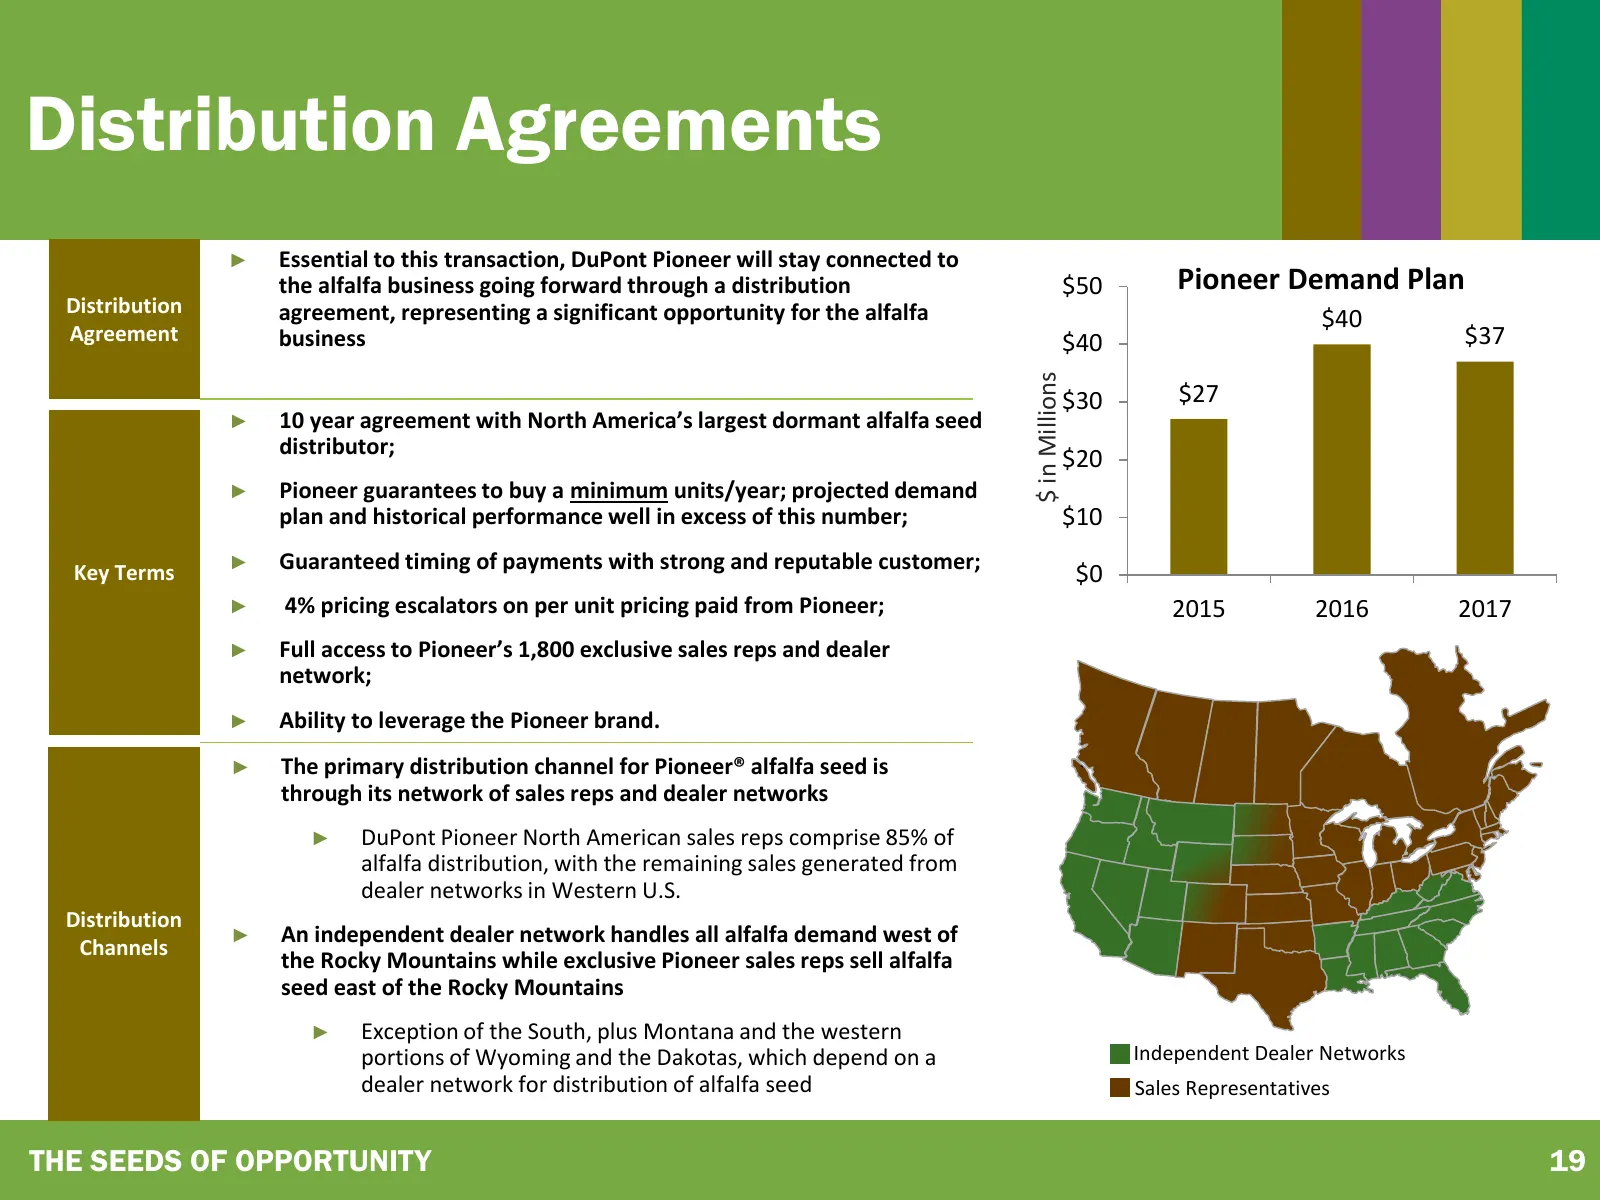
Distribution Agreements ► Essential to this transaction, DuPont Pioneer will stay connected to the alfalfa business going forward through a distribution $50 Pioneer Demand Plan Distribution agreement, representing a significant opportunity for the alfalfa $40 Agreement business $40 $37 $ in Millions
Slide 20: World-Class Research & Development
WORLD-CLASS RESEARCH & DEVELOPMENT
Slide 21: Leading Research & Development
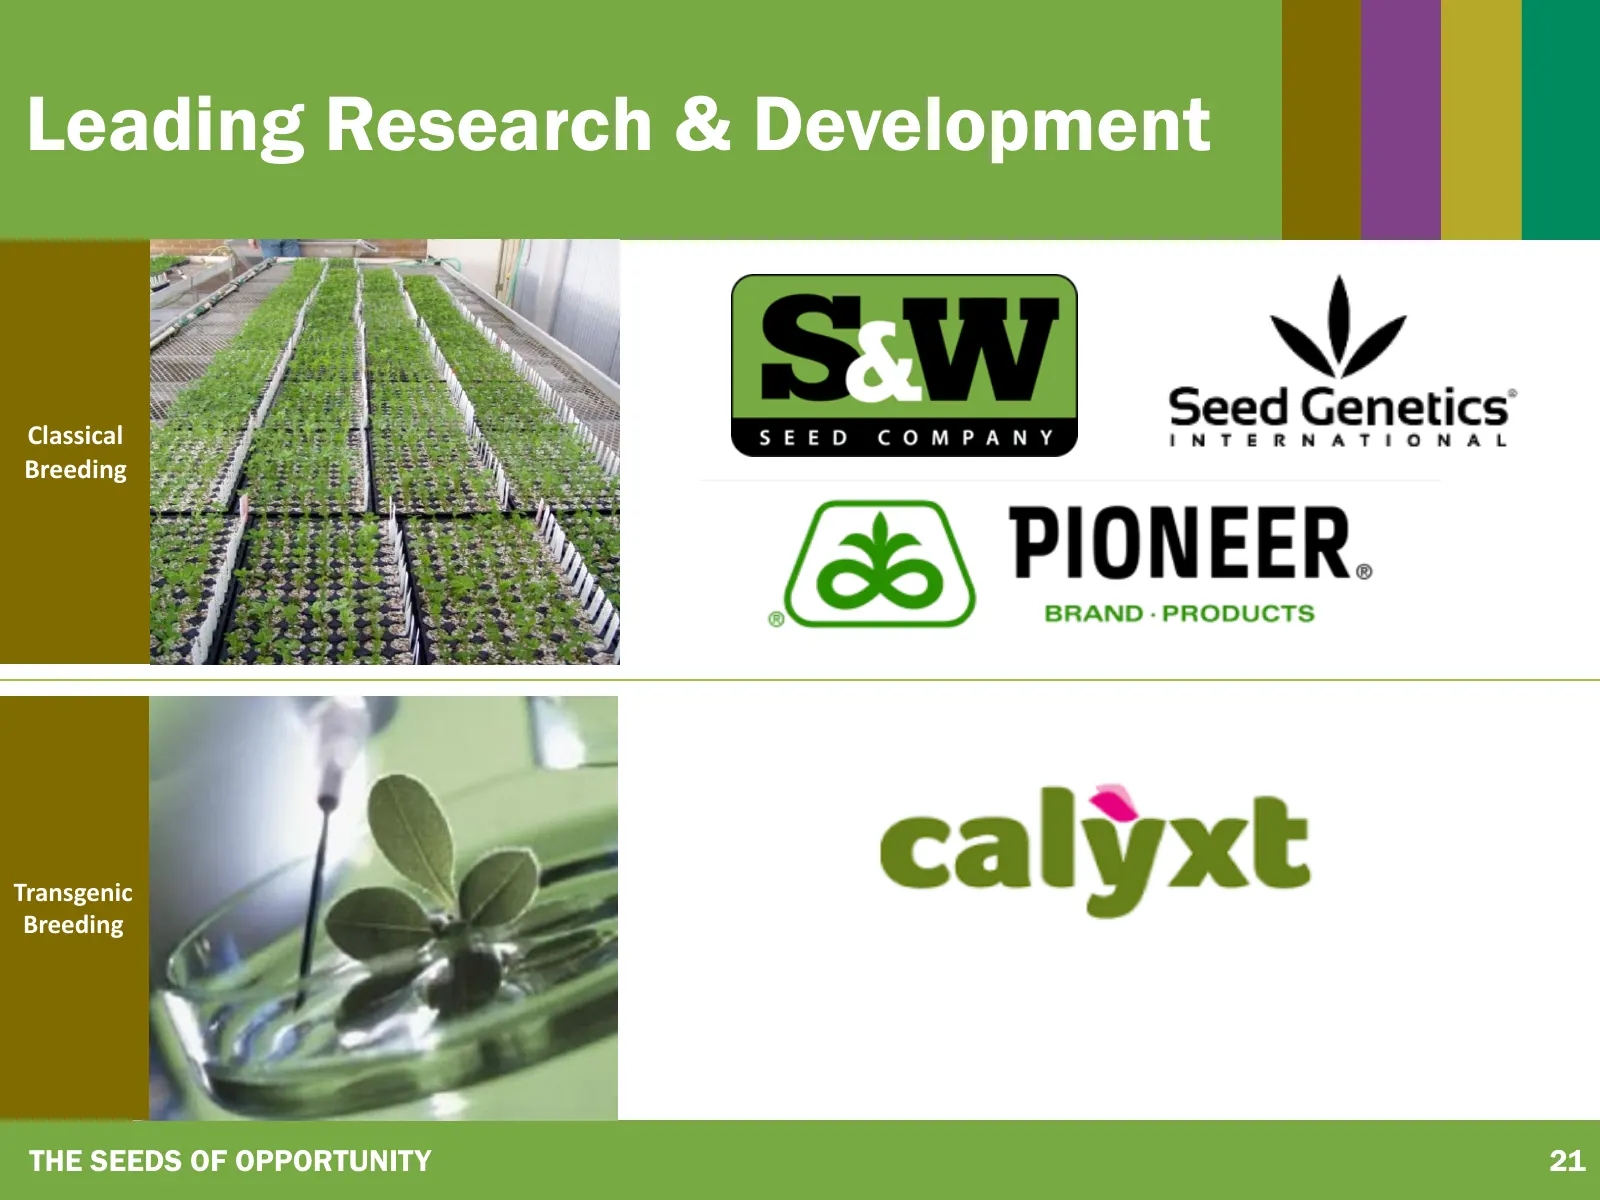
Leading Research & Development Classical Breeding Transgenic Breeding THE SEEDS OF OPPORTUNITY 21
Slide 22: Leading Alfalfa Research
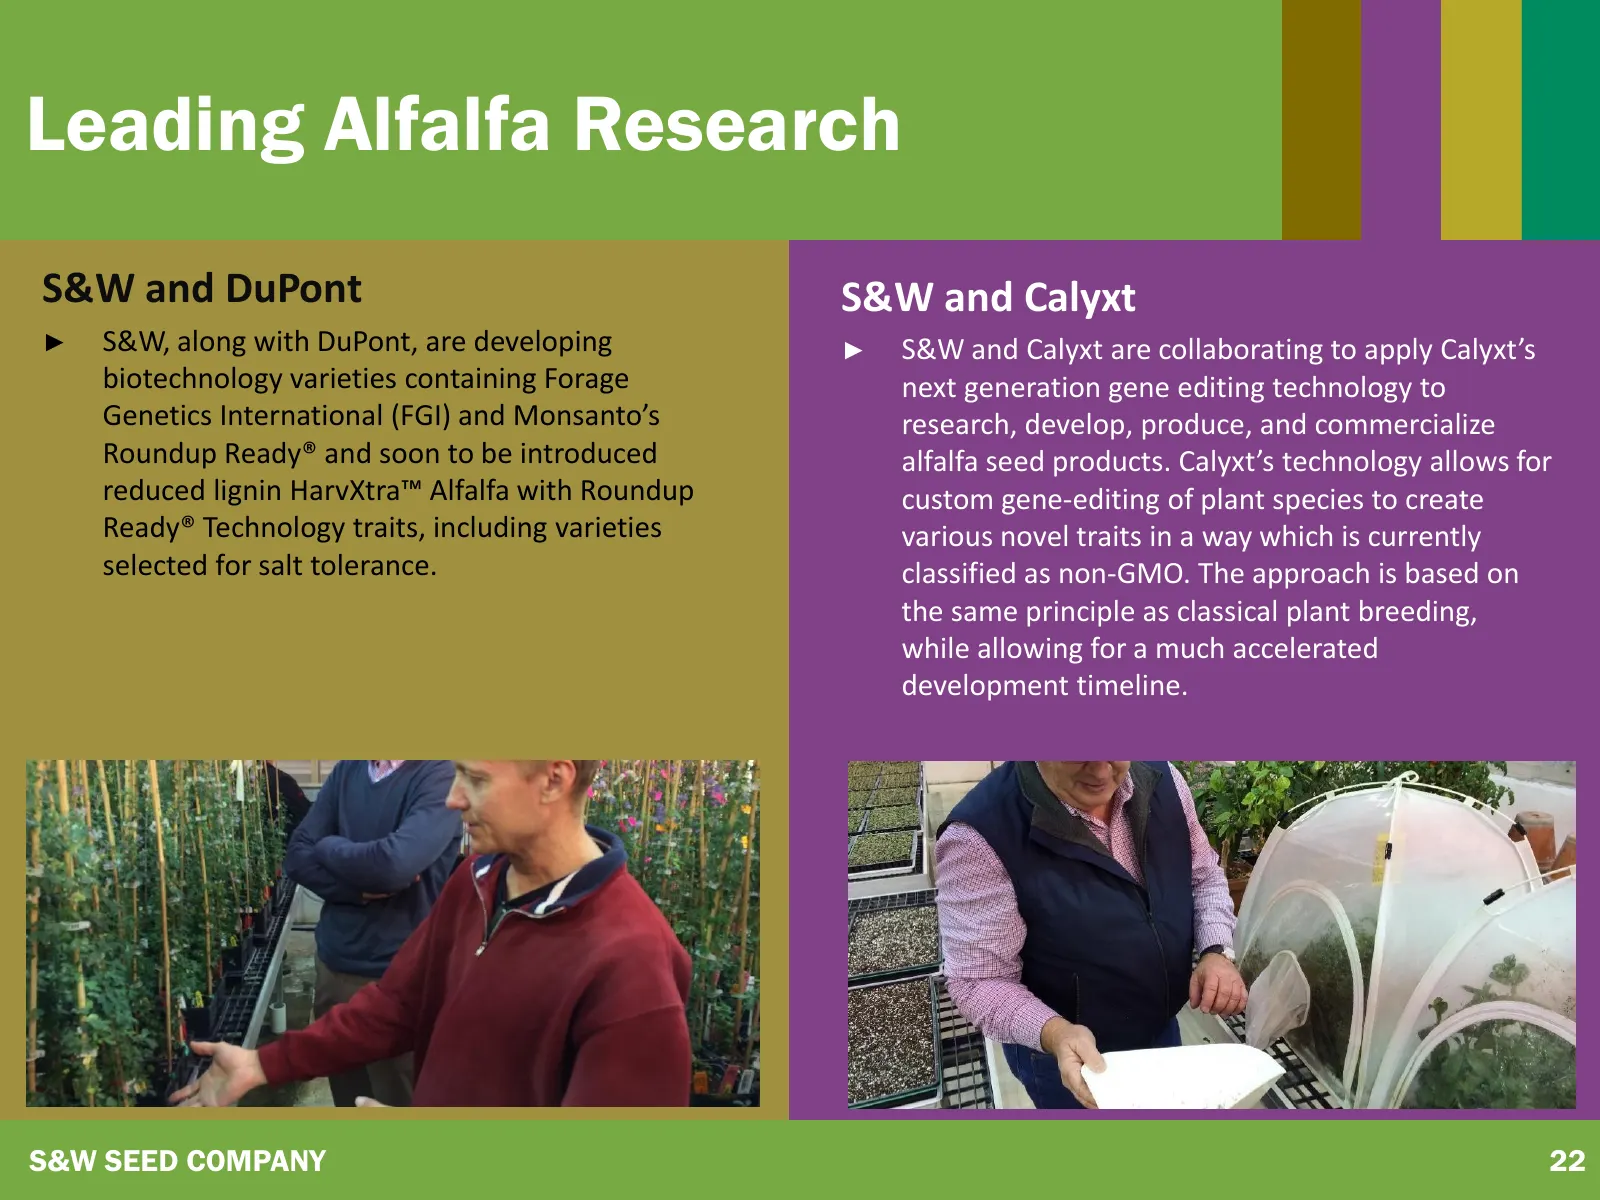
Leading Alfalfa Research S&W and DuPont S&W and Calyxt ► S&W, along with DuPont, are developing ► S&W and Calyxt are collaborating to apply Calyxt’s biotechnology varieties containing Forage next generation gene editing technology to Genetics International (FGI) and Monsanto’s research, develop, pro
Slide 23: Sorghum & Sunflower Expansion
SORGHUM & SUNFLOWER EXPANSION
Slide 24: Sorghum
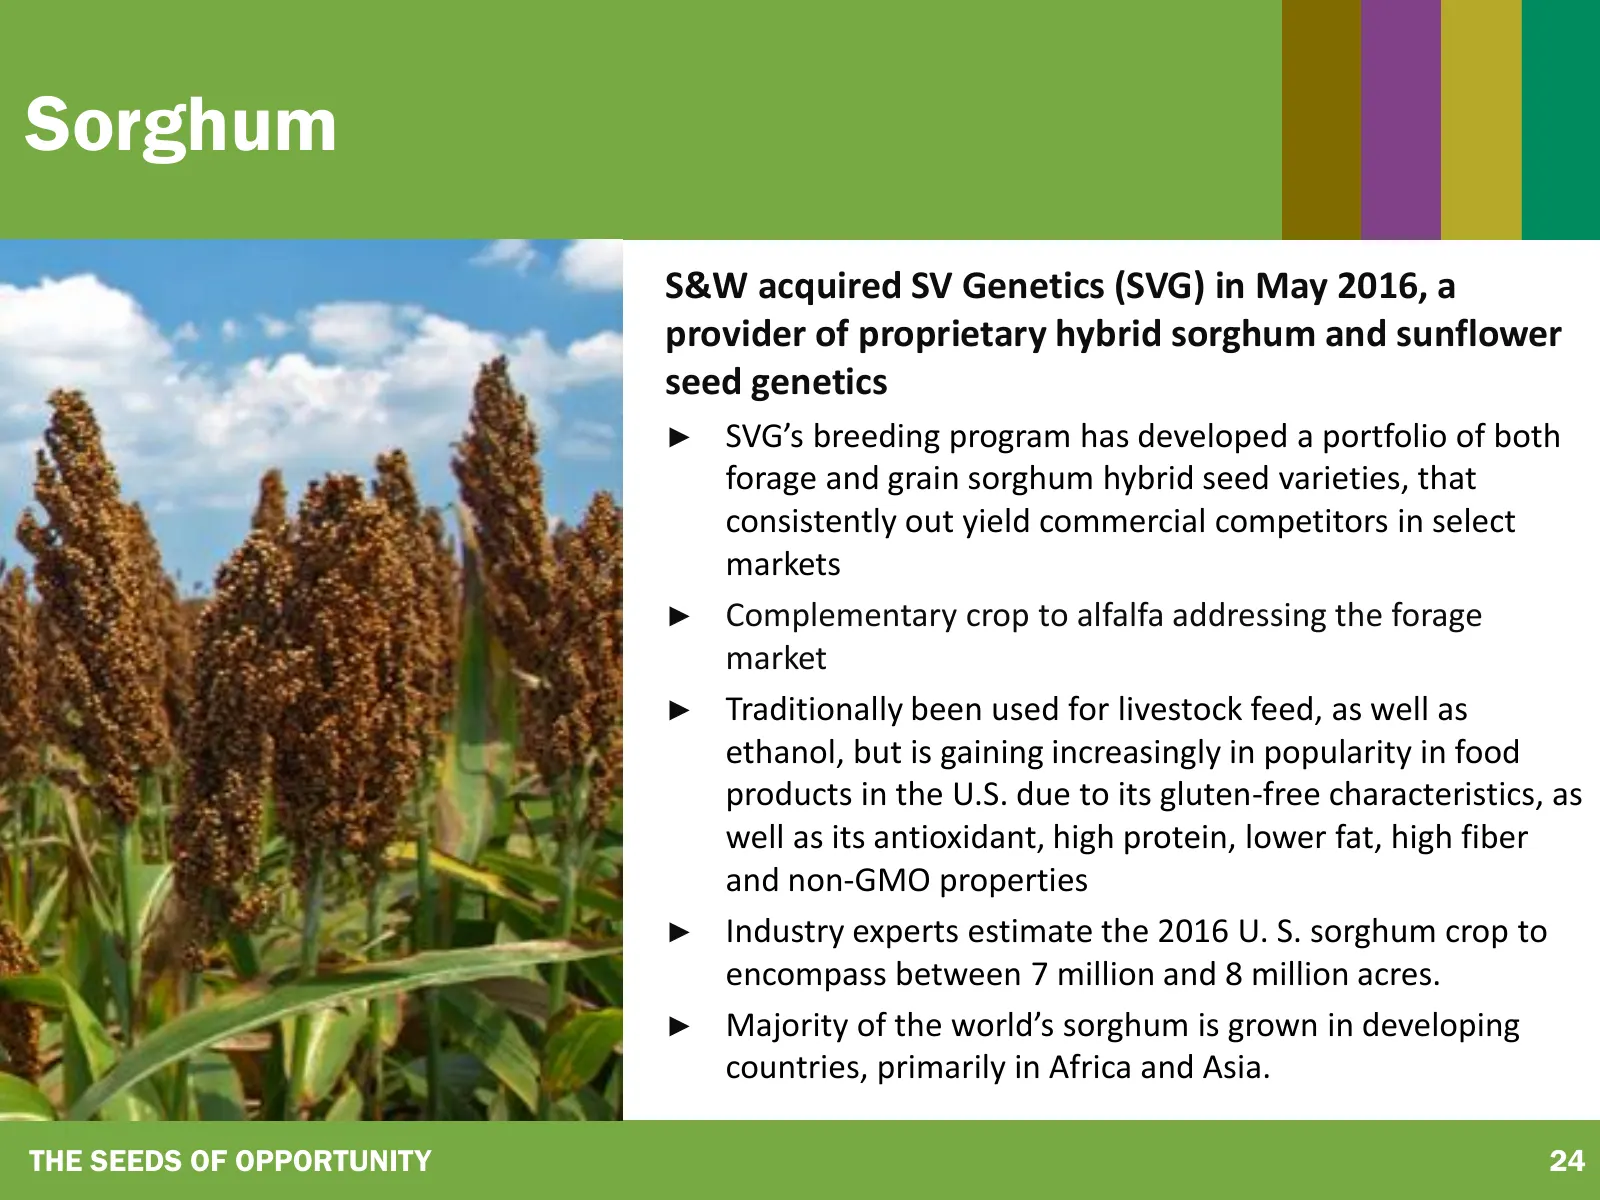
Sorghum S&W acquired SV Genetics (SVG) in May 2016, a provider of proprietary hybrid sorghum and sunflower seed genetics ► SVG’s breeding program has developed a portfolio of both forage and grain sorghum hybrid seed varieties, that consistently out yield commercial competitors in select markets ► C
Slide 25: Sunflower
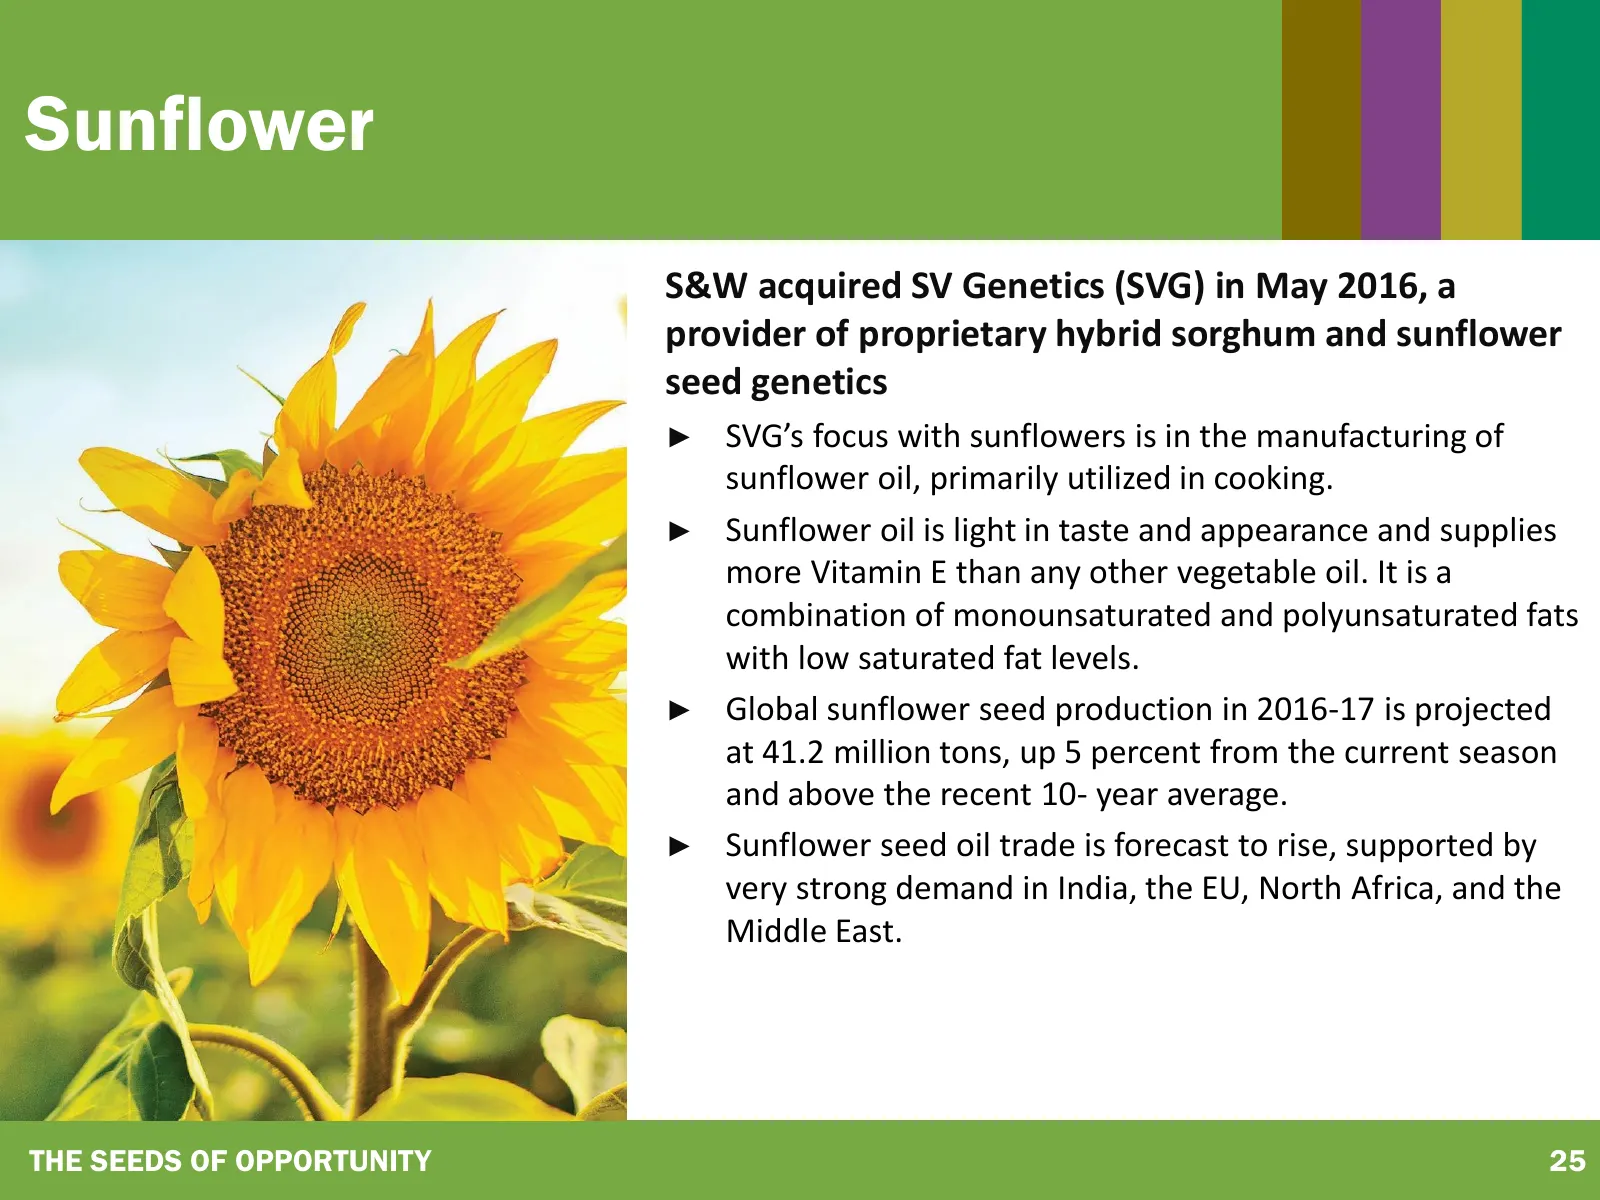
Sunflower S&W acquired SV Genetics (SVG) in May 2016, a provider of proprietary hybrid sorghum and sunflower seed genetics ► SVG’s focus with sunflowers is in the manufacturing of sunflower oil, primarily utilized in cooking. ► Sunflower oil is light in taste and appearance and supplies more Vitamin
Slide 26: Sorghum & Sunflower Agreements
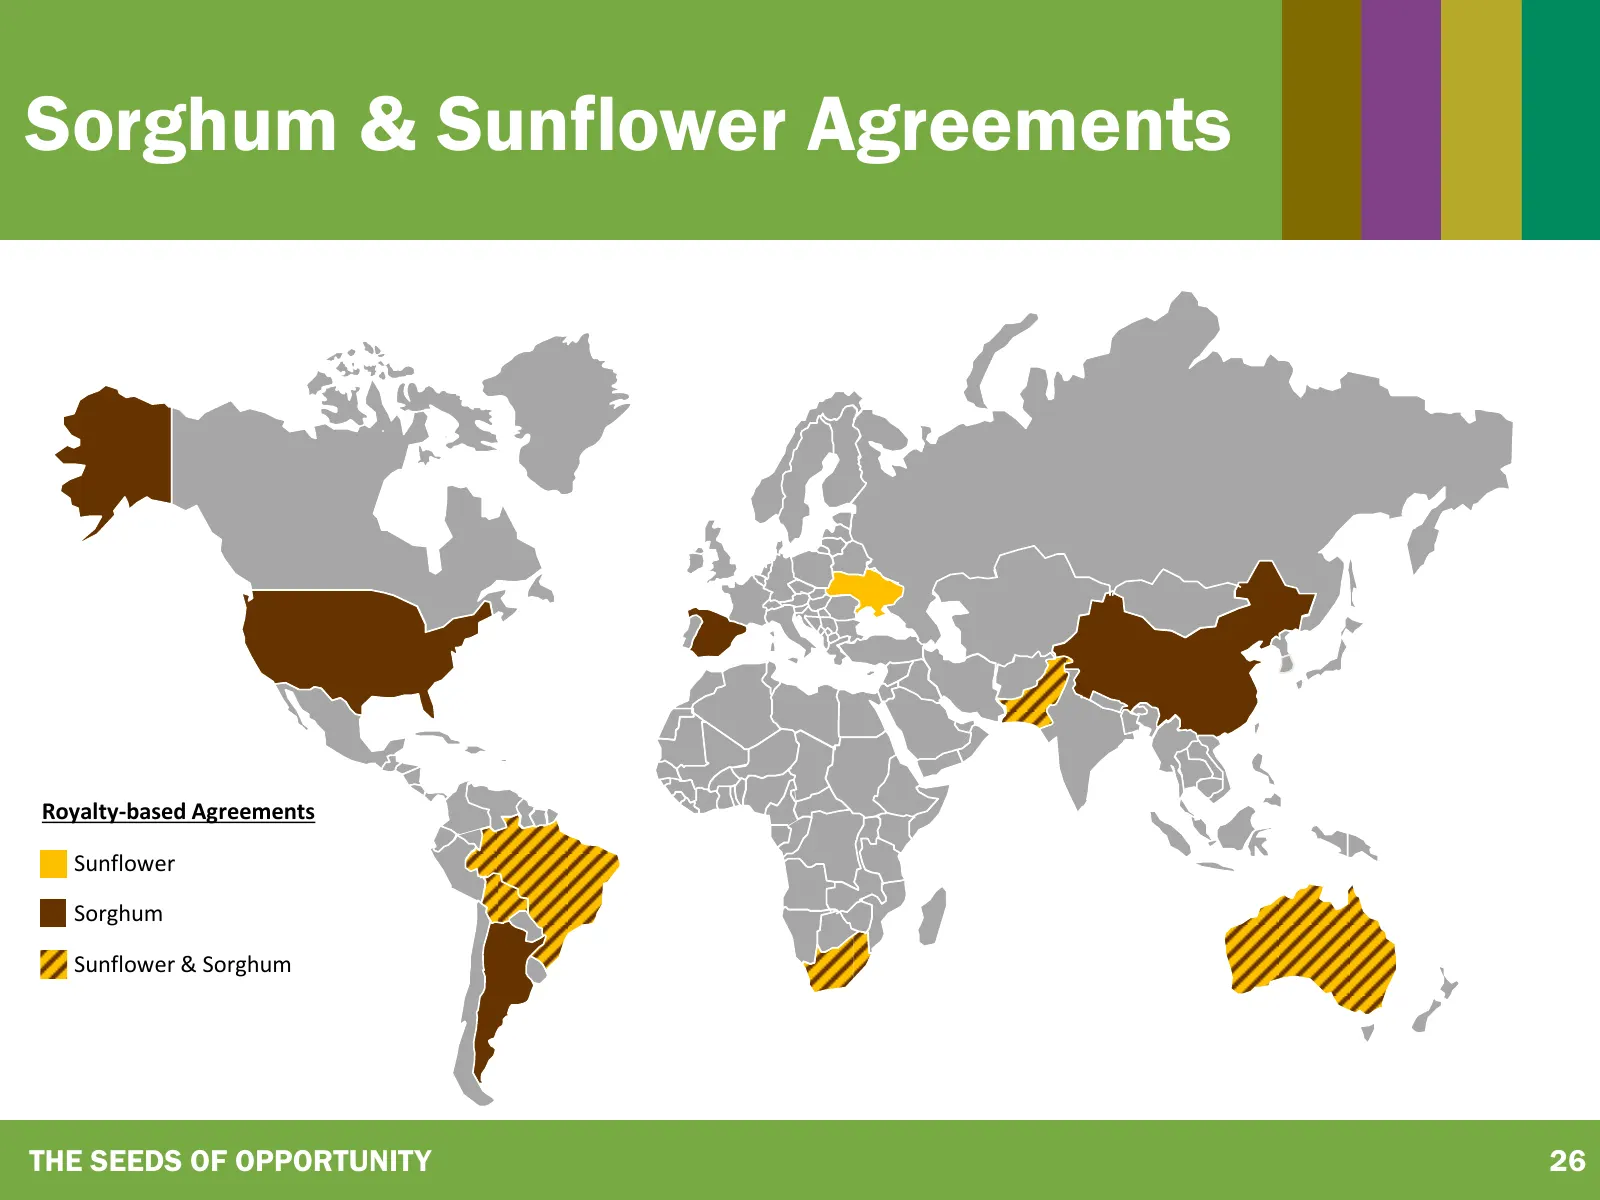
Sorghum & Sunflower Agreements Royalty-based Agreements Sunflower Sorghum Sunflower & Sorghum THE SEEDS OF OPPORTUNITY 26
Slide 27: Stevia Research & Development
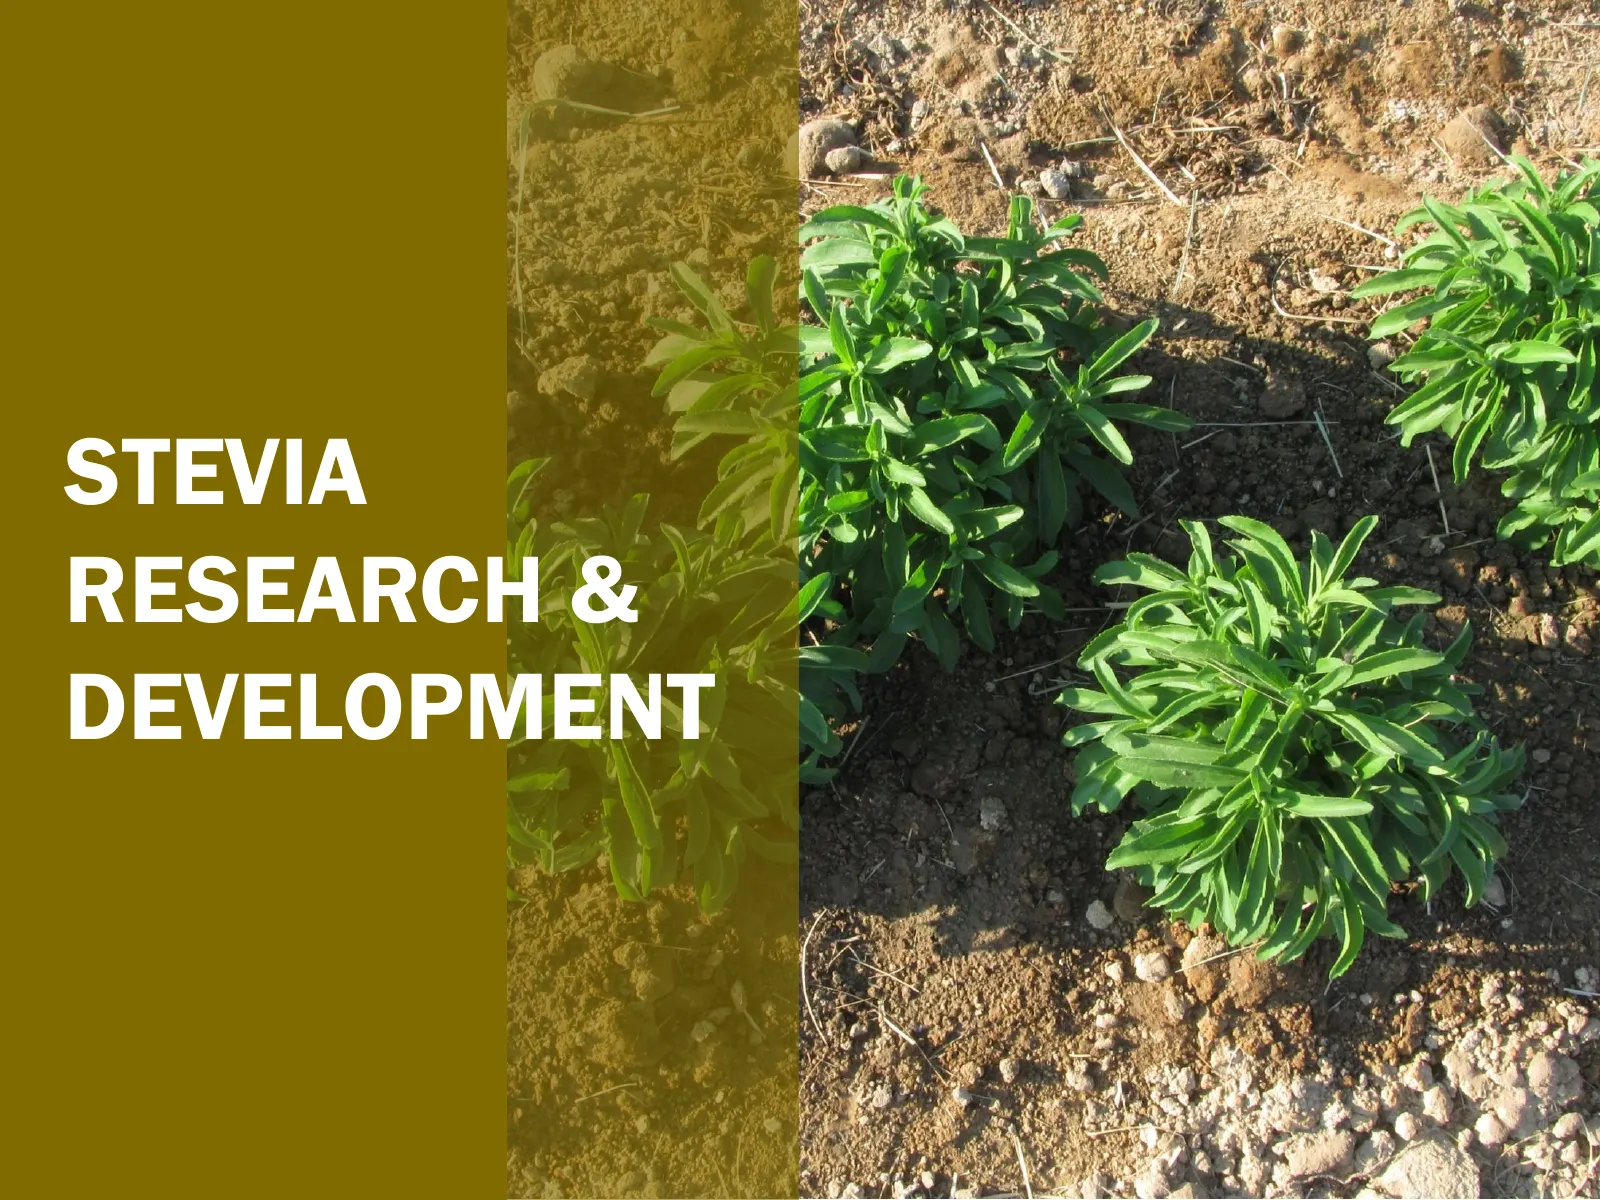
STEVIA RESEARCH & DEVELOPMENT
Slide 28: Stevia: Overview
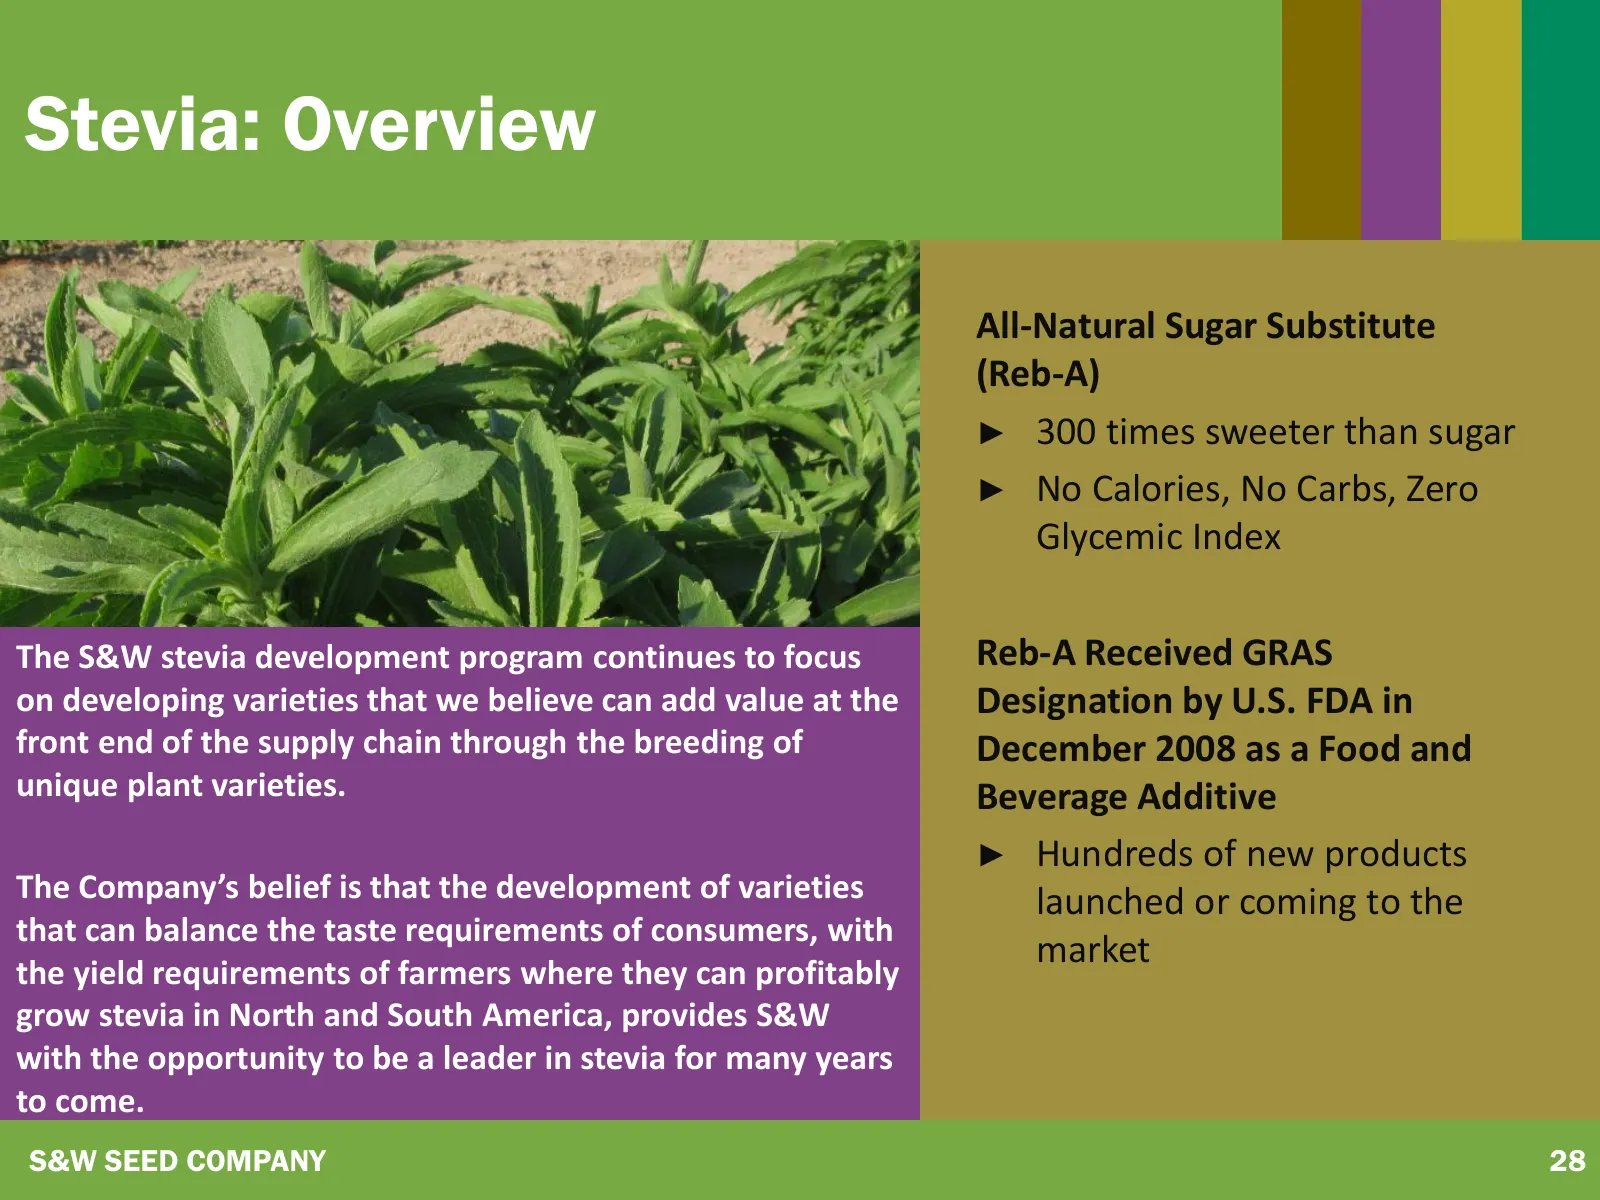
Stevia: Overview All-Natural Sugar Substitute (Reb-A) ► 300 times sweeter than sugar ► No Calories, No Carbs, Zero Glycemic Index The S&W stevia development program continues to focus Reb-A Received GRAS on developing varieties that we believe can add value at the Designation by U.S. FDA in front en
Slide 29: Stevia: Unique Varieties
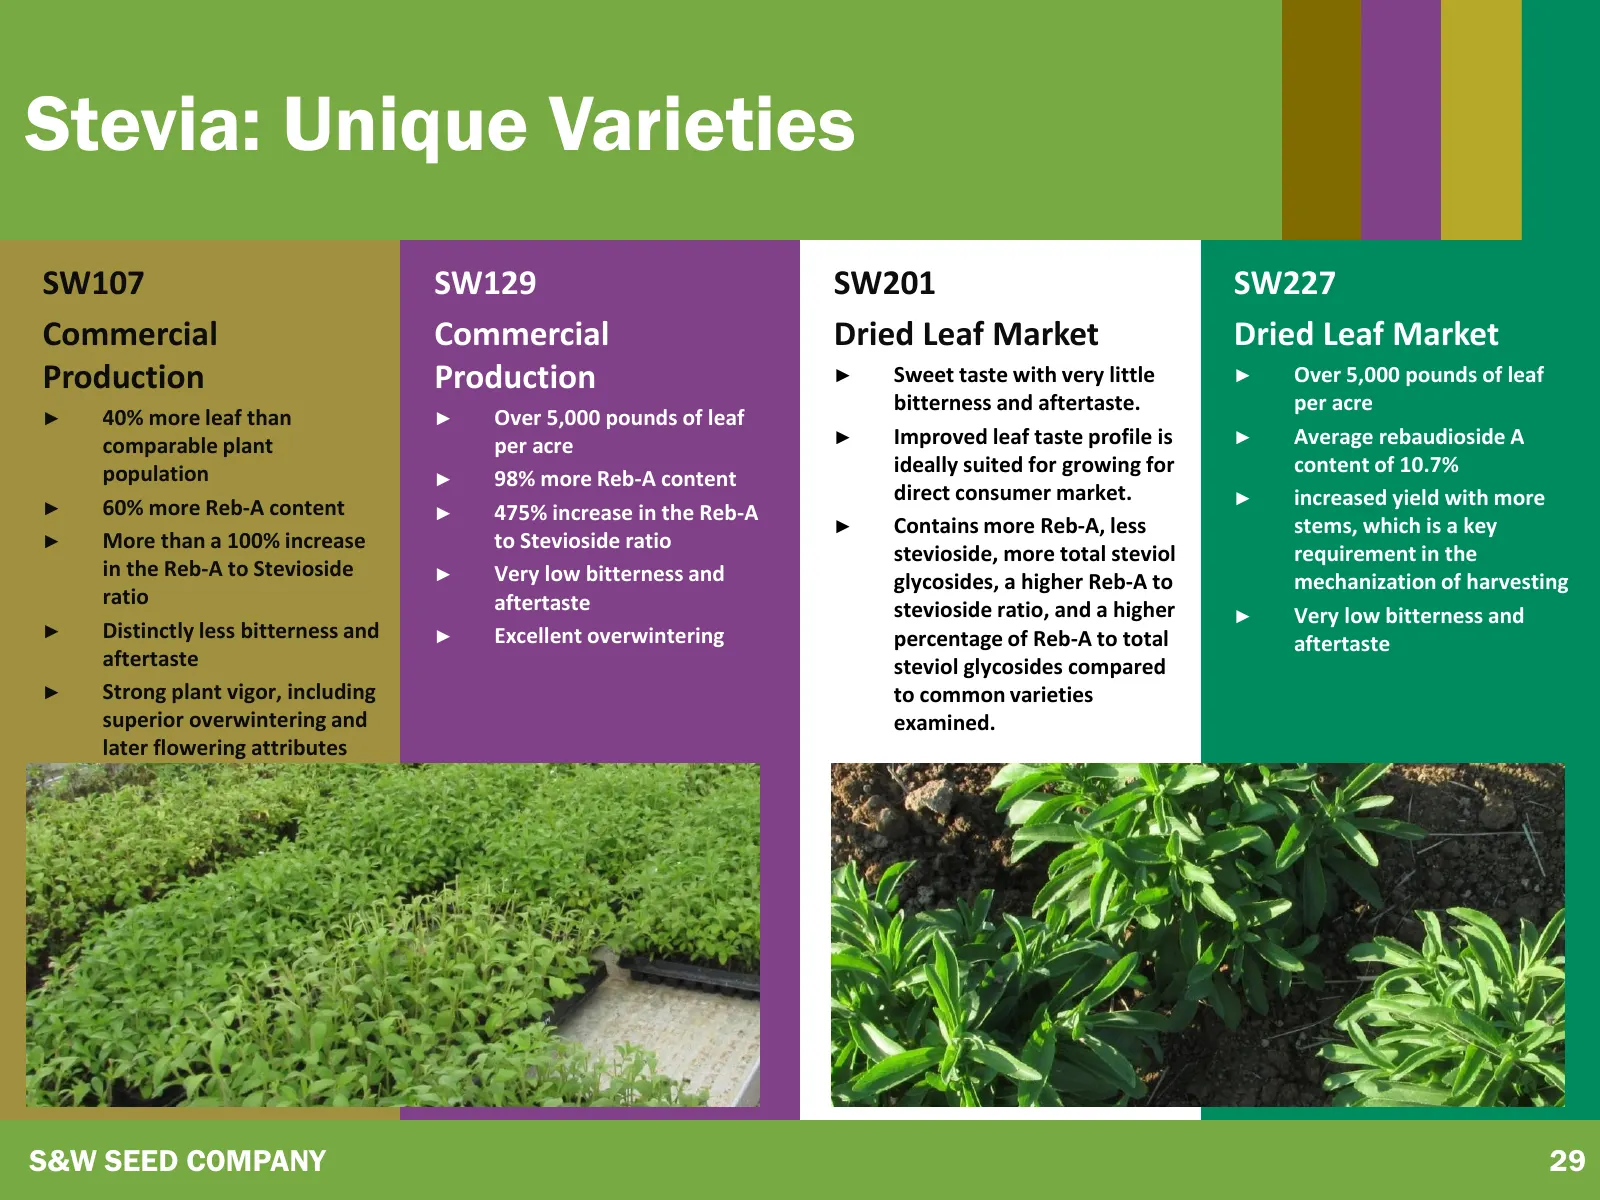
Stevia: Unique Varieties SW107 SW129 SW201 SW227 Commercial Commercial Dried Leaf Market Dried Leaf Market Production Production ► Sweet taste with very little ► Over 5,000 pounds of leaf bitterness and aftertaste. per acre ► 40% more leaf than ► Over 5,000 pounds of leaf comparable plant per acre ►
Slide 30: Financials
FINANCIALS
Slide 31: Revenues
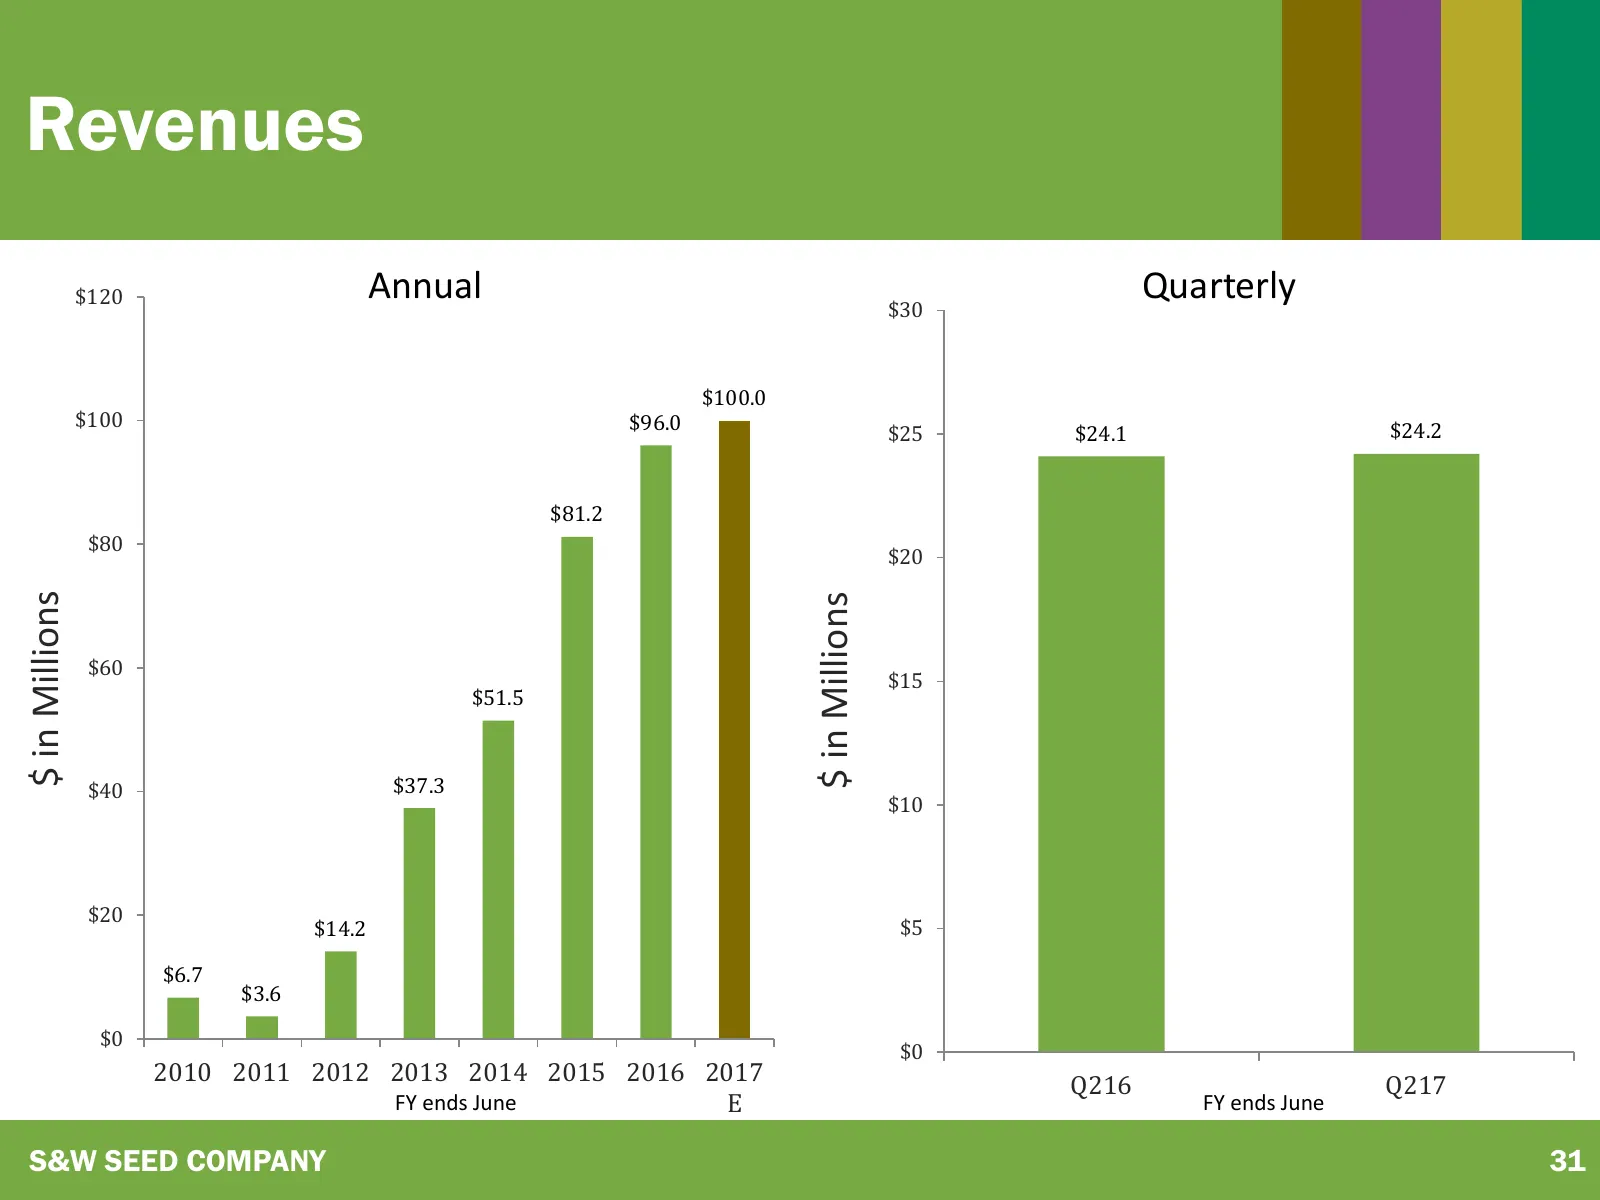
Revenues $120 Annual $30 Quarterly $100.0 $100 $96.0 $24.2 $25 $24.1 $81.2 $80 $20 $ in Millions $ in Millions $60 $15 $51.5 $40 $37.3 $10 $20 $14.2 $5 $6.7 $3.6 $0 $0 2010 2011 2012 2013 2014 2015 2016 2017 Q216 Q217 FY ends June E FY ends June S&W SEED COMPANY 31
Slide 32: Adjusted Gross Margins
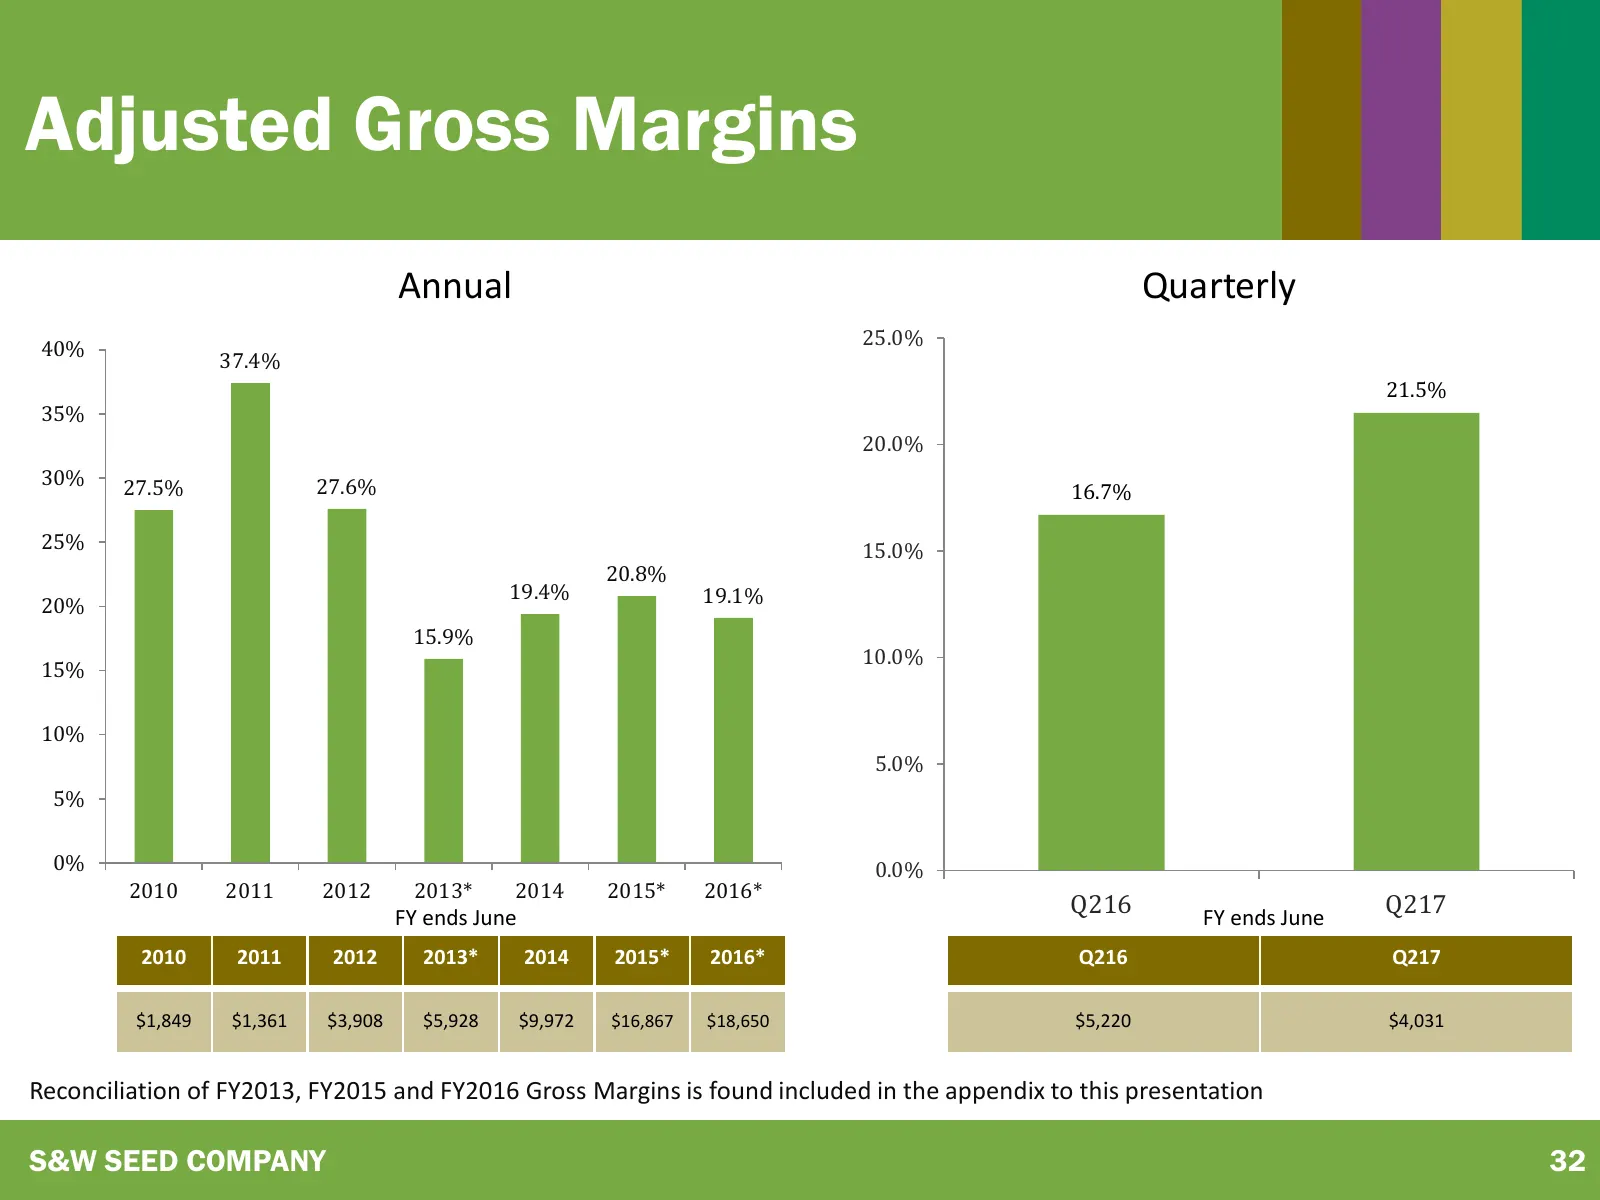
Adjusted Gross Margins Annual Quarterly 25.0% 40% 37.4% 21.5% 35% 20.0% 30% 27.5% 27.6% 16.7% 25% 15.0% 20.8% 19.4% 19.1% 20% 15.9% 10.0% 15% 10% 5.0% 5% 0% 0.0% 2010 2011 2012 2013* 2014 2015* 2016* FY ends June Q216 FY ends June Q217 2010 2011 2012 2013* 2014 2015* 2016* Q216 Q217 $1,849 $1,361 $3
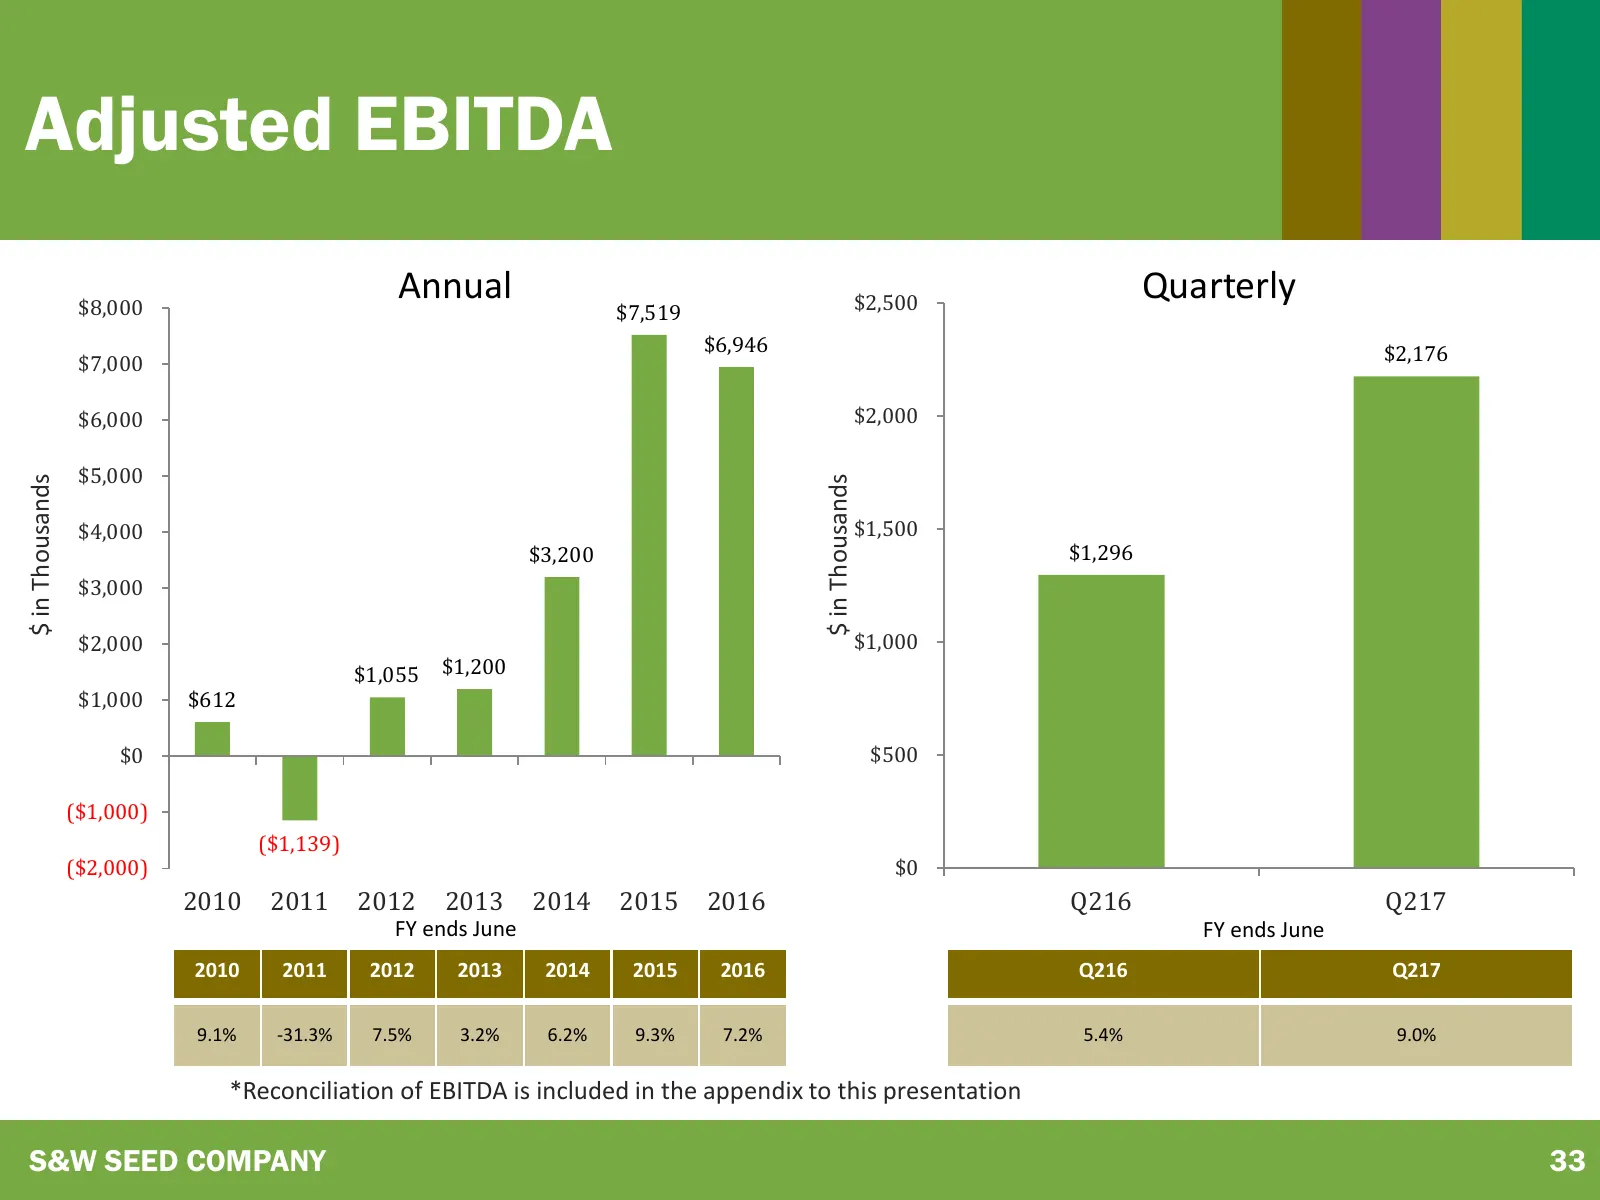
Slide 33: Adjusted EBITDA
Adjusted EBITDA $8,000 Annual $2,500 Quarterly $7,519 $6,946 $2,176 $7,000 $6,000 $2,000 $5,000 $ in Thousands $ in Thousands $4,000 $1,500 $3,200 $1,296 $3,000 $2,000 $1,000 $1,055 $1,200 $1,000 $612 $0 $500 ($1,000) ($1,139) ($2,000) $0 2010 2011 2012 2013 2014 2015 2016 Q216 Q217 FY ends June FY
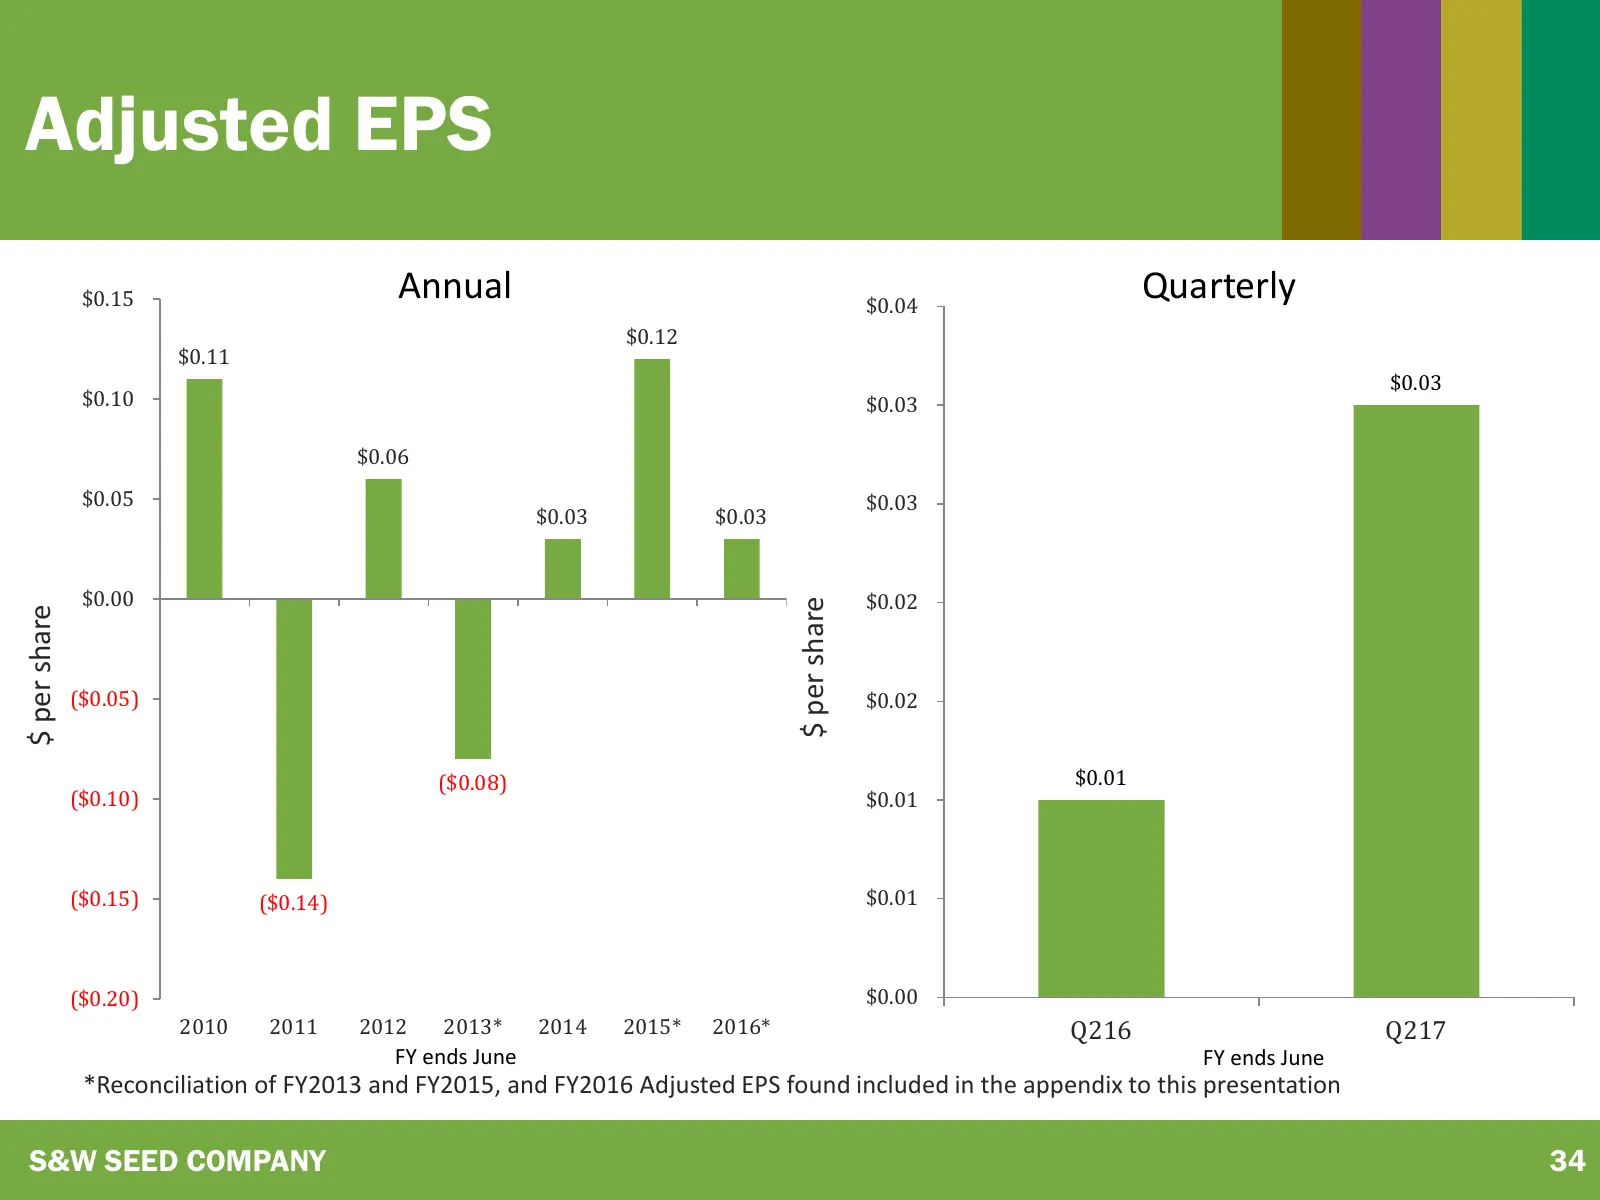
Slide 34: Adjusted EPS
Adjusted EPS $0.15 Annual $0.04 Quarterly $0.12 $0.11 $0.03 $0.10 $0.03 $0.06 $0.05 $0.03 $0.03 $0.03 $0.00 $0.02 $ per share $ per share ($0.05) $0.02 ($0.08) $0.01 ($0.10) $0.01 ($0.15) ($0.14) $0.01 ($0.20) $0.00 2010 2011 2012 2013* 2014 2015* 2016* Q216 Q217 FY ends June FY ends June *Reconcili
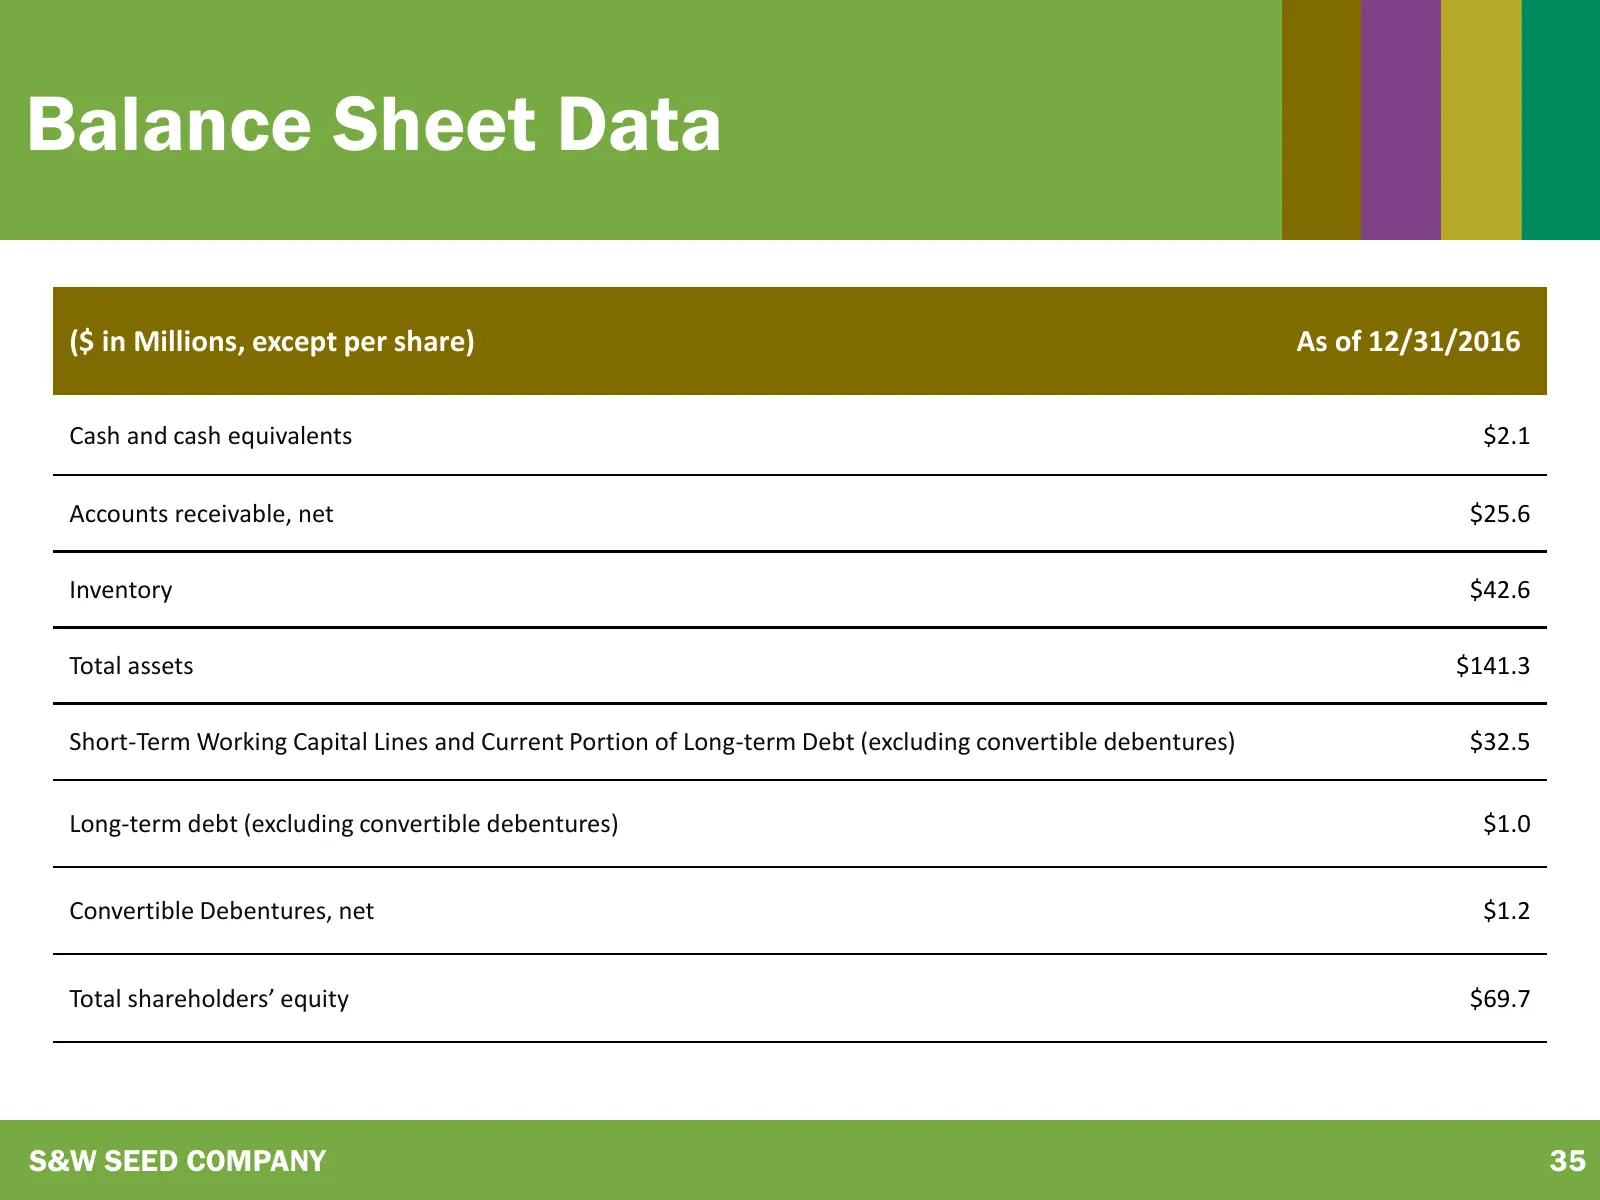
Slide 35: Balance Sheet Data
Balance Sheet Data ($ in Millions, except per share) As of 12/31/2016 Cash and cash equivalents $2.1 Accounts receivable, net $25.6 Inventory $42.6 Total assets $141.3 Short-Term Working Capital Lines and Current Portion of Long-term Debt (excluding convertible debentures) $32.5 Long-term debt (excl
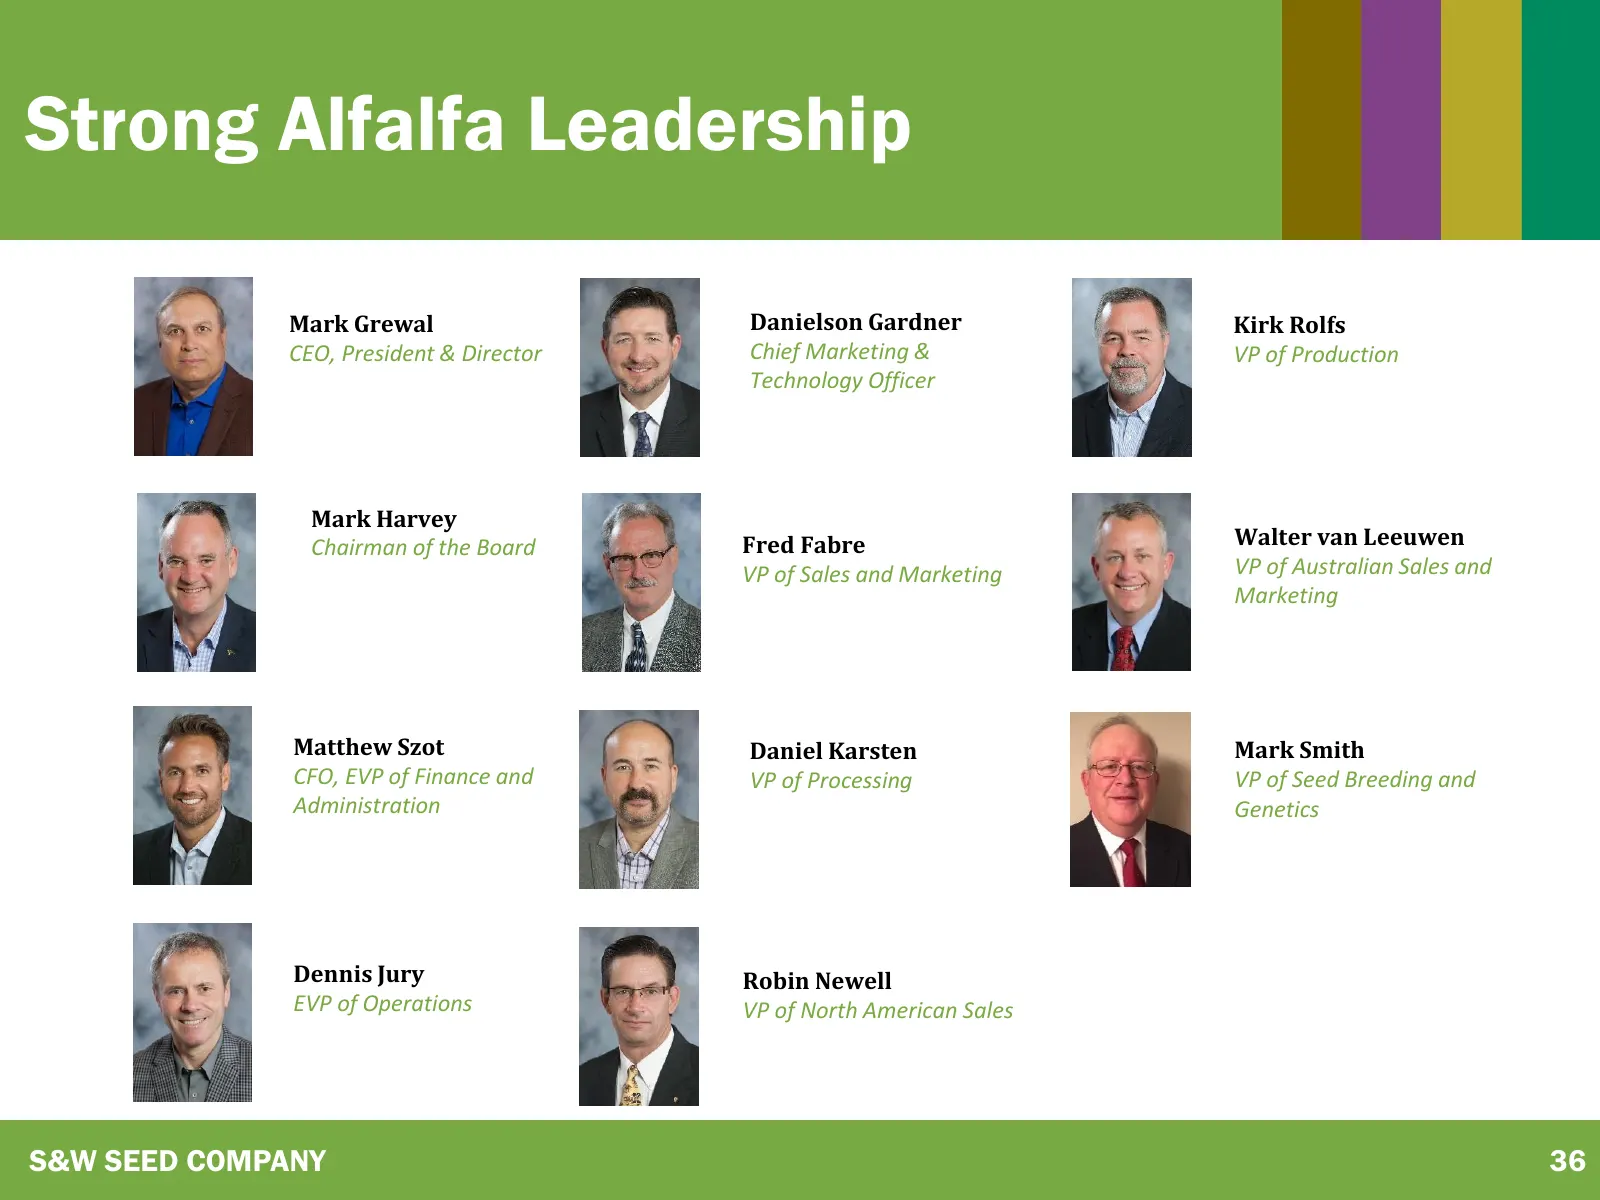
Slide 36: Strong Alfalfa Leadership
Strong Alfalfa Leadership Mark Grewal Danielson Gardner Kirk Rolfs CEO, President & Director Chief Marketing & VP of Production Technology Officer Mark Harvey Chairman of the Board Fred Fabre Walter van Leeuwen VP of Sales and Marketing VP of Australian Sales and Marketing Matthew Szot Daniel Karste
Slide 37: Key Takeaways
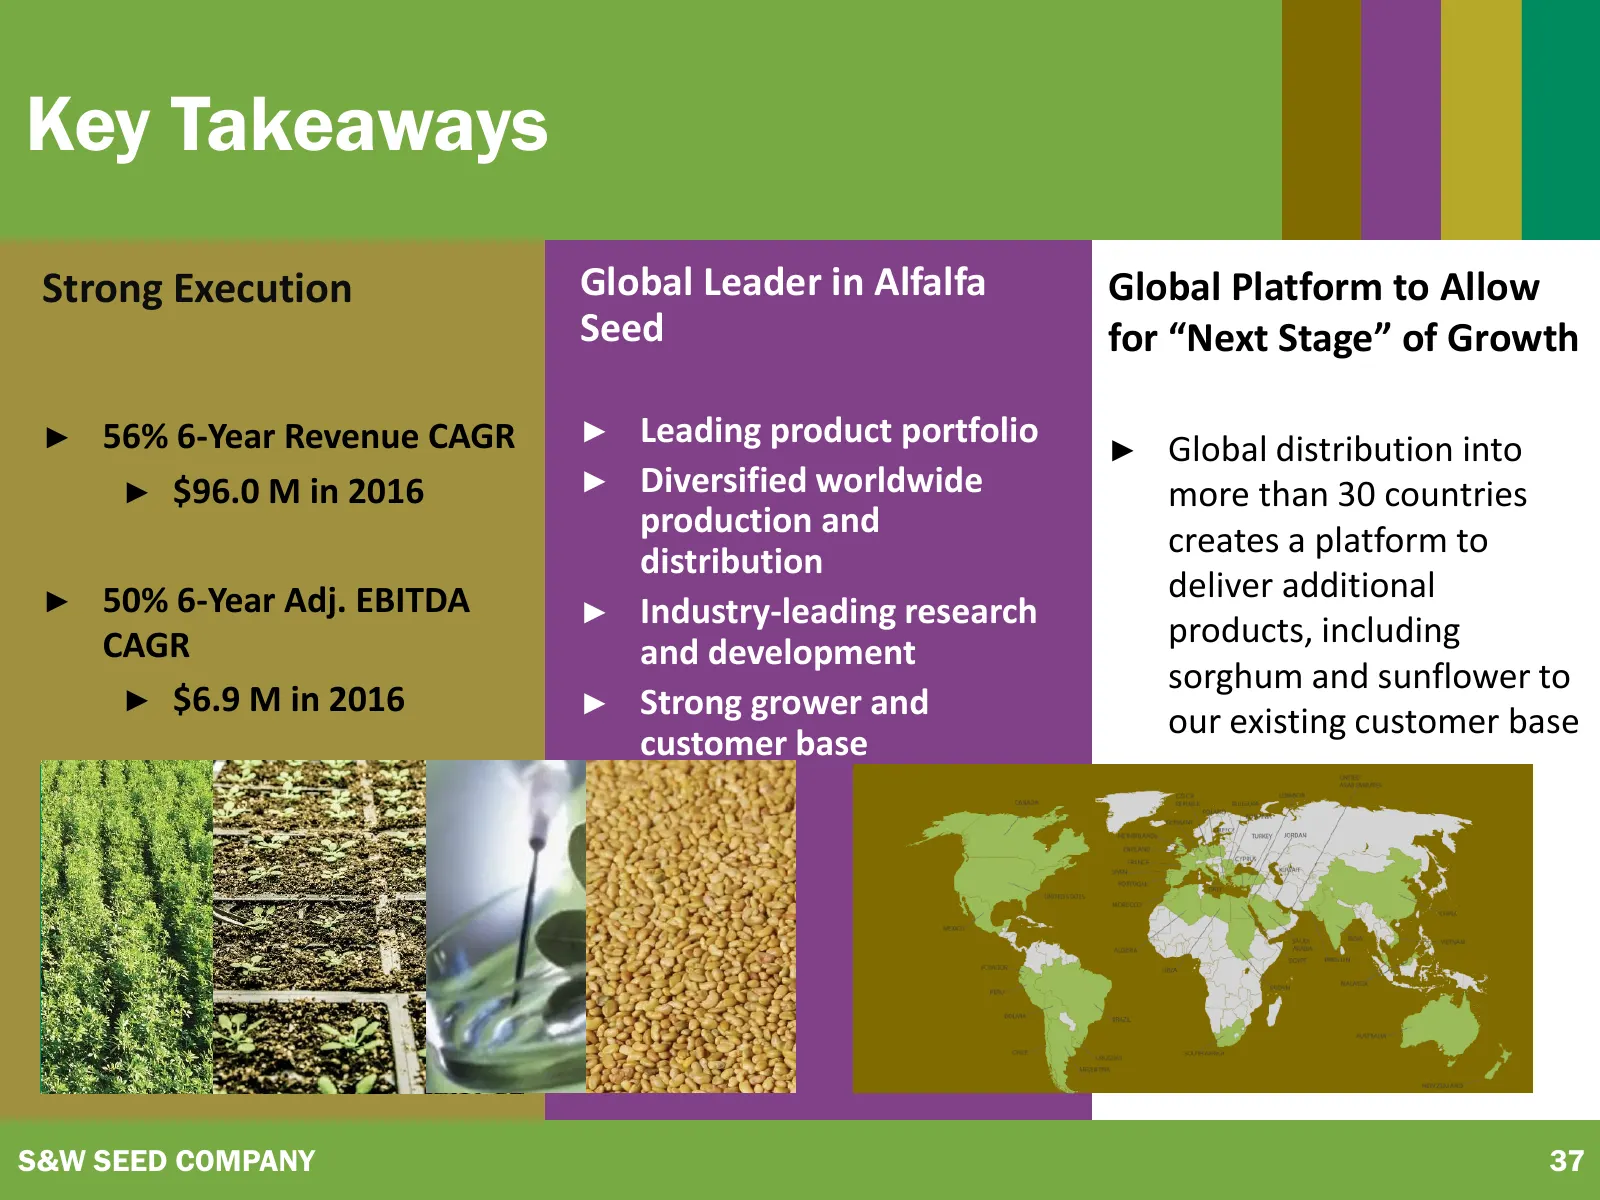
Key Takeaways Strong Execution Global Leader in Alfalfa Global Platform to Allow Seed for “Next Stage” of Growth ► 56% 6-Year Revenue CAGR ► Leading product portfolio ► Global distribution into ► $96.0 M in 2016 ► Diversified worldwide more than 30 countries production and creates a platform to dist
Slide 38: Appendix
APPENDIX
Slide 39: Summary of Non-GAAP Adjustments
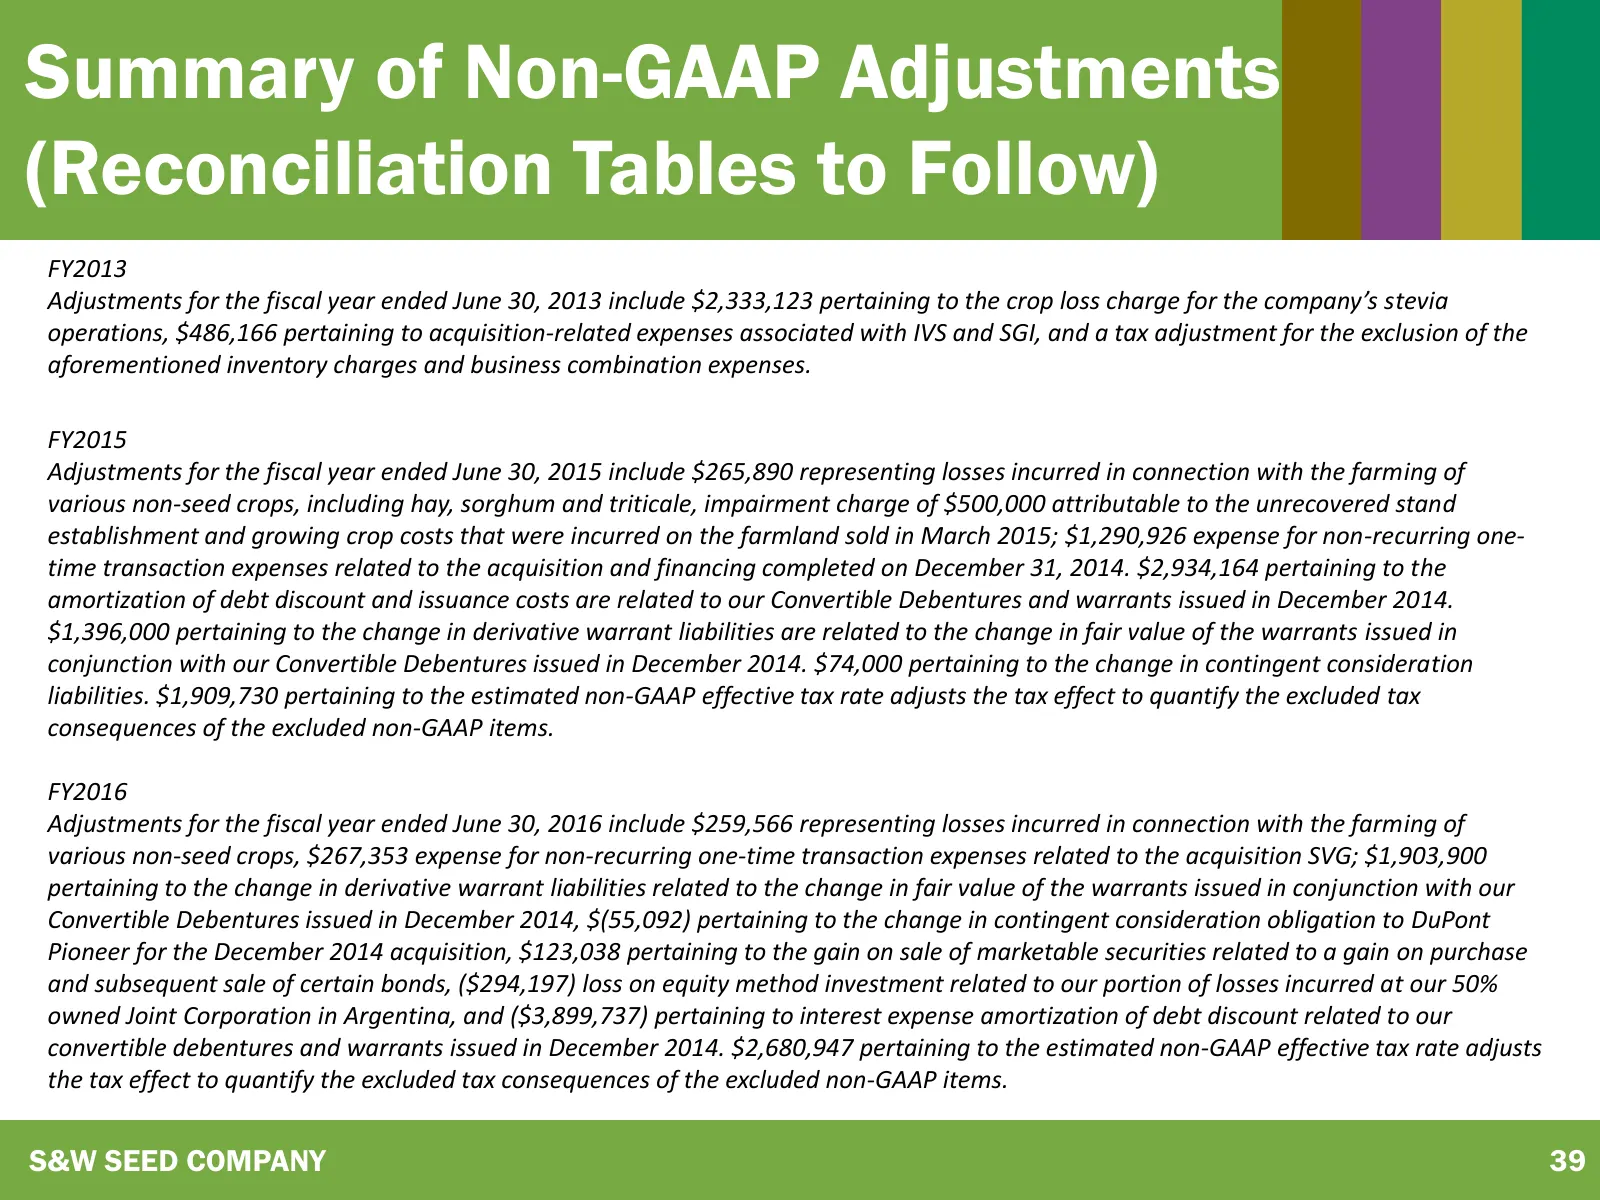
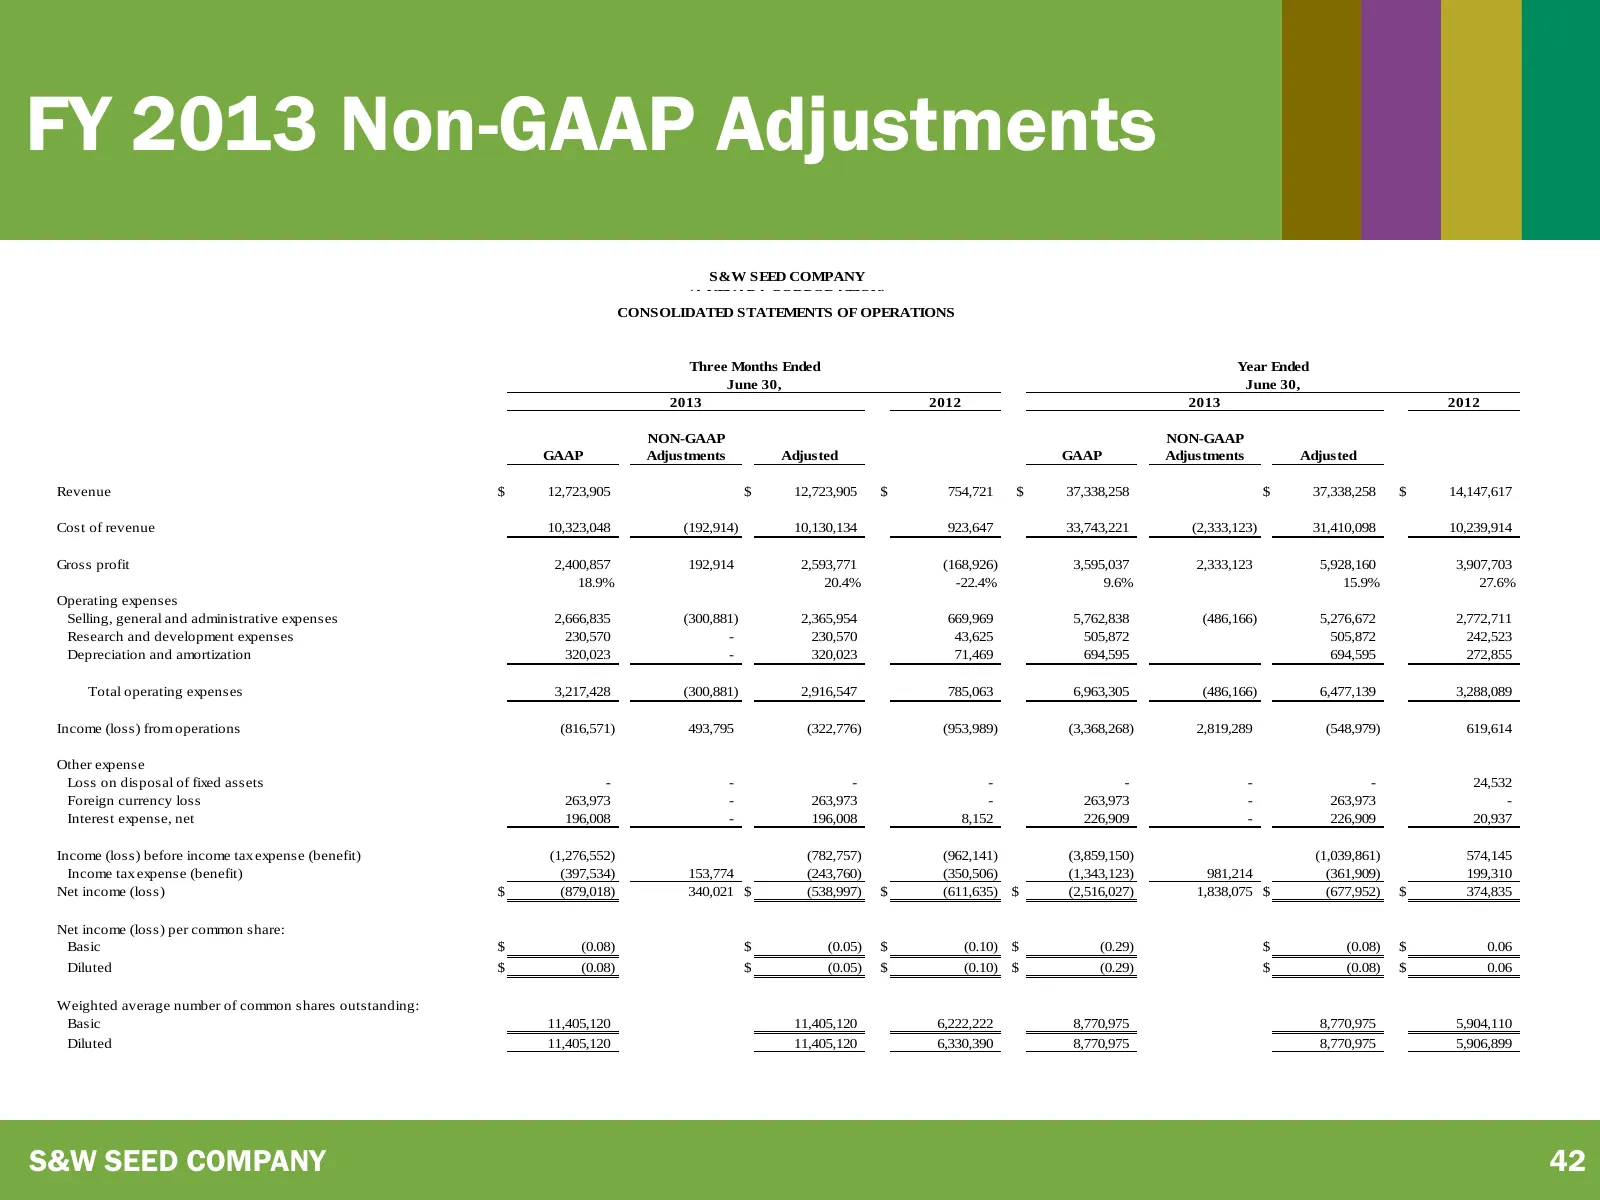
Summary of Non-GAAP Adjustments (Reconciliation Tables to Follow) FY2013 Adjustments for the fiscal year ended June 30, 2013 include $2,333,123 pertaining to the crop loss charge for the company’s stevia operations, $486,166 pertaining to acquisition-related expenses associated with IVS and SGI, and
Slide 40: Summary of Adjusted Financials
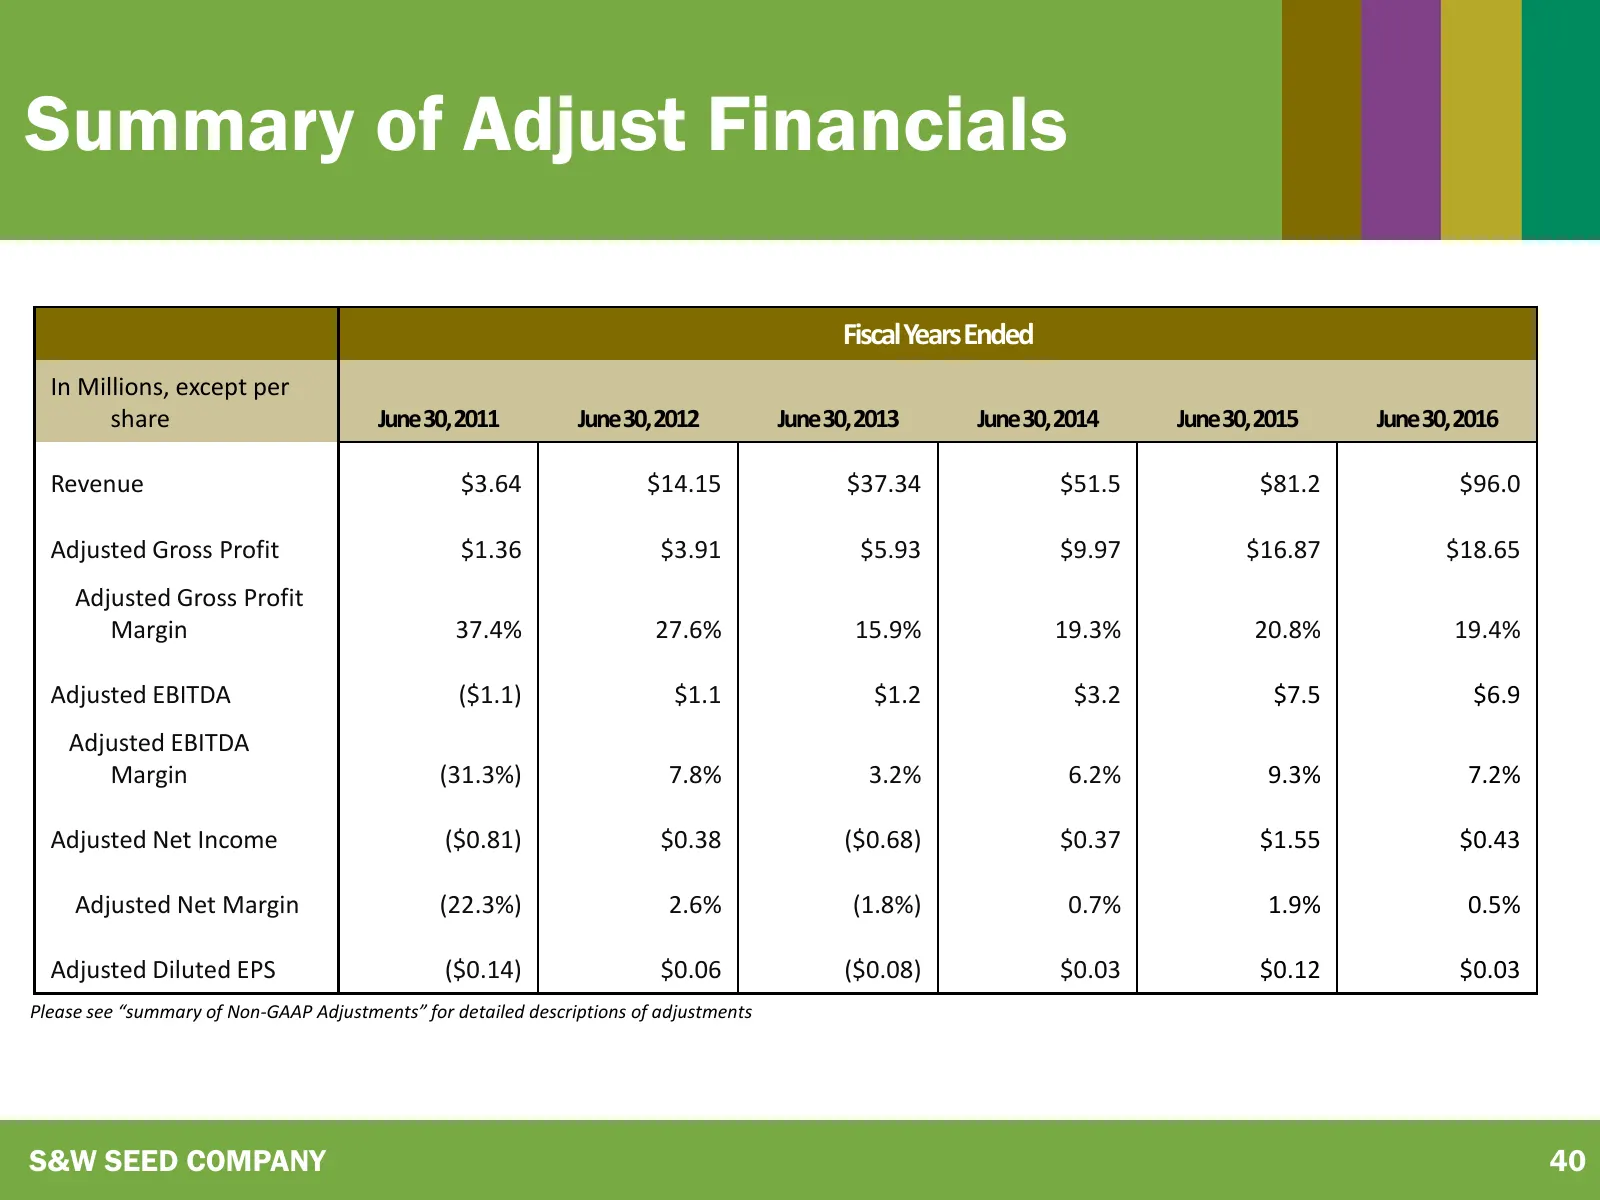
Summary of Adjust Financials Fiscal Years Ended In Millions, except per share June 30, 2011 June 30, 2012 June 30, 2013 June 30, 2014 June 30, 2015 June 30, 2016 Revenue $3.64 $14.15 $37.34 $51.5 $81.2 $96.0 Adjusted Gross Profit $1.36 $3.91 $5.93 $9.97 $16.87 $18.65 Adjusted Gross Profit Margin 37.
Slide 41: Non-GAAP Adjusted EBITDA
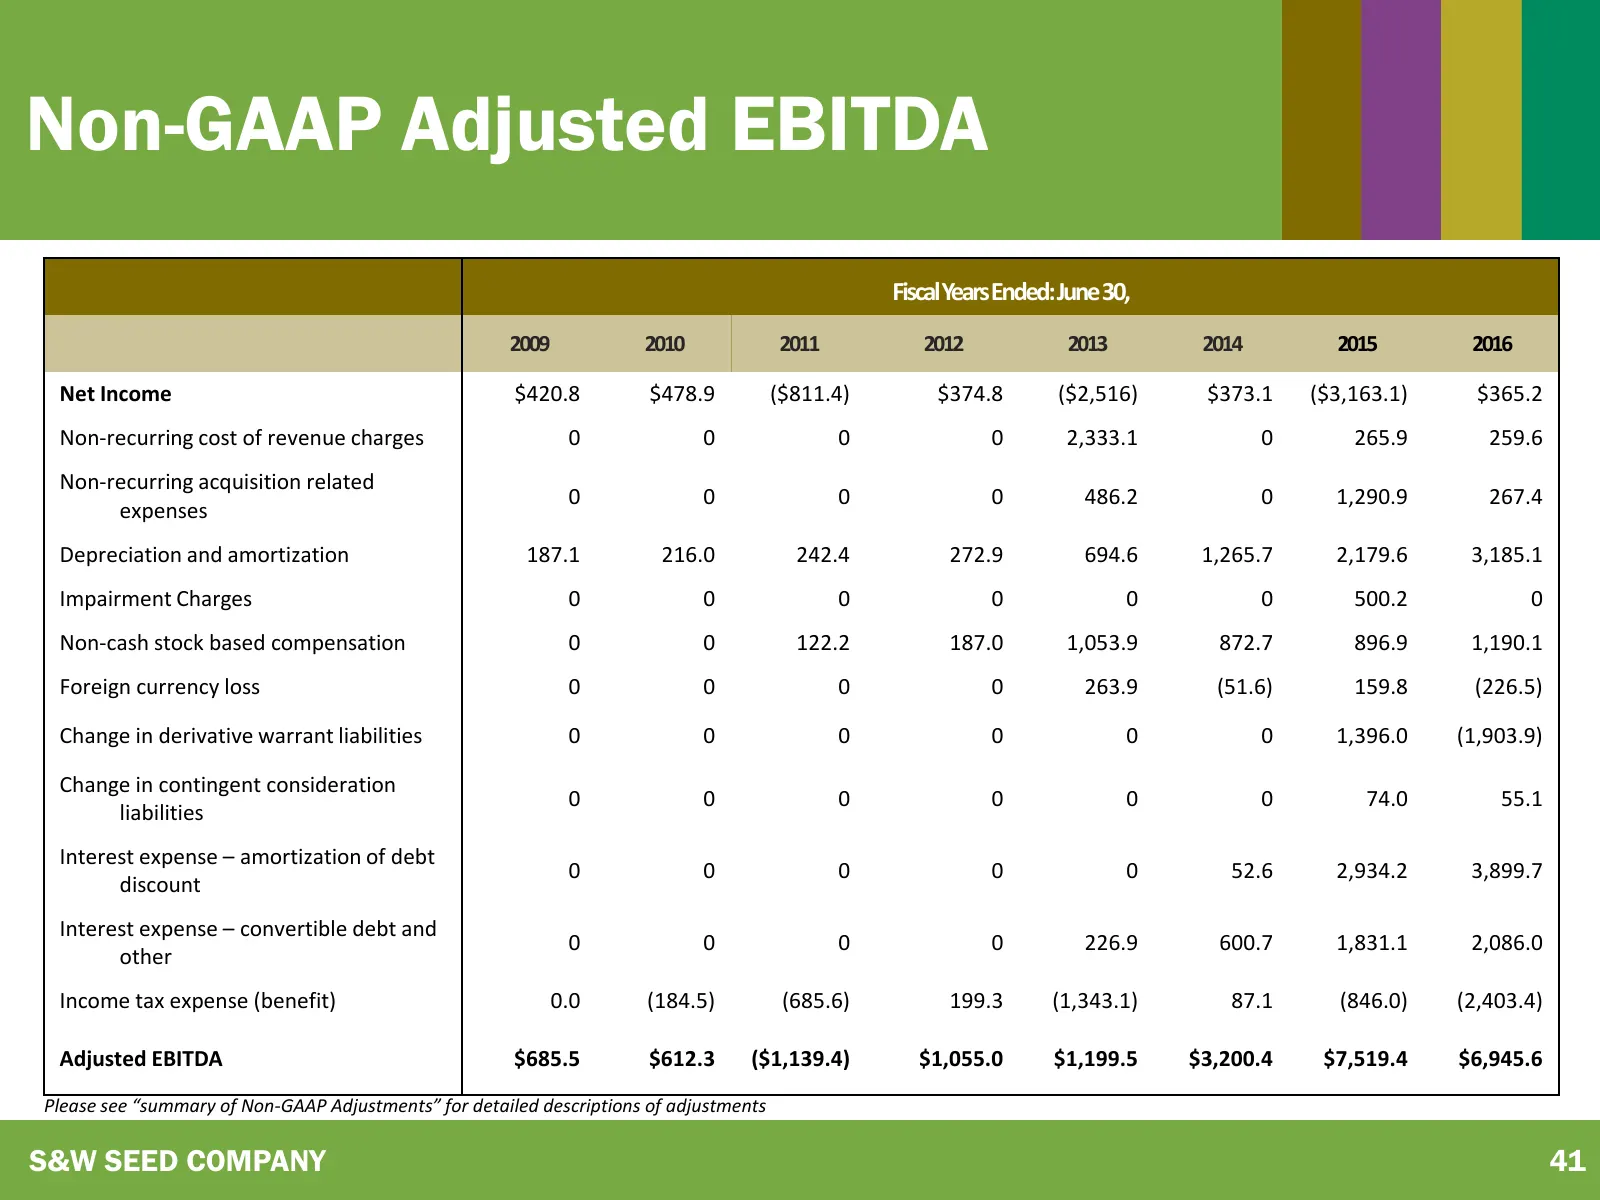
Non-GAAP Adjusted EBITDA Fiscal Years Ended: June 30, 2009 2010 2011 2012 2013 2014 2015 2016 Net Income $420.8 $478.9 ($811.4) $374.8 ($2,516) $373.1 ($3,163.1) $365.2 Non-recurring cost of revenue charges 0 0 0 0 2,333.1 0 265.9 259.6 Non-recurring acquisition related 0 0 0 0 486.2 0 1,290.9 267.4
Slide 42: FY 2013 Non-GAAP Adjustments
FY 2013 Non-GAAP Adjustments S&W SEED COMPANY (A NEVADA CORPORATION) CONSOLIDATED STATEMENTS OF OPERATIONS Three Months Ended Year Ended June 30, June 30, 2013 2012 2013 2012 NON-GAAP NON-GAAP GAAP Adjustments Adjusted GAAP Adjustments Adjusted Revenue $ 12,723,905 $ 12,723,905 $ 754,721 $ 37,338,25
Slide 43: FY 2015 Non-GAAP Adjustments
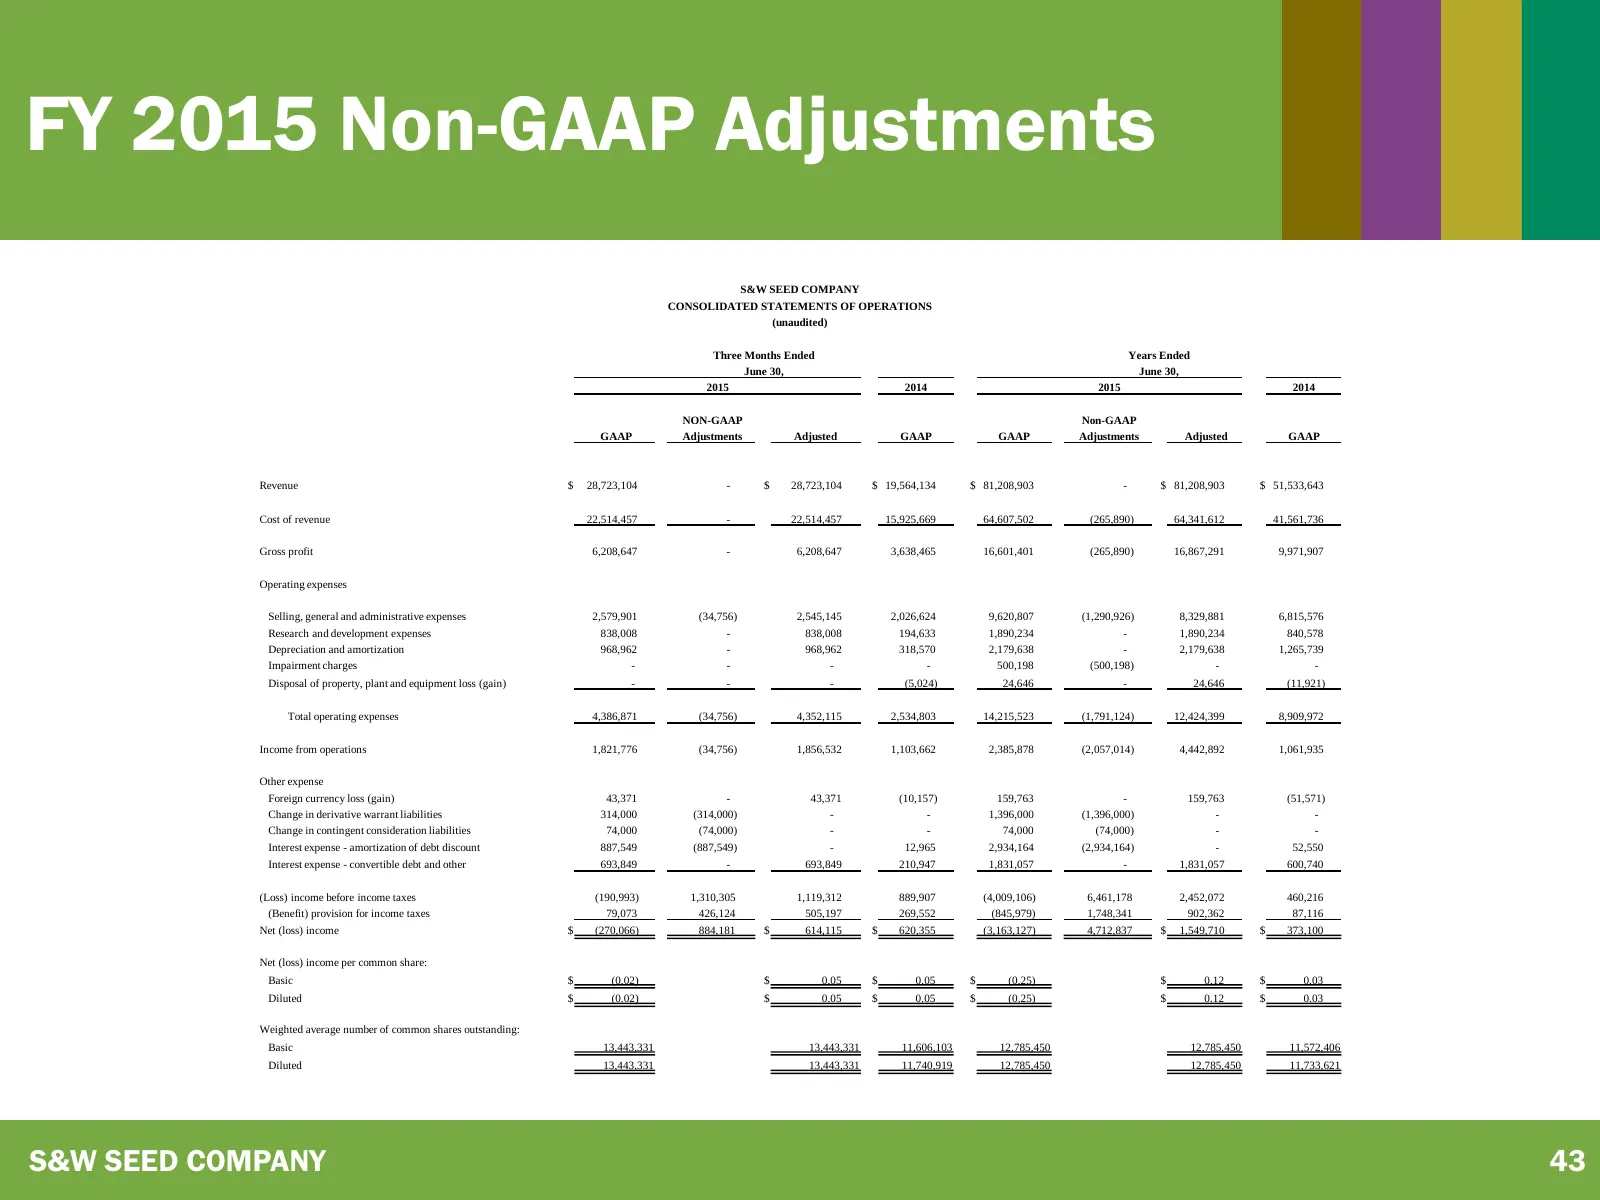
FY 2015 Non-GAAP Adjustments S&W SEED COMPANY CONSOLIDATED STATEMENTS OF OPERATIONS (unaudited) Three Months Ended Years Ended June 30, June 30, 2015 2014 2015 2014 NON-GAAP Non-GAAP GAAP Adjustments Adjusted GAAP GAAP Adjustments Adjusted GAAP Revenue $ 28,723,104 - $ 28,723,104 $ 19,564,134 $ 81,2
Slide 44: FY 2016 Non-GAAP Adjustments
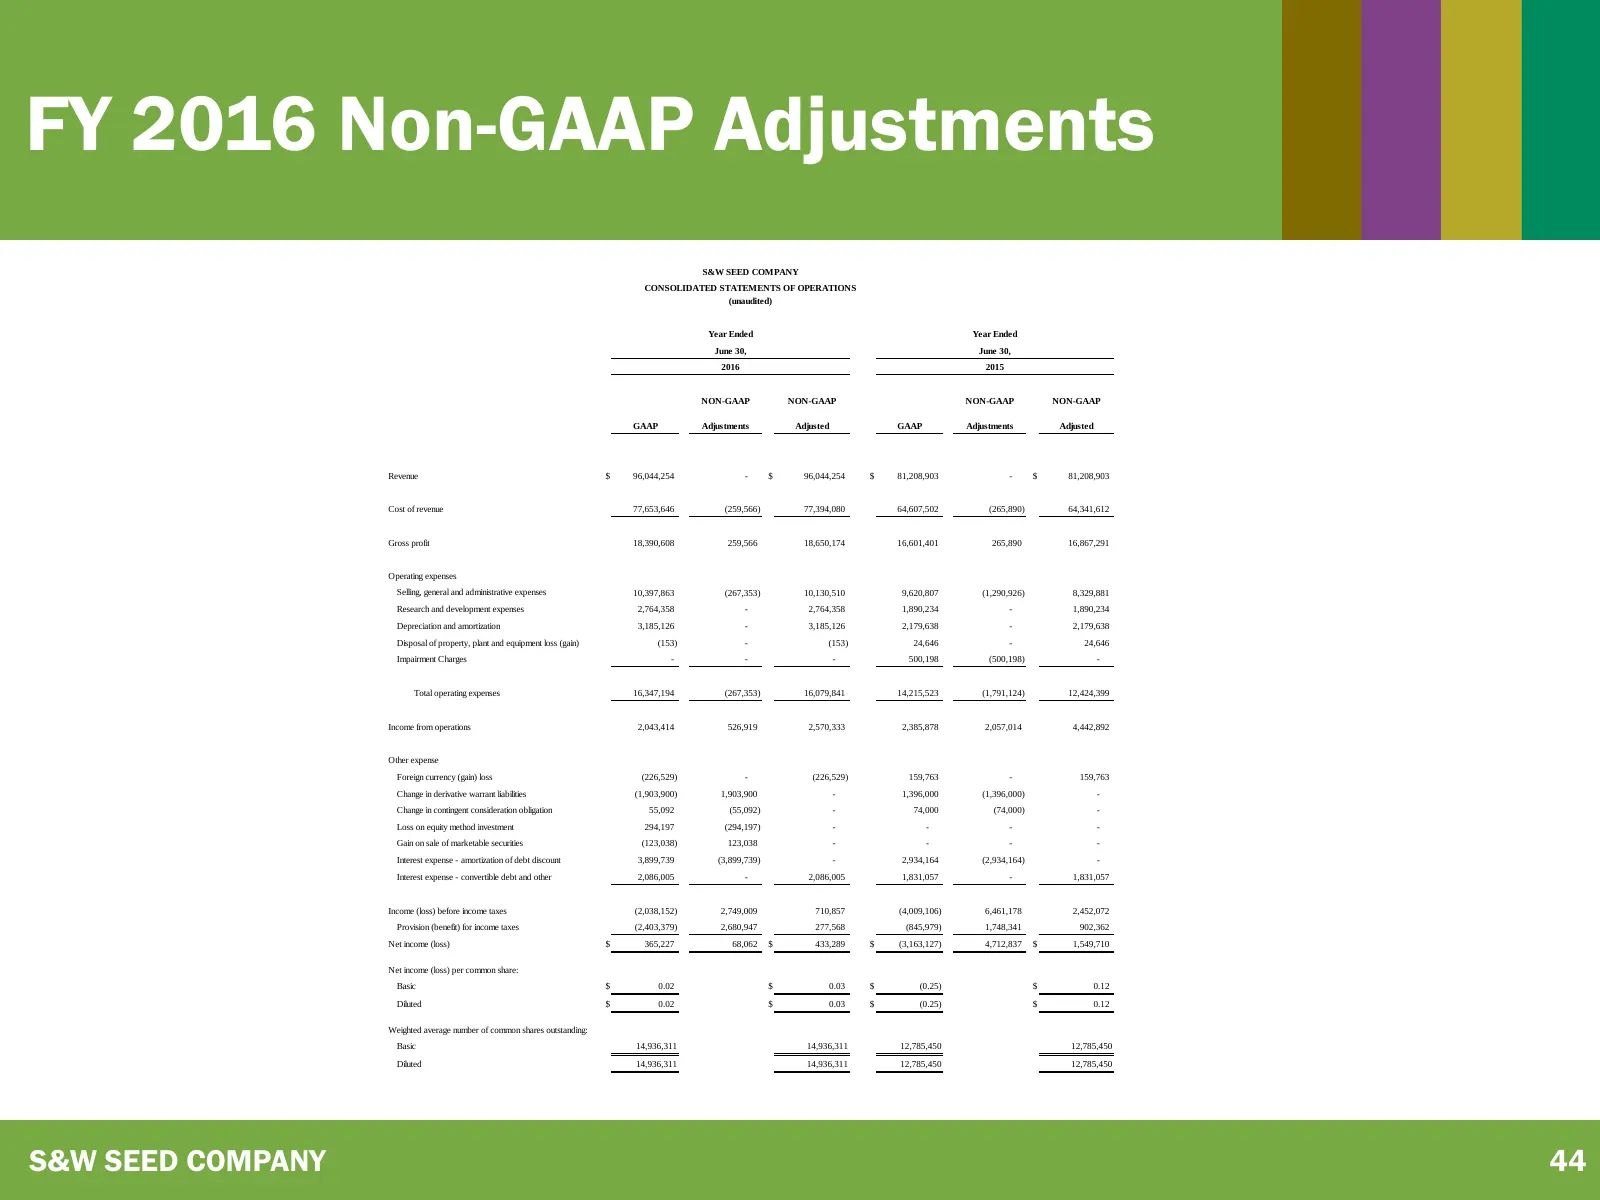
FY 2016 Non-GAAP Adjustments S&W SEED COMPANY CONSOLIDATED STATEMENTS OF OPERATIONS (unaudited) Year Ended Year Ended June 30, June 30, 2016 2015 NON-GAAP NON-GAAP NON-GAAP NON-GAAP GAAP Adjustments Adjusted GAAP Adjustments Adjusted Revenue $ 96,044,254 - $ 96,044,254 $ 81,208,903 - $ 81,208,903 Co
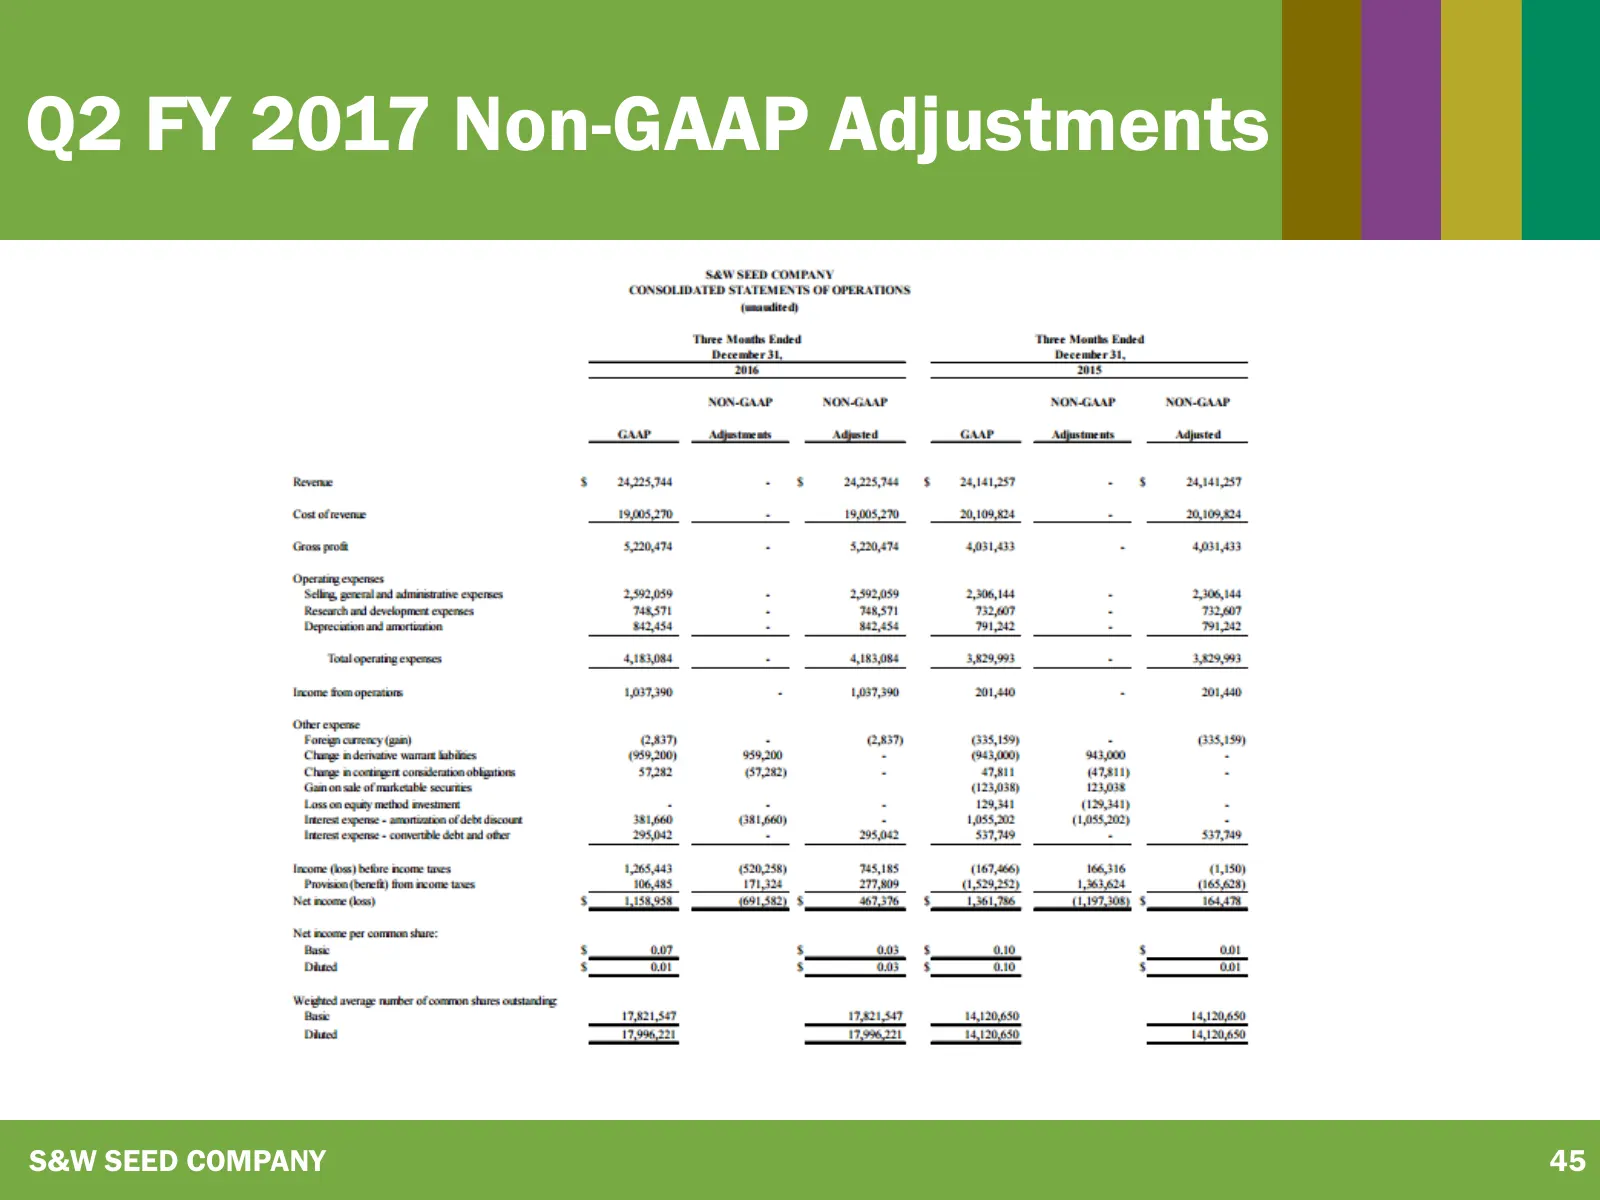
Slide 45: Q2 FY 2017 Non-GAAP Adjustments
Q2 FY 2017 Non-GAAP Adjustments S&W SEED COMPANY 45
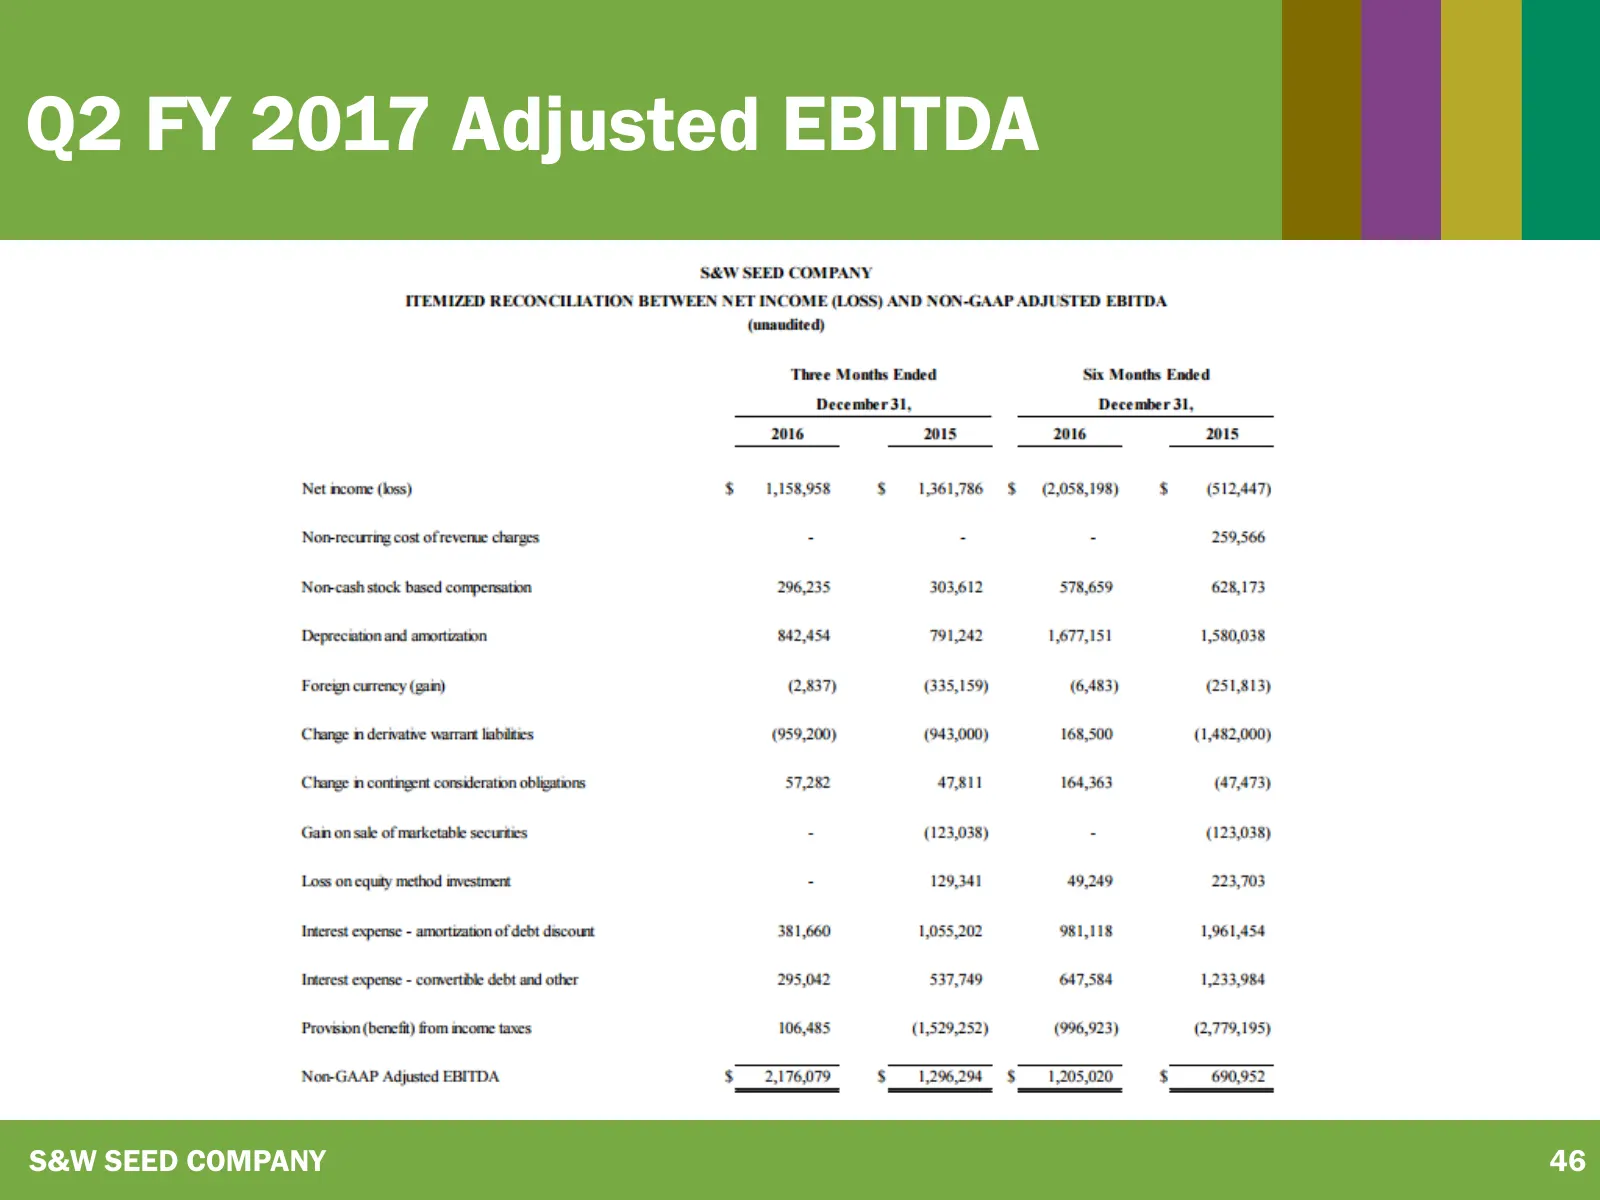
Slide 46: Q2 FY 2017 Adjusted EBITDA
Q2 FY 2017 Adjusted EBITDA S&W SEED COMPANY 46
Source: Internet Archive copy of swseedco.com
More decks from S&W Seed Company
 Investor Presentation (March 2024)38 slides · March 2024
 Investor Presentation (May 2023)27 slides · May 2023
 Investor Presentation (March 2023)28 slides · Mar 13, 2023
 Investor Presentation (March 2021)30 slides · March 2021
 Investor Presentation (December 2020)41 slides · December 2020
 Investor Presentation (October 2020)36 slides · October 2020