Cardinal Financial — Raymond James Investor Conference 2008
35 slides from Cardinal Financial's conference presentation, Mar 4, 2008
Slide 1: Cardinal Financial Corporation Raymond James Investor Conference
Cardinal Financial Corporation Raymond James Investor Conference March 4, 2008

Slide 2: Forward-Looking Statements
Forward-Looking Statements Statements contained in this presentation which are not historical facts are forward-looking statements as that item is defined in the Private Securities Litigation Reform Act of 1995. Such forward-looking statements are subject to risks and uncertainties which could cause
Slide 3: Investment Summary
3 Investment Summary • Strong management team • Quality asset growth • Premier market • Shareholder focused • Attractive valuation

Slide 4: Company Profile
Company Profile Pa A
Slide 5: Company Profile
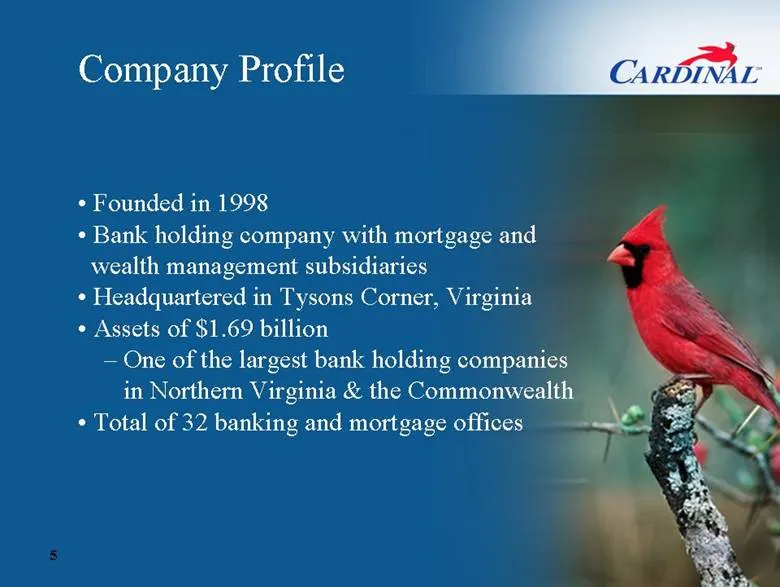
Company Profile • Founded in 1998 • Bank holding company with mortgage and wealth management subsidiaries • Headquartered in Tysons Corner, Virginia • Assets of $1.69 billion – One of the largest bank holding companies in Northern Virginia & the Commonwealth • Total of 32 banking and mortgage office
Slide 6: Cardinal Financial Corporation growth 1998-2002 vs 2003-2007
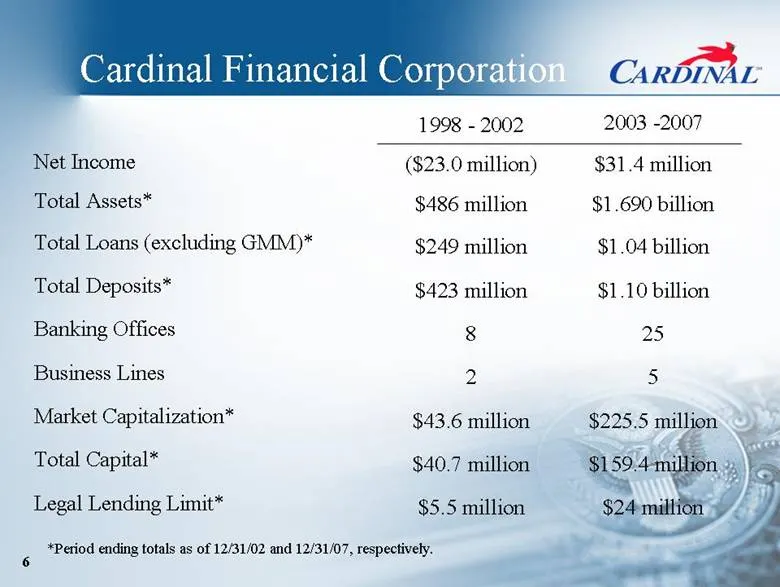
Cardinal Financial Corporation Net Income Total Assets* Total Loans (excluding GMM) * 1998 -2002 2003 -2007 ($23.0 million) $31.4 million $486 million $1.690 billion $249 million $1.04 billion Total Deposits* $423 million $1.10 billion Banking Offices 8 25 Business Lines 2 5 Market Capitalization* $

Slide 7: Management Team
7 Management Team Strong, experienced leadership team with proven track record – Senior managers average 26 years in financial services

Slide 8: Management Team: Chairman & CEO Bernard Clineburg
Management Team Cardinal Chairman & CEO Bernard Clineburg More than three decades experience in local banking market – Joined Cardinal in October 2001 • Grown assets from $280 million to $1.69 billion • Acquired mortgage and wealth management businesses to position Cardinal as full-service financial

Slide 9: A Premier Banking Market Washington D.C. Area
9 A Premier Banking Market Washington D.C. Area
Slide 10: Greater Washington D.C. Area
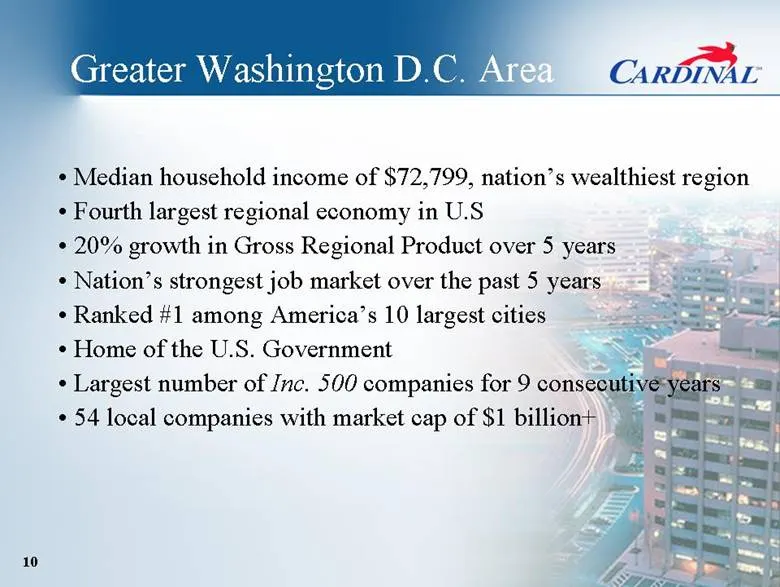
Greater Washington D.C. Area • Median household income of $72,799, nation’s wealthiest region • Fourth largest regional economy in U.S • 20% growth in Gross Regional Product over 5 years • Nation’s strongest job market over the past 5 years • Ranked #1 among America’s 10 largest cities • Home of the
Slide 11: A Growing Market for Financial Services
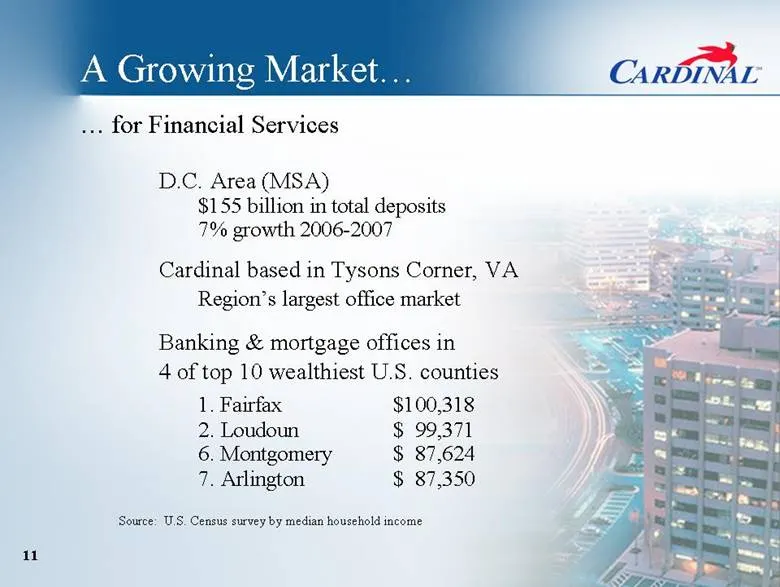
A Growing Market for Financial Services D.C. Area (MSA) $155 billion in total deposits 7% growth 2006-2007 Cardinal based in Tysons Corner, VA Region’s largest office market Banking & mortgage offices in 4 of top 10 wealthiest U.S. counties 1. Fairfax $100,318 2. Loudoun $ 99,371 6. Montgomery $ 87,
Slide 12: Last Bank Standing?
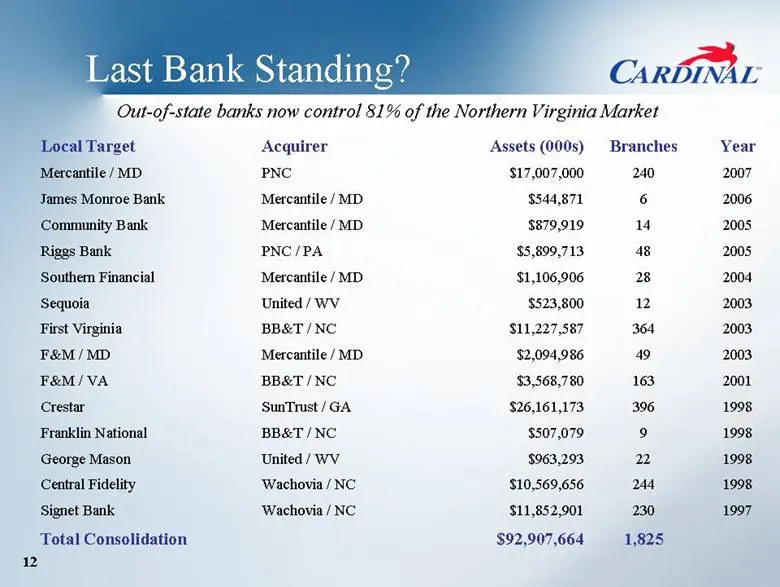
Last Bank Standing? Out-of-state banks now control 81% of the Northern Virginia Market Local Target Acquirer Assets (000s) Branches Year Mercantile / MD PNC $17,007,000 240 2007 James Monroe Bank Mercantile / MD $544,871 6 2006 Community Bank Mercantile / MD $879,919 14 2005 Riggs Bank PNC / PA $5,8
Slide 13: Northern Virginia Population Growth by County
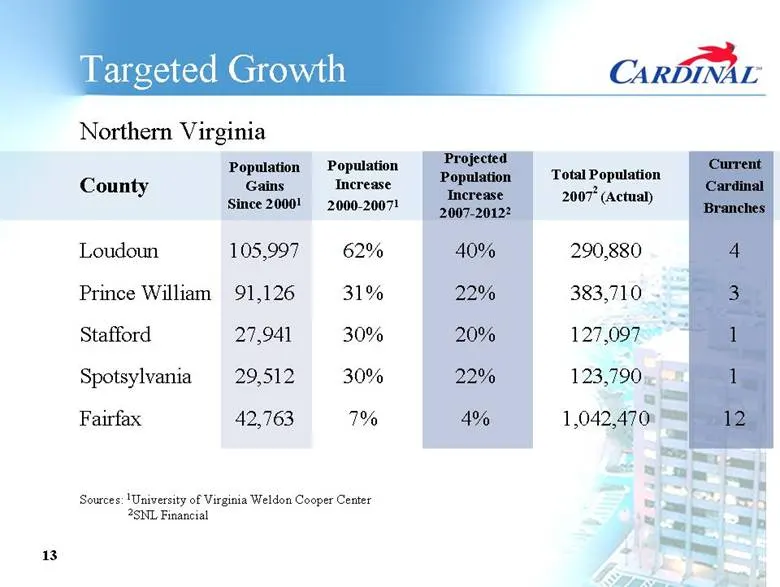
12 1 123,790 22% 30% 29,512 12 1 3 4 1,042,470 127,097 383,710 290,880 20072 20% 30% 27,941 4%7% 42,763 22% 31% 91,126 40% 62% 105,997 211 13 Northern Virginia Sources: University of Virginia Weldon Cooper Center SNL Financial Spotsylvania Current Cardinal Branches Total Population (Actual) Stafford
Slide 14: Current Banking Centers
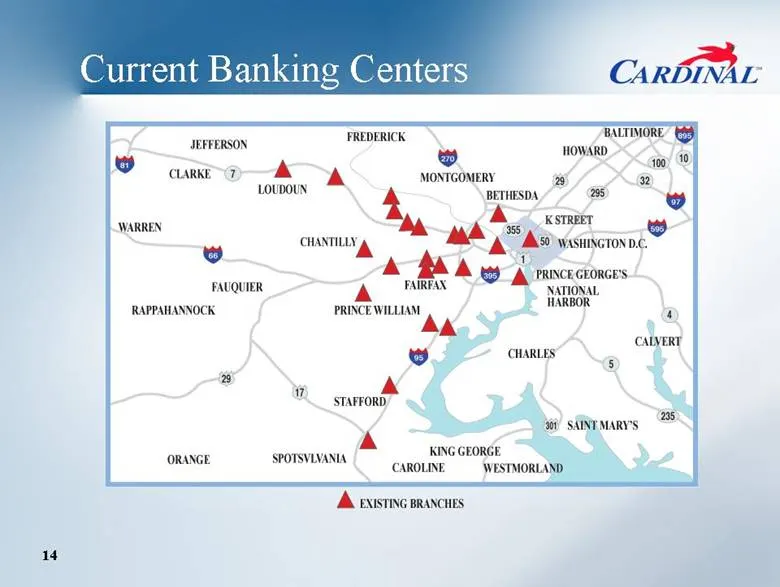
Current Banking Centers 7 CAROL JEFFERSON MONTGOMERY a) KSTREET So cuNxTiyg Dy Of rtd c) ‘ an (A PRINCE GEORGE'S. FAUQUIER A Tee ‘NATIONAL HARBOR. RAPPAHANNOCK PRINCE WILLIAM. AA to) SAINT MARY'S: KING GEORGE SPOTSVINANIN CAROLINE. WESTMORLAND A existe oravcues 14

Slide 15: Financial Overview
15 Financial Overview
Slide 16: Highlights 12/31/07 vs 12/31/06
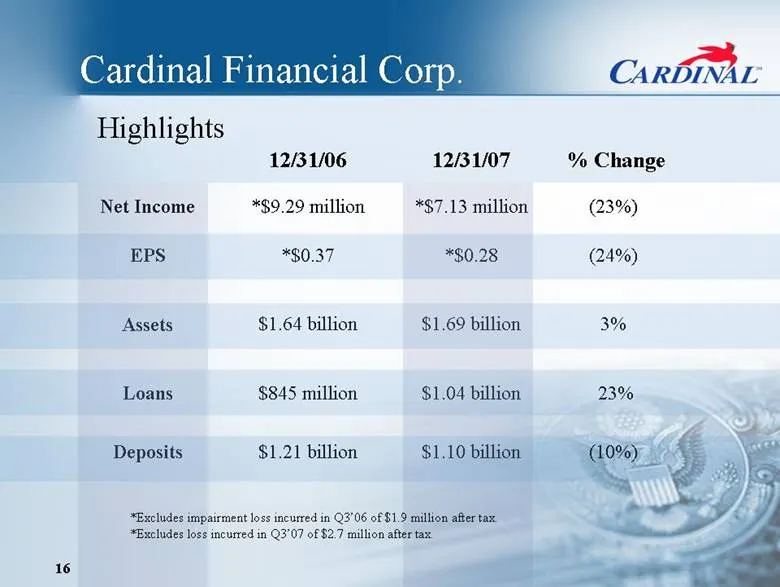
3%Assets (10%) 23% (24%) (23%) 16 Cardinal Financial Corp. $1.21 billion $845 million $1.64 billion *$0.37 *$9.29 million 12/31/06 $1.69 billion $1.10 billion Deposits $1.04 billion Loans *$0.28 EPS *$7.13 million Net Income % Change 12/31/07 Highlights *Excludes impairment loss incurred in Q3’06 of
Slide 17: Quality Annual Growth
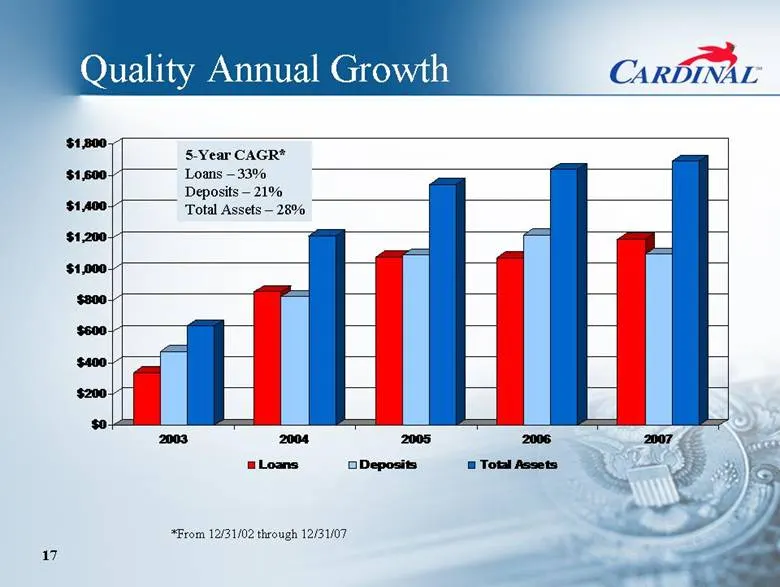
Quality Annual Growth $0 $200 $400 $600 $800 $1,000 $1,200 $1,400 $1,600 $1,800 2003 2004 2005 2006 2007 5-Year CAGR* Loans – 33% Deposits – 21% Total Assets – 28% Loans Deposits Total Assets *From 12/31/02 through 12/31/07
Slide 18: Exceptional Credit Quality
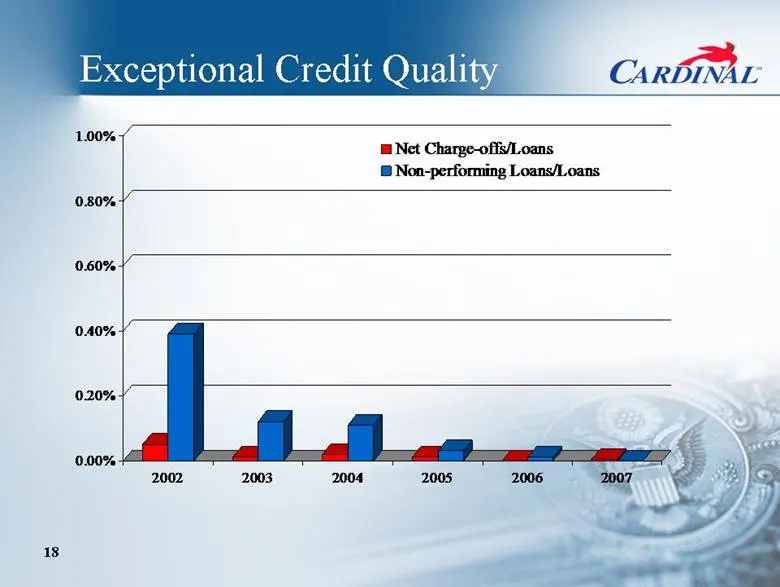
Exceptional Credit Quality 1.00% 0.80% 0.60% 0.40% 0.20% 0.00% Net Charge-offs/Loans Non-performing Loans/Loans 2002 2003 2004 2005 2006 2007
Slide 19: Exceptional Credit Quality
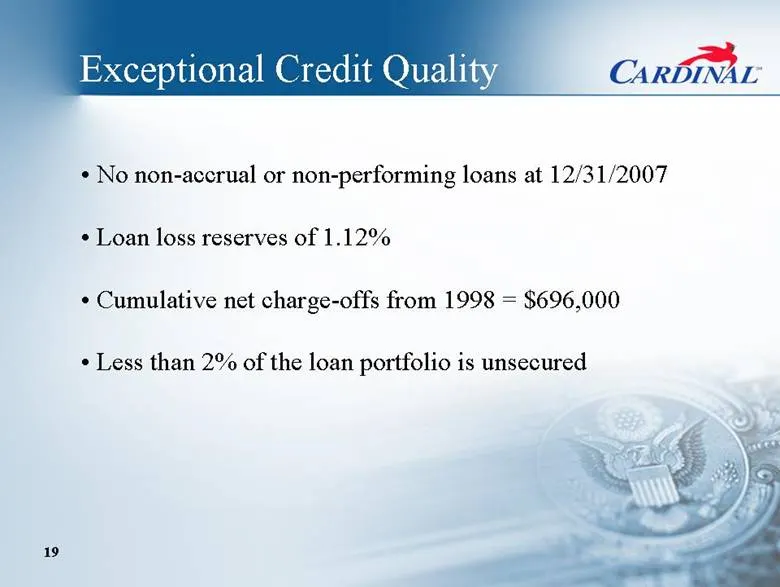
Exceptional Credit Quality • No non-accrual or non-performing loans at 12/31/2007 • Loan loss reserves of 1.12% • Cumulative net charge-offs from 1998 = $696,000 • Less than 2% of the loan portfolio is unsecured
Slide 20: Credit Quality – Virginia Peers
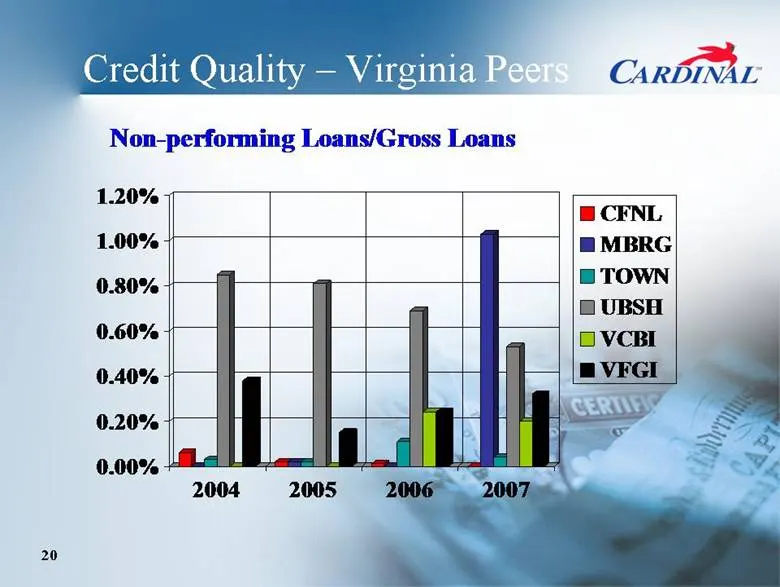
Credit Quality – Virginia Peers Non-performing Loans/Gross Loans 1.20% 1.00% 0.80% 0.60% 0.40% 0.20% 0.00% CFNL MBRG TOWN UBSH VCBI VFGI 2004 2005 2006 2007
Slide 21: Profitability - Bank Only
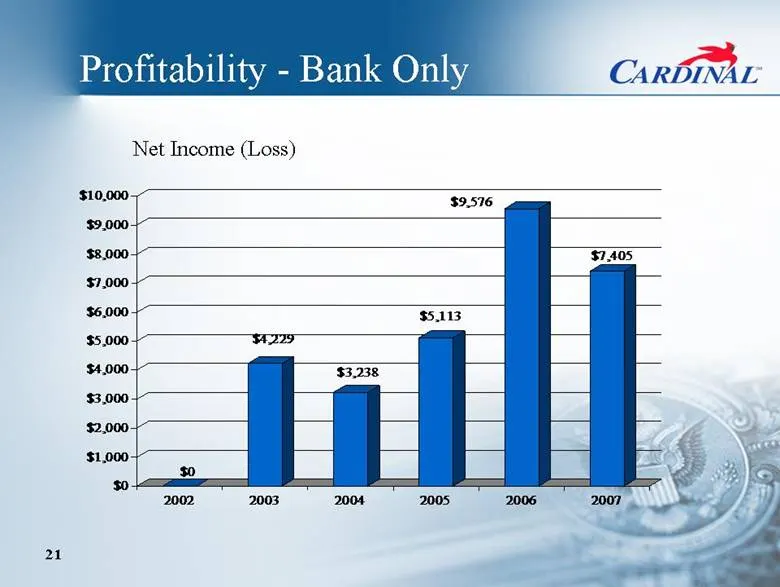
Profitability -Bank Only Net Income (Loss) $10,000 $9,000 $8,000 $7,000 $6,000 $5,000 $4,000 $3,000 $2,000 $1,000 $0 $0 $4,229 $3,238 $5,113 $9,576 $7,405 2002 2003 2004 2005 2006 2007
Slide 22: Deposit Mix
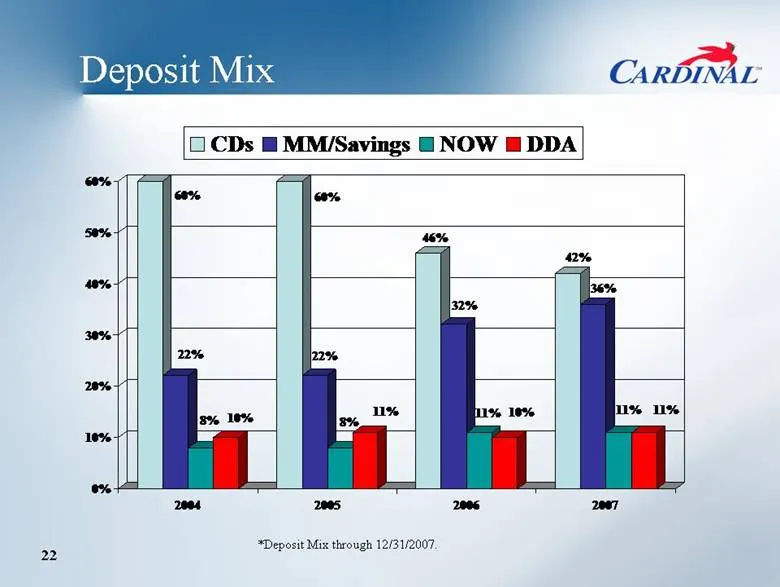
Deposit Mix CDs MM/Savings NOW DDA 60% 22% 8% 10% 60% 22% 8% 11% 46% 32% 11% 10% 42% 36% 11% 11% 0% 10% 20% 30% 40% 50% 60% 2004 2005 2006 2007 *Deposit Mix through 12/31/2007.
Slide 23: Target Loan Mix
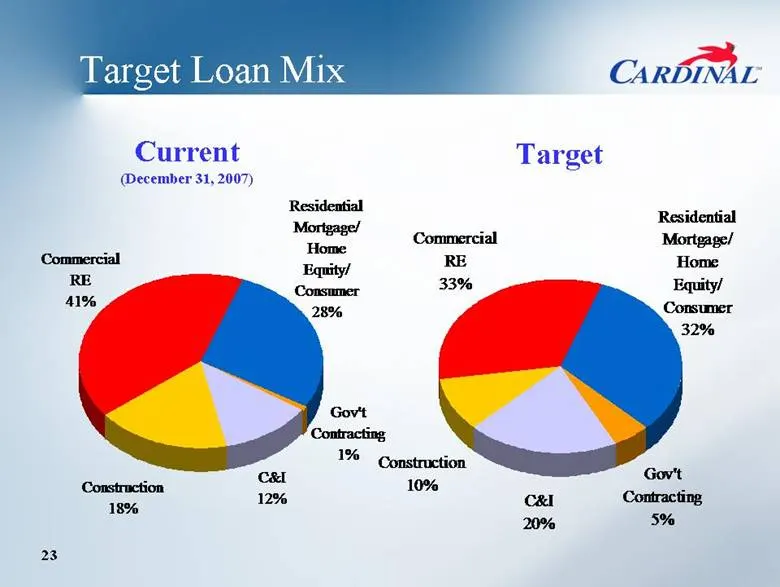
Target Loan Mix Current Target (December 31, 2007) Residential Mortgage/ Residential Home Commercial Mortgage/ Commercial Equity/ RE Home Equity/ Consumer Consumer 28% 32% Gov't Contracting 1% Construction C&I Gov't RE 33% 41% Construction 10% 12% C&I Contracting 18% 20% 5%
Slide 24: Commercial Real Estate Portfolio Occupancy
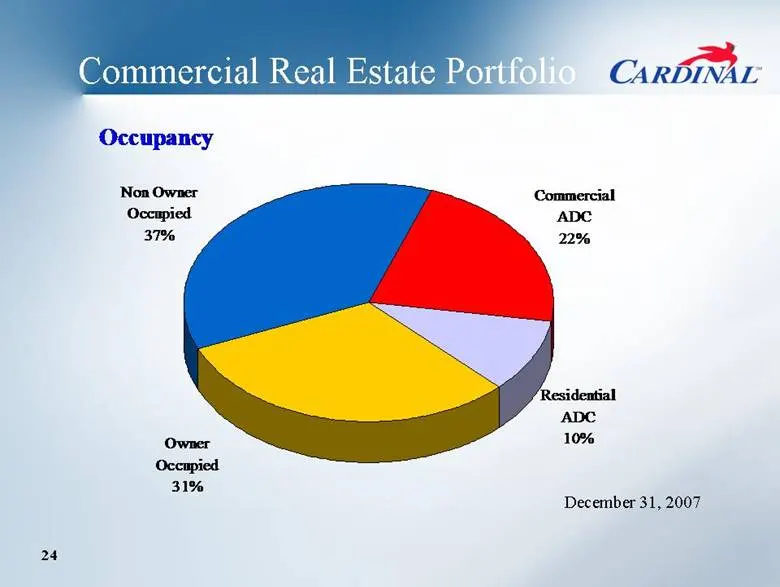
Commercial Real Estate Portfolio Occupancy Non Owner Commercial Occupied ADC 37% 22% Residential ADC Owner 10% Occupied 31% December 31, 2007
Slide 25: Commercial Real Estate Portfolio Property Type
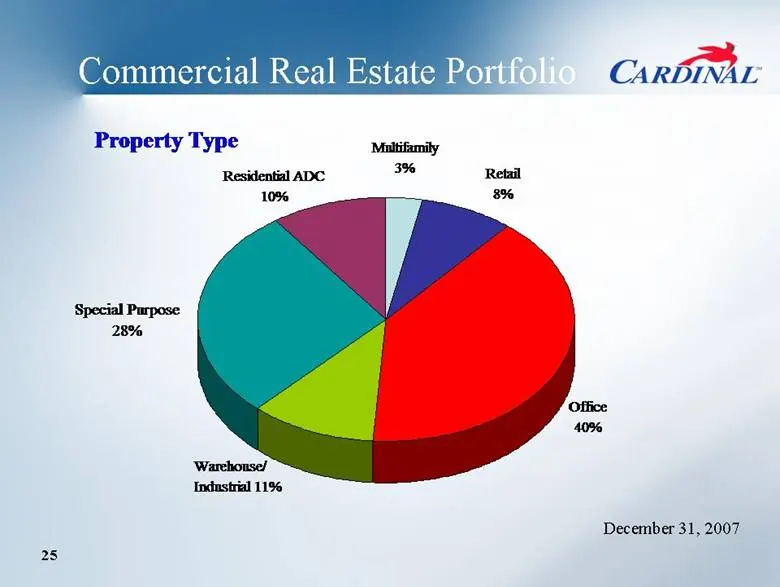
Commercial Real Estate Portfolio Property Type Multifamily Residential ADC 3% Retail 10% 8% Special Purpose 28% Office 40% Warehouse Industrial 11% / December 31, 2007
Slide 26: Commercial Real Estate Portfolio Special Purpose
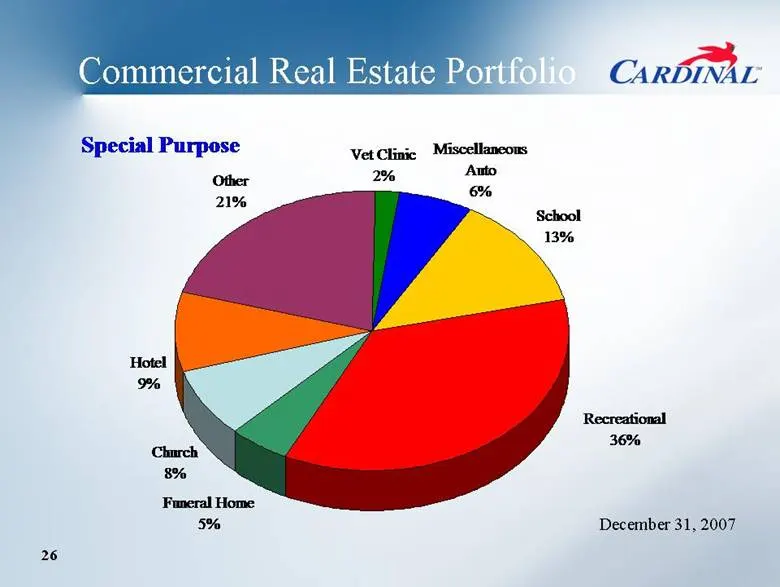
Commercial Real Estate Portfolio Special Purpose Vet Clinic Miscellaneous 8% 9% 2% 6% School 13% Funeral Home Church Hotel Other 21% Recreational 36% Auto 5% December 31, 2007

Slide 27: Strategic Priorities
27 Strategic Priorities
Slide 28: Local Market Strategy
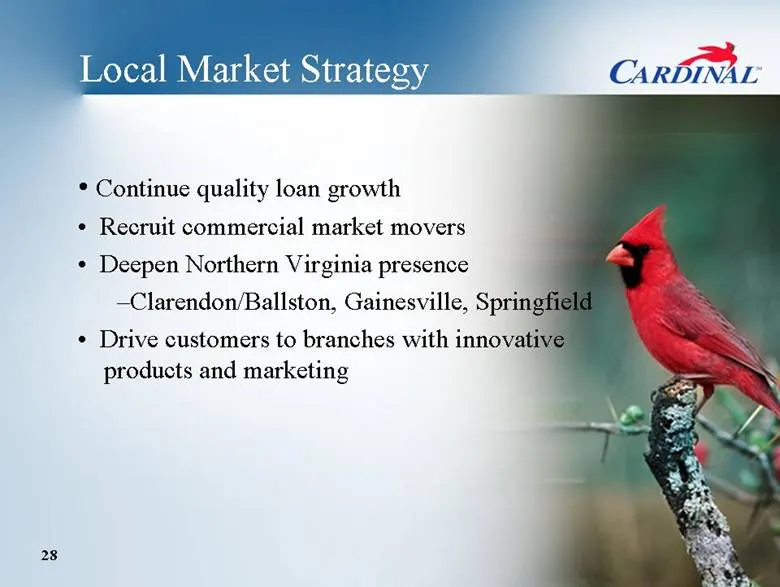
Local Market Strategy • Continue quality loan growth • Recruit commercial market movers • Deepen Northern Virginia presence –Clarendon/Ballston, Gainesville, Springfield • Drive customers to branches with innovative products and marketing
Slide 29: Future Branch Expansion
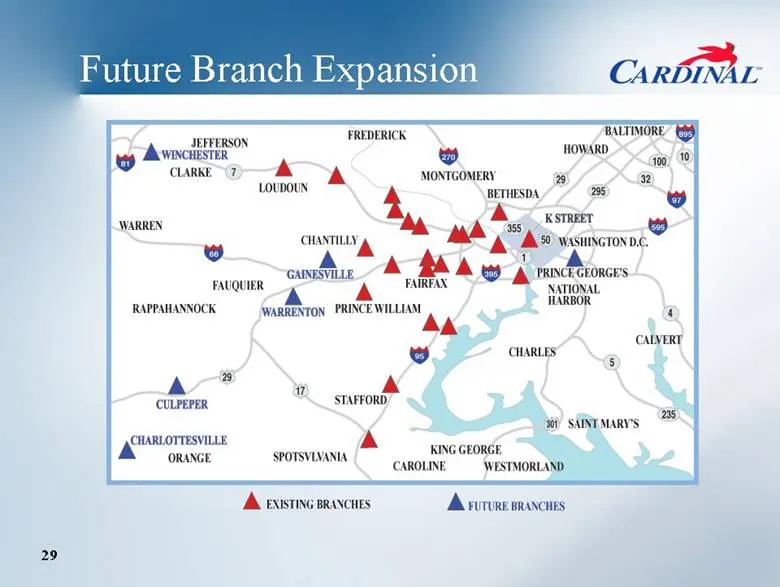
Future Branch Expansion CARDIAL JRIvERSON FREDERICK 8 vcr L") >—h —,% MONTGOMERY LOUDOUN BETHESDA KSTREET A cut yg aA A Ae Yr a be) A ahh AA rancicionces ravouier GANT 7 Cem NATIONAL HARBOR RAPPAHANNOCK WARRENTON PRINCE WILLIAM nr a= CULPEPER 3) SAINT MARY'S: (CHARLOTTESVILLE A onance SPOTSVLVANIA K
Slide 30: Acquisition Strategy
Acquisition Strategy • Banking – Highly disciplined approach • Focus on Virginia population centers • High quality institutions • Strong local market leadership • Non-Banking – Focus on complementary product line offerings • Insurance agency • Real estate brokerage

Slide 31: Stock Valuation
31 Stock Valuation
Slide 32: Stock Profile
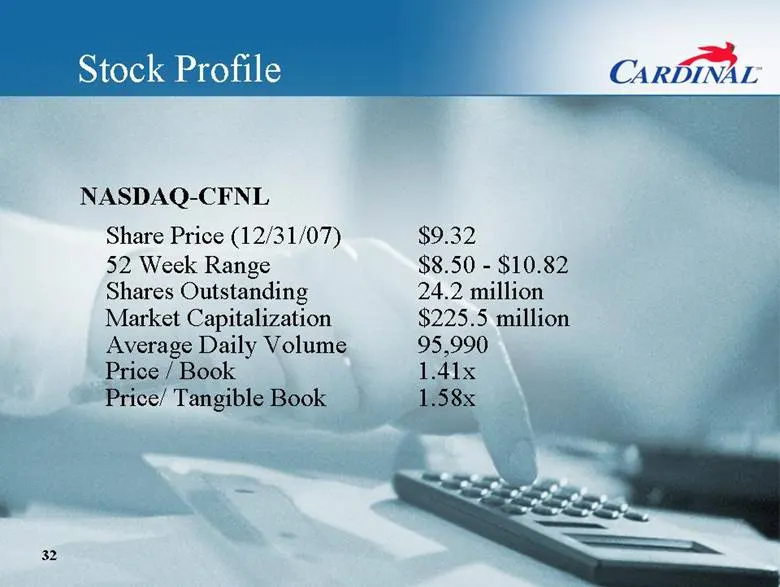
Stock Profile NASDAQ-CFNL Share Price (12/31/07) 52 Week Range Shares Outstanding Market Capitalization Average Daily Volume Price / Book Price/ Tangible Book $9.32 $8.50 -$10.82 24.2 million $225.5 million 95,990 1.41x 1.58x
Slide 33: Virginia Bank Holding Companies
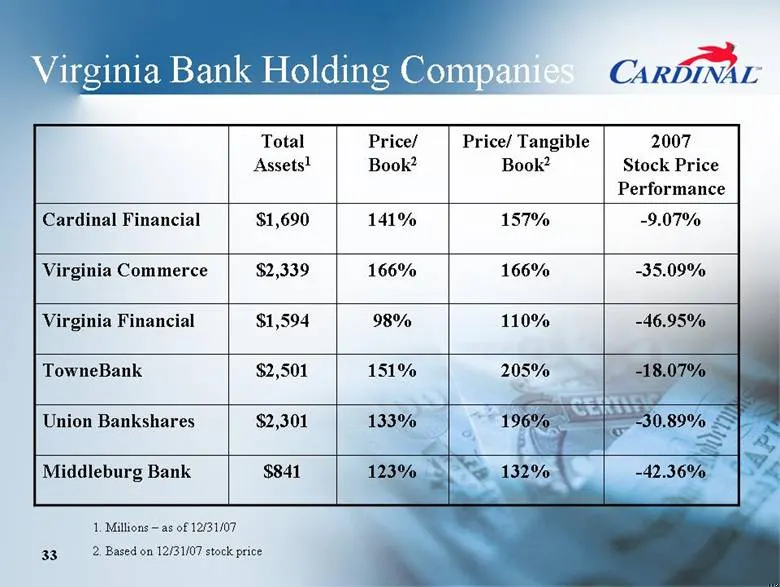
Virginia Bank Holding Companies Total Assets1 Price/ Book2 Price/ Tangible Book2 2007 Stock Price Performance Cardinal Financial $1,690 141% 157% -9.07% Virginia Commerce $2,339 166% 166% -35.09% Virginia Financial $1,594 98% 110% -46.95% TowneBank $2,501 151% 205% -18.07% Union Bankshares $2,301 13
Slide 34: Future Branch Expansion
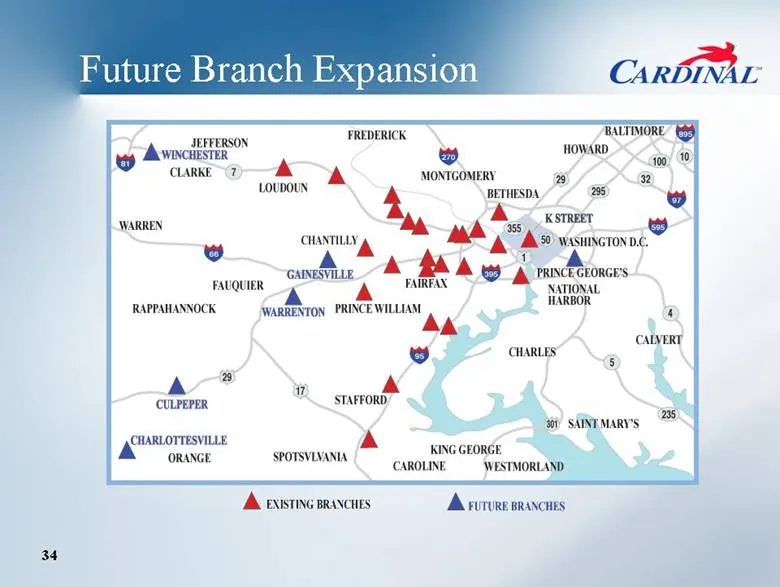
Future Branch Expansion CARDIAL JRIvERSON FREDERICK 8 vcr L") >—h —,% MONTGOMERY LOUDOUN BETHESDA KSTREET A cut yg aA A Ae Yr a be) A ahh AA rancicionces ravouier GANT 7 Cem NATIONAL HARBOR RAPPAHANNOCK WARRENTON PRINCE WILLIAM nr a= CULPEPER 3) SAINT MARY'S: (CHARLOTTESVILLE A onance SPOTSVLVANIA K
Slide 35: Cardinal Financial Corporation Raymond James Investor Conference
Cardinal Financial Corporation Raymond James Investor Conference March 4, 2008
Source: SEC EDGAR · 8-K filed Mar 4, 2008
More decks from Cardinal Financial Corp
 Merger or Acquisition (August 2016)10 slides · Aug 18, 2016
 KBW Winter Financial Services Symposium 201633 slides · Feb 11, 2016
 Boenning & Scattergood Field Trip (November 2015)31 slides · Nov 2, 2015
 Raymond James 2015 U.S. Bank Conference31 slides · Sep 9, 2015
 Keefe, Bruyette & Woods 2015 Community Bank Investor Conference31 slides · Jul 28, 2015
 34th Annual Raymond James Institutional Investors Conference 201529 slides · Mar 3, 2015