Ditech — Walter Investment Management — Q1 2010 Earnings Presentation
31 slides from Ditech's earnings presentation, May 5, 2010
Slide 1: WIMC Review 1st Quarter 2010
MANAGEMENT CORP. WIMC Review 1st Quarter 2010
Slide 2: Table of Contents
2 Table of Contents Safe Harbor Statement..................................... 3 Introduction............................................................... 4 Balance Sheet........................................................ 5 Income Statement.............................................. 8 Port
Slide 3: Safe Harbor Statement
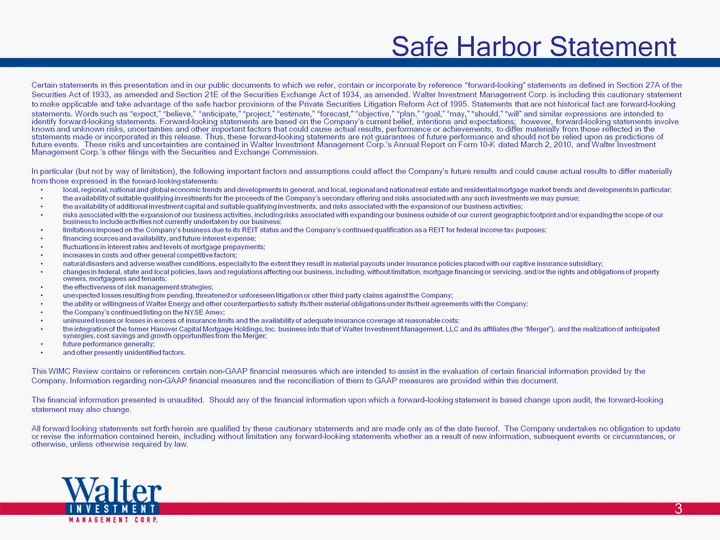
3 Safe Harbor Statement Certain statements in this presentation and in our public documents to which we refer, contain or incorporate by reference "forward-looking" statements as defined in Section 27A of the Securities Act of 1933, as amended and Section 21E of the Securities Exchange Act of 1934,
Slide 4: Introduction
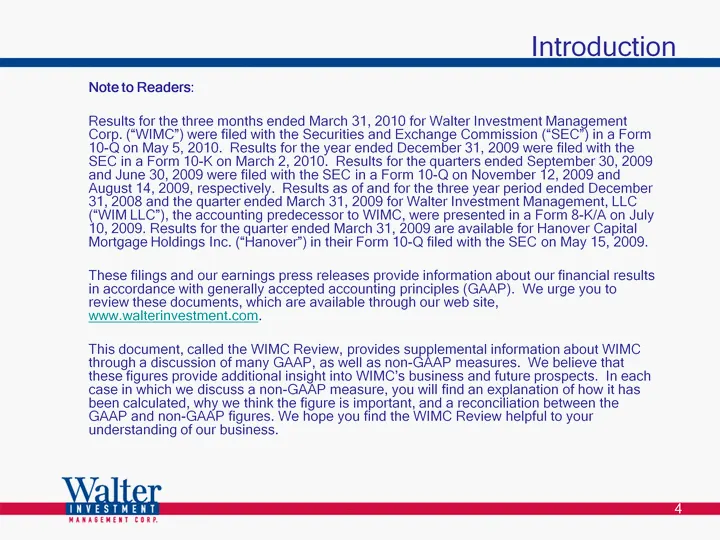
4 Introduction Note to Readers: Results for the three months ended March 31, 2010 for Walter Investment Management Corp. ("WIMC") were filed with the Securities and Exchange Commission ("SEC") in a Form 10-Q on May 5, 2010. Results for the year ended December 31, 2009 were filed with the SEC in a Fo
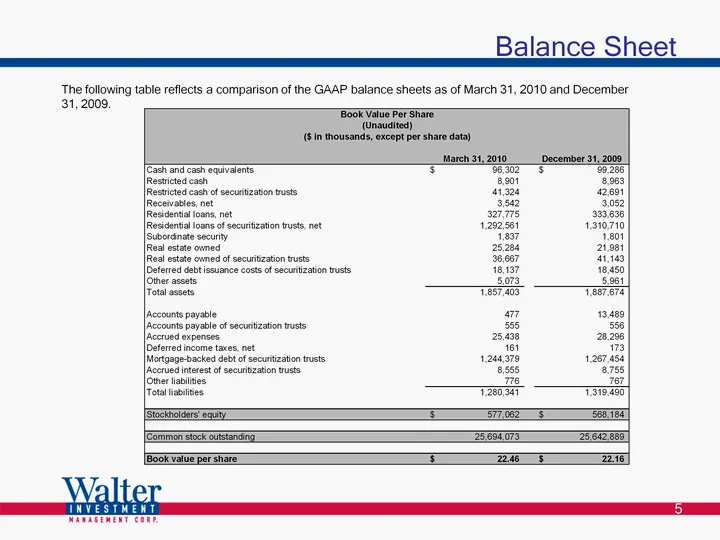
Slide 5: Balance Sheet
5 Balance Sheet The following table reflects a comparison of the GAAP balance sheets as of March 31, 2010 and December 31, 2009.
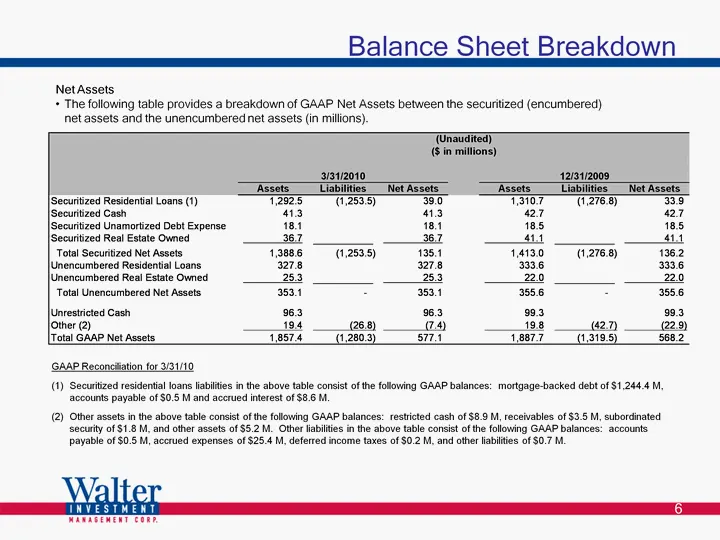
Slide 6: Balance Sheet Breakdown
6 Balance Sheet Breakdown Net Assets The following table provides a breakdown of GAAP Net Assets between the securitized (encumbered) net assets and the unencumbered net assets (in millions). GAAP Reconciliation for 3/31/10 (1) Securitized residential loans liabilities in the above table consist of
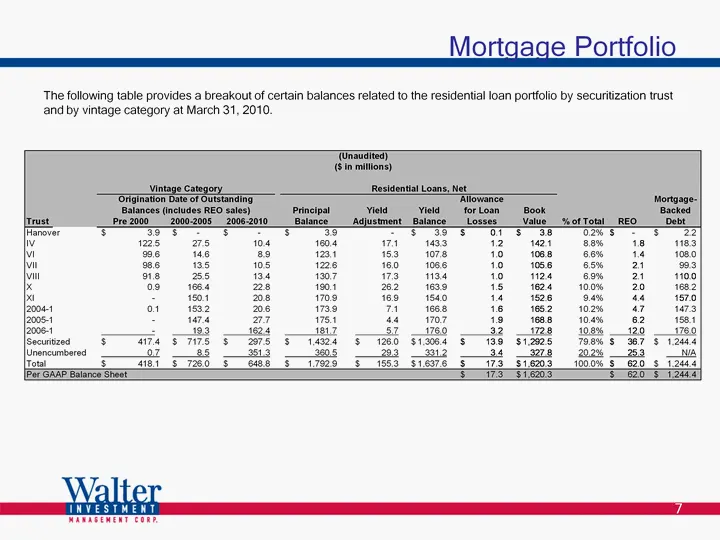
Slide 7: Mortgage Portfolio
7 Mortgage Portfolio The following table provides a breakout of certain balances related to the residential loan portfolio by securitization trust and by vintage category at March 31, 2010.
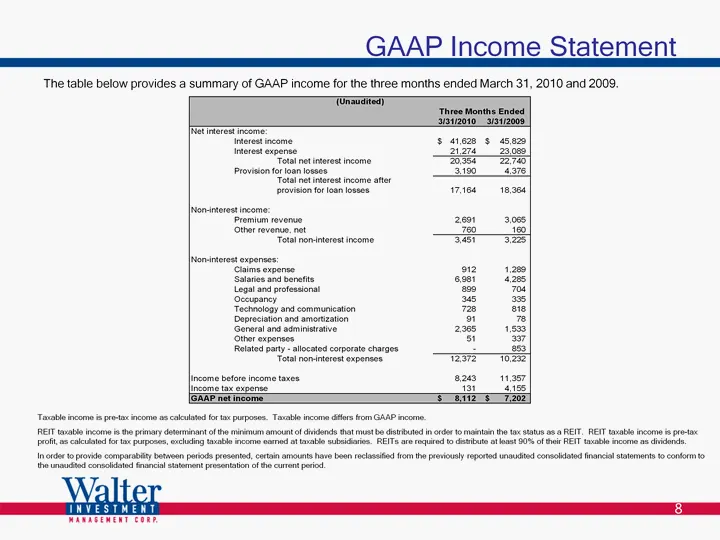
Slide 8: GAAP Income Statement
8 GAAP Income Statement The table below provides a summary of GAAP income for the three months ended March 31, 2010 and 2009. Taxable income is pre-tax income as calculated for tax purposes. Taxable income differs from GAAP income. REIT taxable income is the primary determinant of the minimum amount
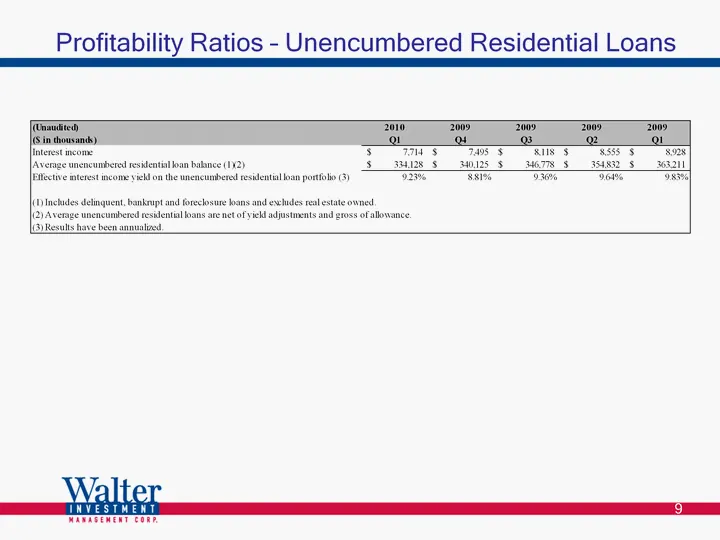
Slide 9: Profitability Ratios - Unencumbered Residential Loans
9 Profitability Ratios - Unencumbered Residential Loans
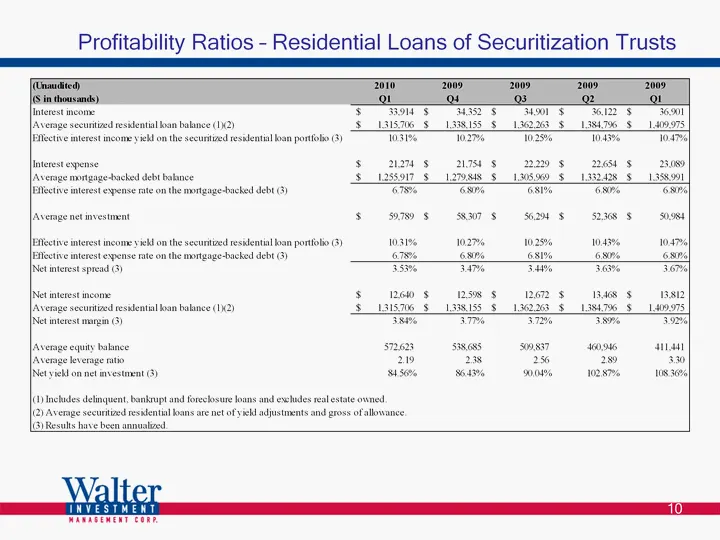
Slide 10: Profitability Ratios - Residential Loans of Securitization Trusts
10 Profitability Ratios - Residential Loans of Securitization Trusts
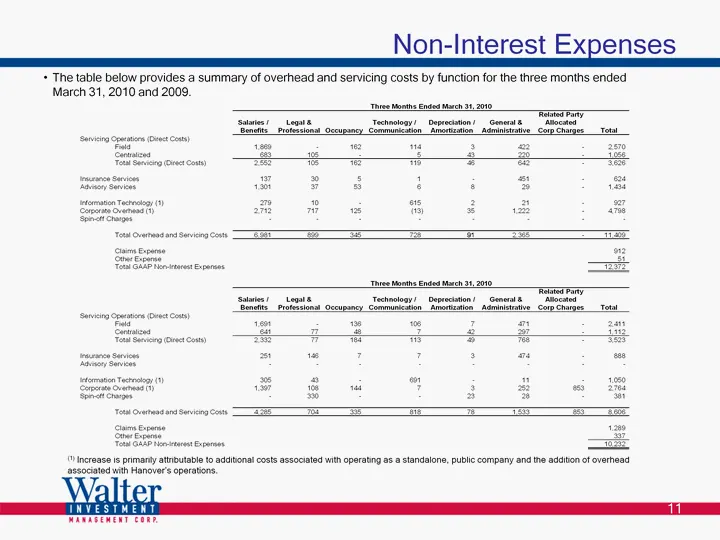
Slide 11: Non-Interest Expenses
11 Non-Interest Expenses The table below provides a summary of overhead and servicing costs by function for the three months ended March 31, 2010 and 2009. (1) Increase is primarily attributable to additional costs associated with operating as a standalone, public company and the addition of overhea
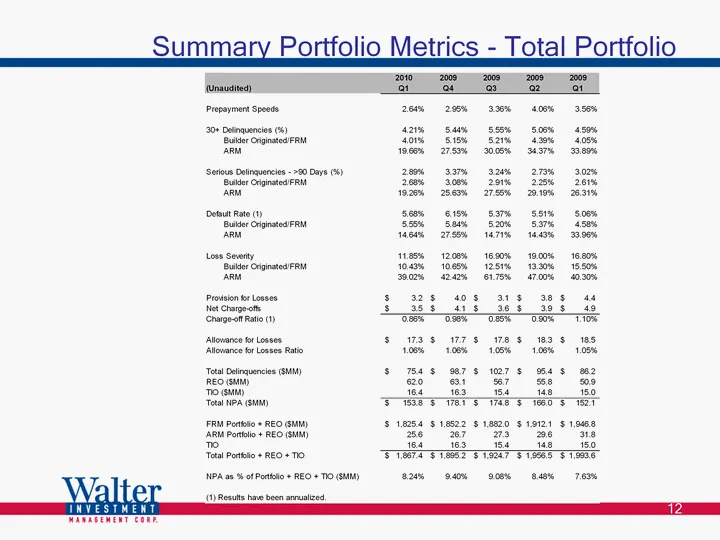
Slide 12: Summary Portfolio Metrics - Total Portfolio
12 Summary Portfolio Metrics - Total Portfolio
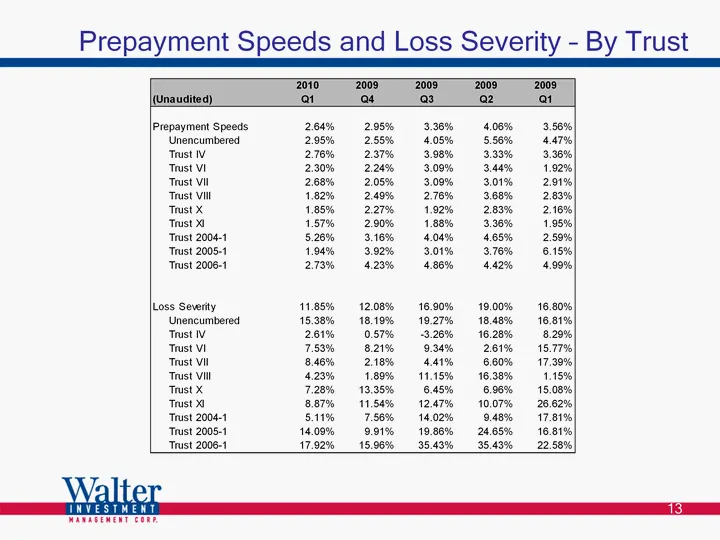
Slide 13: Prepayment Speeds and Loss Severity - By Trust
13 Prepayment Speeds and Loss Severity - By Trust
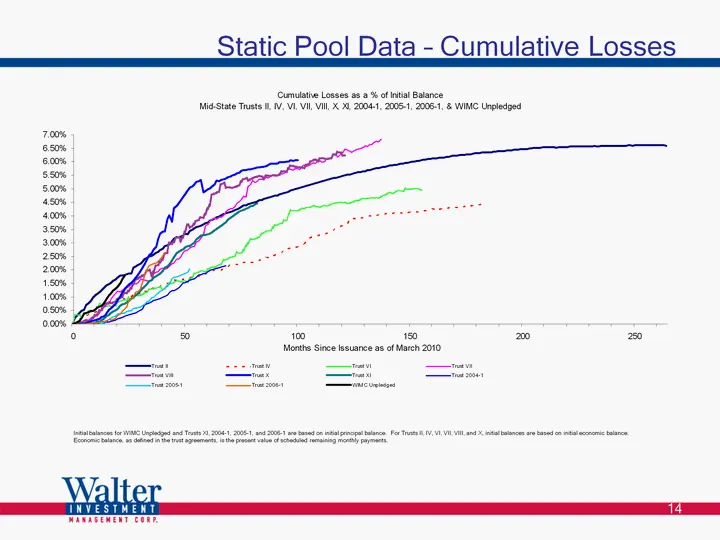
Slide 14: Static Pool Data - Cumulative Losses
14 Static Pool Data - Cumulative Losses Initial balances for WIMC Unpledged and Trusts XI, 2004-1, 2005-1, and 2006-1 are based on initial principal balance. For Trusts II, IV, VI, VII, VIII, and X, initial balances are based on initial economic balance. Economic balance, as defined in the trust agr
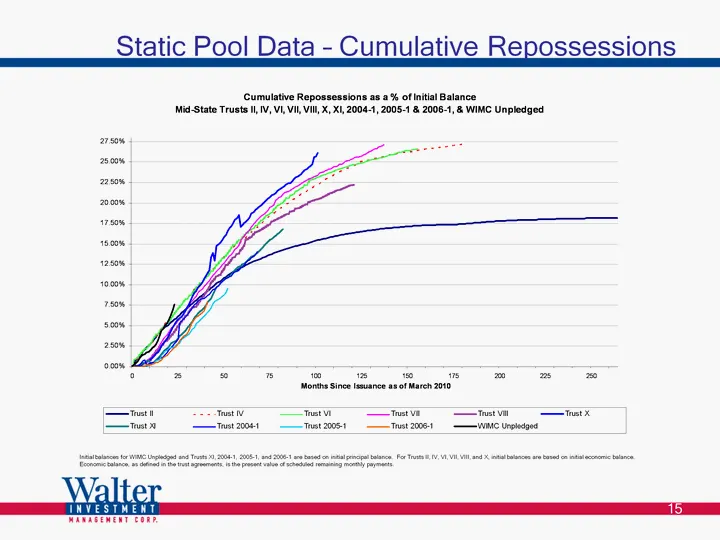
Slide 15: Static Pool Data - Cumulative Repossessions
15 Static Pool Data - Cumulative Repossessions Initial balances for WIMC Unpledged and Trusts XI, 2004-1, 2005-1, and 2006-1 are based on initial principal balance. For Trusts II, IV, VI, VII, VIII, and X, initial balances are based on initial economic balance. Economic balance, as defined in the tr
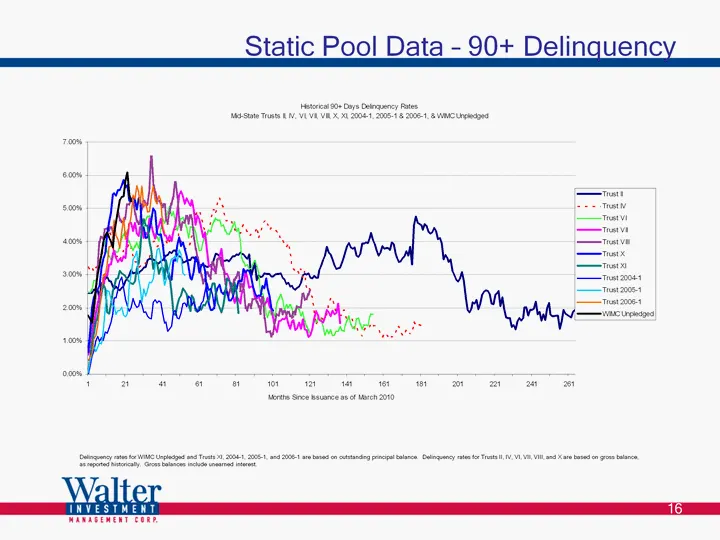
Slide 16: Static Pool Data - 90+ Delinquency
16 Static Pool Data - 90+ Delinquency Delinquency rates for WIMC Unpledged and Trusts XI, 2004-1, 2005-1, and 2006-1 are based on outstanding principal balance. Delinquency rates for Trusts II, IV, VI, VII, VIII, and X are based on gross balance, as reported historically. Gross balances include unea
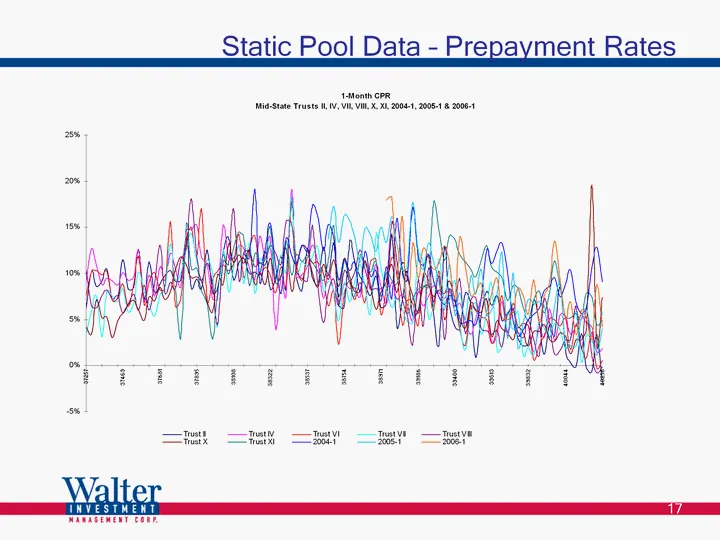
Slide 17: Static Pool Data - Prepayment Rates
17 Static Pool Data - Prepayment Rates
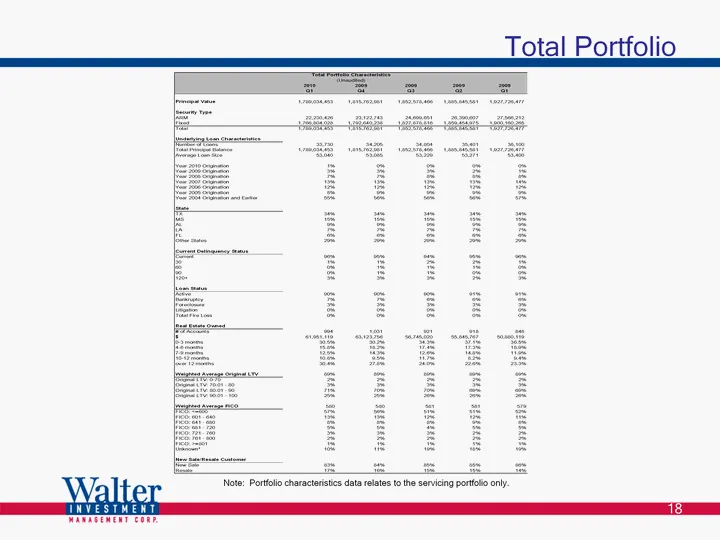
Slide 18: Total Portfolio
18 Total Portfolio Note: Portfolio characteristics data relates to the servicing portfolio only.
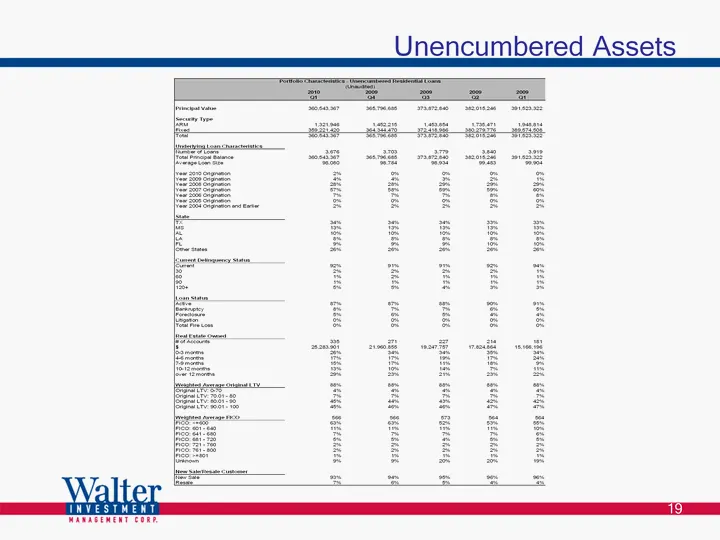
Slide 19: Unencumbered Assets
Unencumbered Assets aah aan aaa sail
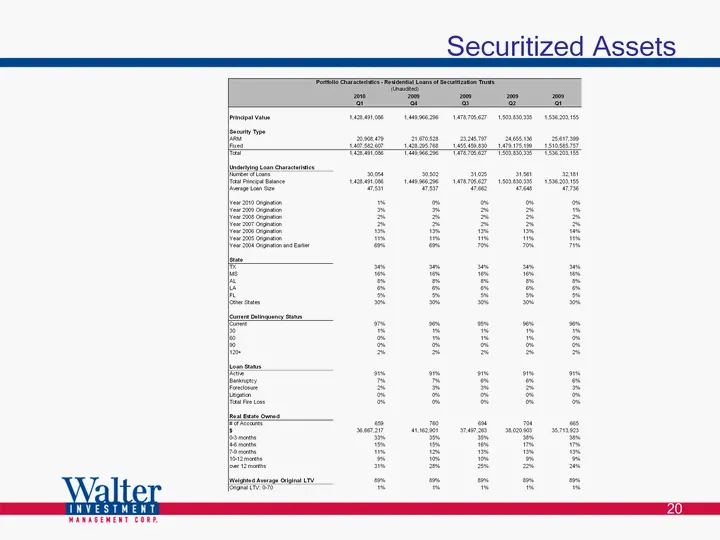
Slide 20: Securitized Assets
Securitized Assets S930 g9y7} ya90) Yanndd 9990 i
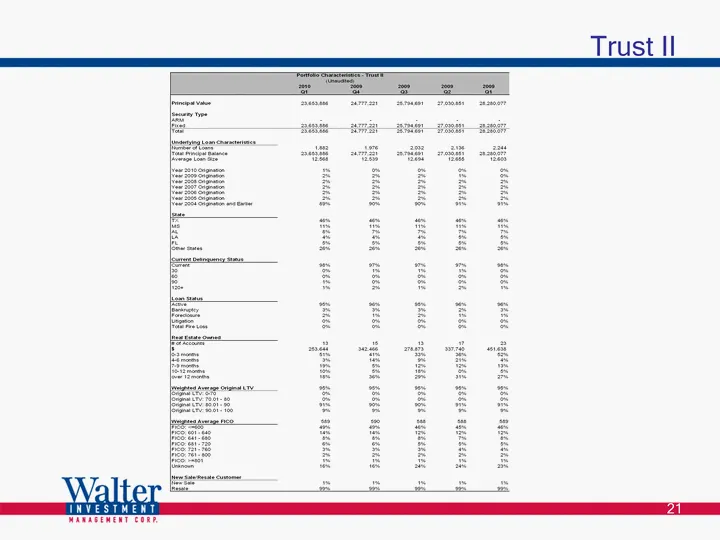
Slide 21: Trust II
21 Trust II
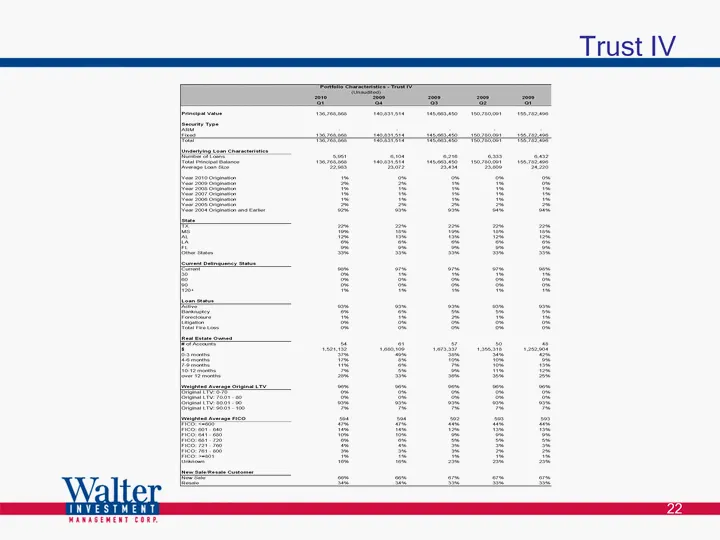
Slide 22: Trust IV
Trust IV fared Hatt hand init wash and init
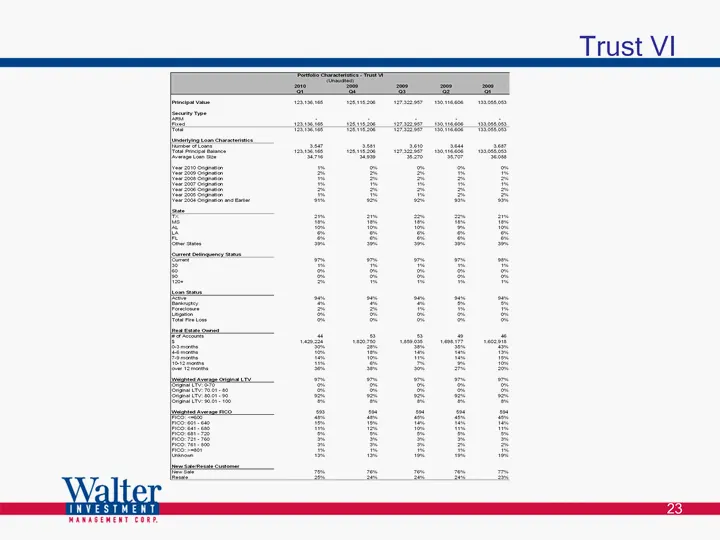
Slide 23: Trust VI
23 Trust VI
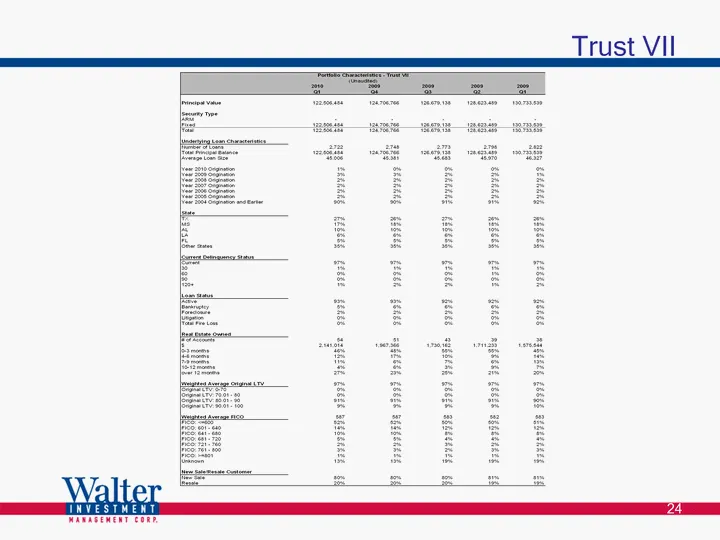
Slide 24: Trust VII
Trust VII svi s3987 oesiHe 1i09
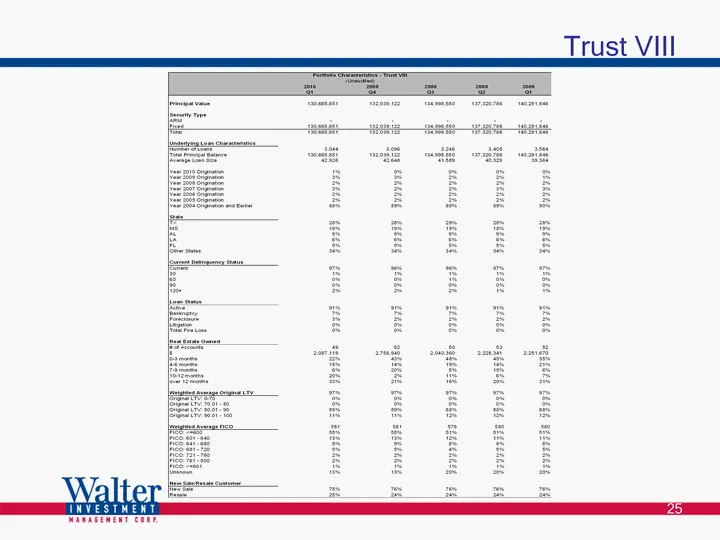
Slide 25: Trust VIII
Trust VIII savai vasad Sanit ty
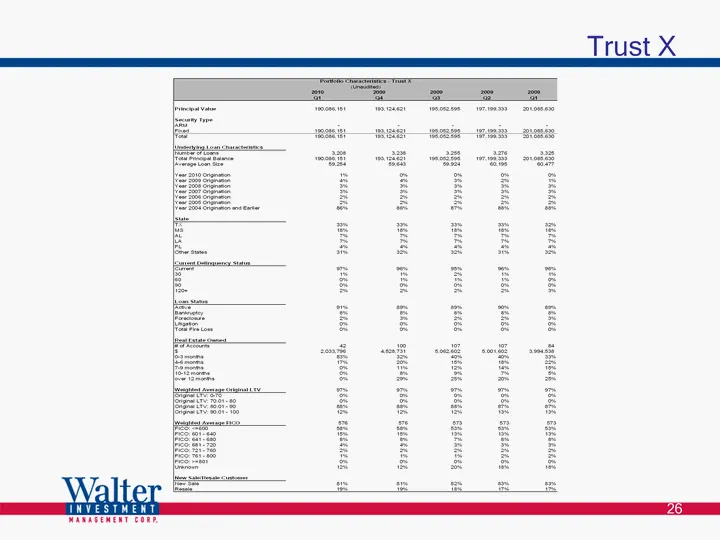
Slide 26: Trust X
Trust X seh asad ai fe
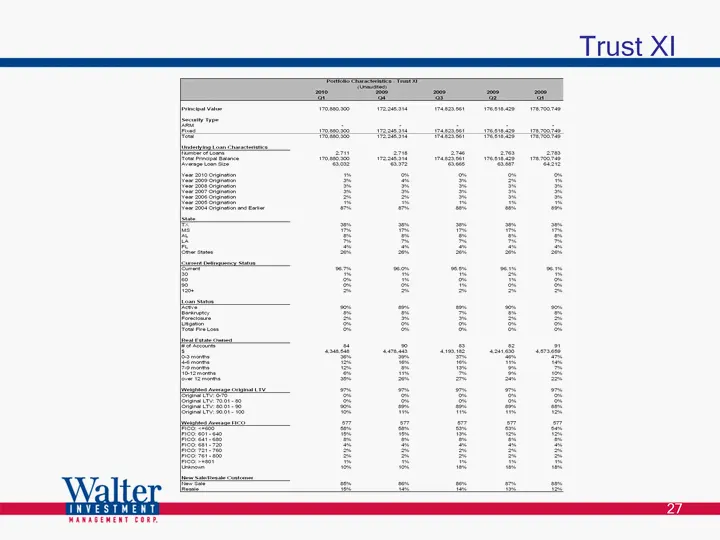
Slide 27: Trust XI
Trust XI B Yann Jan sad yaad
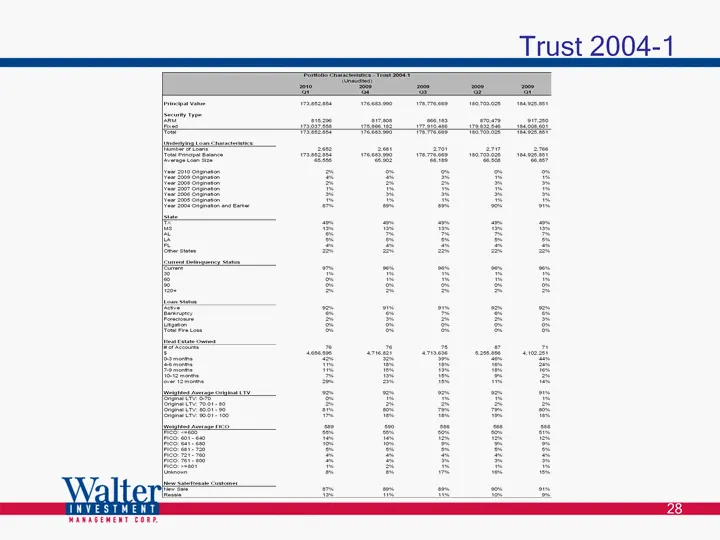
Slide 28: Trust 2004-1
Trust 2004-1 sat vied avid tan
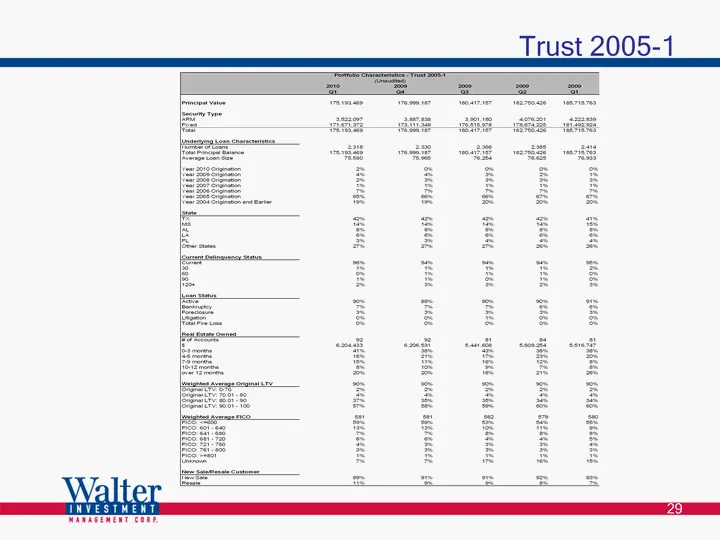
Slide 29: Trust 2005-1
Trust 2005-1 daeeite Thy fan }
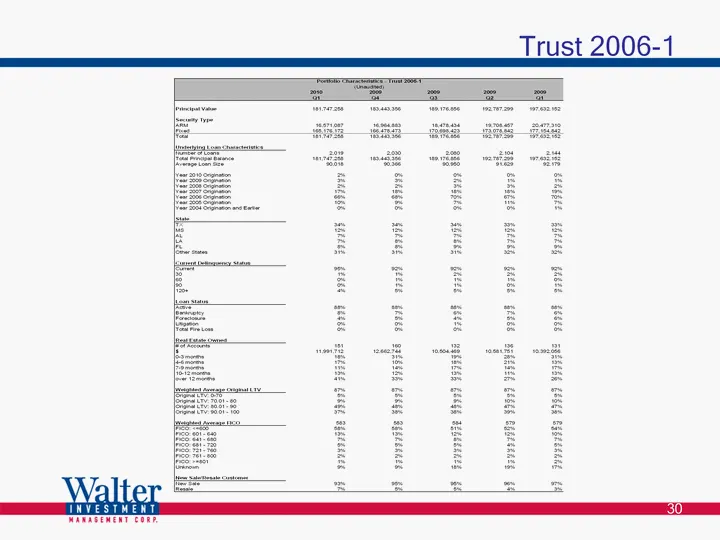
Slide 30: Trust 2006-1
Trust 2006-1 wait waned Sanit aoa haat
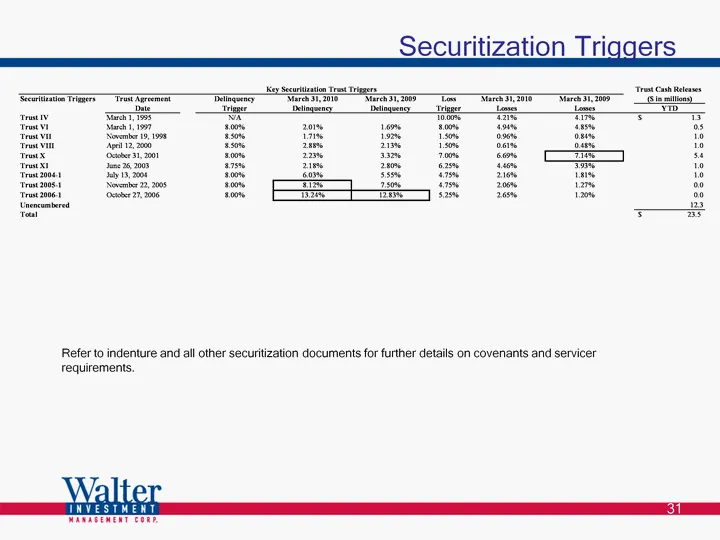
Slide 31: Securitization Triggers
31 Securitization Triggers Refer to indenture and all other securitization documents for further details on covenants and servicer requirements.
Source: SEC EDGAR · 8-K filed May 5, 2010
More decks from Ditech Holding Corporation
 Presentation (December 2018)27 slides · Dec 14, 2018
 Q2 2018 Earnings Presentation21 slides · Aug 9, 2018
 Q1 2018 Earnings Presentation27 slides · Jun 6, 2018
 Walter Investment Management — Debt Investor Presentation (October 2017)15 slides · Oct 23, 2017
 Walter Investment Management — Debt Investor Presentation (August 2017)35 slides · Aug 1, 2017
 Walter Investment Management — Debt Investor Presentation (August 2017)5 slides · Aug 1, 2017