Spire Healthcare Group PLC · LSE:SPI
Spire Healthcare — H1 2022 Earnings Presentation
35 slides from Spire Healthcare's earnings presentation, Sep 8, 2022

Slide 1: H1 22 Results Presentation
H1 22 Results Presentation 8 September 2022
Slide 2: Disclaimer
Disclaimer These materials contain certain forward-looking statements relating to the business of Spire Healthcare Group plc (the “Company”), including with respect to the progress, timing and completion of the Company’s development, the Company’s ability to treat, attract, and retain patients and c
Slide 3: Zoom Webinar rules of engagement
Zoom Webinar rules of engagement All attendee lines are muted The Chat function is disabled Please submit your name and organisation using the Q&A function Angus will moderate the session and unmute your line for you to ask your question Any problems please email Laura.Young@spirehealthcare.com 3
Slide 4: Agenda
Agenda H1 22 Overview Justin Ash, Chief Executive Officer H1 22 Financial Review Harbant Samra, Interim Chief Financial Officer Operational Highlights and Strategic Developments Justin Ash, Chief Executive Officer Q&A 4

Slide 5: H1 22 Overview
H1 22 Overview Justin Ash, Chief Executive Officer
Slide 6: Our purpose: Making a positive difference to people's lives through outstanding personalised care
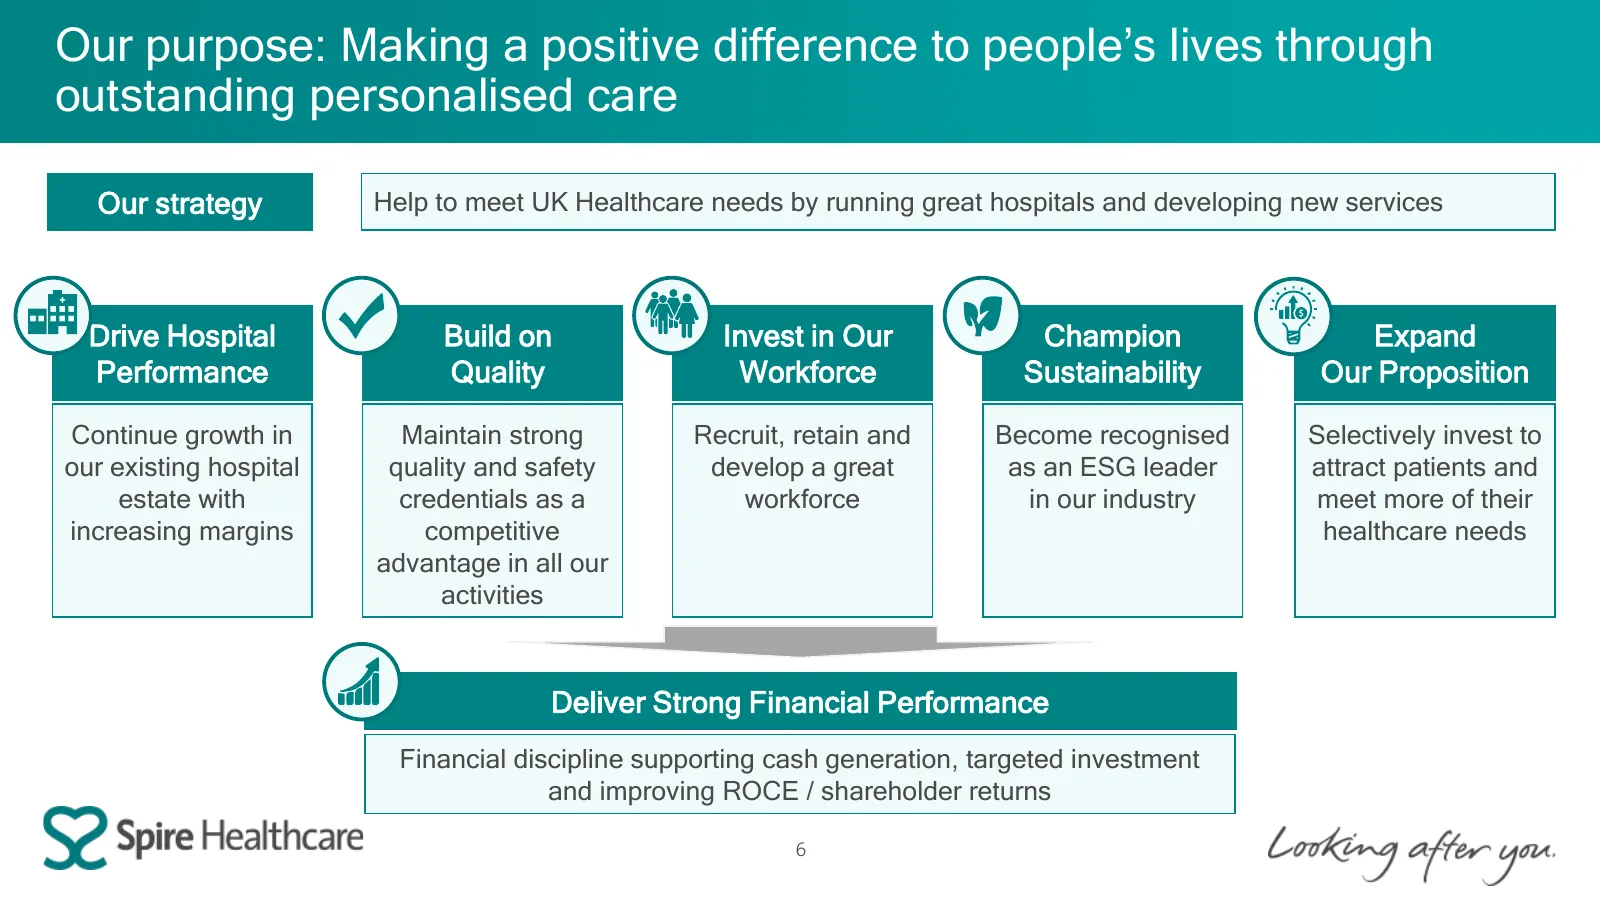
Our purpose: Making a positive difference to people’s lives through outstanding personalised care Our strategy Help to meet UK Healthcare needs by running great hospitals and developing new services Drive Hospital Build on Invest in Our Champion Expand Performance Quality Workforce Sustainability Ou
Slide 7: H1 22 – a period of good progress
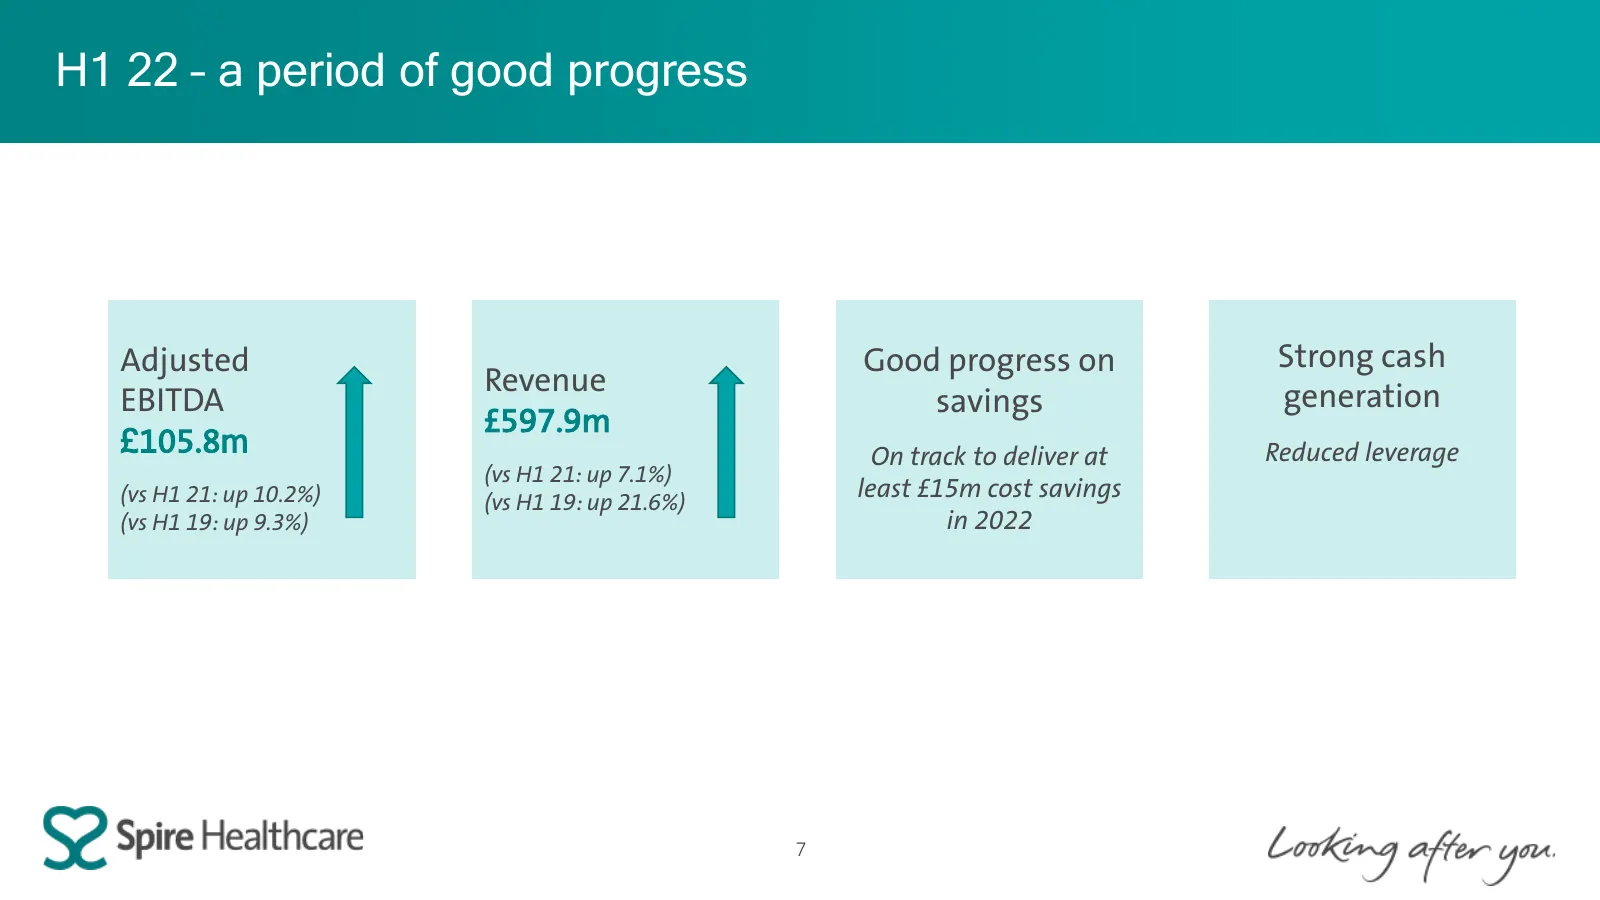
H1 22 – a period of good progress Adjusted Good progress on Strong cash Revenue generation EBITDA savings £597.9m £105.8m On track to deliver at Reduced leverage (vs H1 21: up 7.1%) (vs H1 21: up 10.2%) (vs H1 19: up 21.6%) least £15m cost savings (vs H1 19: up 9.3%) in 2022 7
Slide 8: Drivers of our performance
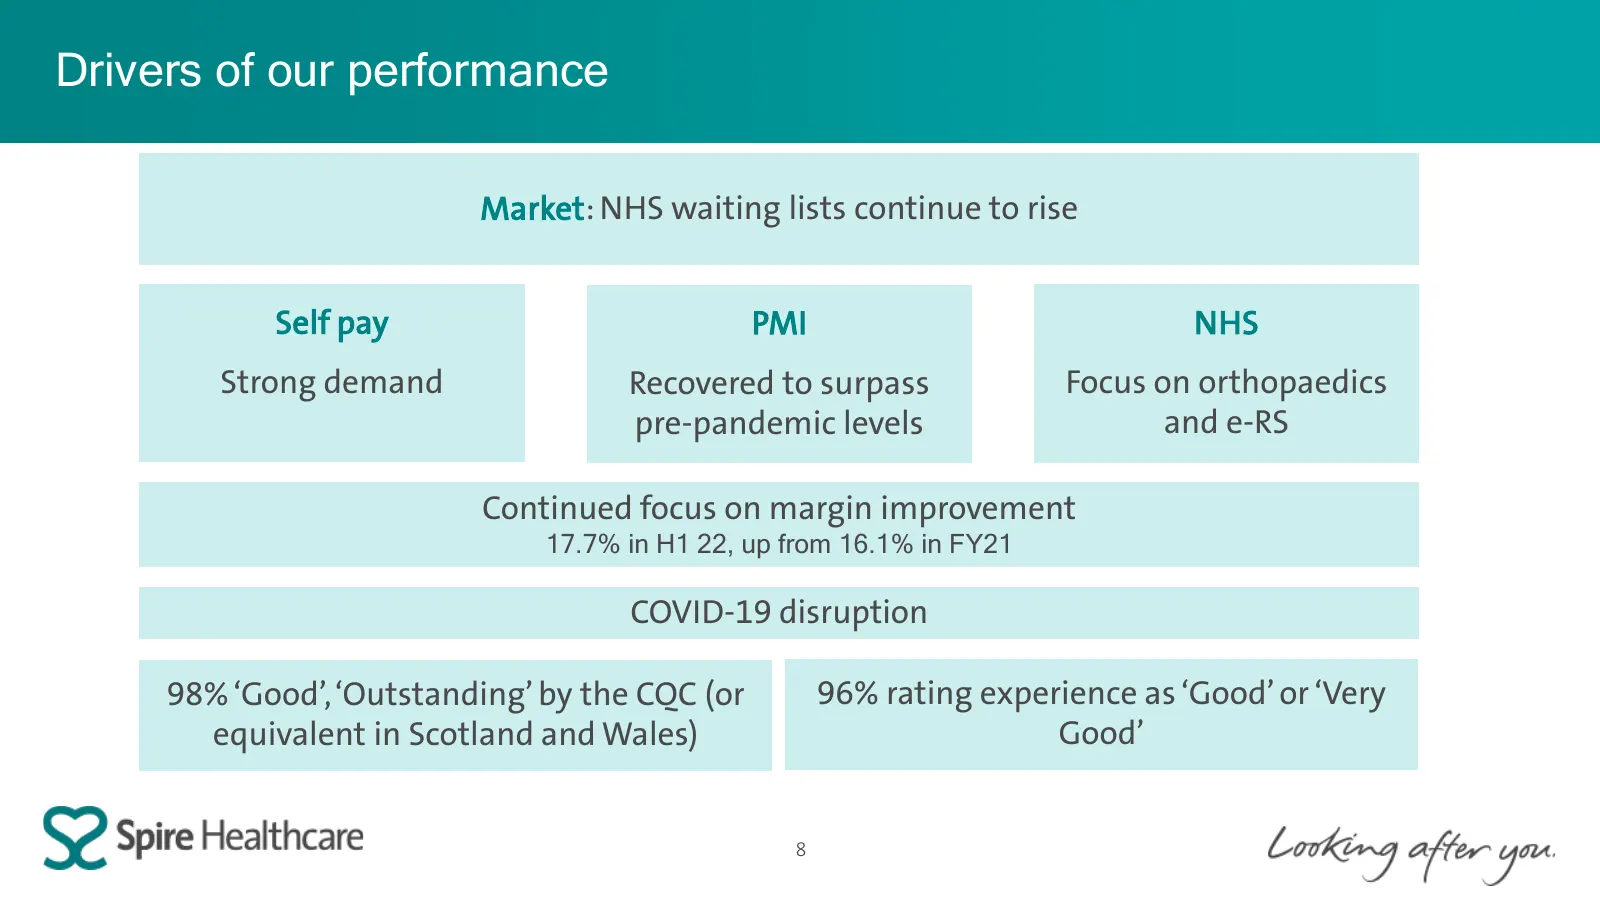
Drivers of our performance Market: NHS waiting lists continue to rise Self pay PMI NHS Strong demand Recovered to surpass Focus on orthopaedics pre-pandemic levels and e-RS Continued focus on margin improvement 17.7% in H1 22, up from 16.1% in FY21 COVID-19 disruption 98% ‘Good’, ‘Outstanding’ by th
Slide 9: Thank you to our people
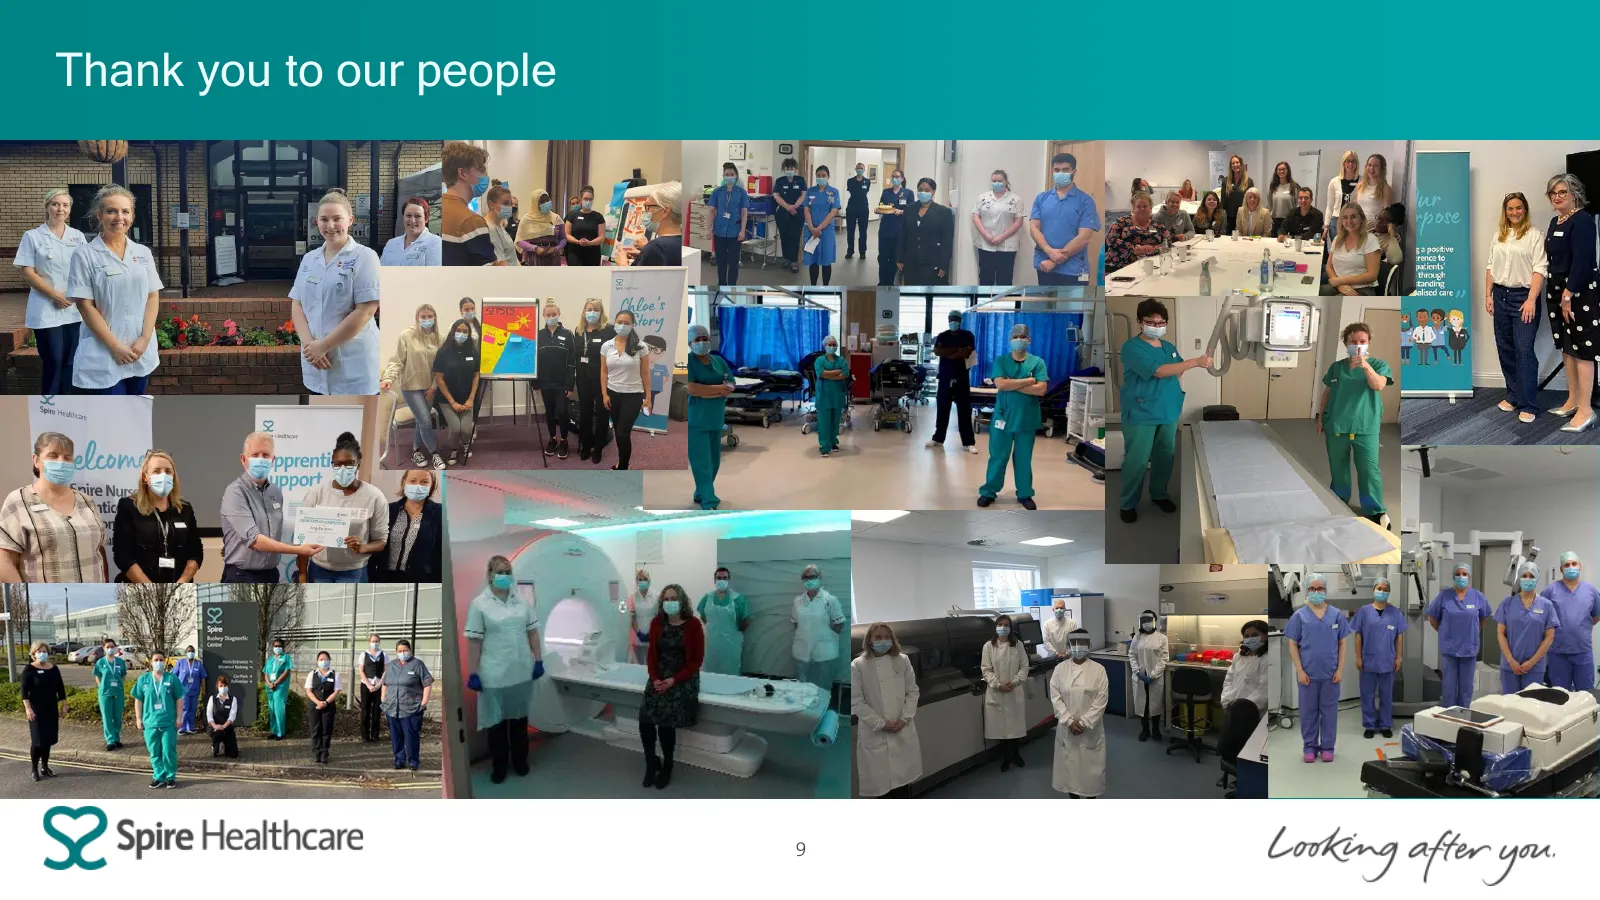
Thank you to our people 9
Slide 10: H1 22 Financial Review
H1 22 Financial Review Harbant Samra, Interim Chief Financial Officer
Slide 11: Financial headlines H1 22: P&L
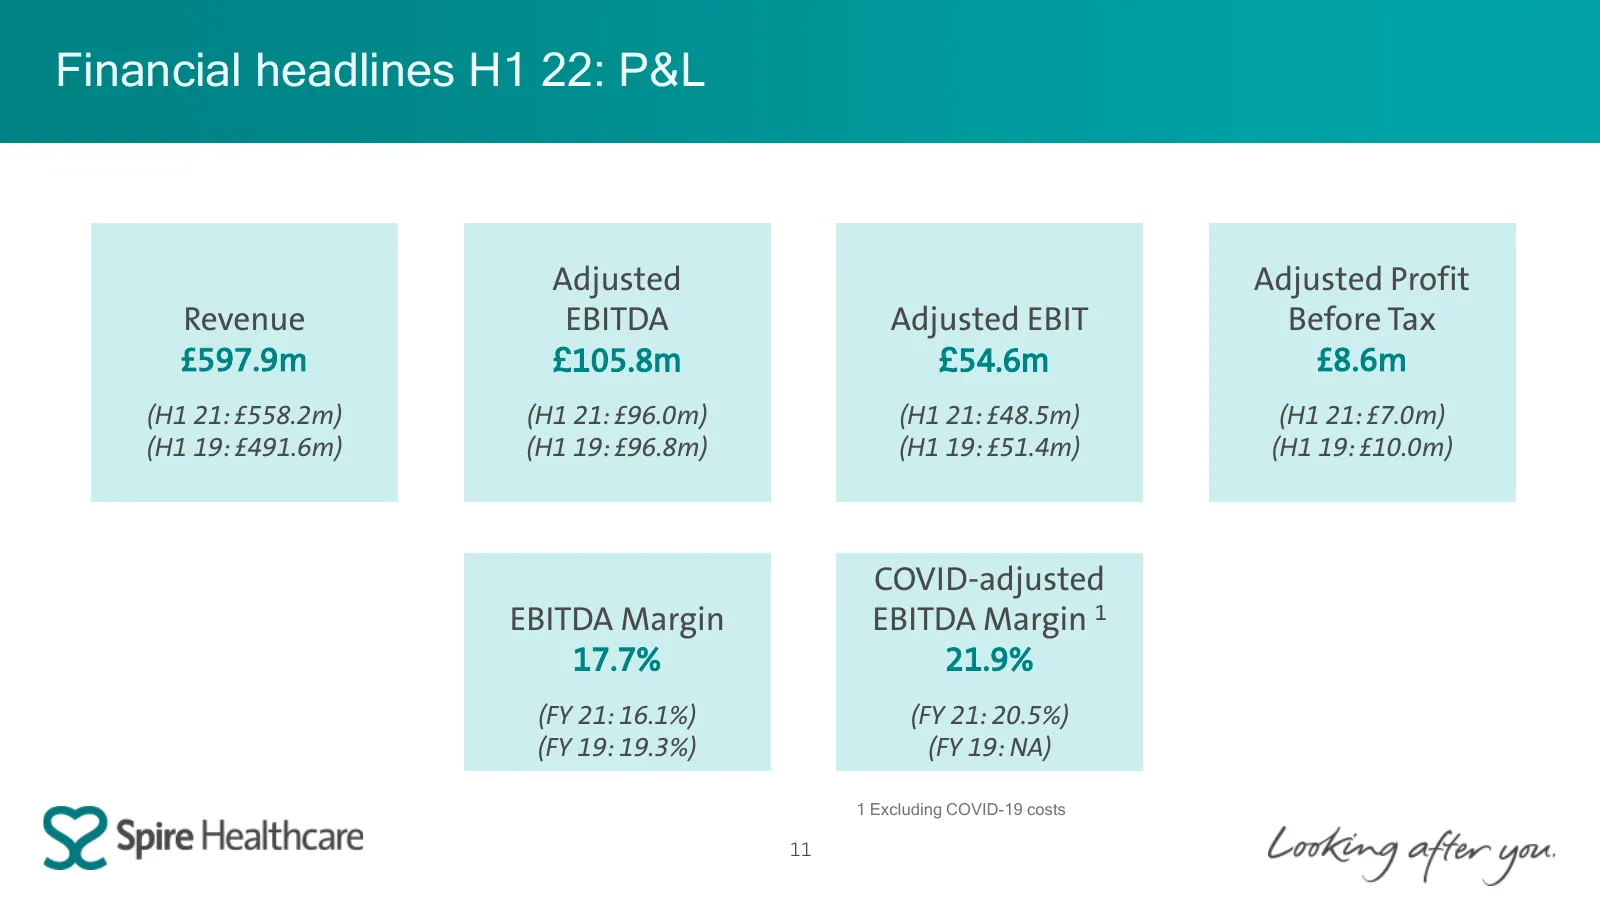
Financial headlines H1 22: P&L Adjusted Adjusted Profit Revenue EBITDA Adjusted EBIT Before Tax £597.9m £105.8m £54.6m £8.6m (H1 21: £558.2m) (H1 21: £96.0m) (H1 21: £48.5m) (H1 21: £7.0m) (H1 19: £491.6m) (H1 19: £96.8m) (H1 19: £51.4m) (H1 19: £10.0m) COVID-adjusted EBITDA Margin EBITDA Margin 1 1
Slide 12: Financial headlines H1 22: balance sheet
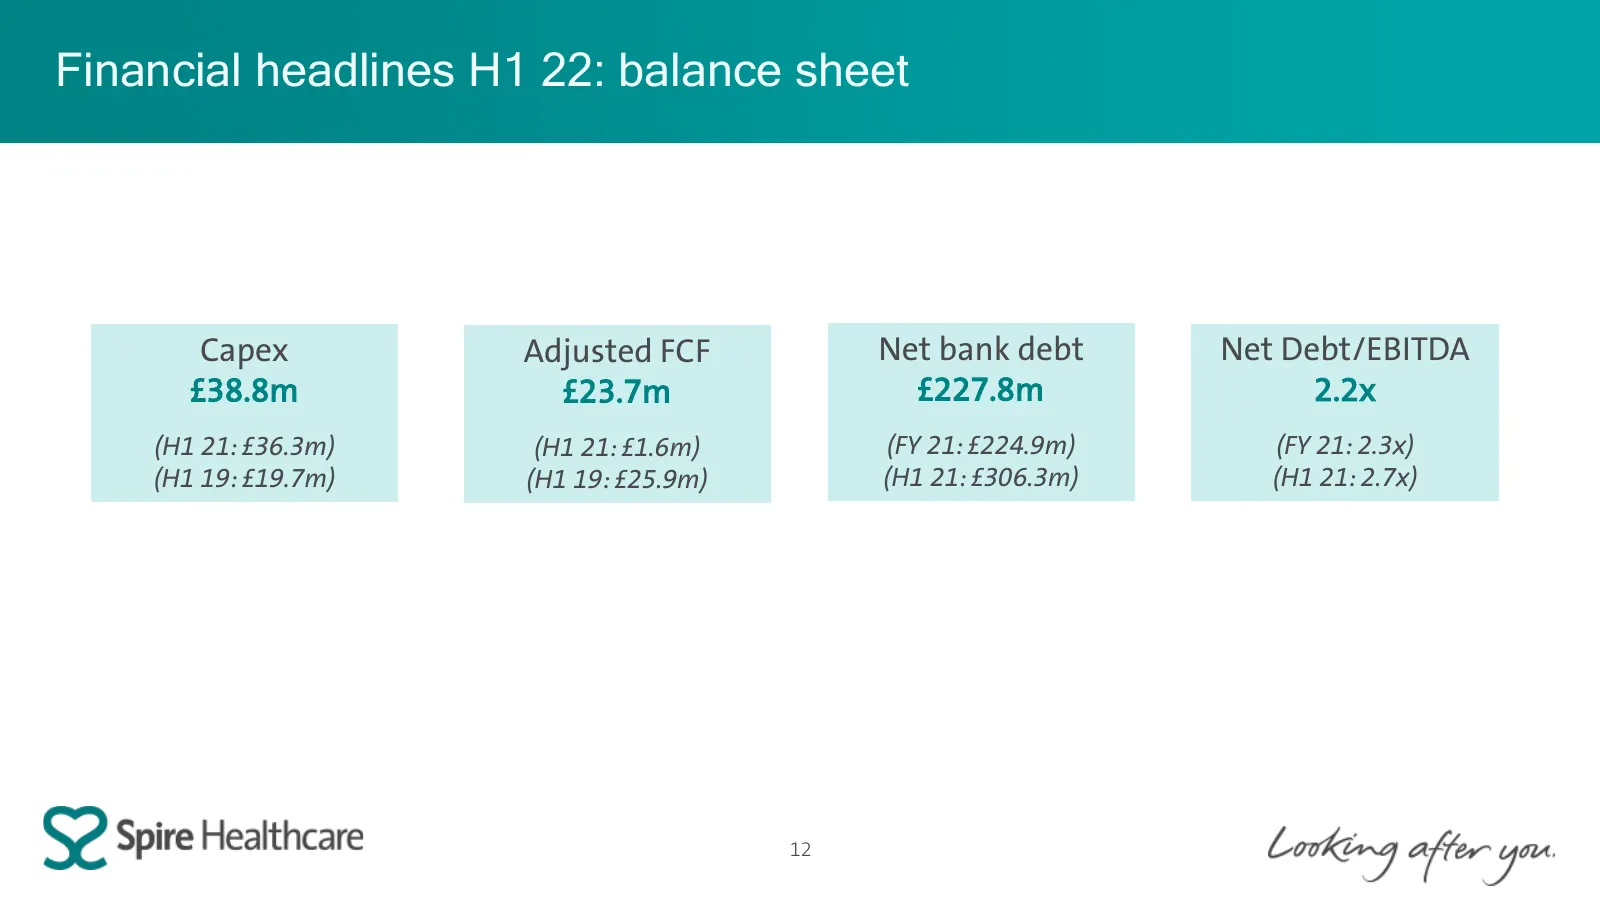
Financial headlines H1 22: balance sheet Capex Adjusted FCF Net bank debt Net Debt/EBITDA £38.8m £23.7m £227.8m 2.2x (H1 21: £36.3m) (H1 21: £1.6m) (FY 21: £224.9m) (FY 21: 2.3x) (H1 19: £19.7m) (H1 19: £25.9m) (H1 21: £306.3m) (H1 21: 2.7x) 12
Slide 13: Record private growth in H1 22
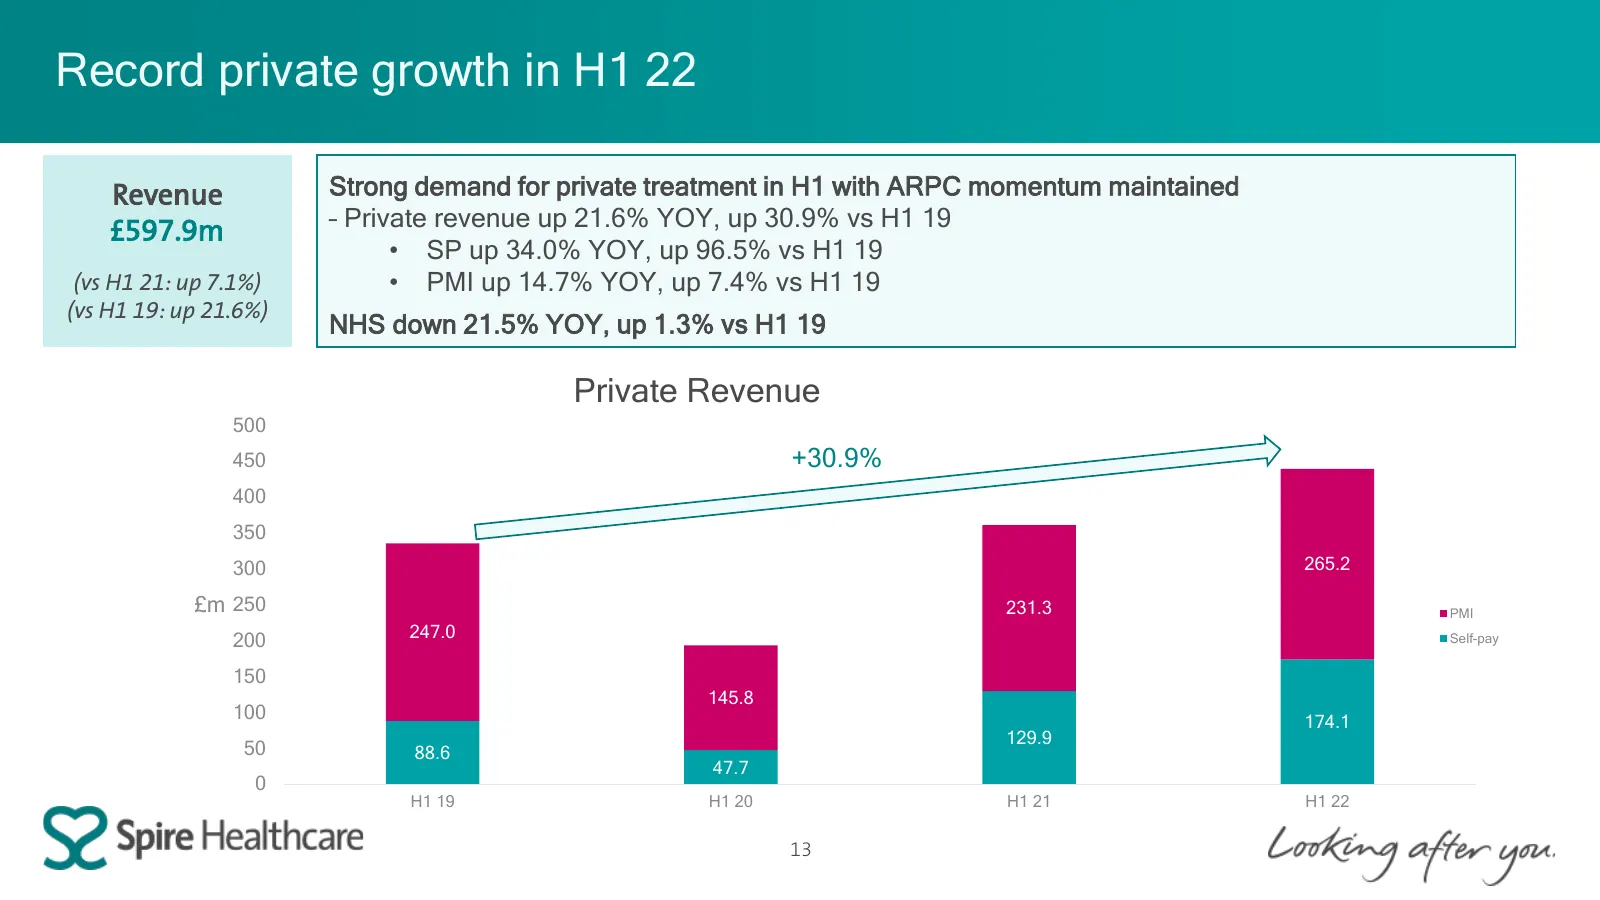
Record private growth in H1 22 Revenue Strong demand for private treatment in H1 with ARPC momentum maintained £597.9m – Private revenue up 21.6% YOY, up 30.9% vs H1 19 • SP up 34.0% YOY, up 96.5% vs H1 19 (vs H1 21: up 7.1%) • PMI up 14.7% YOY, up 7.4% vs H1 19 (vs H1 19: up 21.6%) NHS down 21.5% Y
Slide 14: Enquiries – strong start to 2022 has been maintained
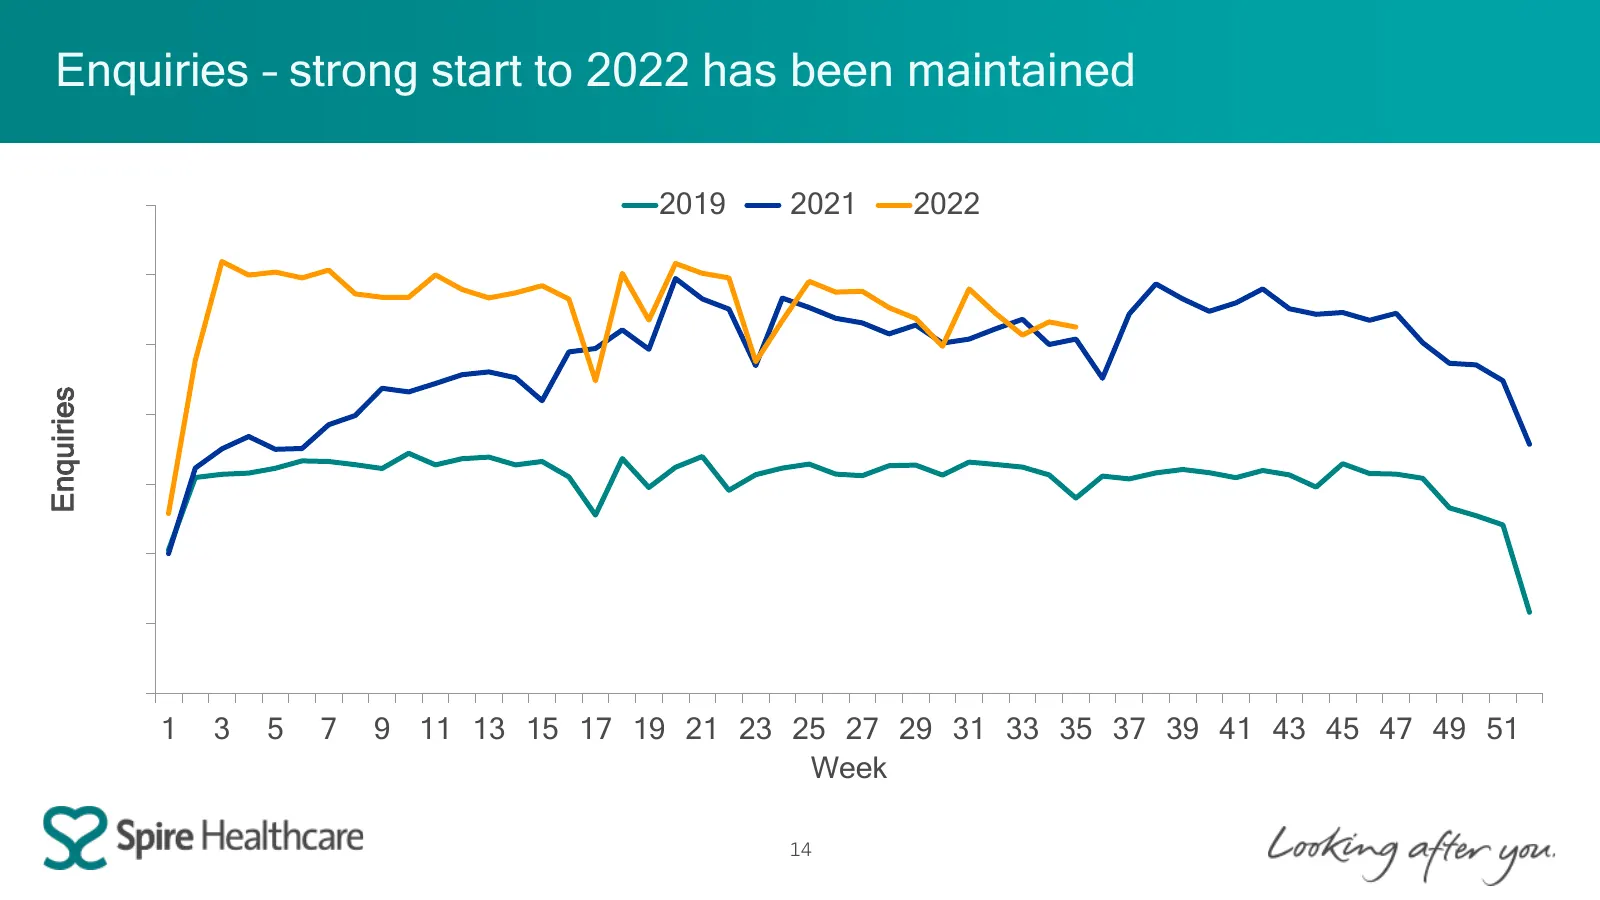
Enquiries – strong start to 2022 has been maintained 14000 2019 2021 2022 12000 10000 Enquiries 8000 6000 4000 2000 0 1 3 5 7 9 11 13 15 17 19 21 23 25 27 29 31 33 35 37 39 41 43 45 47 49 51 Week 14
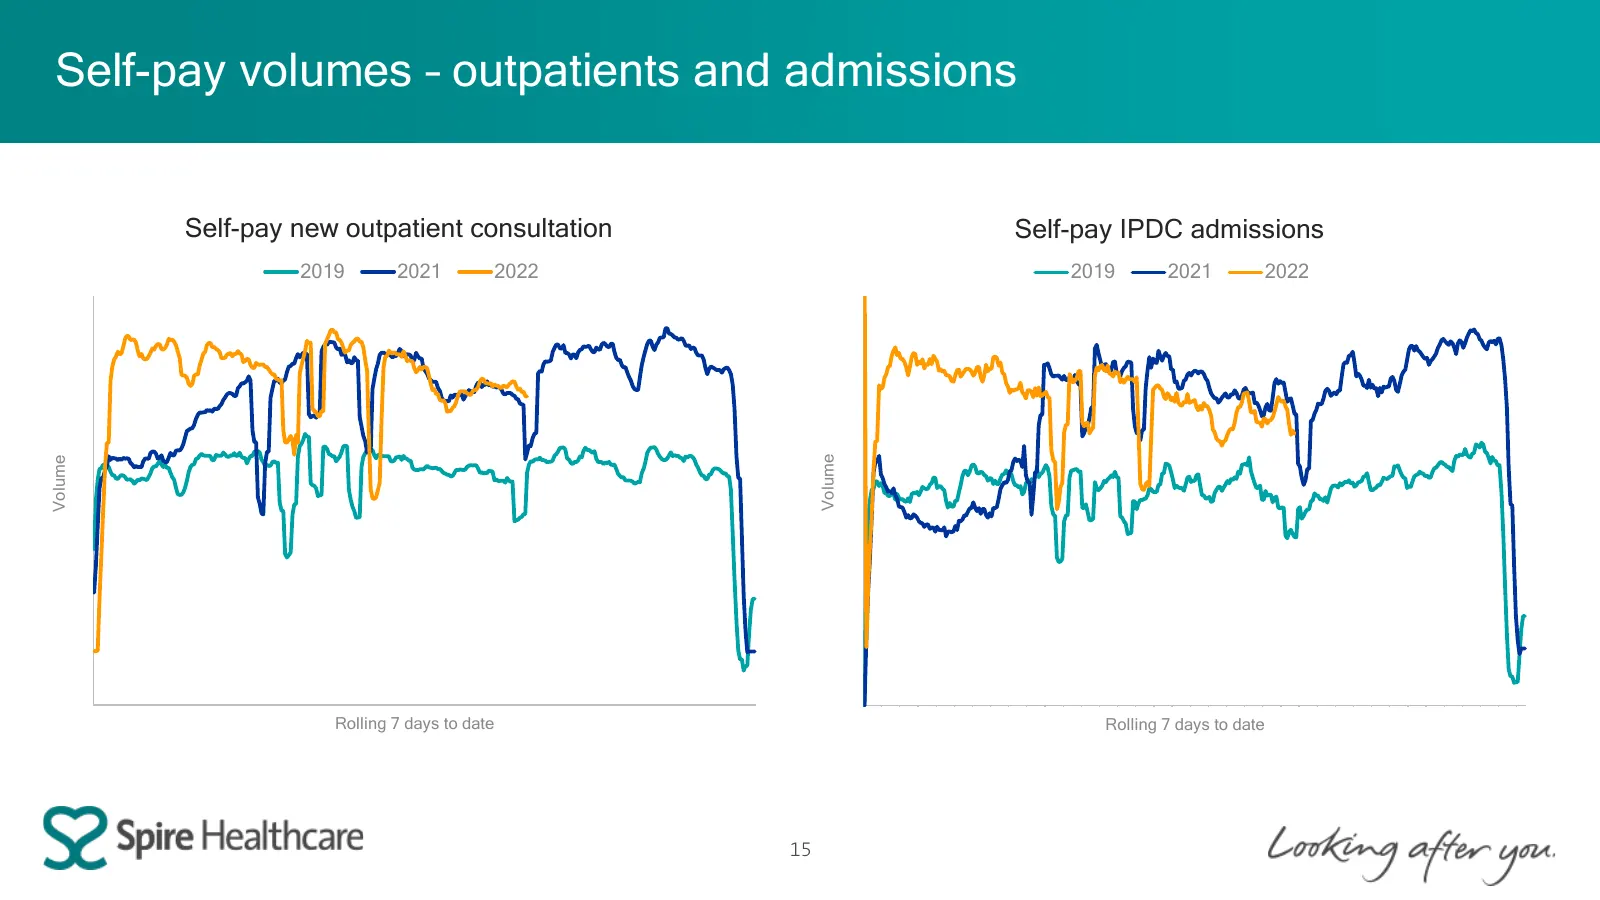
Slide 15: Self-pay volumes – outpatients and admissions
Volume 1000 2000 3000 4000 5000 6000 7000 0 04.01.2021 07.01.2021 10.01.2021 13.01.2021 16.01.2021 19.01.2021 22.01.2021 25.01.2021 28.01.2021 31.01.2021 03.02.2021 06.02.2021 09.02.2021 12.02.2021 15.02.2021 18.02.2021 21.02.2021 24.02.2021 27.02.2021 02.03.2021 05.03.2021 08.03.2021 11.03.2021 14.
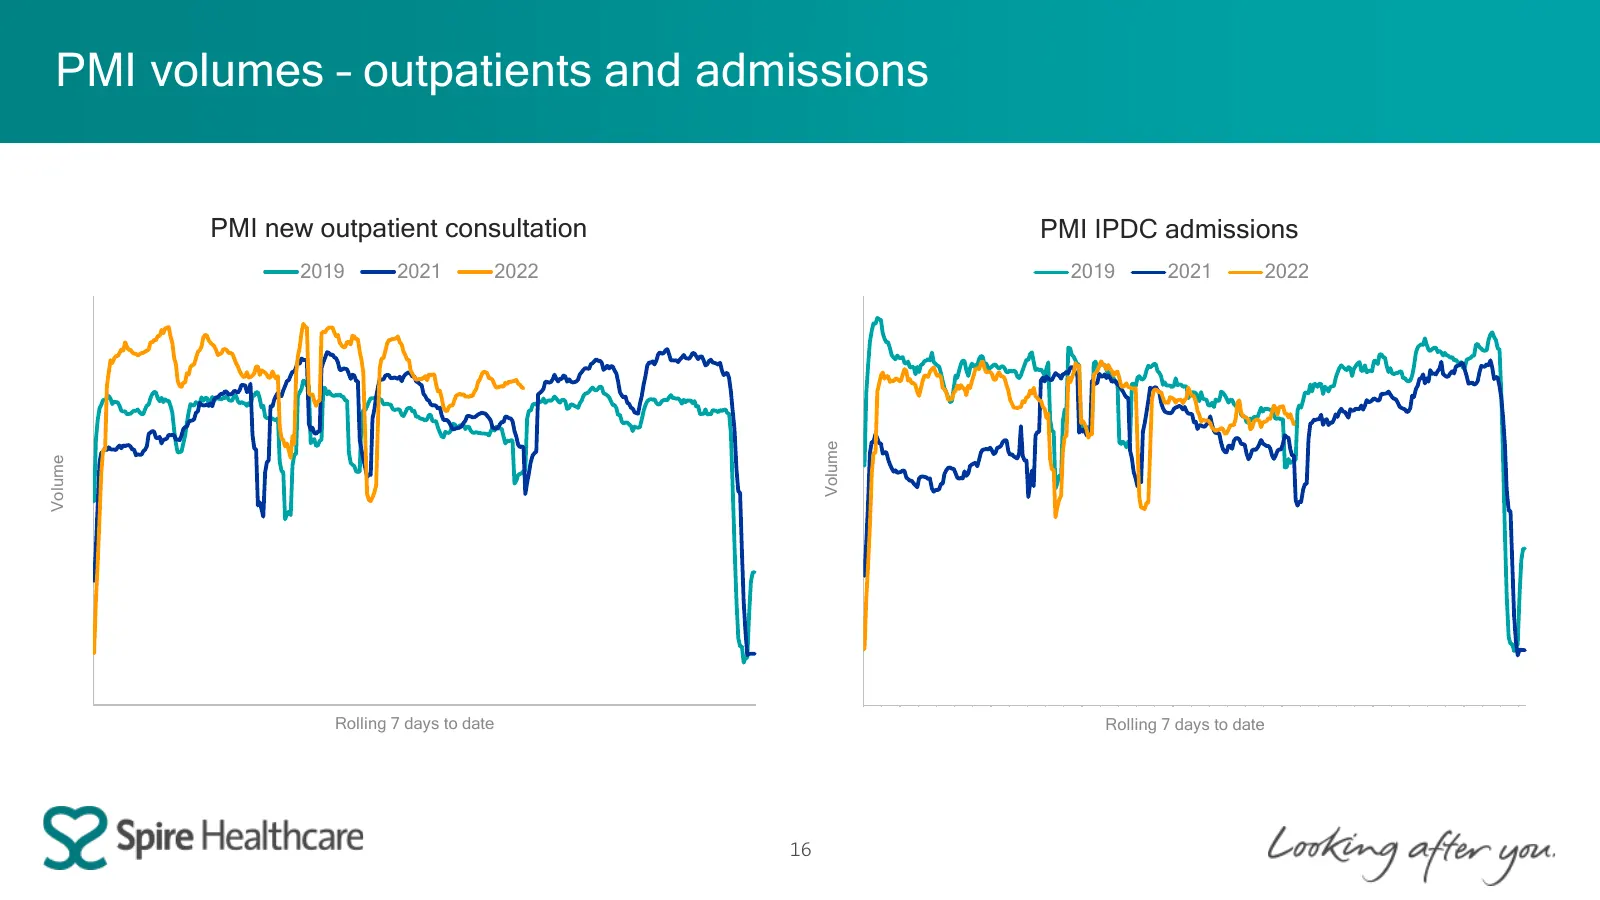
Slide 16: PMI volumes – outpatients and admissions
Volume 1000 2000 3000 4000 5000 6000 7000 0 04.01.2021 07.01.2021 10.01.2021 13.01.2021 16.01.2021 19.01.2021 22.01.2021 25.01.2021 28.01.2021 31.01.2021 03.02.2021 06.02.2021 09.02.2021 12.02.2021 15.02.2021 18.02.2021 21.02.2021 24.02.2021 27.02.2021 02.03.2021 05.03.2021 08.03.2021 11.03.2021 14.
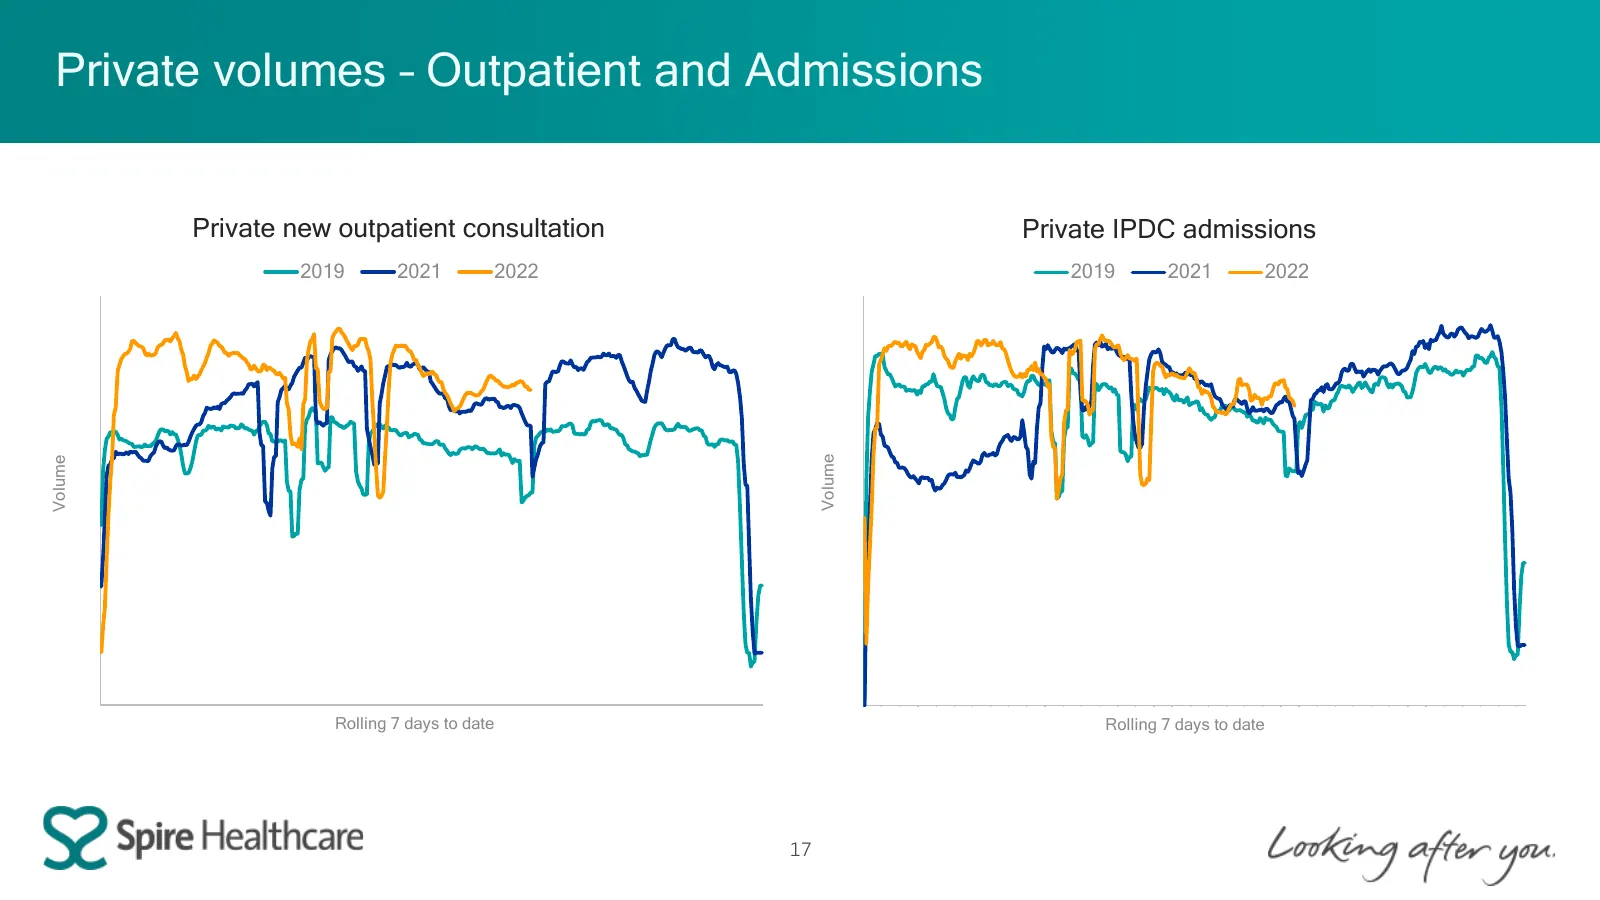
Slide 17: Private volumes – Outpatient and Admissions
Volume 2000 4000 6000 8000 0 10000 12000 14000 04.01.2021 07.01.2021 10.01.2021 13.01.2021 16.01.2021 19.01.2021 22.01.2021 25.01.2021 28.01.2021 31.01.2021 03.02.2021 06.02.2021 09.02.2021 12.02.2021 15.02.2021 18.02.2021 21.02.2021 24.02.2021 27.02.2021 02.03.2021 05.03.2021 08.03.2021 11.03.2021
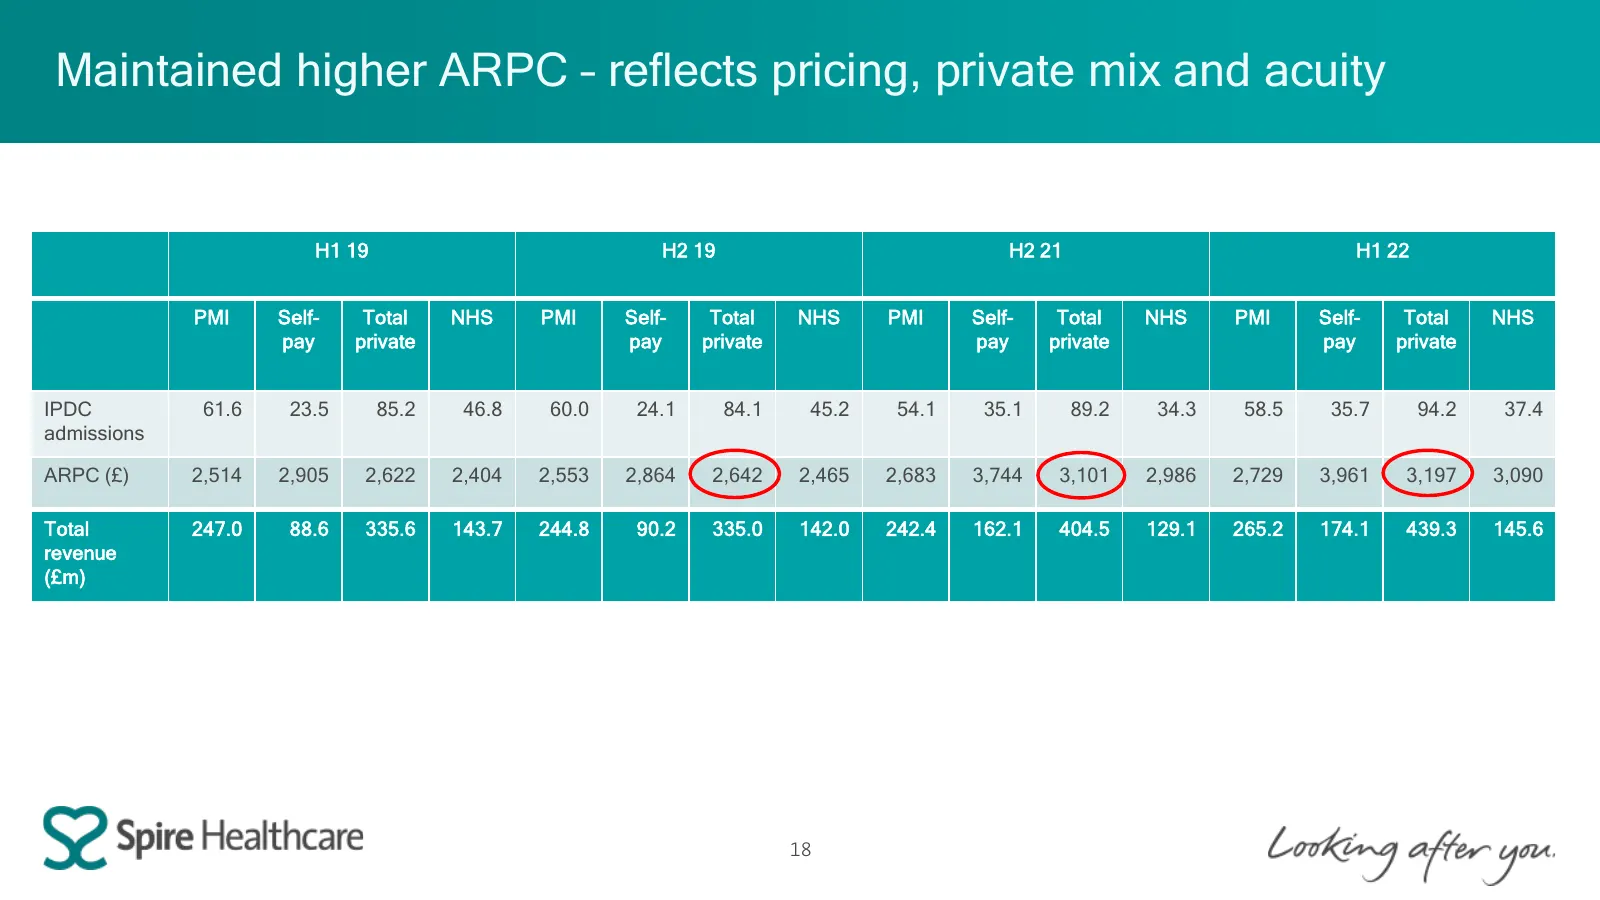
Slide 18: Maintained higher ARPC – reflects pricing, private mix and acuity
Maintained higher ARPC – reflects pricing, private mix and acuity H1 19 H2 19 H2 21 H1 22 PMI Self- Total NHS PMI Self- Total NHS PMI Self- Total NHS PMI Self- Total NHS pay private pay private pay private pay private IPDC 61.6 23.5 85.2 46.8 60.0 24.1 84.1 45.2 54.1 35.1 89.2 34.3 58.5 35.7 94.2 37
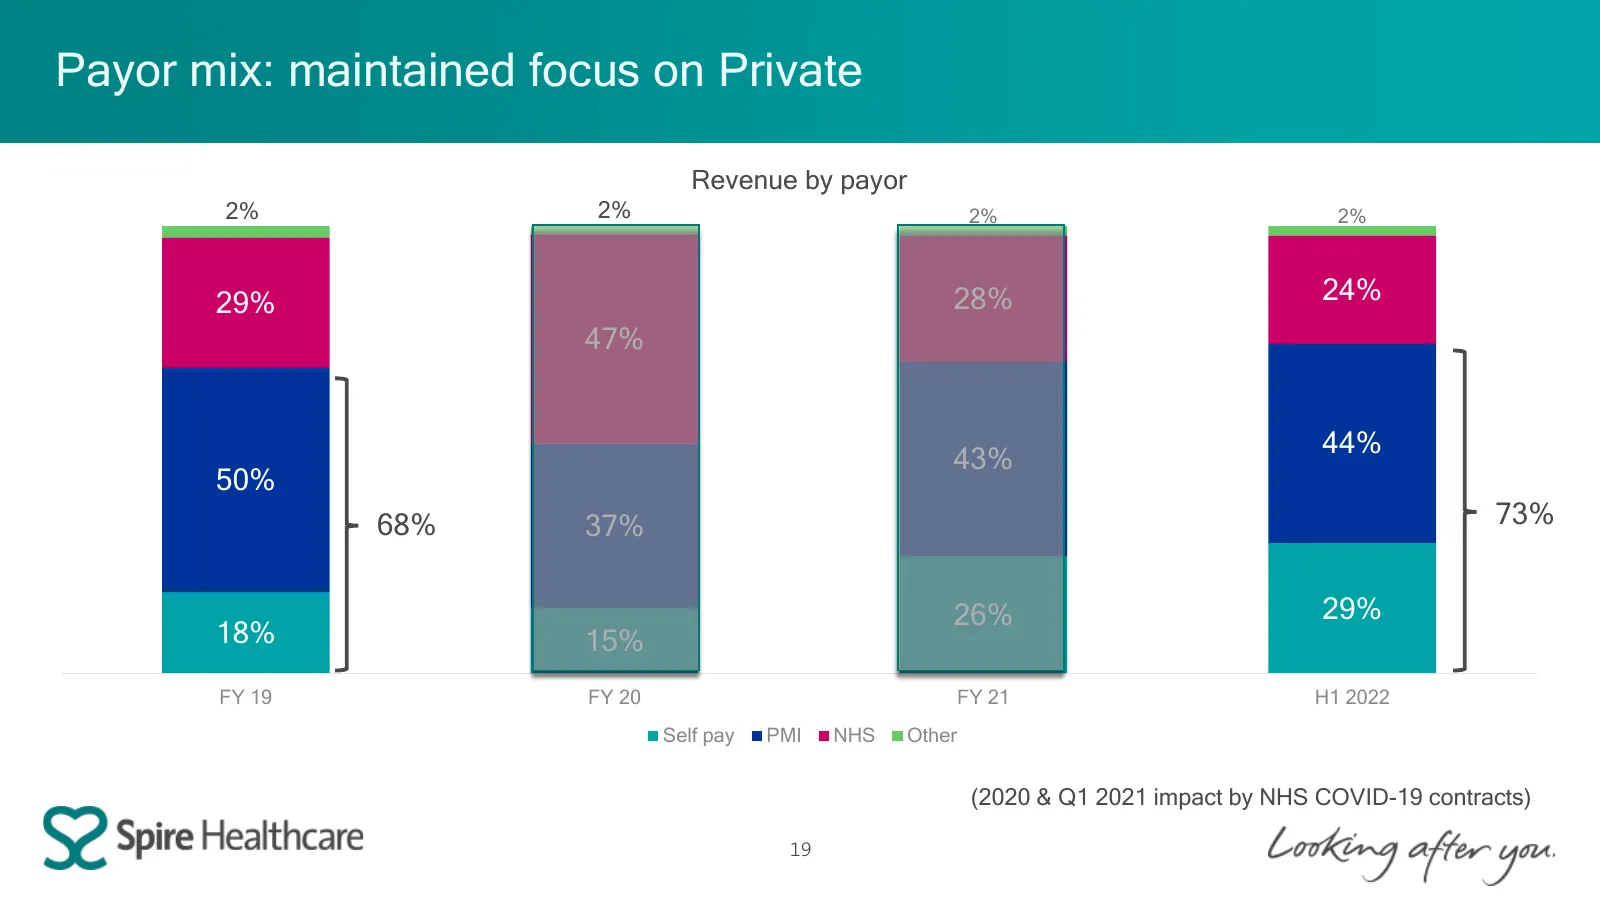
Slide 19: Payor mix: maintained focus on Private
Payor mix: maintained focus on Private Revenue by payor 2% 2% 2% 2% 29% 28% 24% 47% 44% 43% 50% 68% 37% 73% 26% 29% 18% 15% FY 19 FY 20 FY 21 H1 2022 Self pay PMI NHS Other (2020 & Q1 2021 impact by NHS COVID-19 contracts) 19
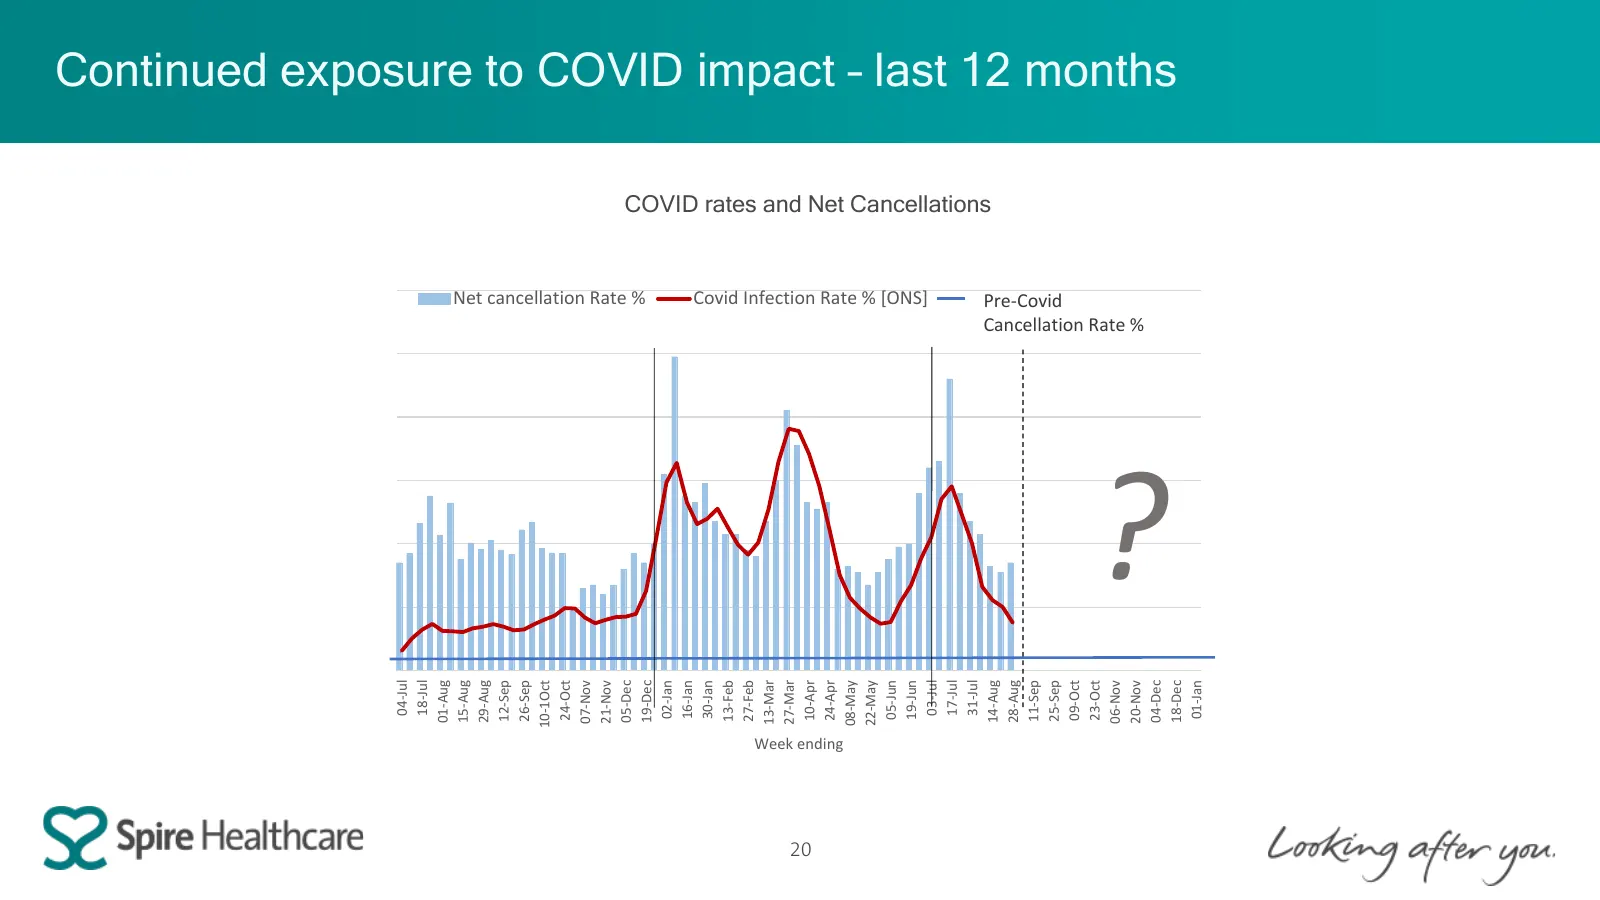
Slide 20: Continued exposure to COVID impact – last 12 months
Continued exposure to COVID impact – last 12 months COVID rates and Net Cancellations Cancellations, Infection Rates and Absence Trends 1.2 12.0% Net cancellation Rate % Covid Infection Rate % [ONS] Pre-Covid Cancellation Rate % 1 10.0% 0.8 8.0% ? 0.6 6.0% 0.4 4.0% 0.2 2.0% 0 0.0% 01-Aug 15-Aug 29-A
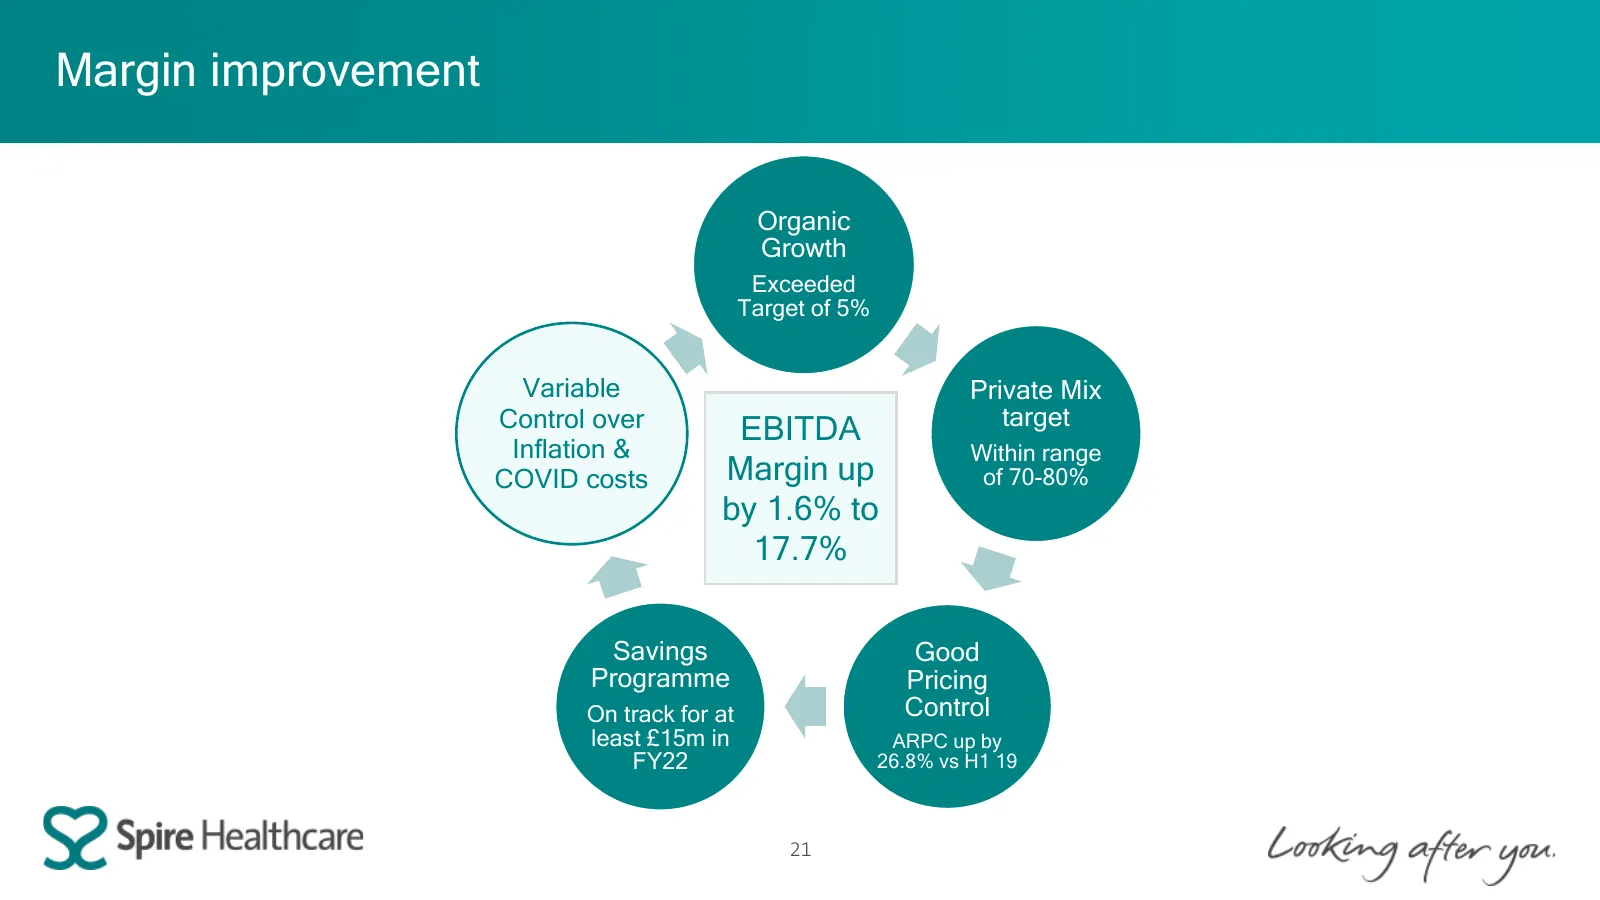
Slide 21: Margin improvement
Margin improvement Organic Growth Exceeded Target of 5% Variable Private Mix Control over target EBITDA Inflation & Within range COVID costs Margin up of 70-80% by 1.6% to 17.7% Savings Good Programme Pricing On track for at Control least £15m in ARPC up by FY22 26.8% vs H1 19 21
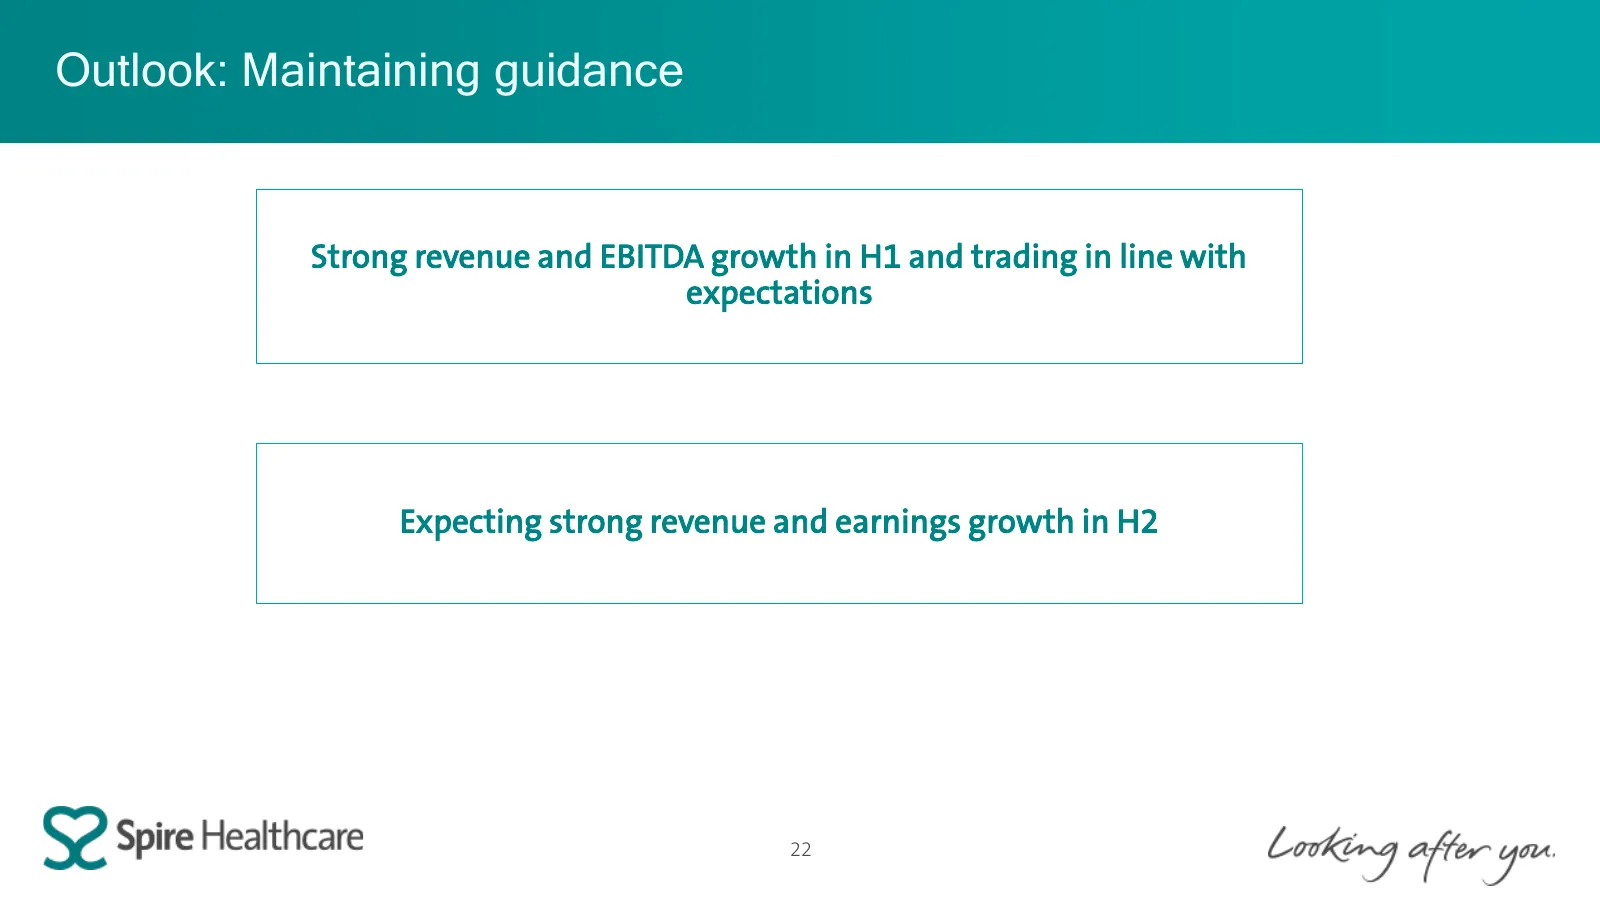
Slide 22: Outlook: Maintaining guidance
Outlook: Maintaining guidance Strong revenue and EBITDA growth in H1 and trading in line with expectations Expecting strong revenue and earnings growth in H2 22
Slide 23: Strong progress in H1 2022
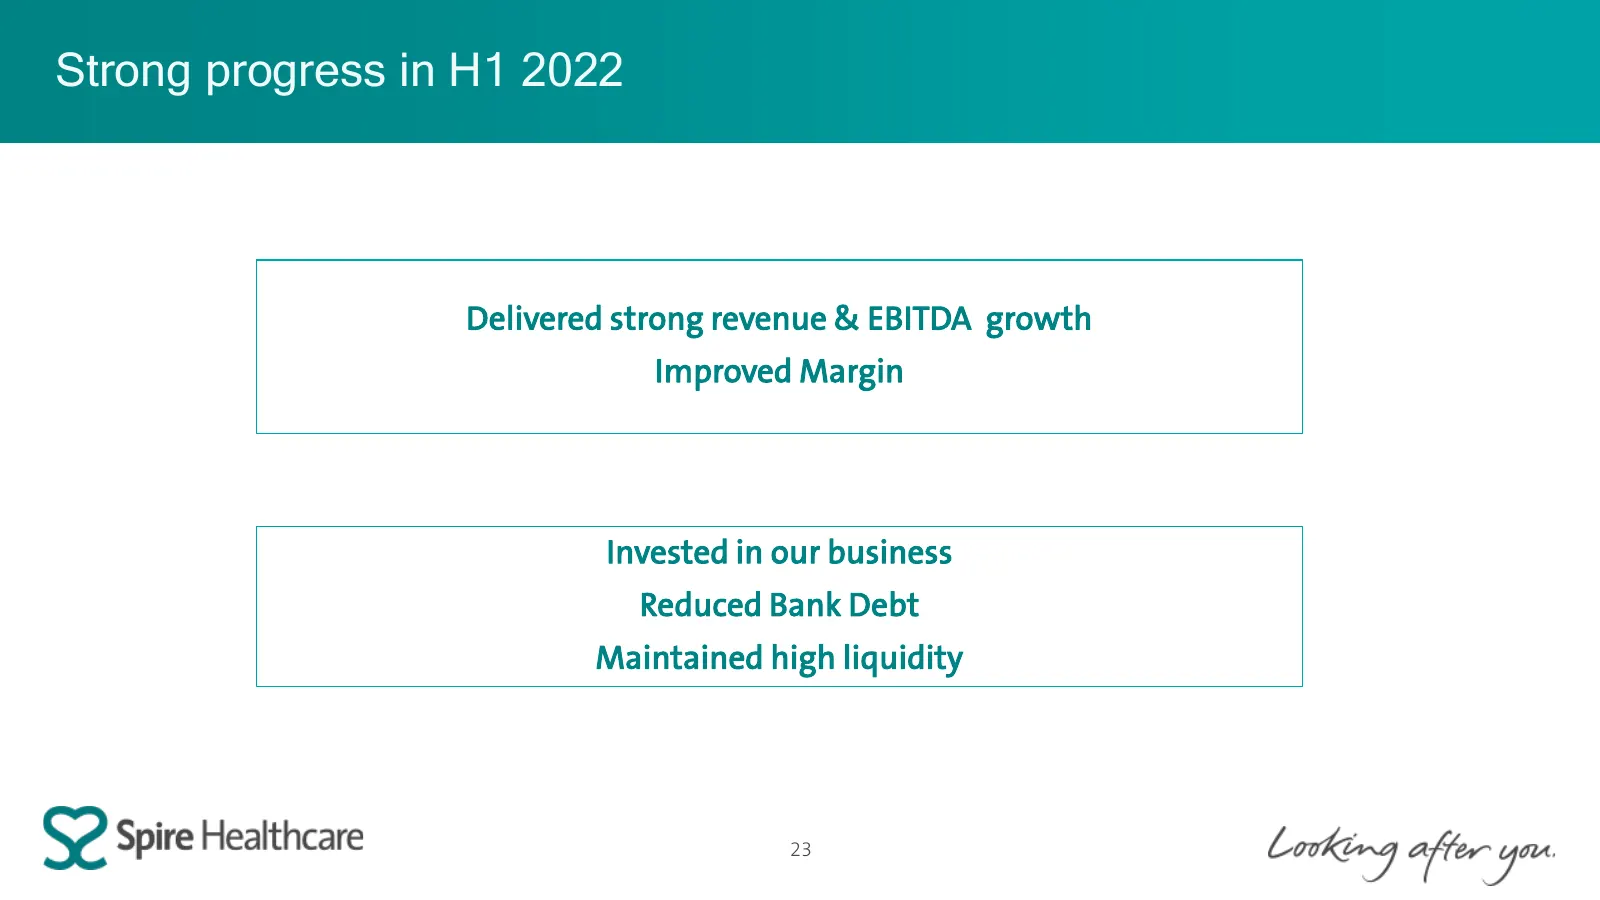
Strong progress in H1 2022 Delivered strong revenue & EBITDA growth Improved Margin Invested in our business Reduced Bank Debt Maintained high liquidity 23

Slide 24: Operational highlights and strategic developments
Operational highlights and strategic developments Justin Ash, Chief Executive Officer
Slide 25: H1 22 operational highlights
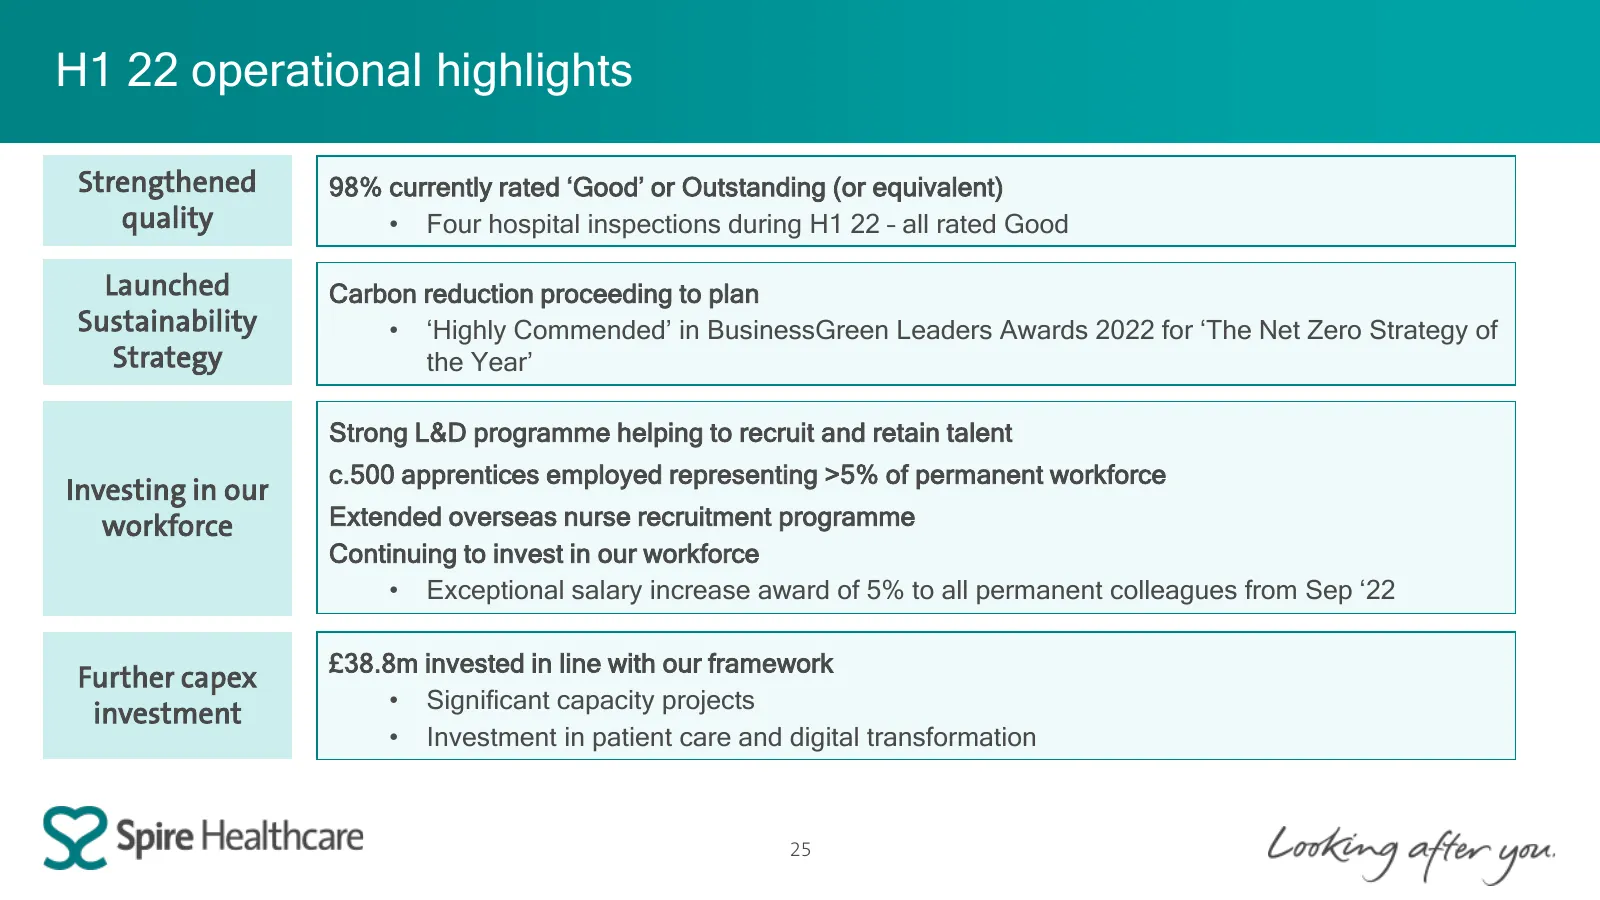
H1 22 operational highlights Strengthened 98% currently rated ‘Good’ or Outstanding (or equivalent) quality • Four hospital inspections during H1 22 – all rated Good Launched Carbon reduction proceeding to plan Sustainability • ‘Highly Commended’ in BusinessGreen Leaders Awards 2022 for ‘The Net Zer
Slide 26: Strategic developments
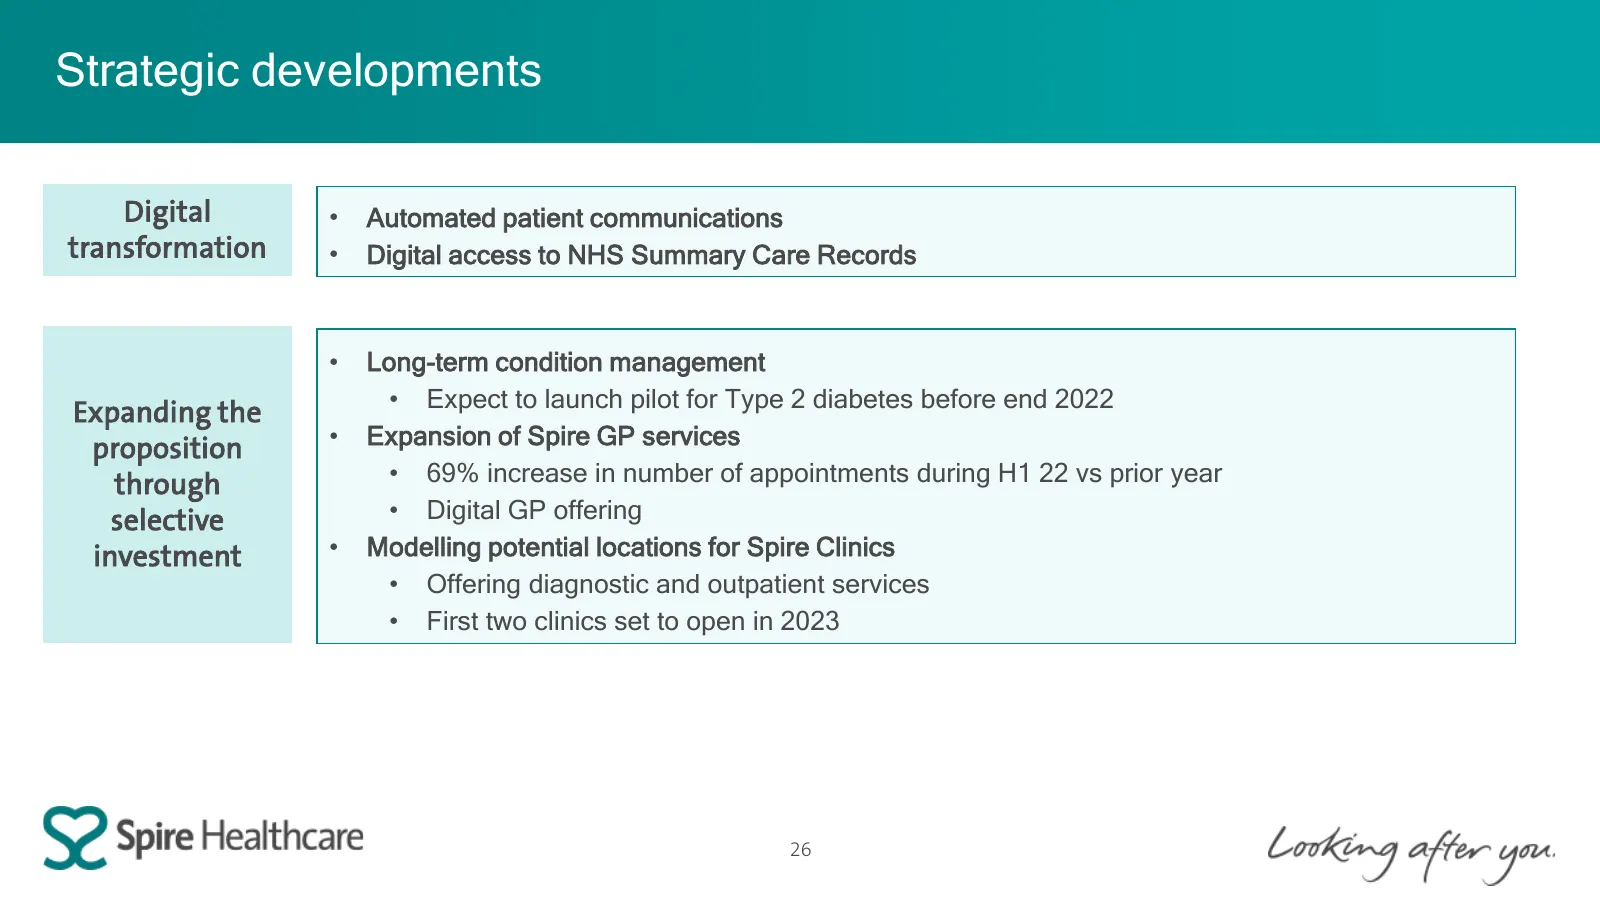
Strategic developments Digital • Automated patient communications transformation • Digital access to NHS Summary Care Records • Long-term condition management • Expect to launch pilot for Type 2 diabetes before end 2022 Expanding the proposition • Expansion of Spire GP services through • 69% increas

Slide 27: H1 22 Results Presentation
H1 22 Results Presentation 8 September 2022

Slide 28: Appendix
S2 Spire Healthcare Appendix Corking after ya
Slide 29: Technical guidance
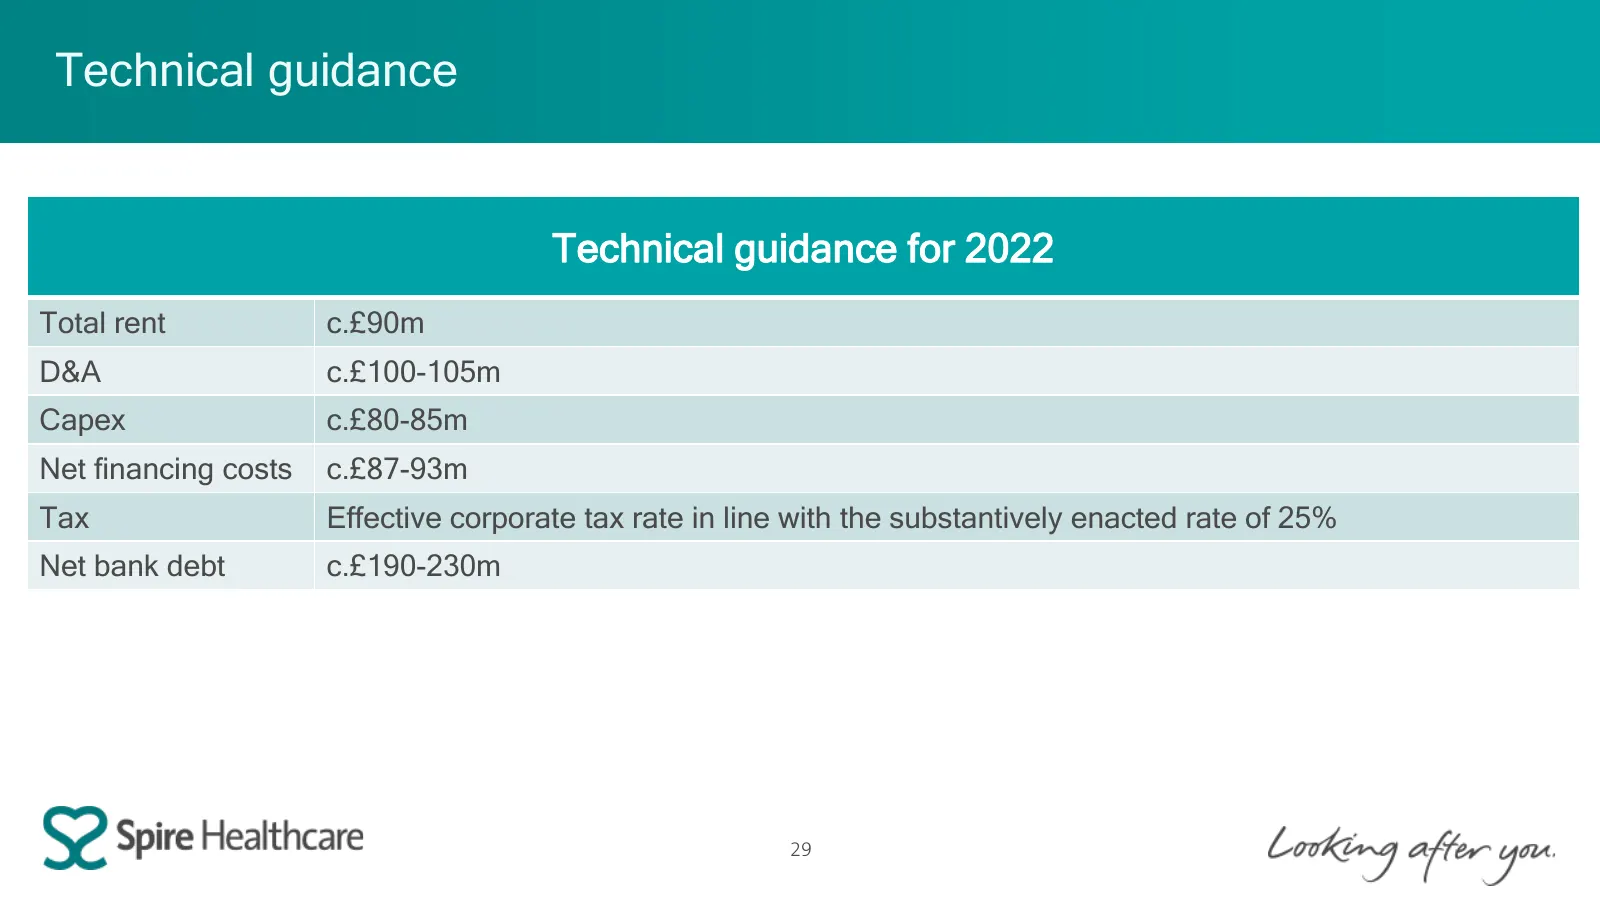
Technical guidance Technical guidance for 2022 Total rent c.£90m D&A c.£100-105m Capex c.£80-85m Net financing costs c.£87-93m Tax Effective corporate tax rate in line with the substantively enacted rate of 25% Net bank debt c.£190-230m 29
Slide 30: Revenue by Payor
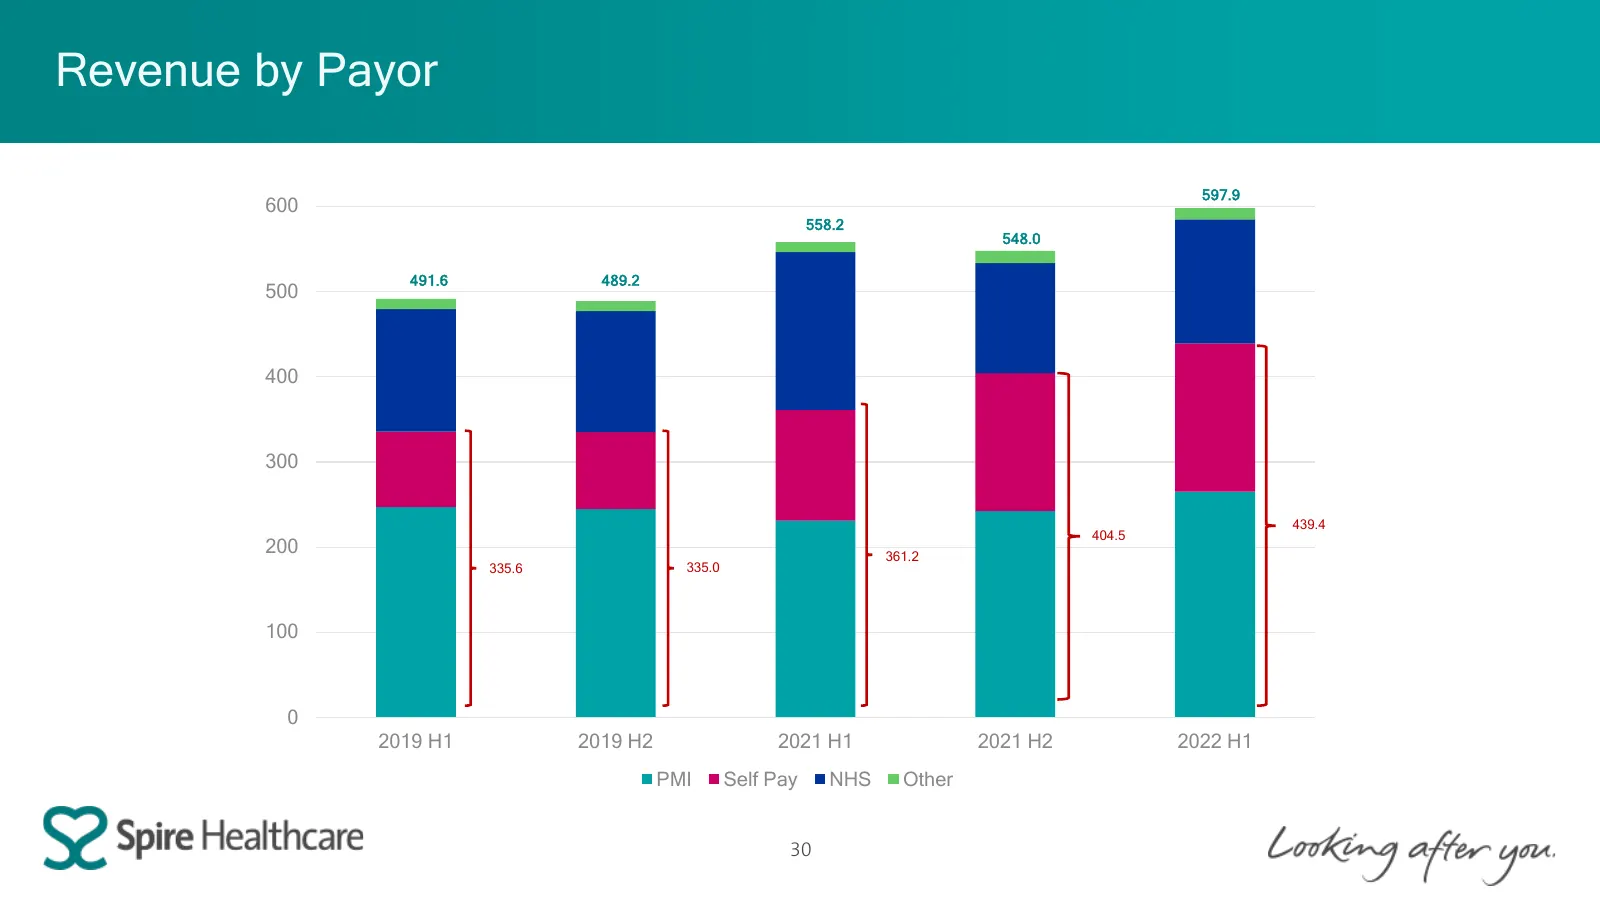
Revenue by Payor 597.9 600 558.2 548.0 491.6 489.2 500 400 300 439.4 404.5 200 361.2 335.6 335.0 100 0 2019 H1 2019 H2 2021 H1 2021 H2 2022 H1 PMI Self Pay NHS Other 30
Slide 31: Cost of sales analysis
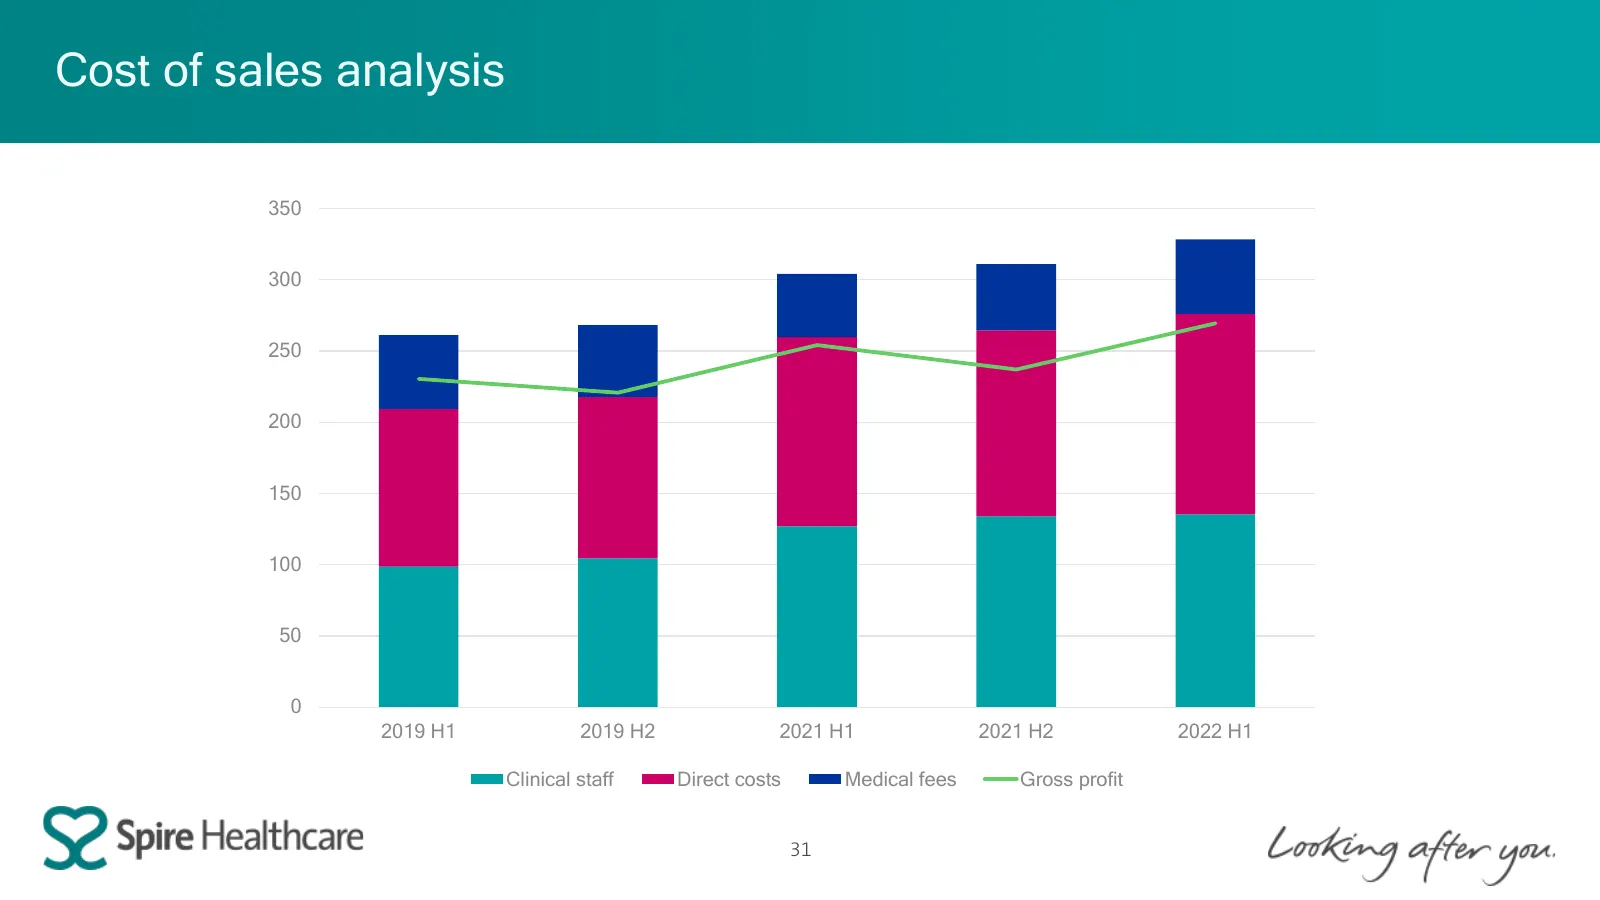
Cost of sales analysis 350 300 250 200 150 100 50 0 2019 H1 2019 H2 2021 H1 2021 H2 2022 H1 Clinical staff Direct costs Medical fees Gross profit 31
Slide 32: Cash flow
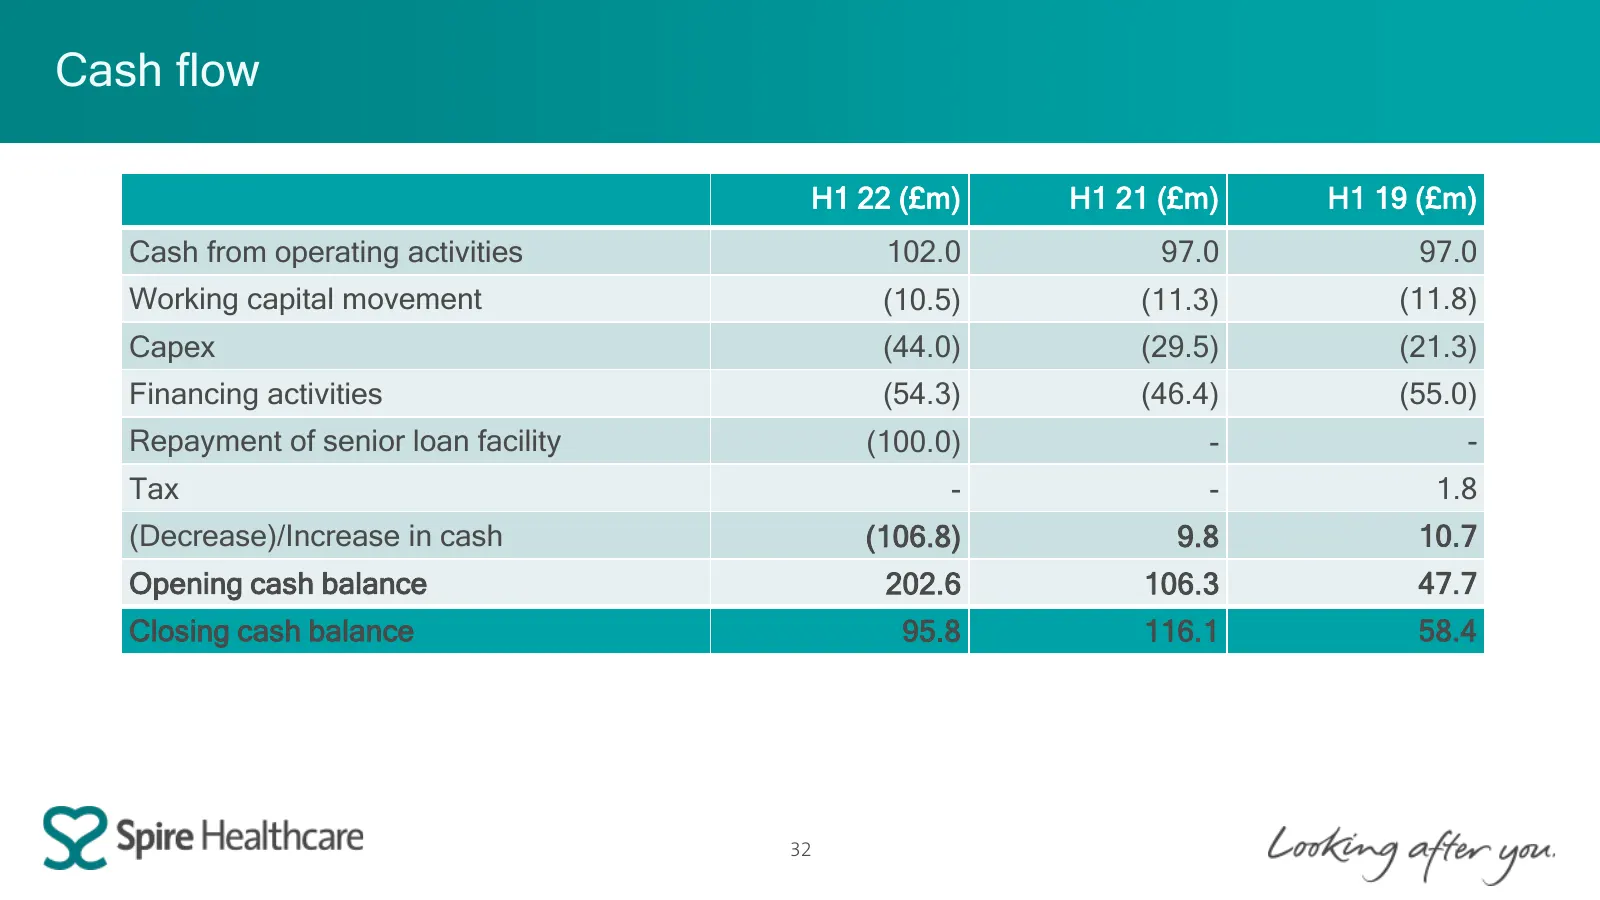
Cash flow H1 22 (£m) H1 21 (£m) H1 19 (£m) Cash from operating activities 102.0 97.0 97.0 Working capital movement (10.5) (11.3) (11.8) Capex (44.0) (29.5) (21.3) Financing activities (54.3) (46.4) (55.0) Repayment of senior loan facility (100.0) - - Tax - - 1.8 (Decrease)/Increase in cash (106.8) 9
Slide 33: Bank leverage ratio
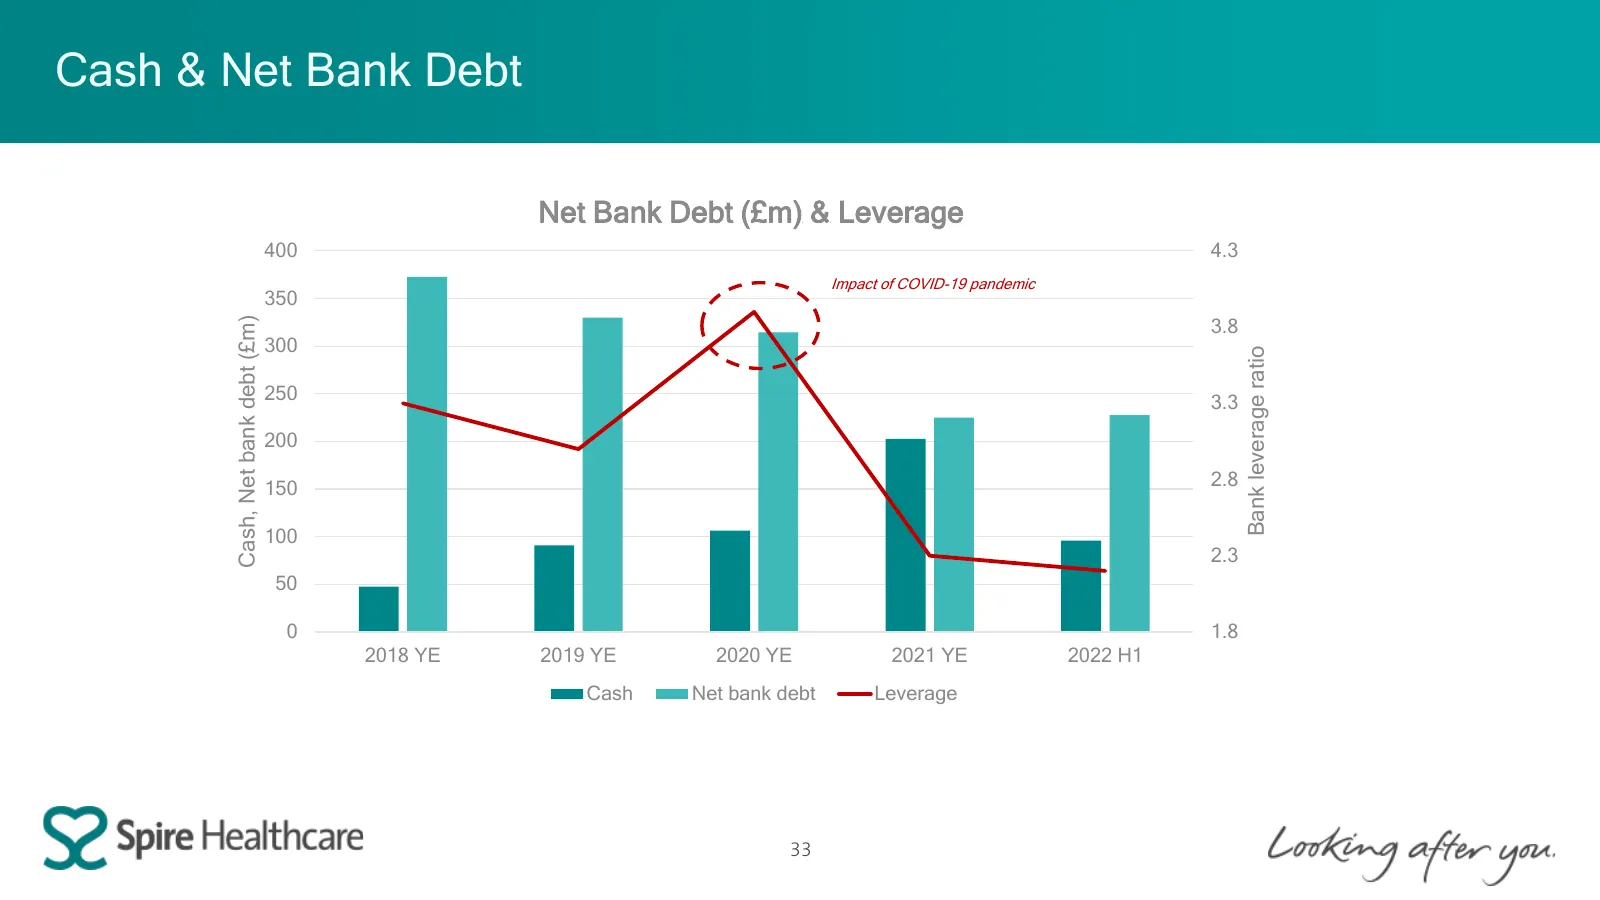
Cash & Net Bank Debt Net Bank Debt (£m) & Leverage 400 4.3 Impact of COVID-19 pandemic 350 3.8 Cash, Net bank debt (£m) 300 Bank leverage ratio 250 3.3 200 150 2.8 100 2.3 50 0 1.8 2018 YE 2019 YE 2020 YE 2021 YE 2022 H1 Cash Net bank debt Leverage 33
Slide 34: Cash & Borrowings
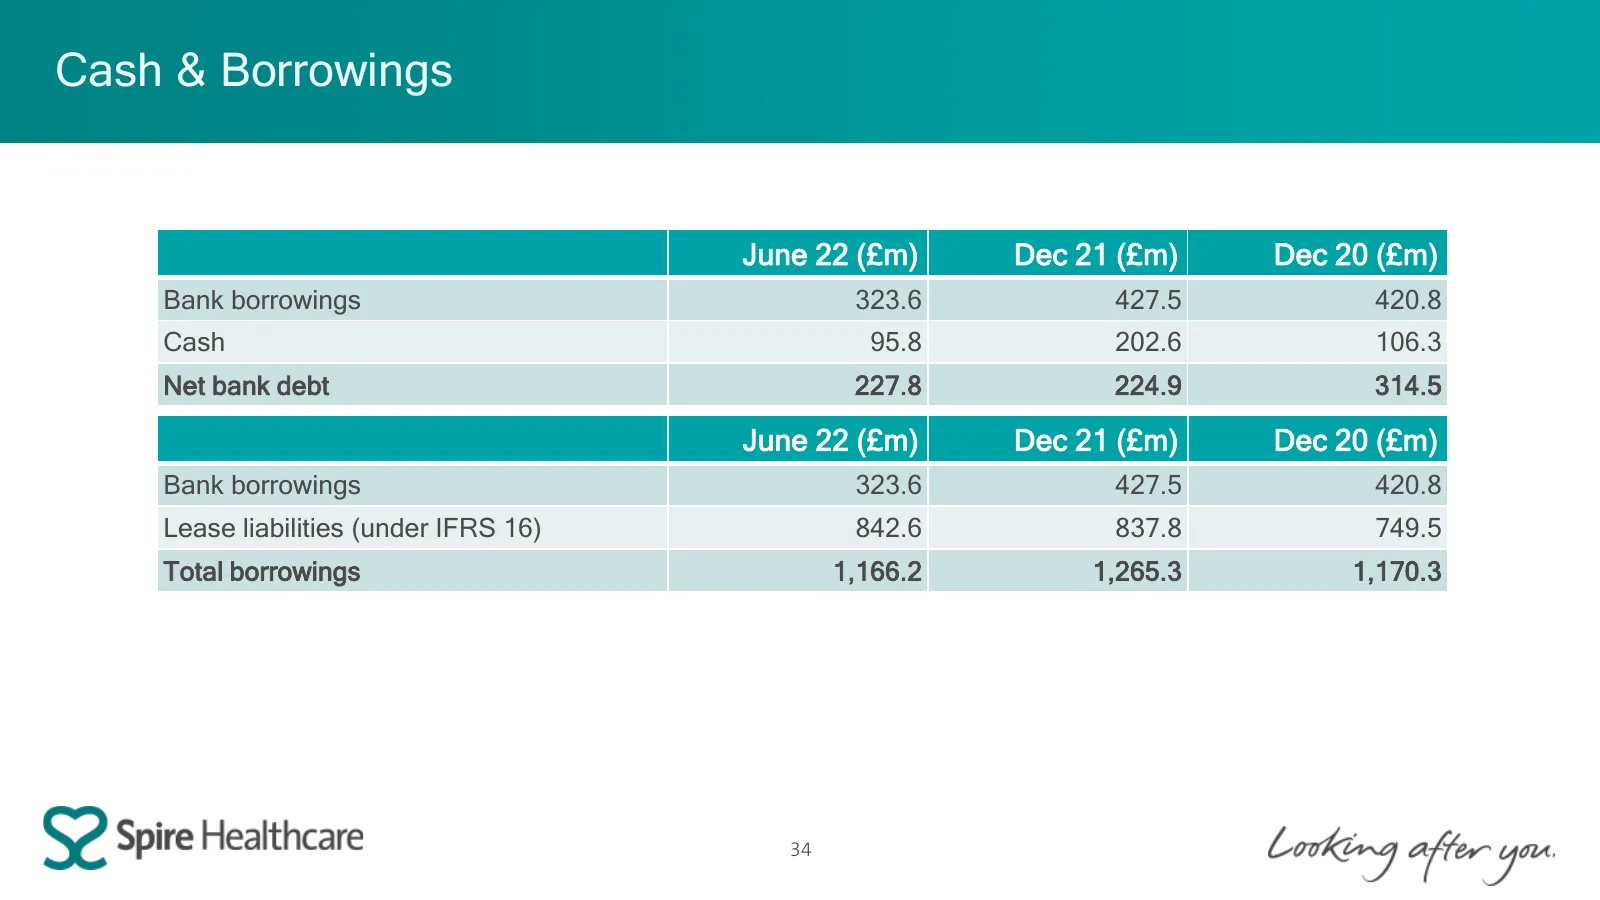
Cash & Borrowings June 22 (£m) Dec 21 (£m) Dec 20 (£m) Bank borrowings 323.6 427.5 420.8 Cash 95.8 202.6 106.3 Net bank debt 227.8 224.9 314.5 June 22 (£m) Dec 21 (£m) Dec 20 (£m) Bank borrowings 323.6 427.5 420.8 Lease liabilities (under IFRS 16) 842.6 837.8 749.5 Total borrowings 1,166.2 1,265.3 1
Slide 35: Latest NHS England waiting list
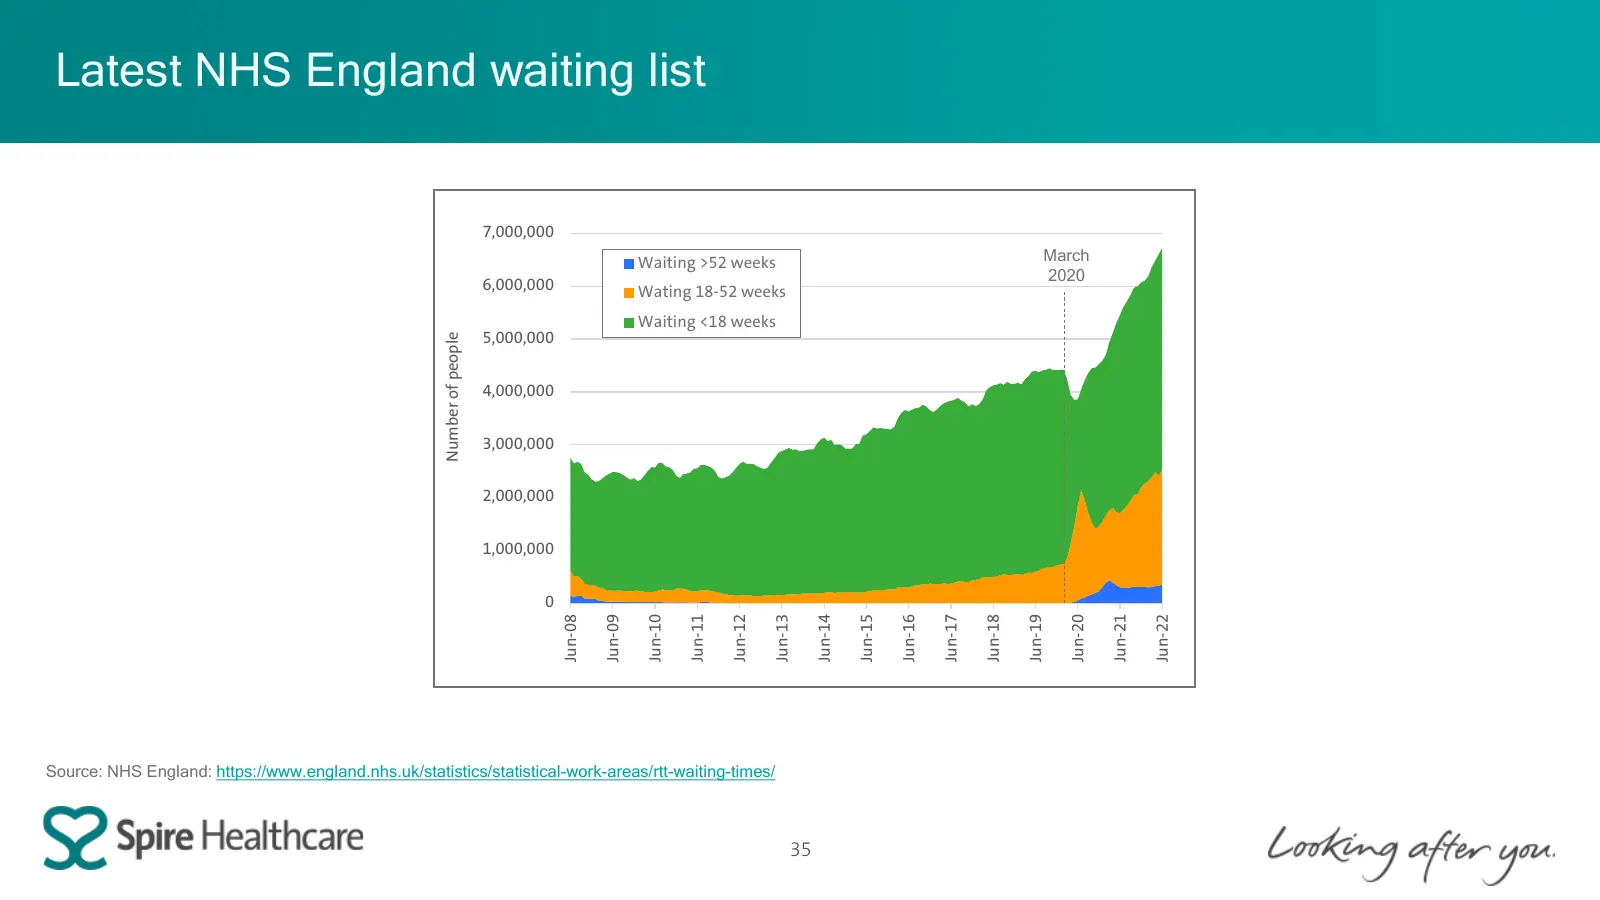
Latest NHS England waiting list 7,000,000 Waiting >52 weeks March 2020 6,000,000 Wating 18-52 weeks Waiting <18 weeks 5,000,000 Number of people 4,000,000 3,000,000 2,000,000 1,000,000 0 Jun-18 Jun-08 Jun-09 Jun-10 Jun-11 Jun-12 Jun-13 Jun-14 Jun-15 Jun-16 Jun-17 Jun-19 Jun-20 Jun-21 Jun-22 Source:
Source: Internet Archive copy of investors.spirehealthcare.com
More decks from Spire Healthcare Group PLC
 FY2025 Earnings Presentation37 slides · Mar 5, 2026
 H1 2025 Earnings Presentation39 slides · Jul 31, 2025
 Investor Presentation (June 2025)34 slides · June 2025
 FY2024 Earnings Presentation36 slides · Mar 6, 2025
 dbAccess UK & Ireland Conference 202512 slides · Jan 21, 2025
 H1 2024 Earnings Presentation42 slides · Sep 12, 2024