Sintercom India Ltd. · NSE:SINTERCOM
Sintercom India — Q1 FY2023 Earnings Presentation
15 slides from Sintercom India's earnings presentation, 2022

Slide 1: Sintercom India Ltd. Earnings Presentation Q1-FY23
Sintercom India Ltd. Investor Presentation- March 2021 EARNINGS PRESENTATION Q1-FY23
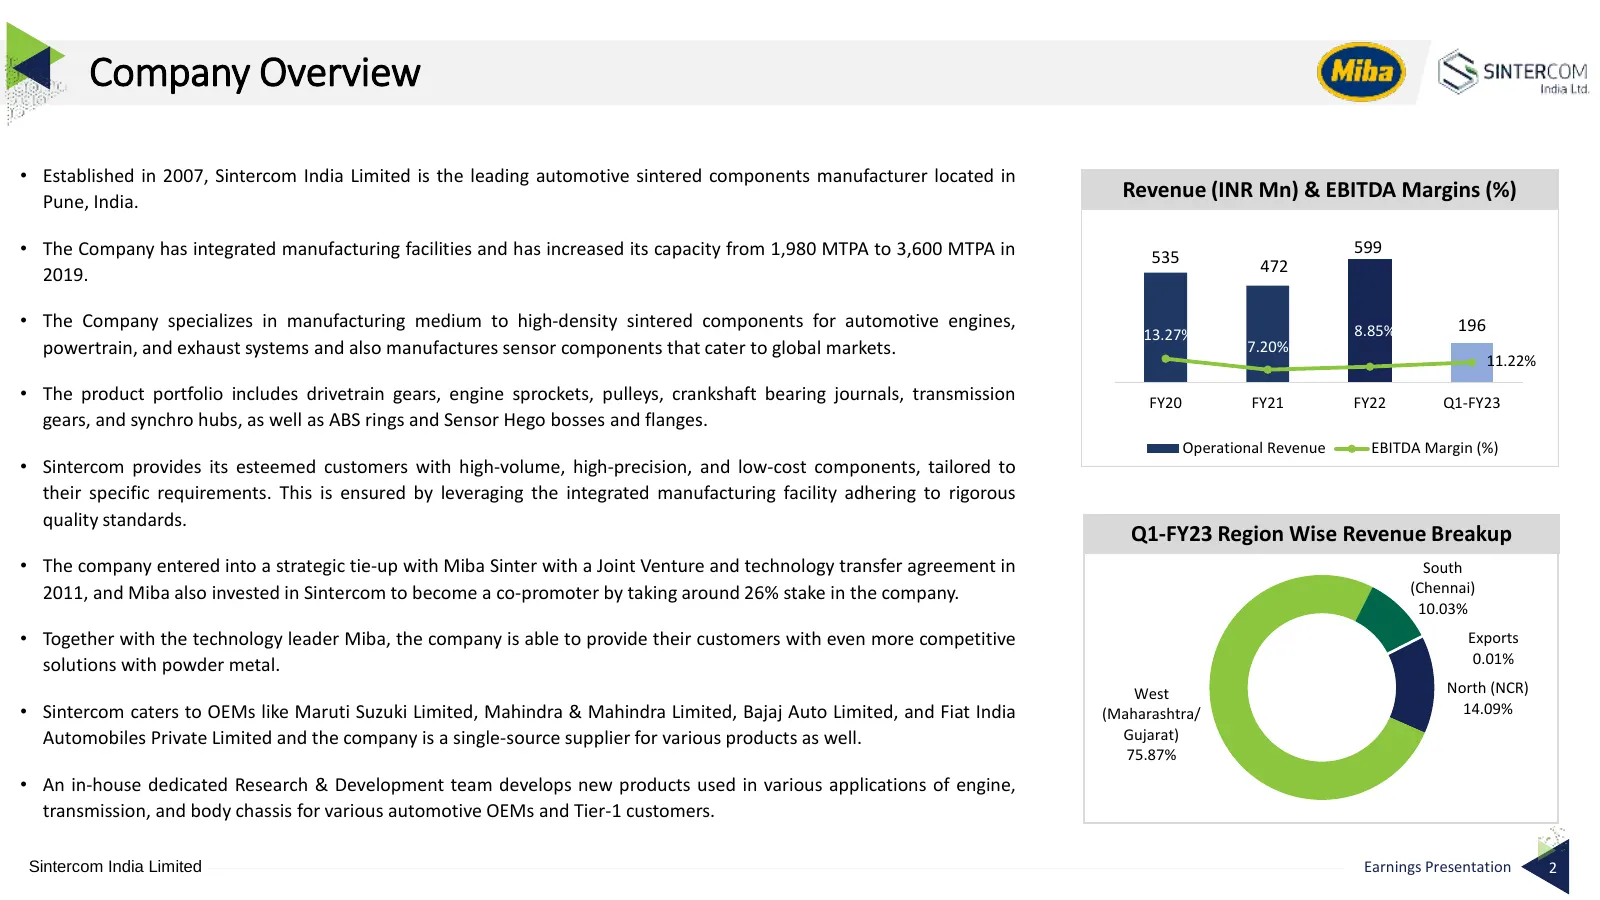
Slide 2: Company Overview
Company Overview • Established in 2007, Sintercom India Limited is the leading automotive sintered components manufacturer located in Pune, India. Revenue (INR Mn) & EBITDA Margins (%) • The Company has integrated manufacturing facilities and has increased its capacity from 1,980 MTPA to 3,600 MTPA
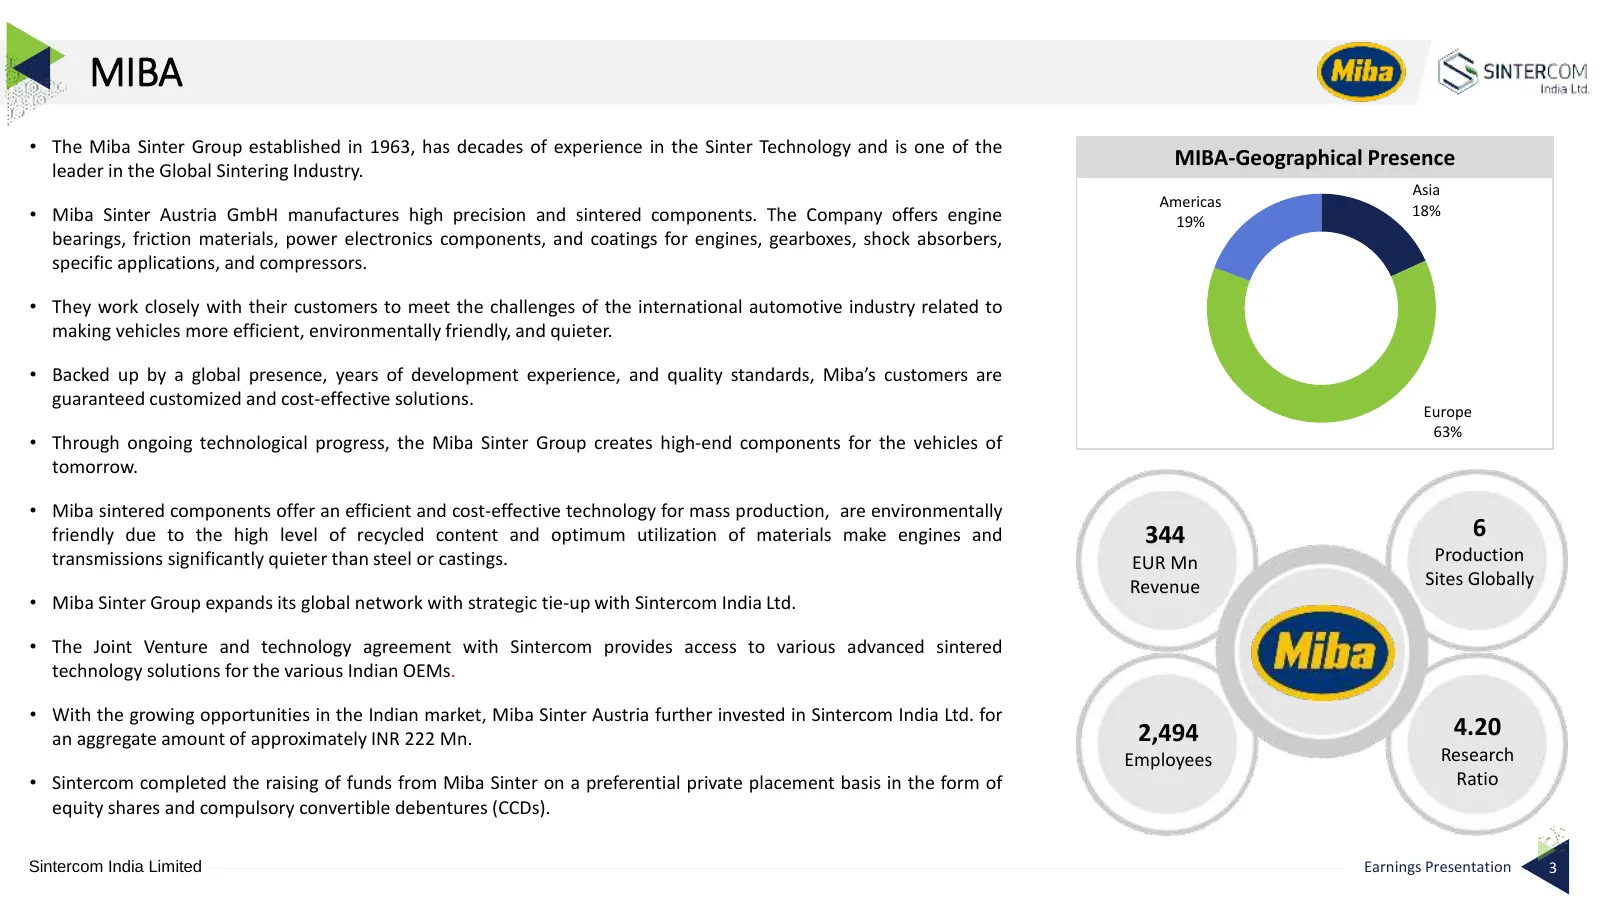
Slide 3: MIBA
MIBA • The Miba Sinter Group established in 1963, has decades of experience in the Sinter Technology and is one of the MIBA-Geographical Presence leader in the Global Sintering Industry. Asia Americas • Miba Sinter Austria GmbH manufactures high precision and sintered components. The Company offers
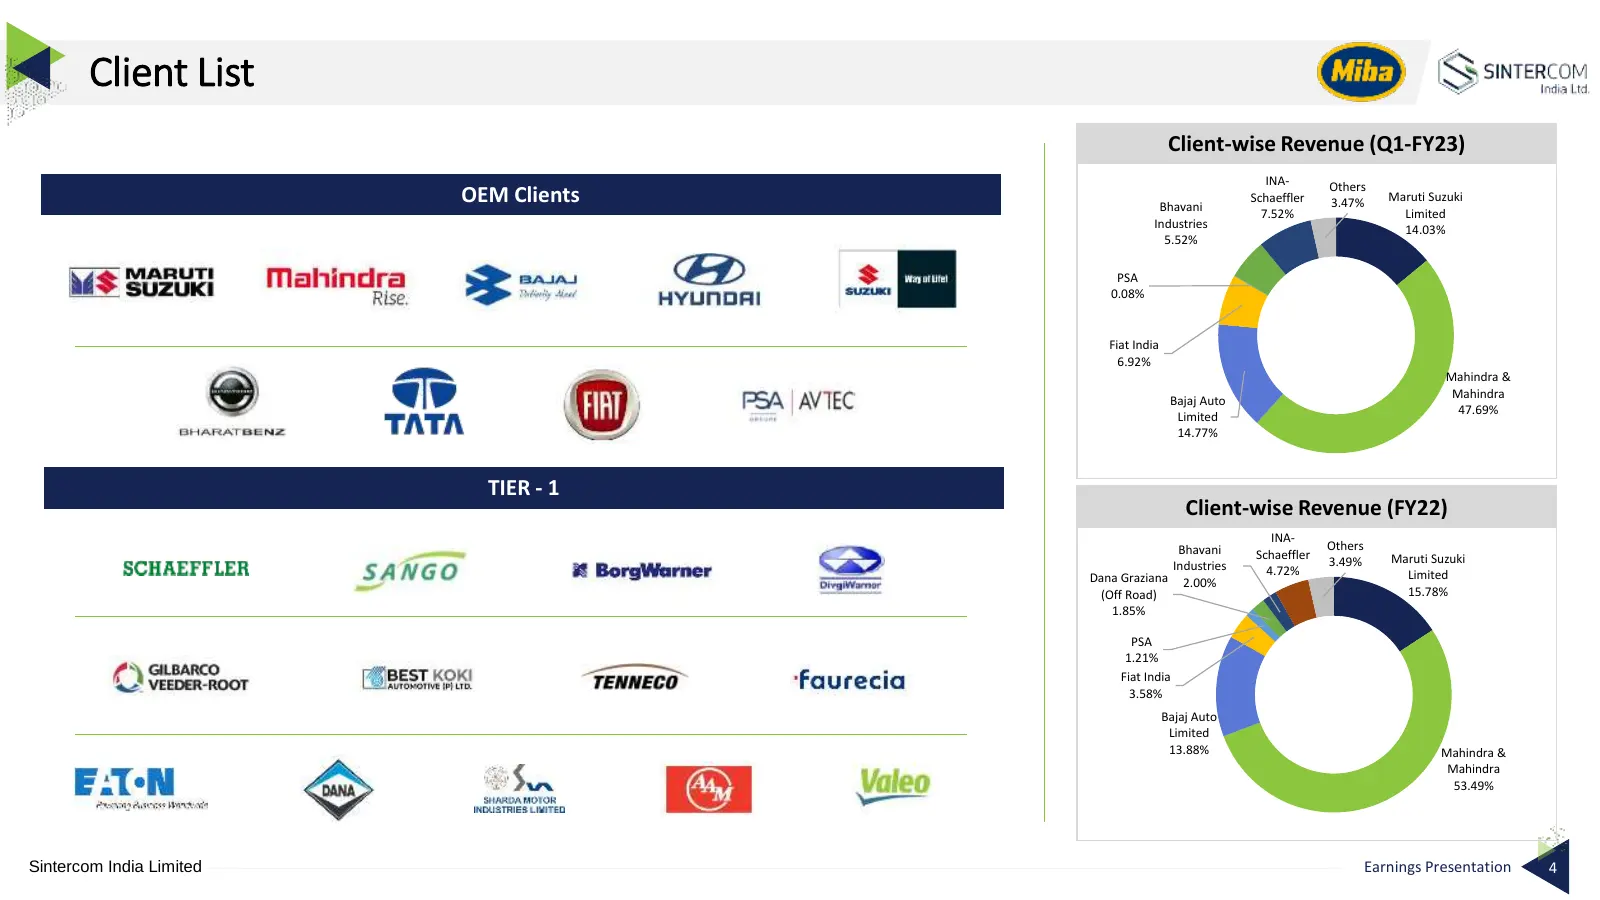
Slide 4: Client List
Client List Client-wise Revenue (Q1-FY23) INA- Others OEM Clients Bhavani Schaeffler 3.47% Maruti Suzuki 7.52% Limited Industries 14.03% 5.52% PSA 0.08% Fiat India 6.92% Mahindra & Mahindra Bajaj Auto 47.69% Limited 14.77% TIER - 1 Client-wise Revenue (FY22) INA- Bhavani Others Schaeffler Maruti Suz
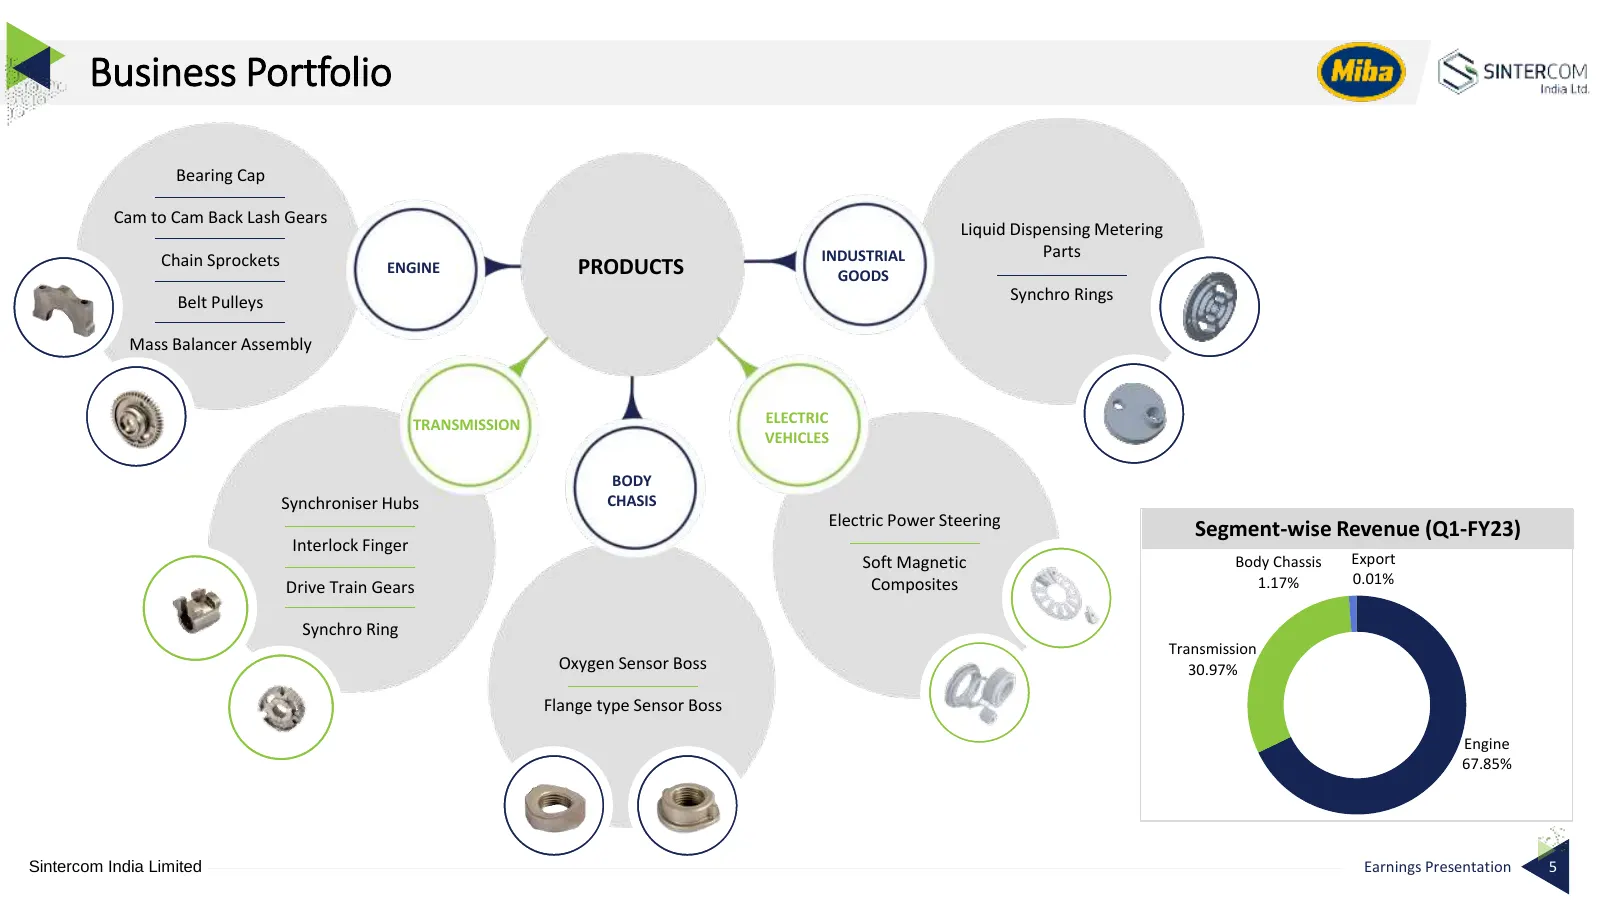
Slide 5: Business Portfolio
Business Portfolio Bearing Cap Cam to Cam Back Lash Gears Liquid Dispensing Metering Chain Sprockets INDUSTRIAL Parts ENGINE PRODUCTS GOODS Belt Pulleys Synchro Rings Mass Balancer Assembly TRANSMISSION ELECTRIC VEHICLES BODY Synchroniser Hubs CHASIS Electric Power Steering Segment-wise Revenue (Q1-
Slide 6: Key Financial Highlights
S sintercom India Lt Key Financial Highlights
Slide 7: Key Financial and Operational Highlights
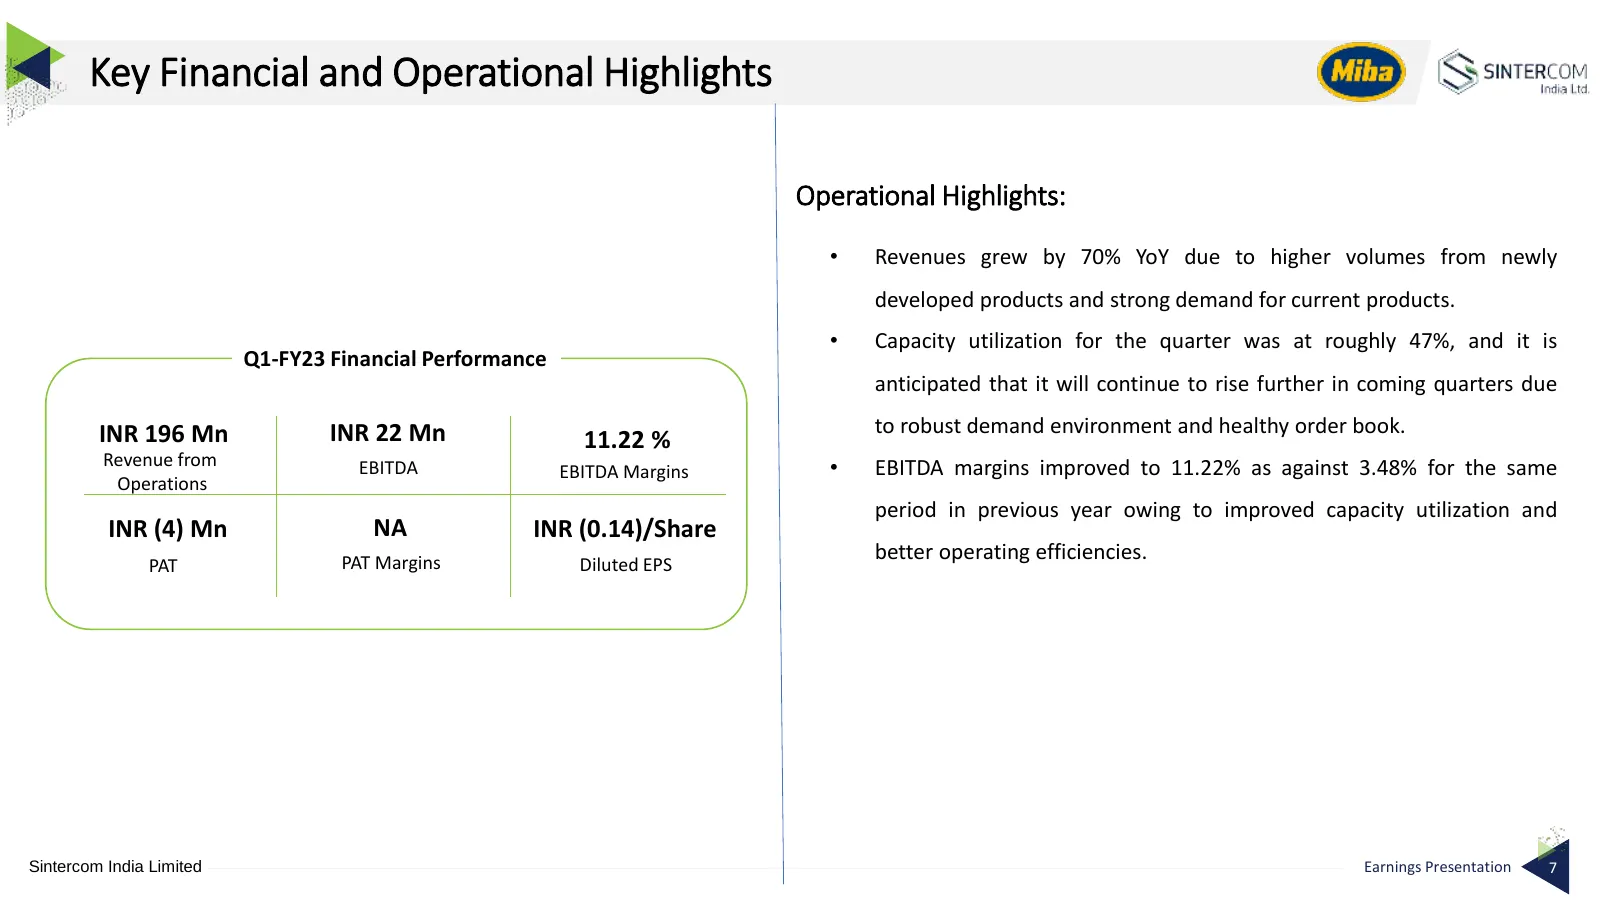
Key Financial and Operational Highlights Operational Highlights: • Revenues grew by 70% YoY due to higher volumes from newly developed products and strong demand for current products. • Capacity utilization for the quarter was at roughly 47%, and it is Q1-FY23 Financial Performance anticipated that
Slide 8: Manufacturing Metrics
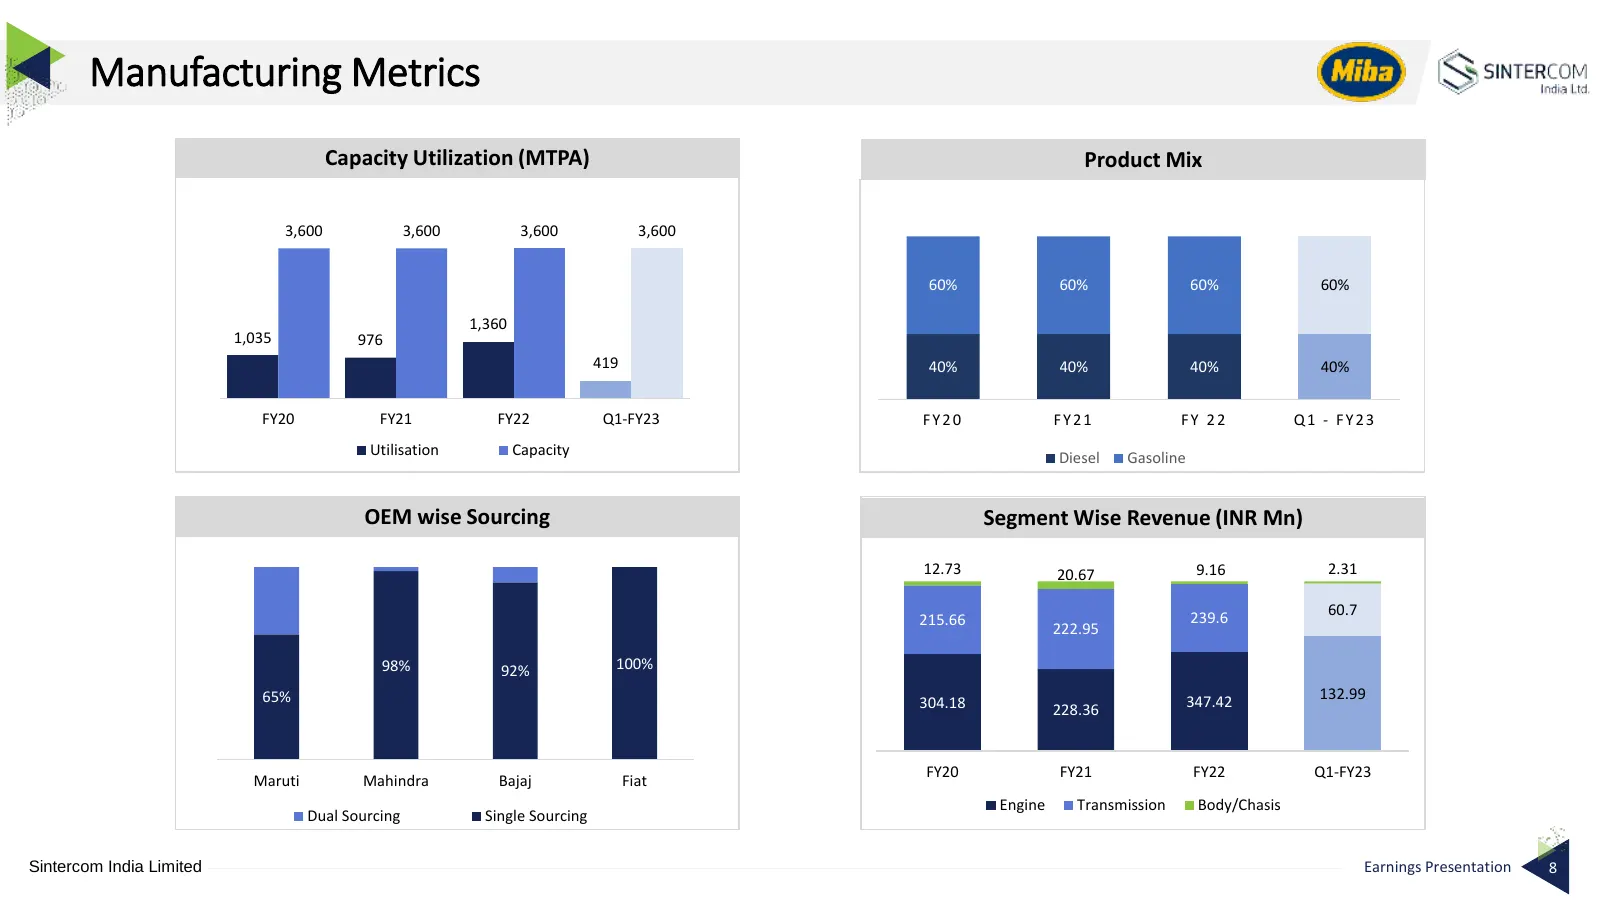
Manufacturing Metrics Capacity Utilization (MTPA) Product Mix 3,600 3,600 3,600 3,600 60% 60% 60% 60% 1,360 1,035 976 419 40% 40% 40% 40% FY20 FY21 FY22 Q1-FY23 FY20 FY21 FY 22 Q1 - FY23 Utilisation Capacity Diesel Gasoline OEM wise Sourcing Segment Wise Revenue (INR Mn) 12.73 20.67 9.16 2.31 60.7 2
Slide 9: Quarterly Financial Performance
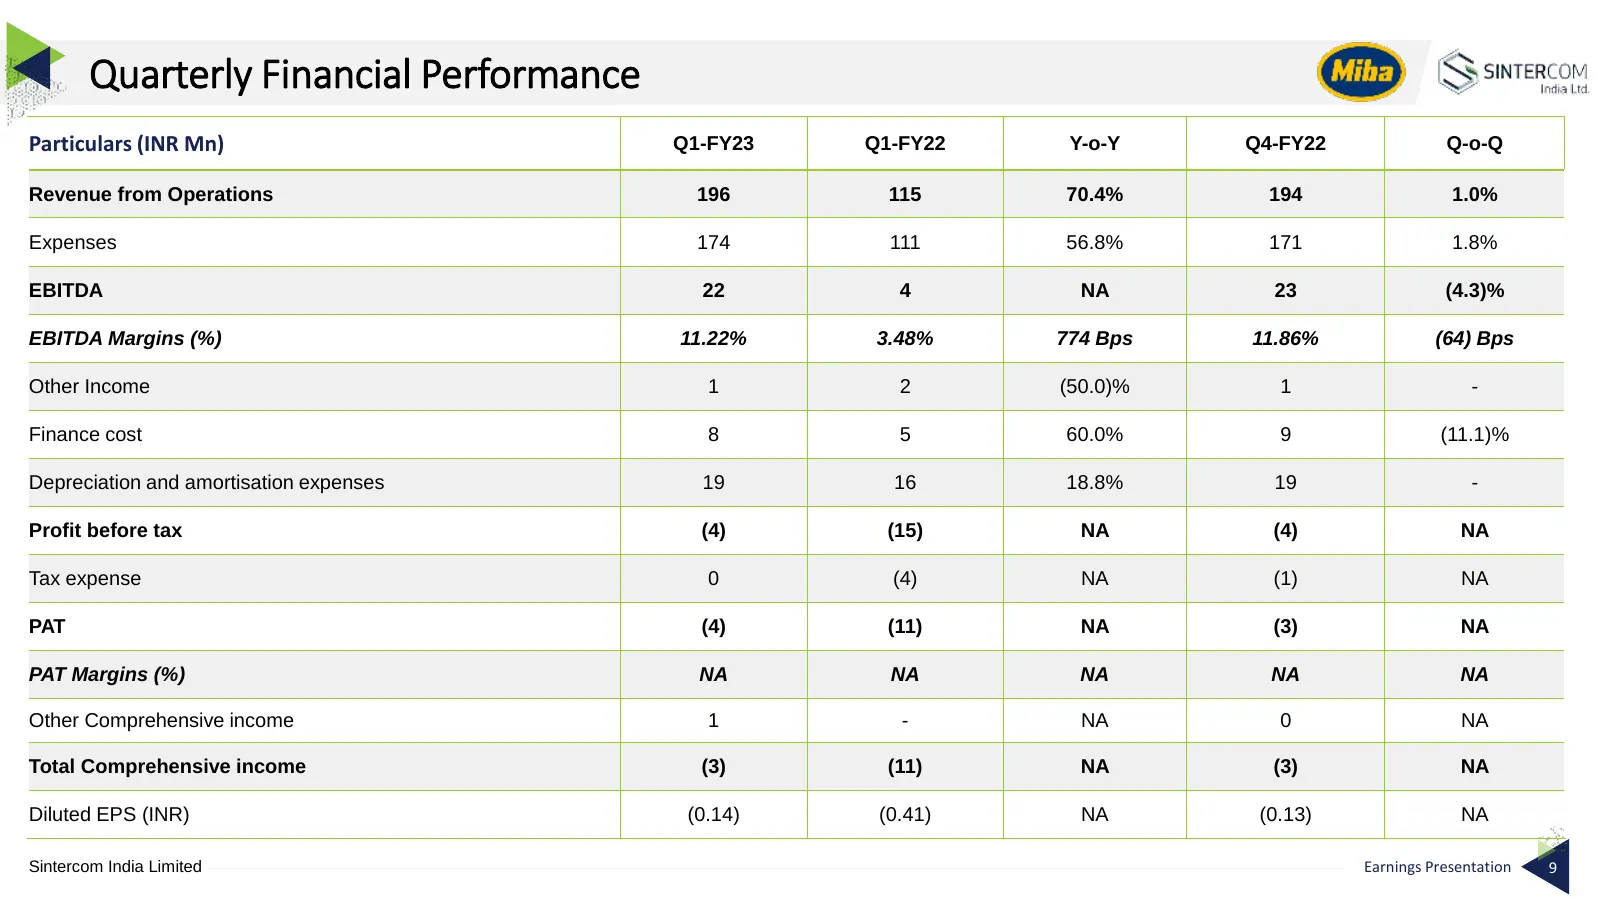
Quarterly Financial Performance Particulars (INR Mn) Q1-FY23 Q1-FY22 Y-o-Y Q4-FY22 Q-o-Q Revenue from Operations 196 115 70.4% 194 1.0% Expenses 174 111 56.8% 171 1.8% EBITDA 22 4 NA 23 (4.3)% EBITDA Margins (%) 11.22% 3.48% 774 Bps 11.86% (64) Bps Other Income 1 2 (50.0)% 1 - Finance cost 8 5 60.0%
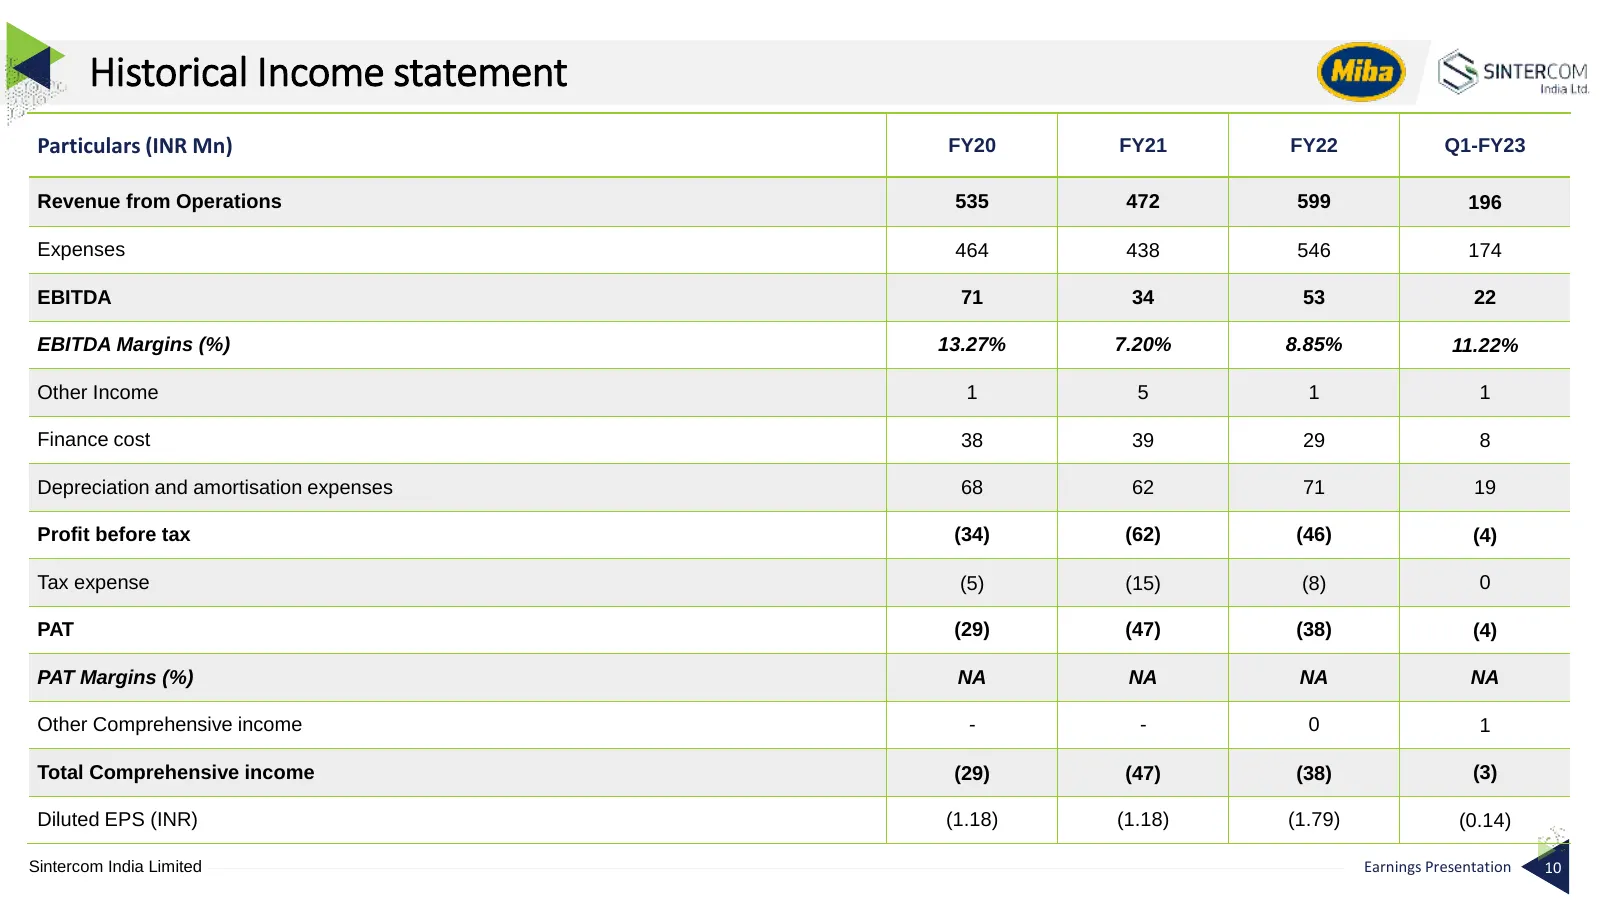
Slide 10: Historical Income statement
Historical Income statement Particulars (INR Mn) FY20 FY21 FY22 Q1-FY23 Revenue from Operations 535 472 599 196 Expenses 464 438 546 174 EBITDA 71 34 53 22 EBITDA Margins (%) 13.27% 7.20% 8.85% 11.22% Other Income 1 5 1 1 Finance cost 38 39 29 8 Depreciation and amortisation expenses 68 62 71 19 Pro
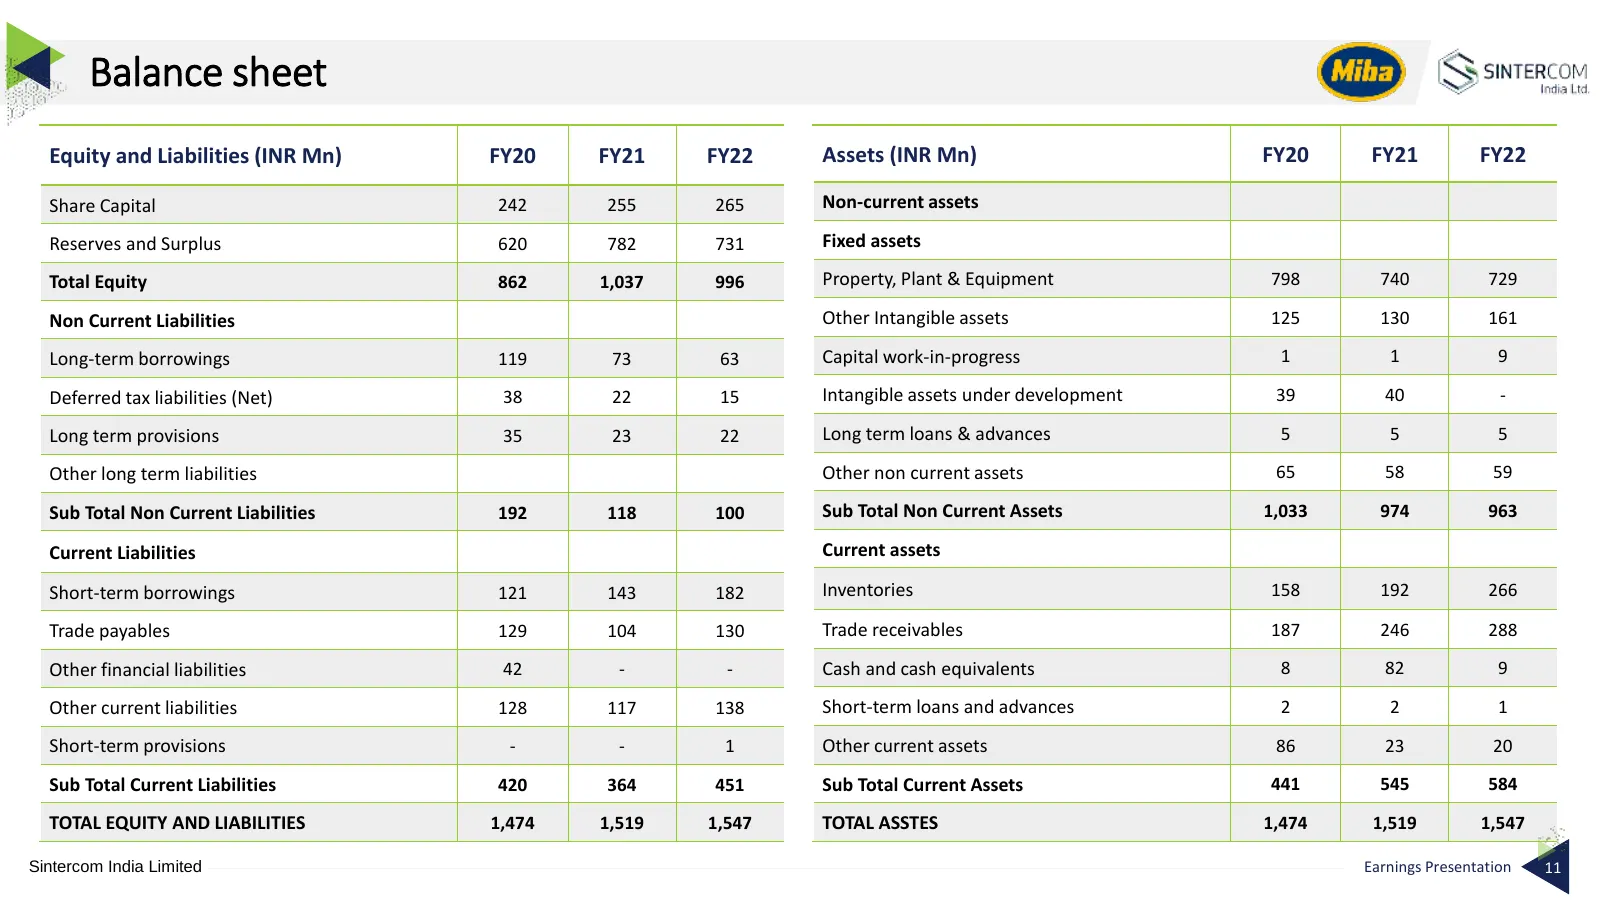
Slide 11: Balance sheet
Balance sheet Equity and Liabilities (INR Mn) FY20 FY21 FY22 Assets (INR Mn) FY20 FY21 FY22 Share Capital 242 255 265 Non-current assets Reserves and Surplus 620 782 731 Fixed assets Total Equity 862 1,037 996 Property, Plant & Equipment 798 740 729 Non Current Liabilities Other Intangible assets 12
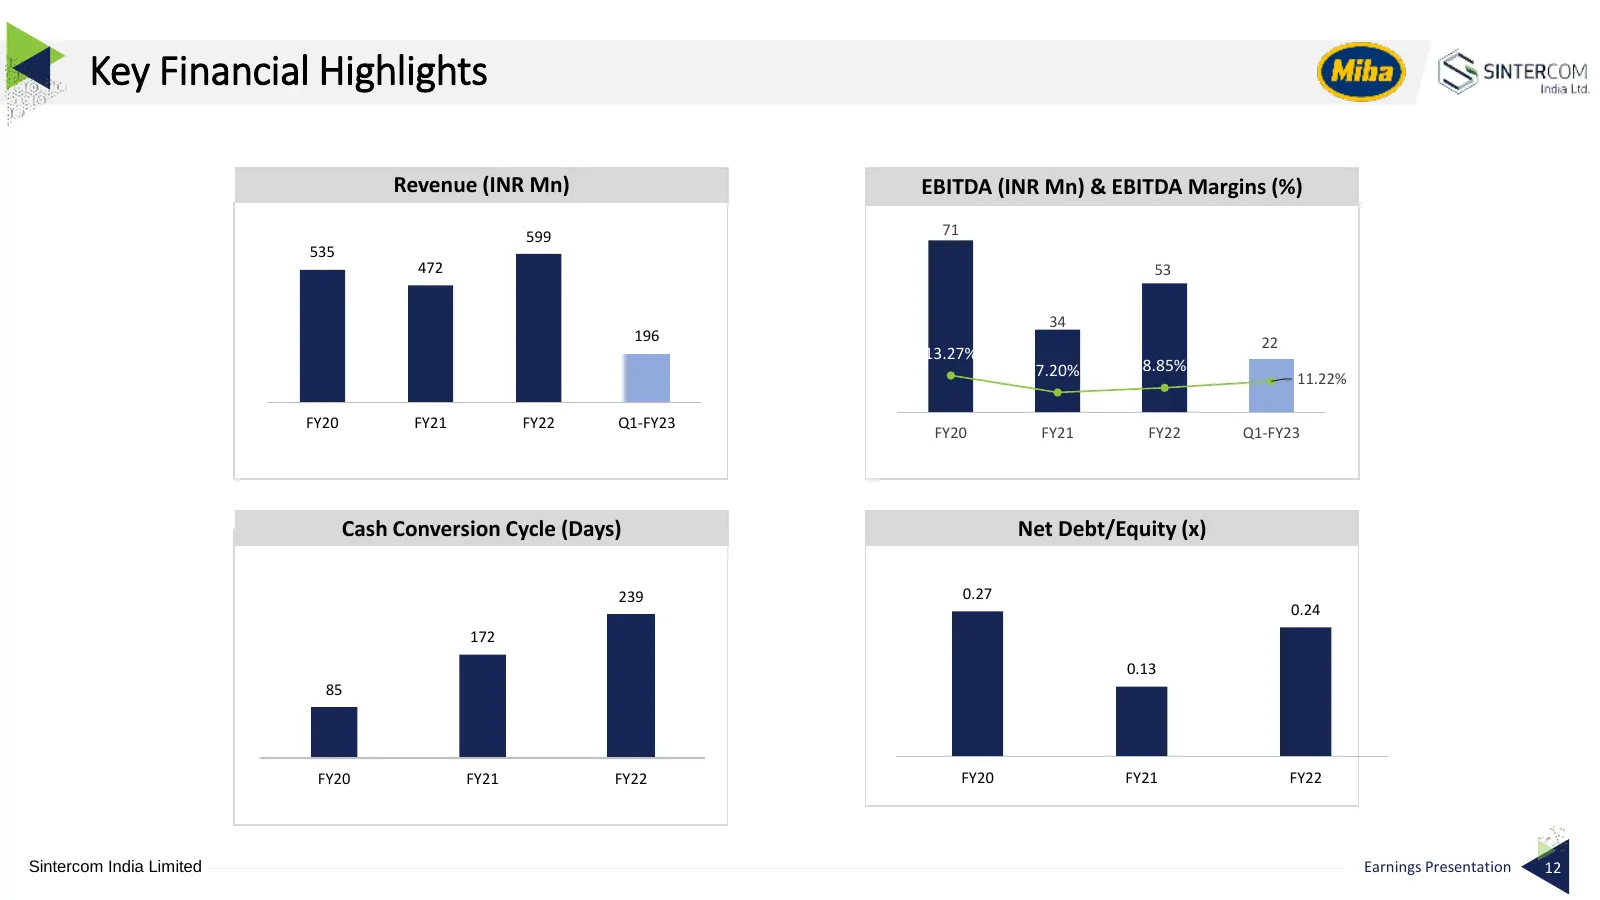
Slide 12: Key Financial Highlights
Key Financial Highlights Revenue (INR Mn) EBITDA (INR Mn) & EBITDA Margins (%) 599 71 535 472 53 34 196 22 13.27% 7.20% 8.85% 11.22% FY20 FY21 FY22 Q1-FY23 FY20 FY21 FY22 Q1-FY23 Cash Conversion Cycle (Days) Net Debt/Equity (x) 239 0.27 0.24 172 0.13 85 FY20 FY21 FY22 FY20 FY21 FY22 Sintercom India
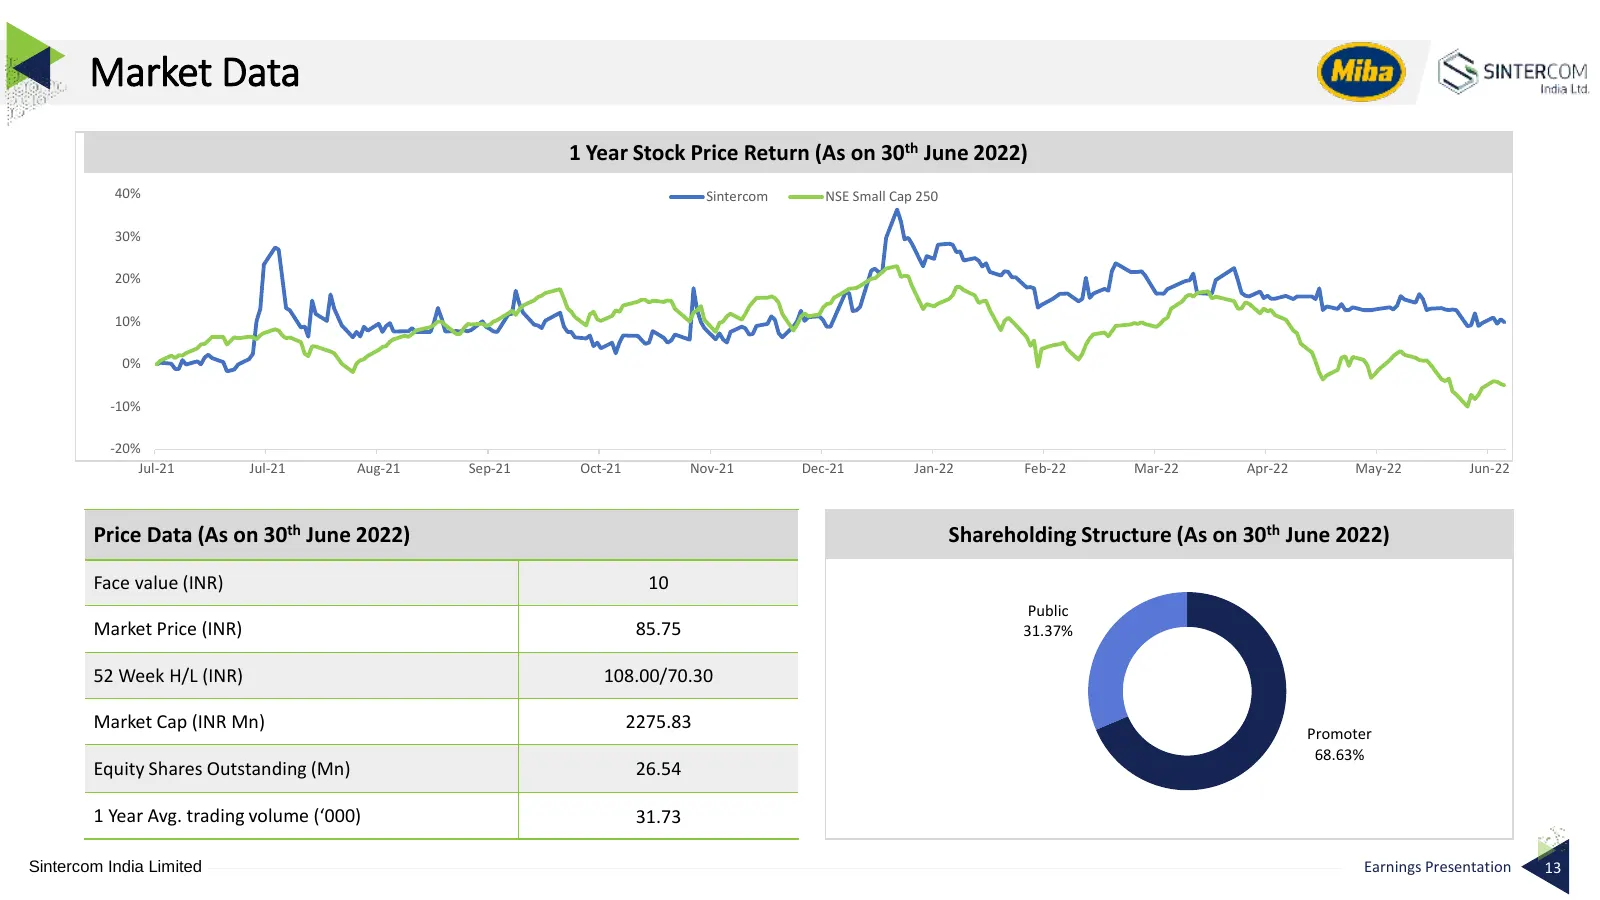
Slide 13: Market Data
Market Data 1 Year Stock Price Return (As on 30th June 2022) 40% Sintercom NSE Small Cap 250 30% 20% 10% 0% -10% -20% Jul-21 Jul-21 Aug-21 Sep-21 Oct-21 Nov-21 Dec-21 Jan-22 Feb-22 Mar-22 Apr-22 May-22 Jun-22 Price Data (As on 30th June 2022) Shareholding Structure (As on 30th June 2022) Face value
Slide 14: Disclaimer
Disclaimer Sintercom India Disclaimer: No representation or warranty, express or implied, is made as to, and no reliance should be placed on, the fairness, accuracy, completeness or correctness of the information or opinions contained in this presentation. Such information and opinions are in all ev
Slide 15: Thank You!
S sintercom India Lt
Source: company website
More decks from Sintercom India Ltd.
 Q4 FY24 Earnings Presentation17 slides · May 25, 2024
 9M-FY24 Earnings Presentation37 slides · Mar 19, 2024
 Q3 FY24 Earnings Presentation17 slides · Feb 17, 2024
 H1 FY2024 Earnings Presentation17 slides · Nov 22, 2023
 Investor Presentation (September 2023)38 slides · Sep 15, 2023
 Q1 FY24 Earnings Presentation15 slides · Aug 21, 2023