Tabcorp Holdings Limited · ASX:TAH
Tabcorp — FY2017 Earnings Presentation
24 slides from Tabcorp's earnings presentation, Aug 4, 2017
Slide 1: Tabcorp Holdings Limited 2016/17 Full Year Results Presentation
TABCORP HOLDINGS LIMITED 2016/17 FULL YEAR RESULTS PRESENTATION 4 AUGUST 2017 ABN 66 063 780 709
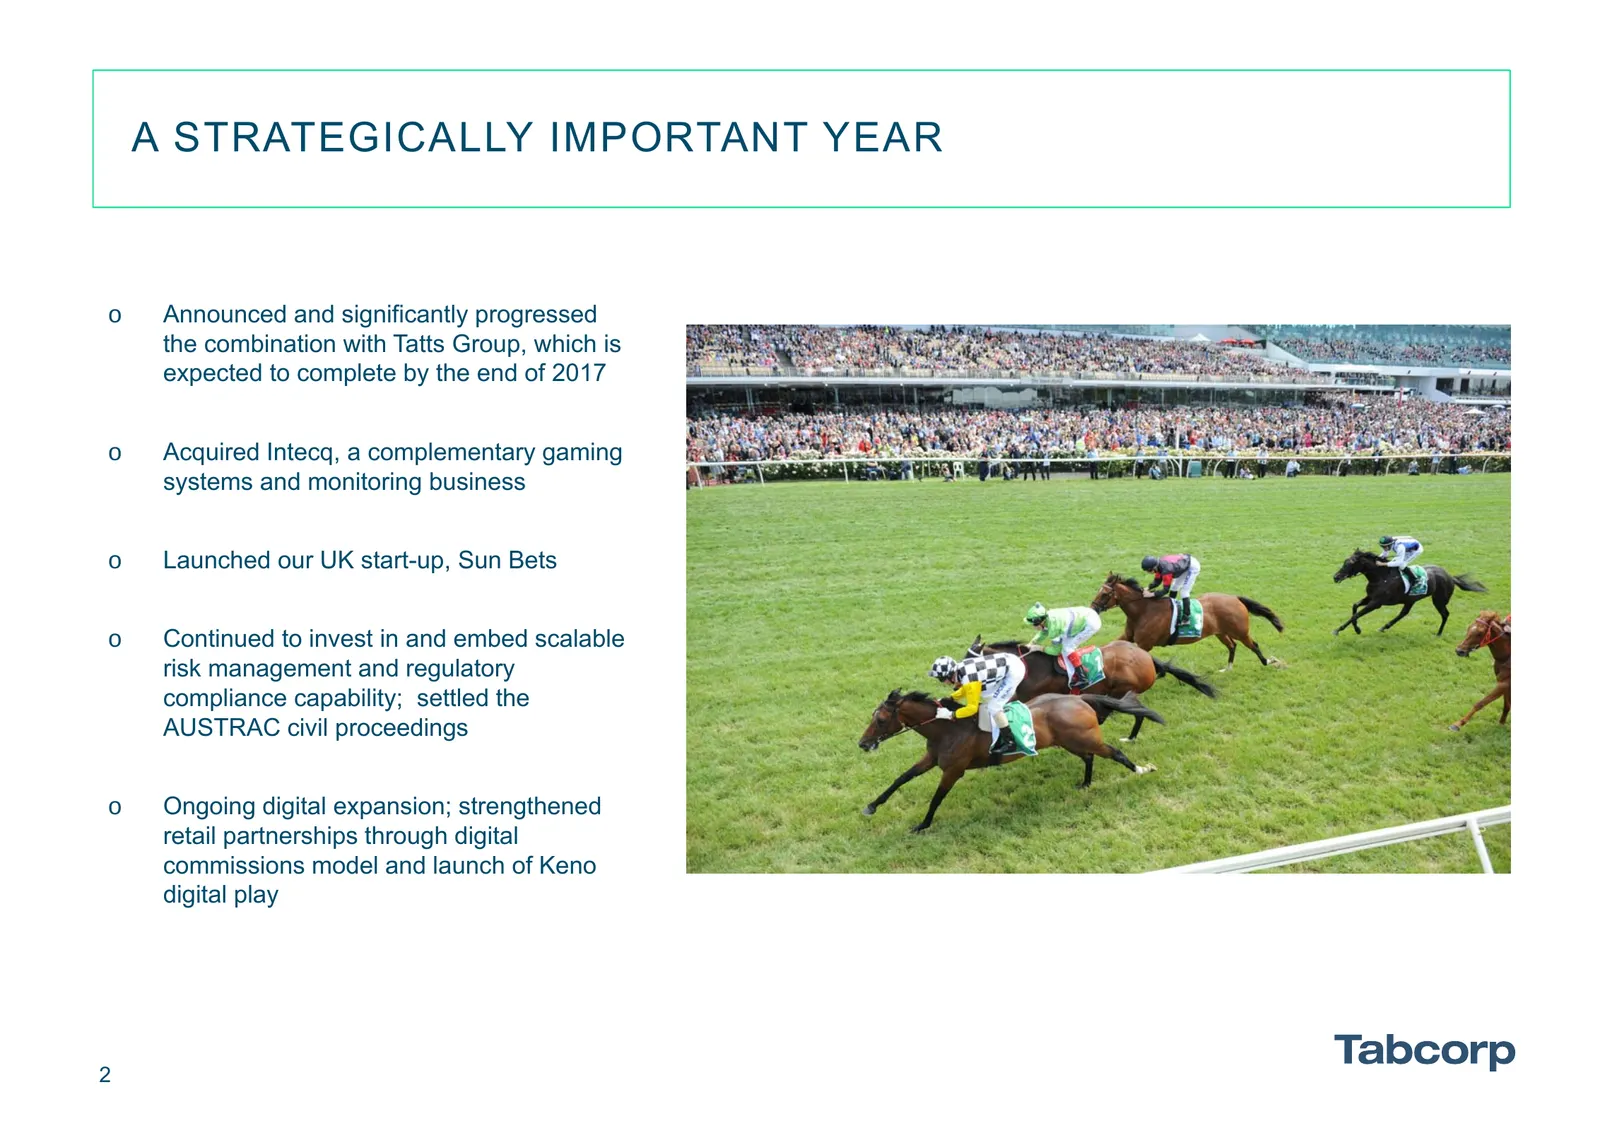
Slide 2: A Strategically Important Year
A STRATEGICALLY IMPORTANT YEAR o Announced and significantly progressed the combination with Tatts Group, which is expected to complete by the end of 2017 o Acquired Intecq, a complementary gaming systems and monitoring business o Launched our UK start-up, Sun Bets o Continued to invest in and embed
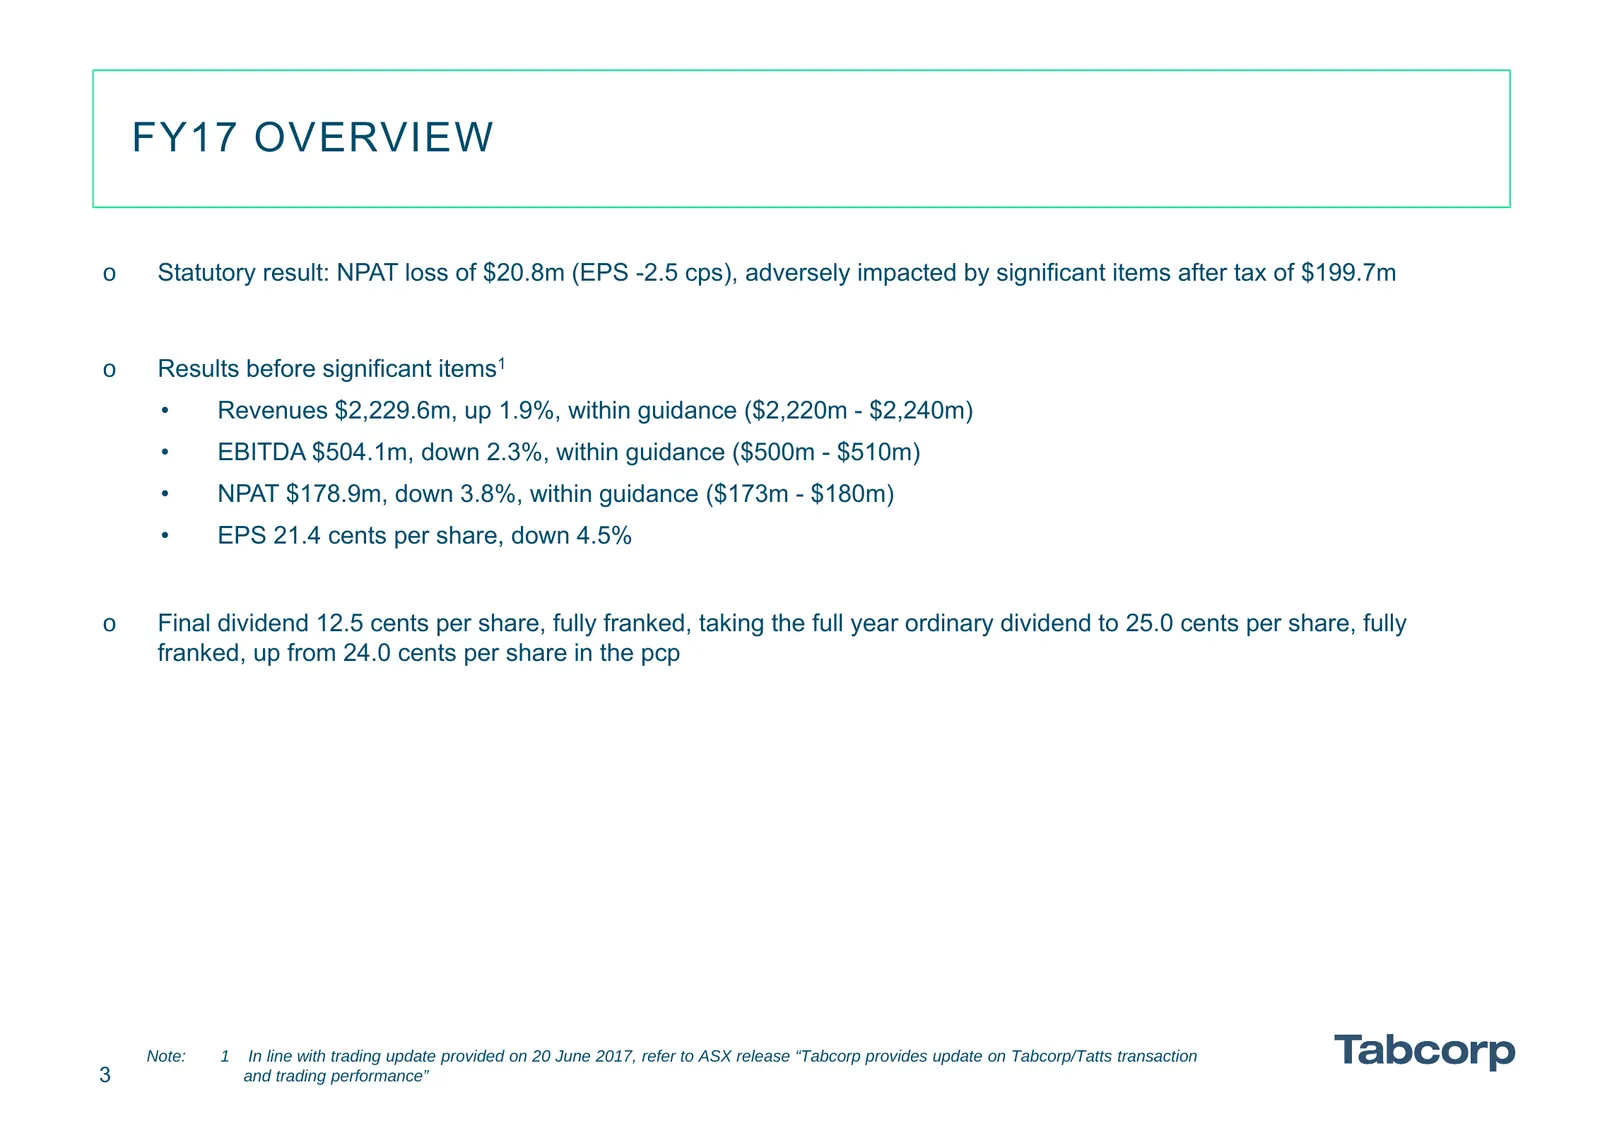
Slide 3: FY17 Overview
FY17 OVERVIEW o Statutory result: NPAT loss of $20.8m (EPS -2.5 cps), adversely impacted by significant items after tax of $199.7m o Results before significant items1 • Revenues $2,229.6m, up 1.9%, within guidance ($2,220m - $2,240m) • EBITDA $504.1m, down 2.3%, within guidance ($500m - $510m) • NPA
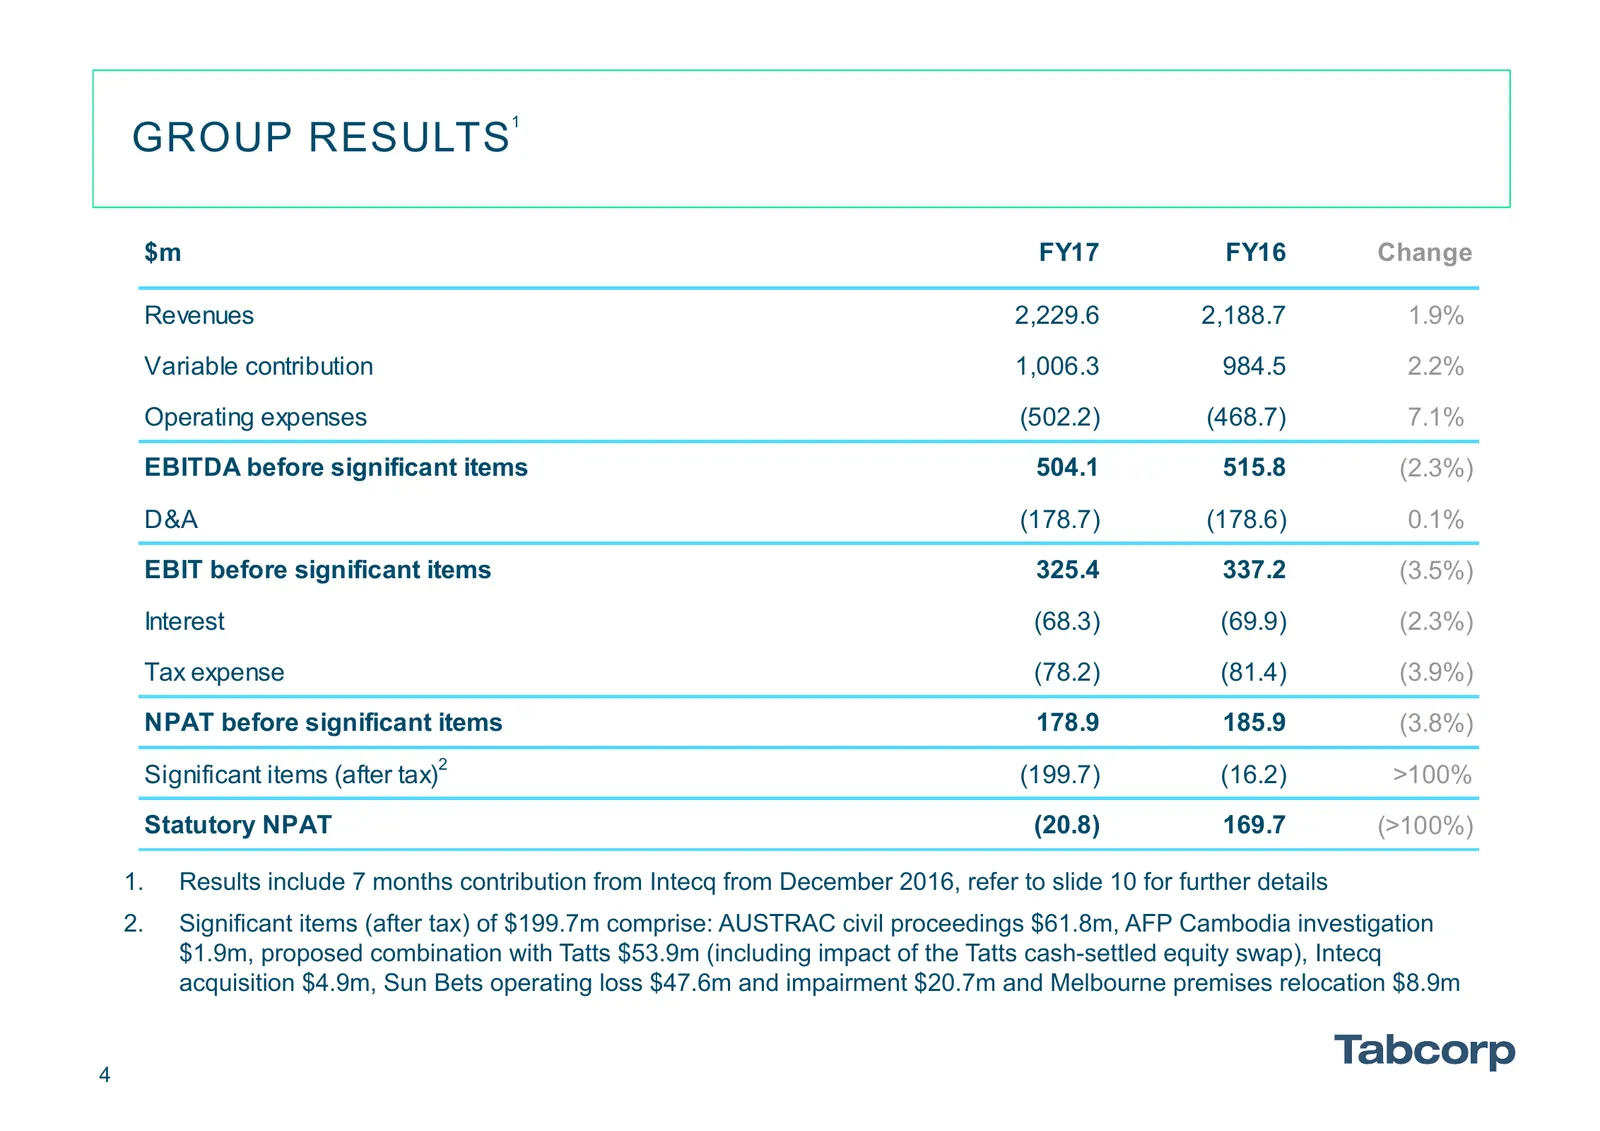
Slide 4: Group Results
1 GROUP RESULTS $m FY17 FY16 Change Revenues 2,229.6 2,188.7 1.9% Variable contribution 1,006.3 984.5 2.2% Operating expenses (502.2) (468.7) 7.1% EBITDA before significant items 504.1 515.8 (2.3%) D&A (178.7) (178.6) 0.1% EBIT before significant items 325.4 337.2 (3.5%) Interest (68.3) (69.9) (2.3%
Slide 5: Business Results
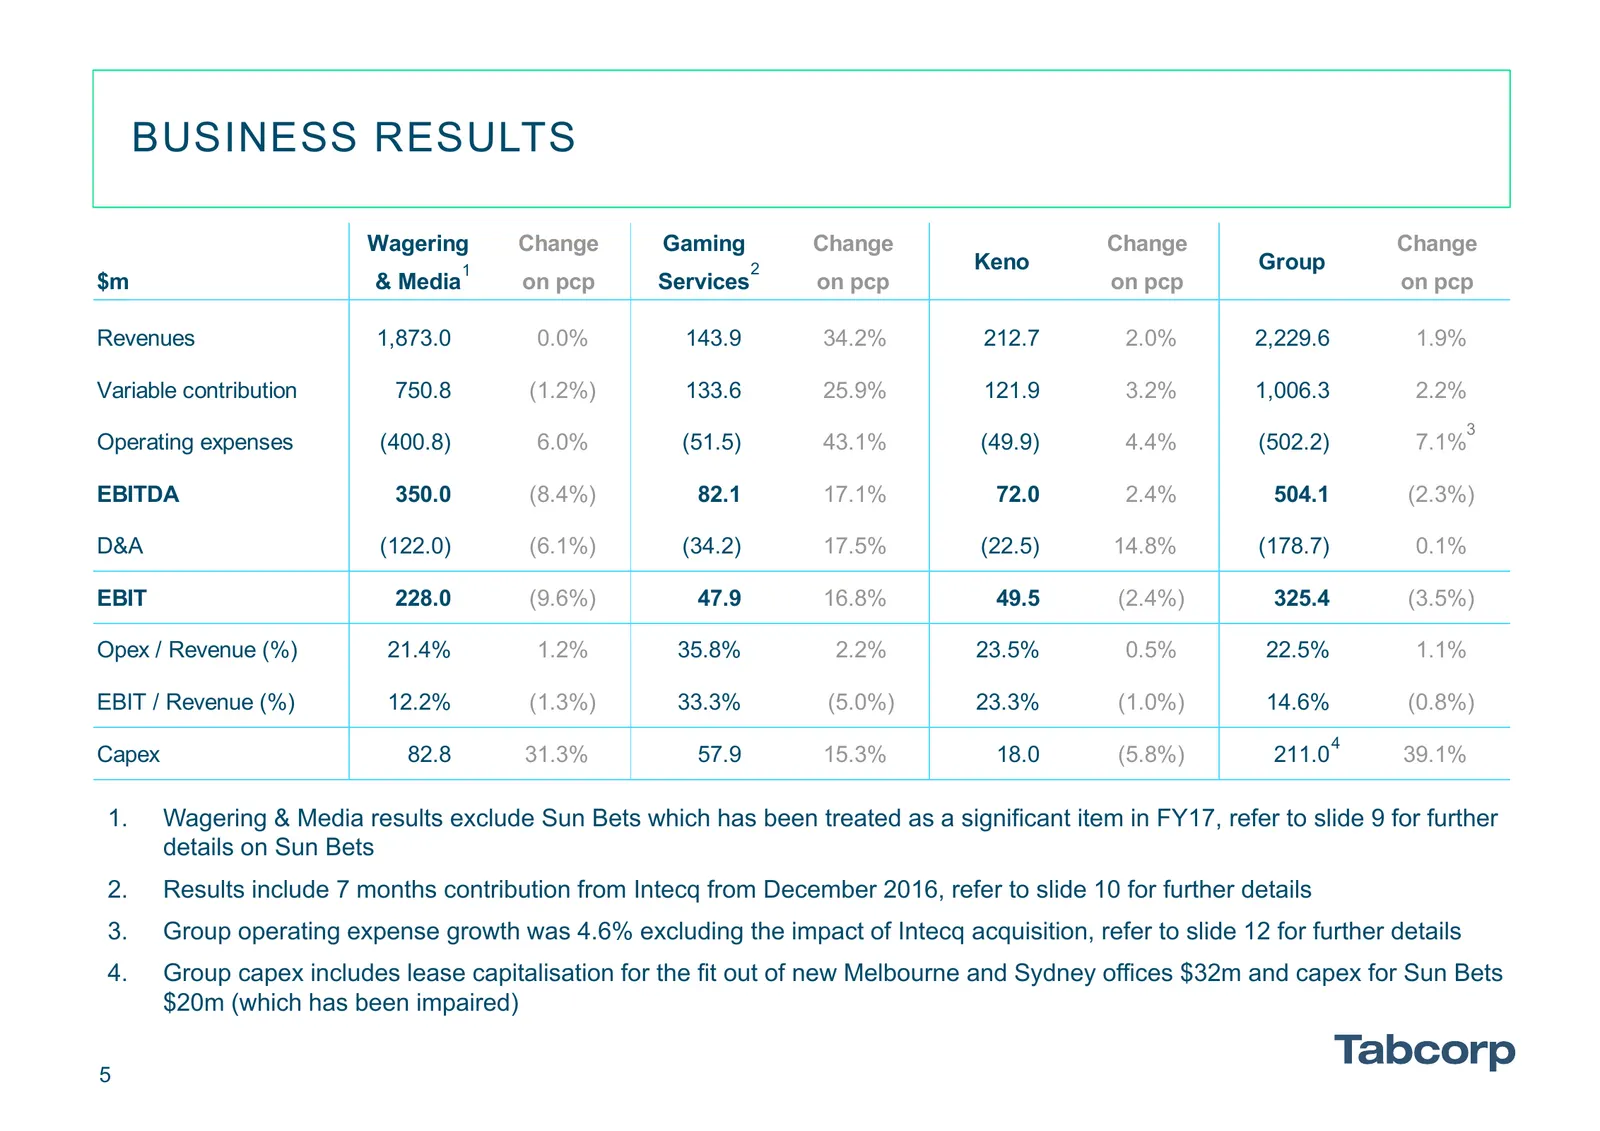
BUSINESS RESULTS Wagering Change Gaming Change Change Change 1 2 Keno Group $m & Media on pcp Services on pcp on pcp on pcp Revenues 1,873.0 0.0% 143.9 34.2% 212.7 2.0% 2,229.6 1.9% Variable contribution 750.8 (1.2%) 133.6 25.9% 121.9 3.2% 1,006.3 2.2% 3 Operating expenses (400.8) 6.0% (51.5) 43.1%
Slide 6: Wagering & Media: KPIs
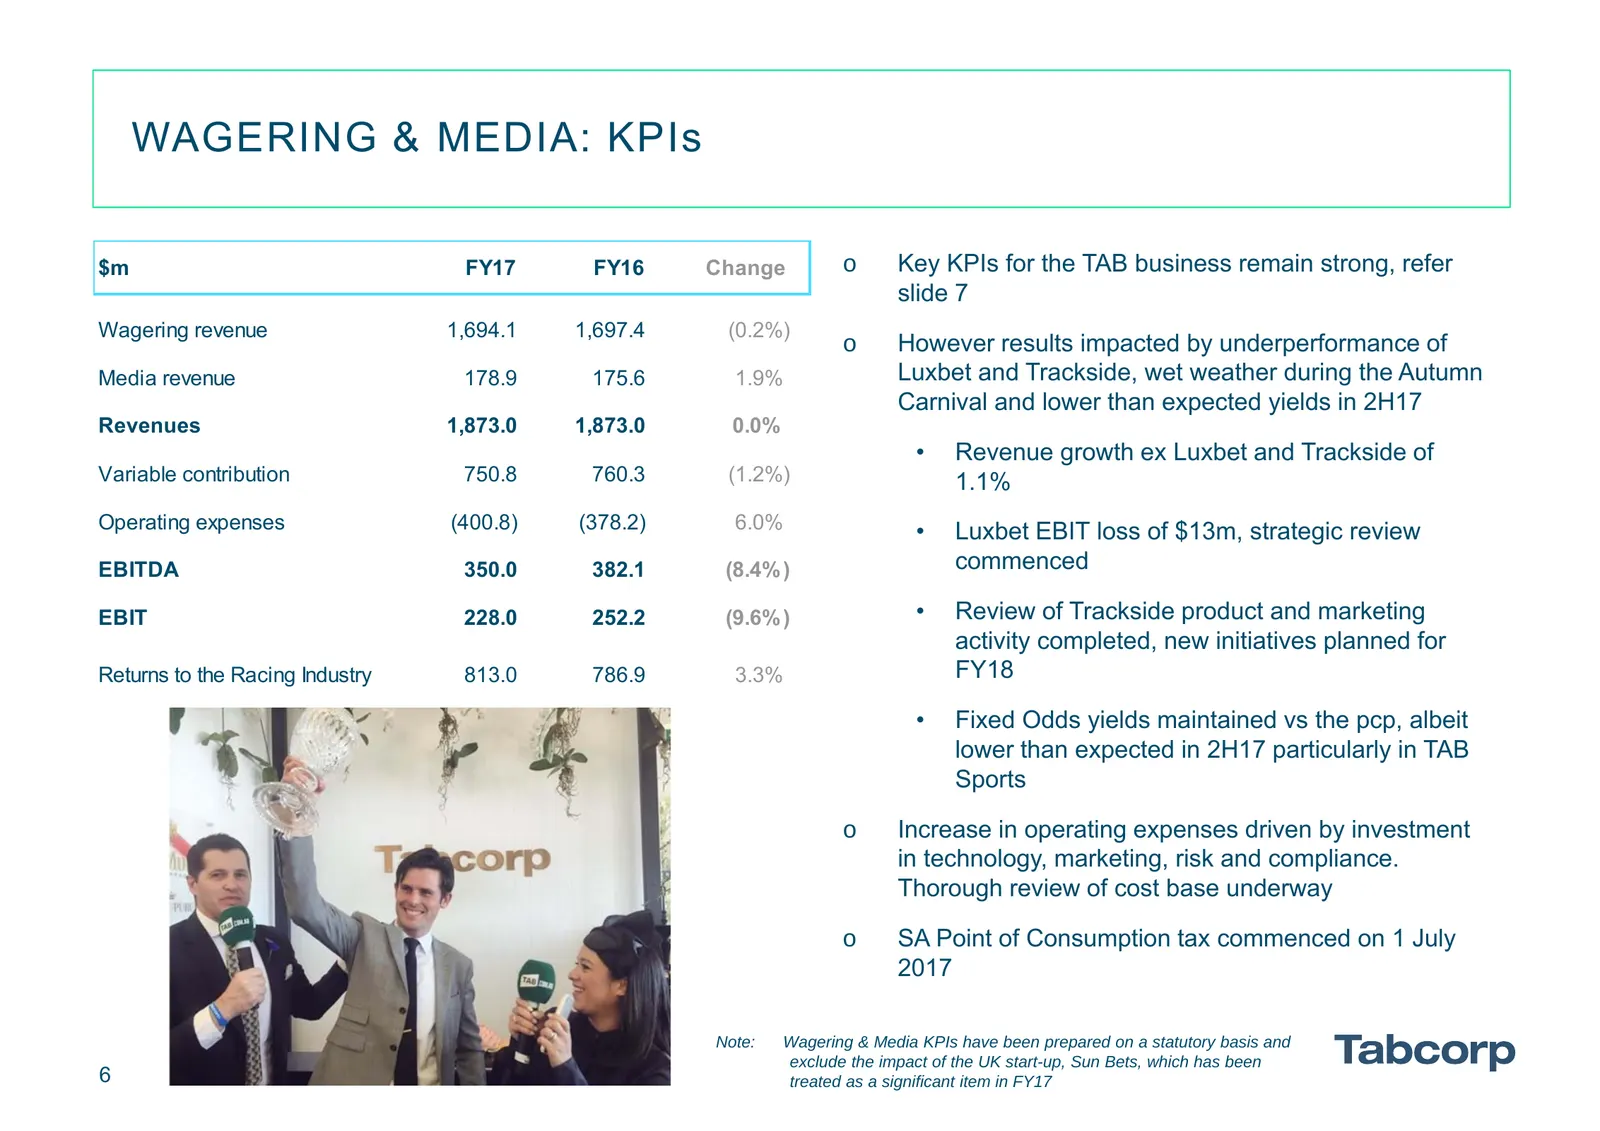
WAGERING & MEDIA: KPIs $m FY17 FY16 Change o Key KPIs for the TAB business remain strong, refer slide 7 Wagering revenue 1,694.1 1,697.4 (0.2%) o However results impacted by underperformance of Media revenue 178.9 175.6 1.9% Luxbet and Trackside, wet weather during the Autumn Carnival and lower than
Slide 7: TAB: KPIs
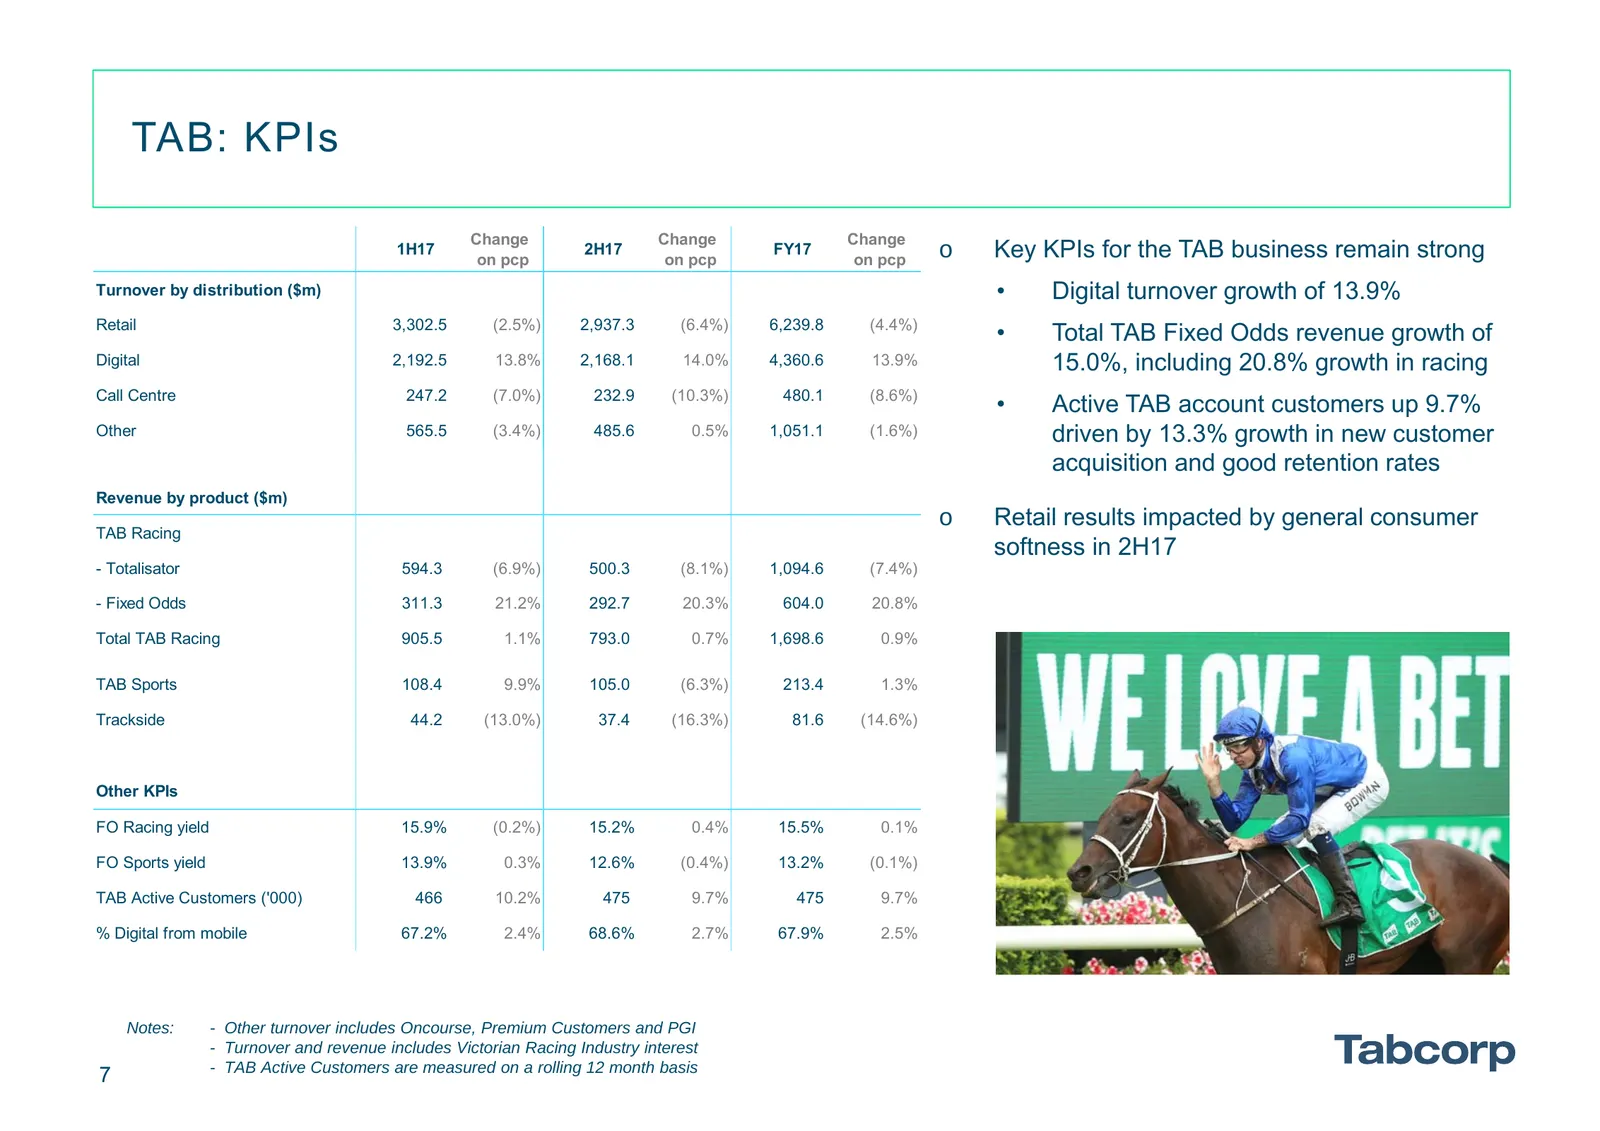
TAB: KPIs Change Change Change 1H17 on pcp 2H17 on pcp FY17 on pcp o Key KPIs for the TAB business remain strong Turnover by distribution ($m) • Digital turnover growth of 13.9% Retail 3,302.5 (2.5%) 2,937.3 (6.4%) 6,239.8 (4.4%) • Total TAB Fixed Odds revenue growth of Digital 2,192.5 13.8% 2,168.1
Slide 8: Wagering & Media Initiatives
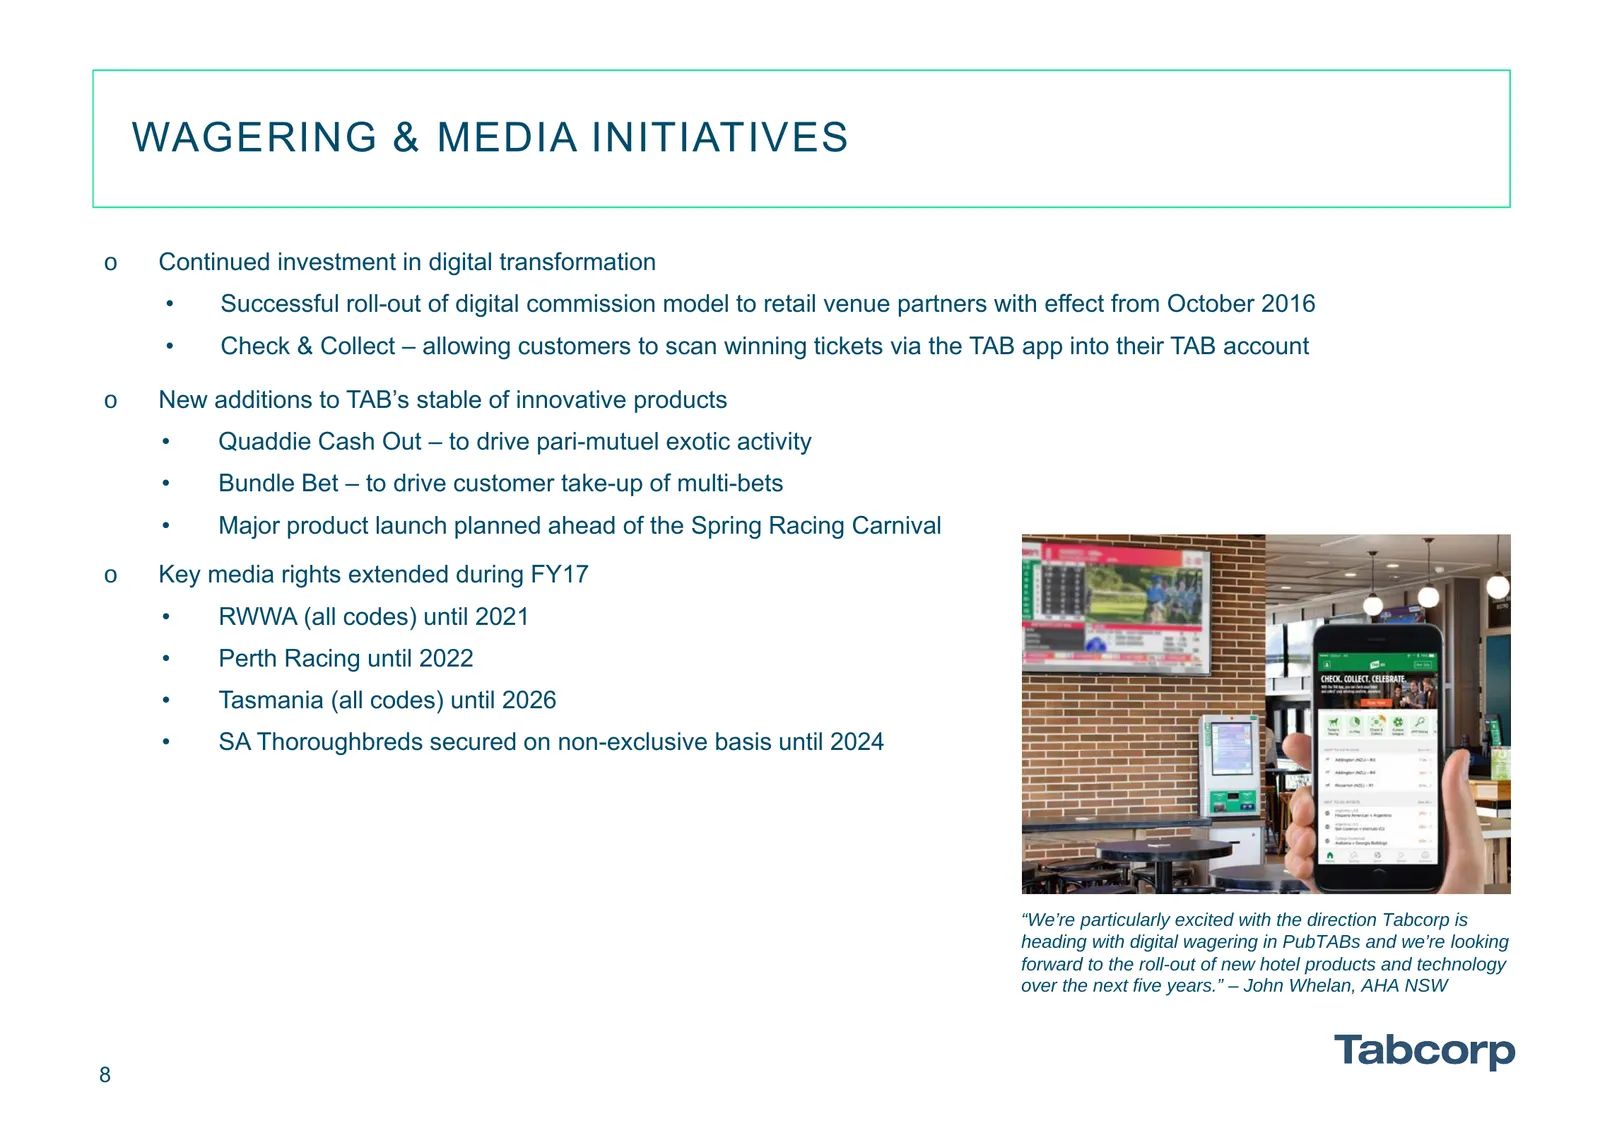
WAGERING & MEDIA INITIATIVES o Continued investment in digital transformation • Successful roll-out of digital commission model to retail venue partners with effect from October 2016 • Check & Collect – allowing customers to scan winning tickets via the TAB app into their TAB account o New additions
Slide 9: Sun Bets
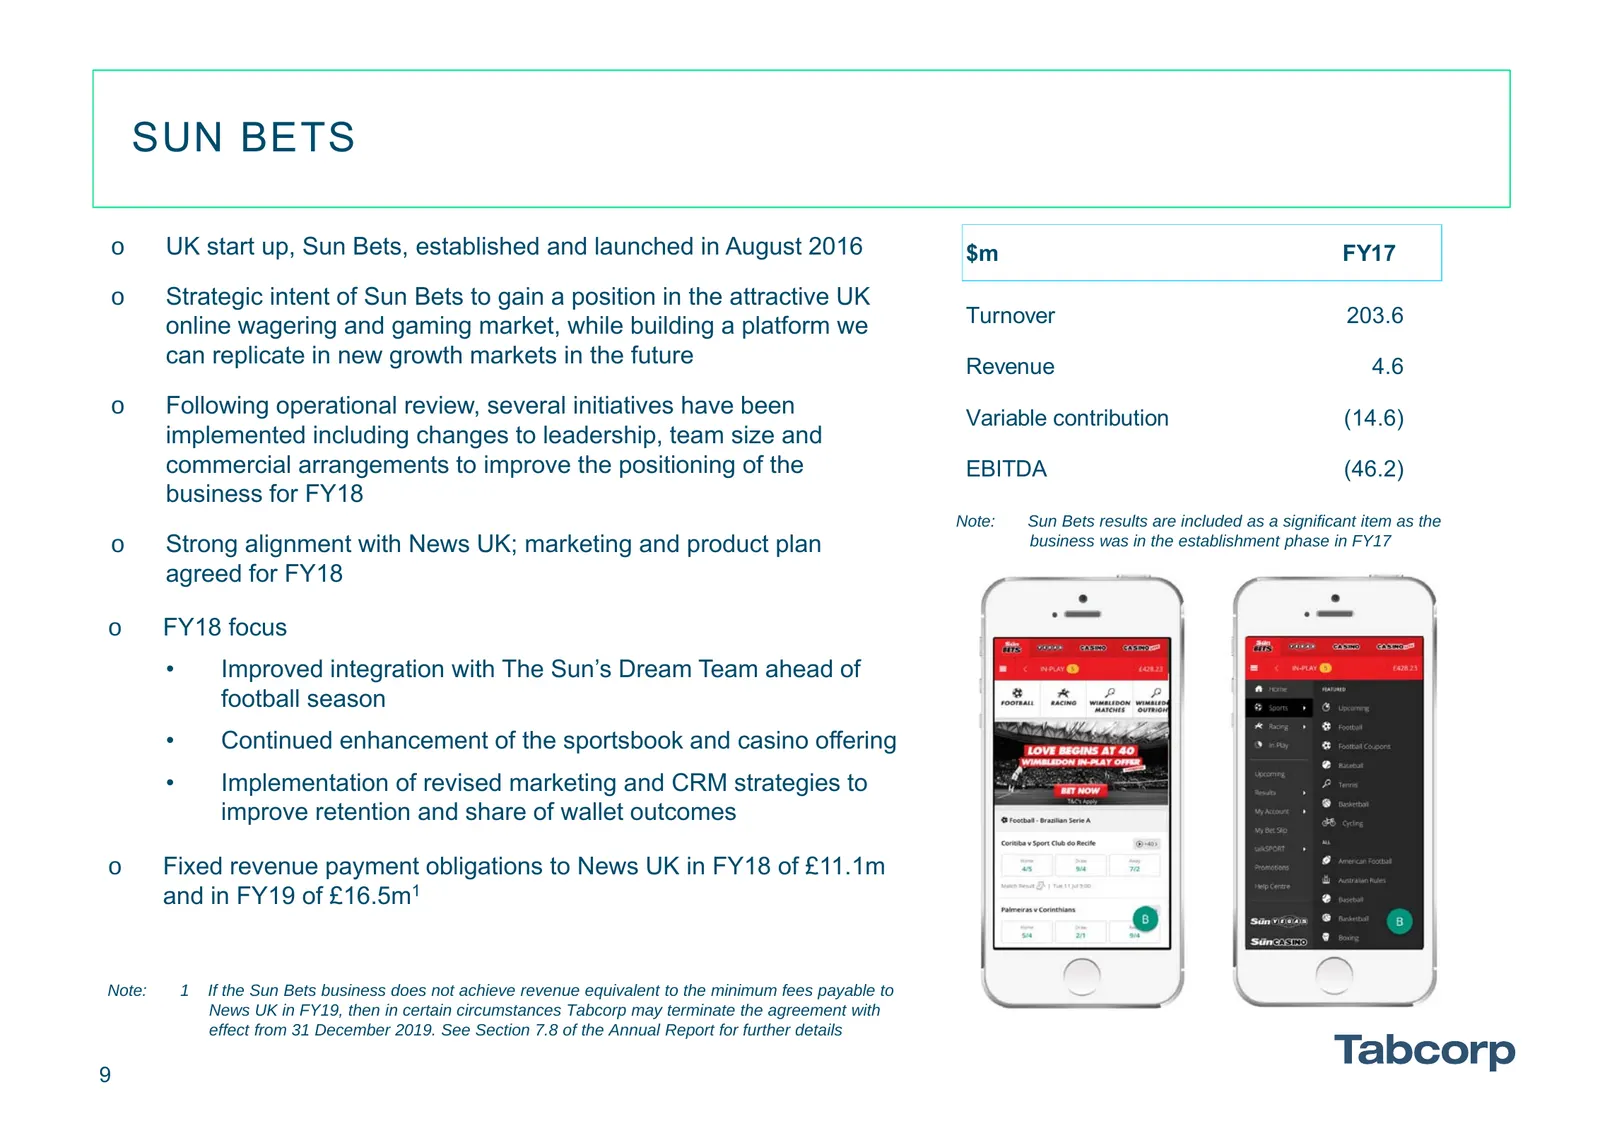
SUN BETS o UK start up, Sun Bets, established and launched in August 2016 $m FY17 o Strategic intent of Sun Bets to gain a position in the attractive UK online wagering and gaming market, while building a platform we Turnover 203.6 can replicate in new growth markets in the future Revenue 4.6 o Foll
Slide 10: Gaming Services: KPIs
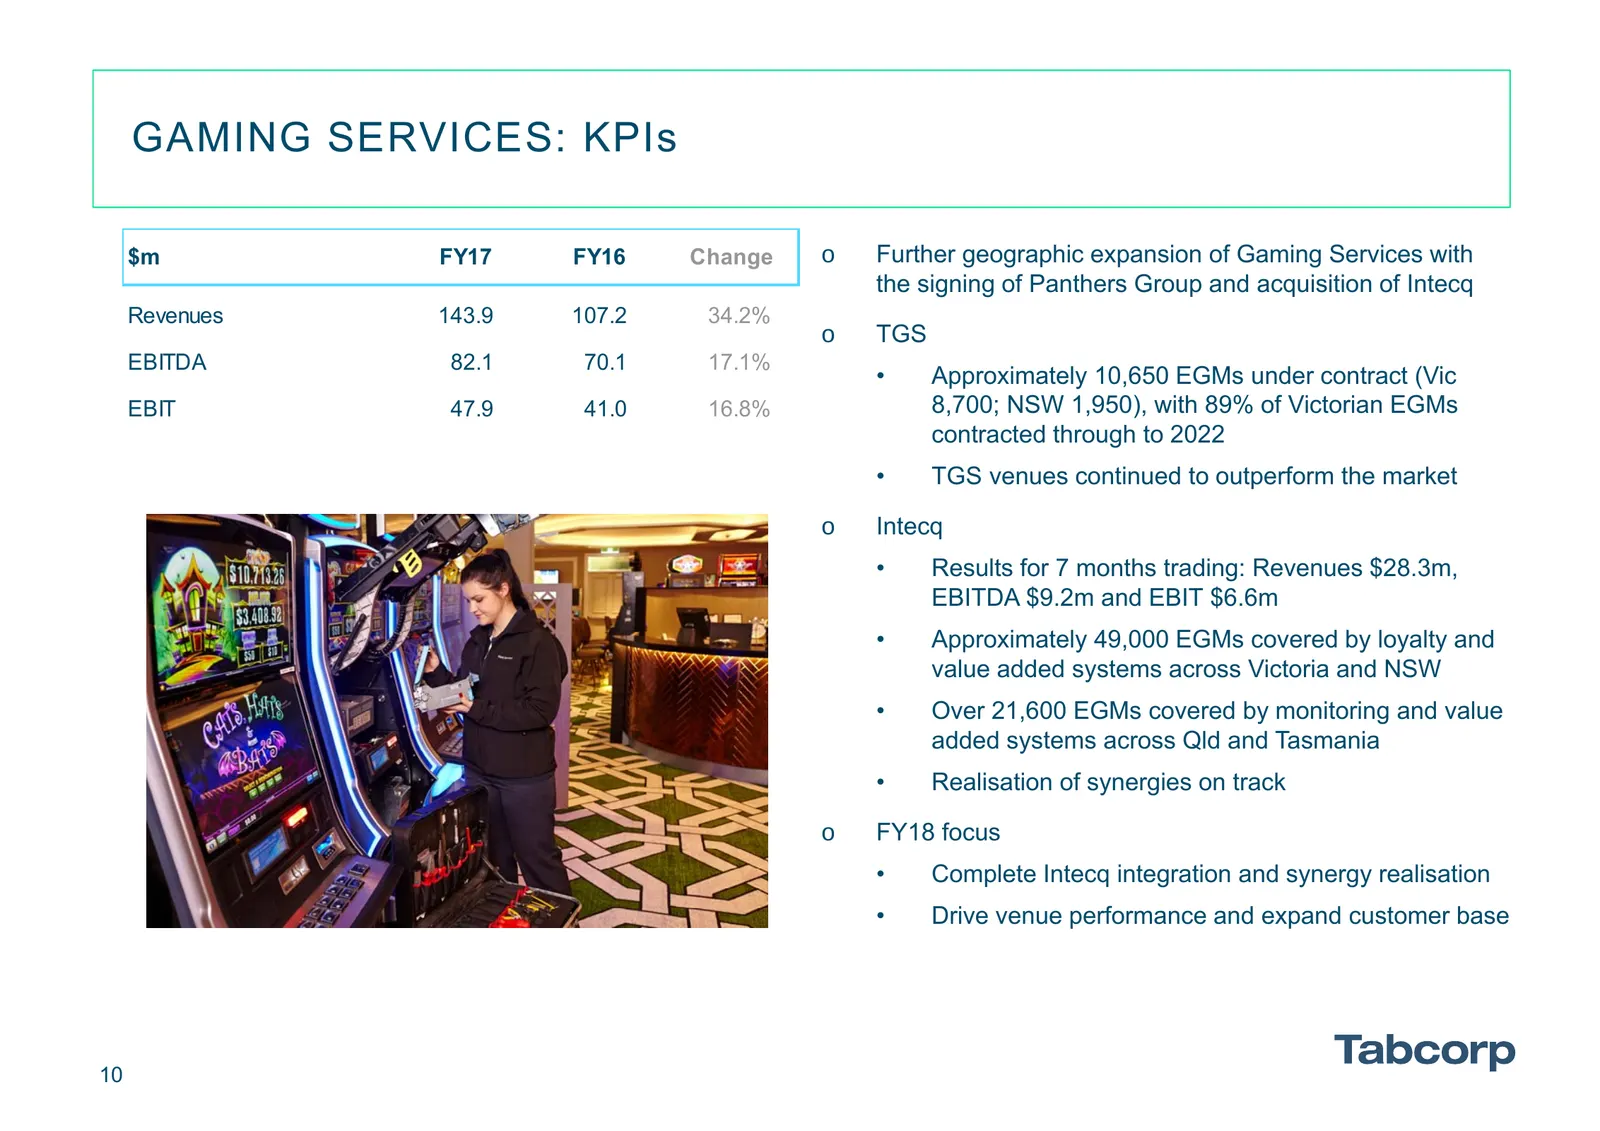
GAMING SERVICES: KPIs $m FY17 FY16 Change o Further geographic expansion of Gaming Services with the signing of Panthers Group and acquisition of Intecq Revenues 143.9 107.2 34.2% o TGS EBITDA 82.1 70.1 17.1% • Approximately 10,650 EGMs under contract (Vic EBIT 47.9 41.0 16.8% 8,700; NSW 1,950), wit
Slide 11: Keno: KPIs
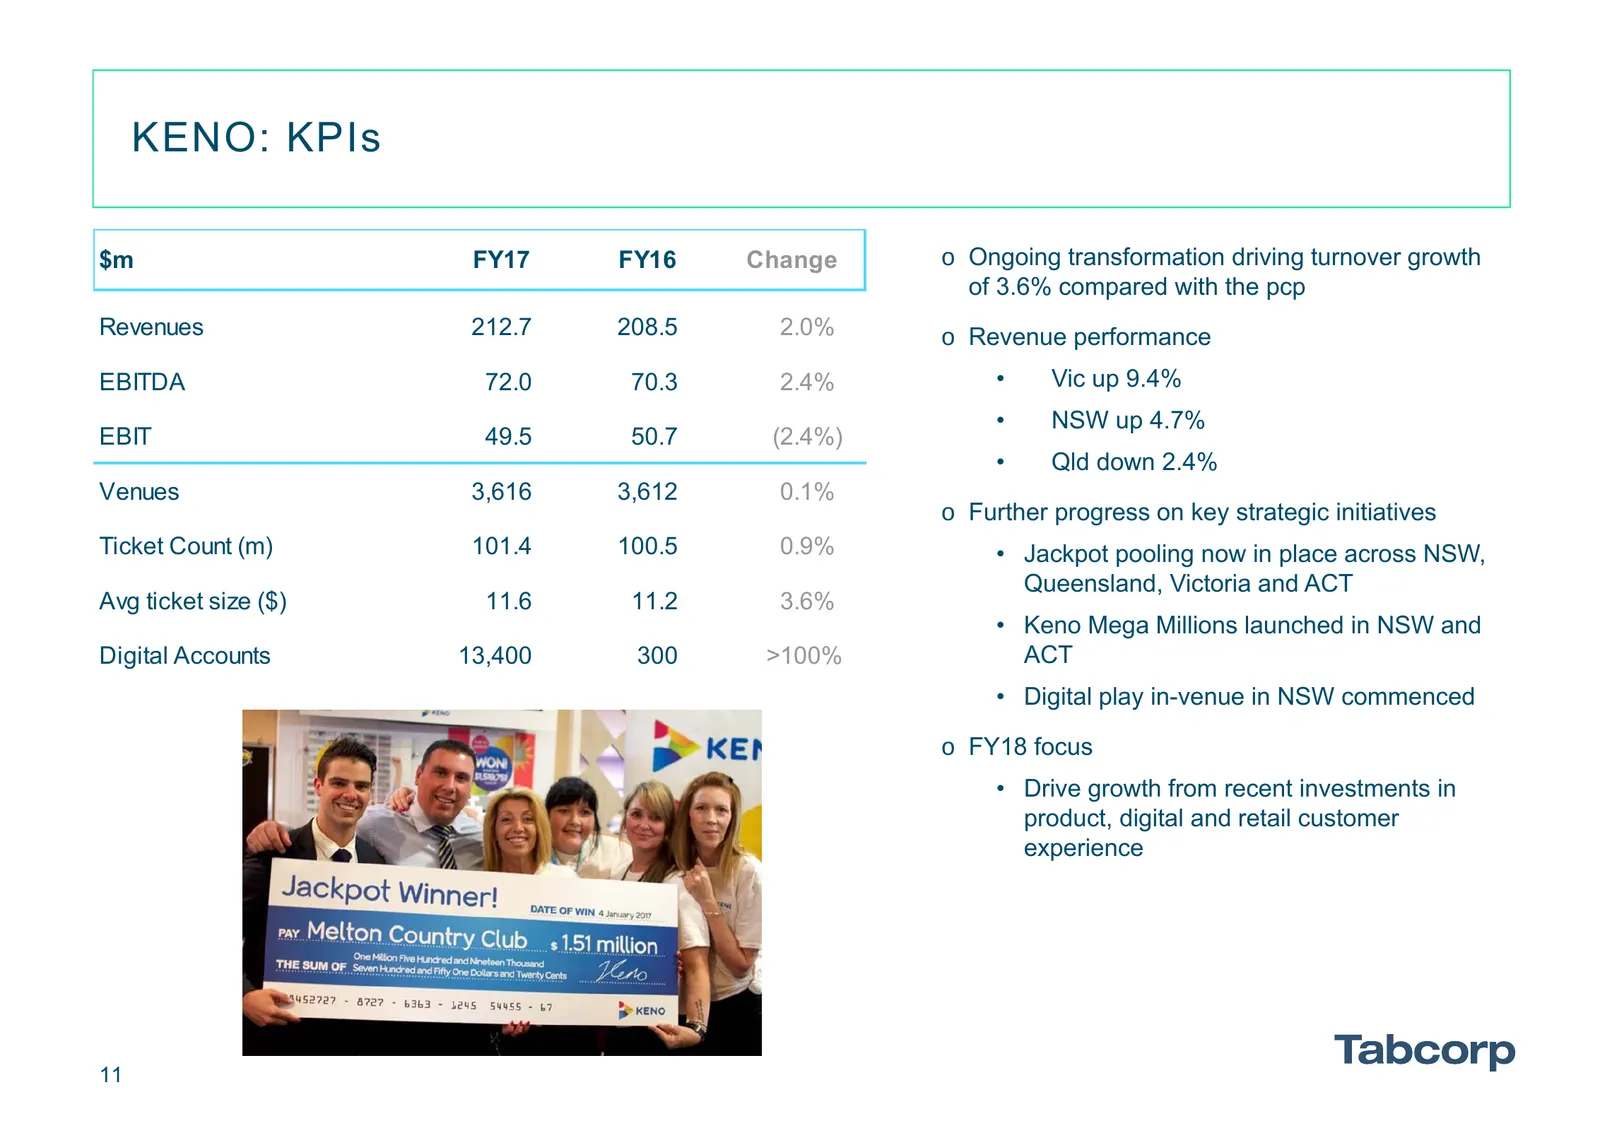
KENO: KPIs $m FY17 FY16 Change o Ongoing transformation driving turnover growth of 3.6% compared with the pcp Revenues 212.7 208.5 2.0% o Revenue performance EBITDA 72.0 70.3 2.4% • Vic up 9.4% • NSW up 4.7% EBIT 49.5 50.7 (2.4%) • Qld down 2.4% Venues 3,616 3,612 0.1% o Further progress on key stra
Slide 12: Operating Expenses and Capital Investment
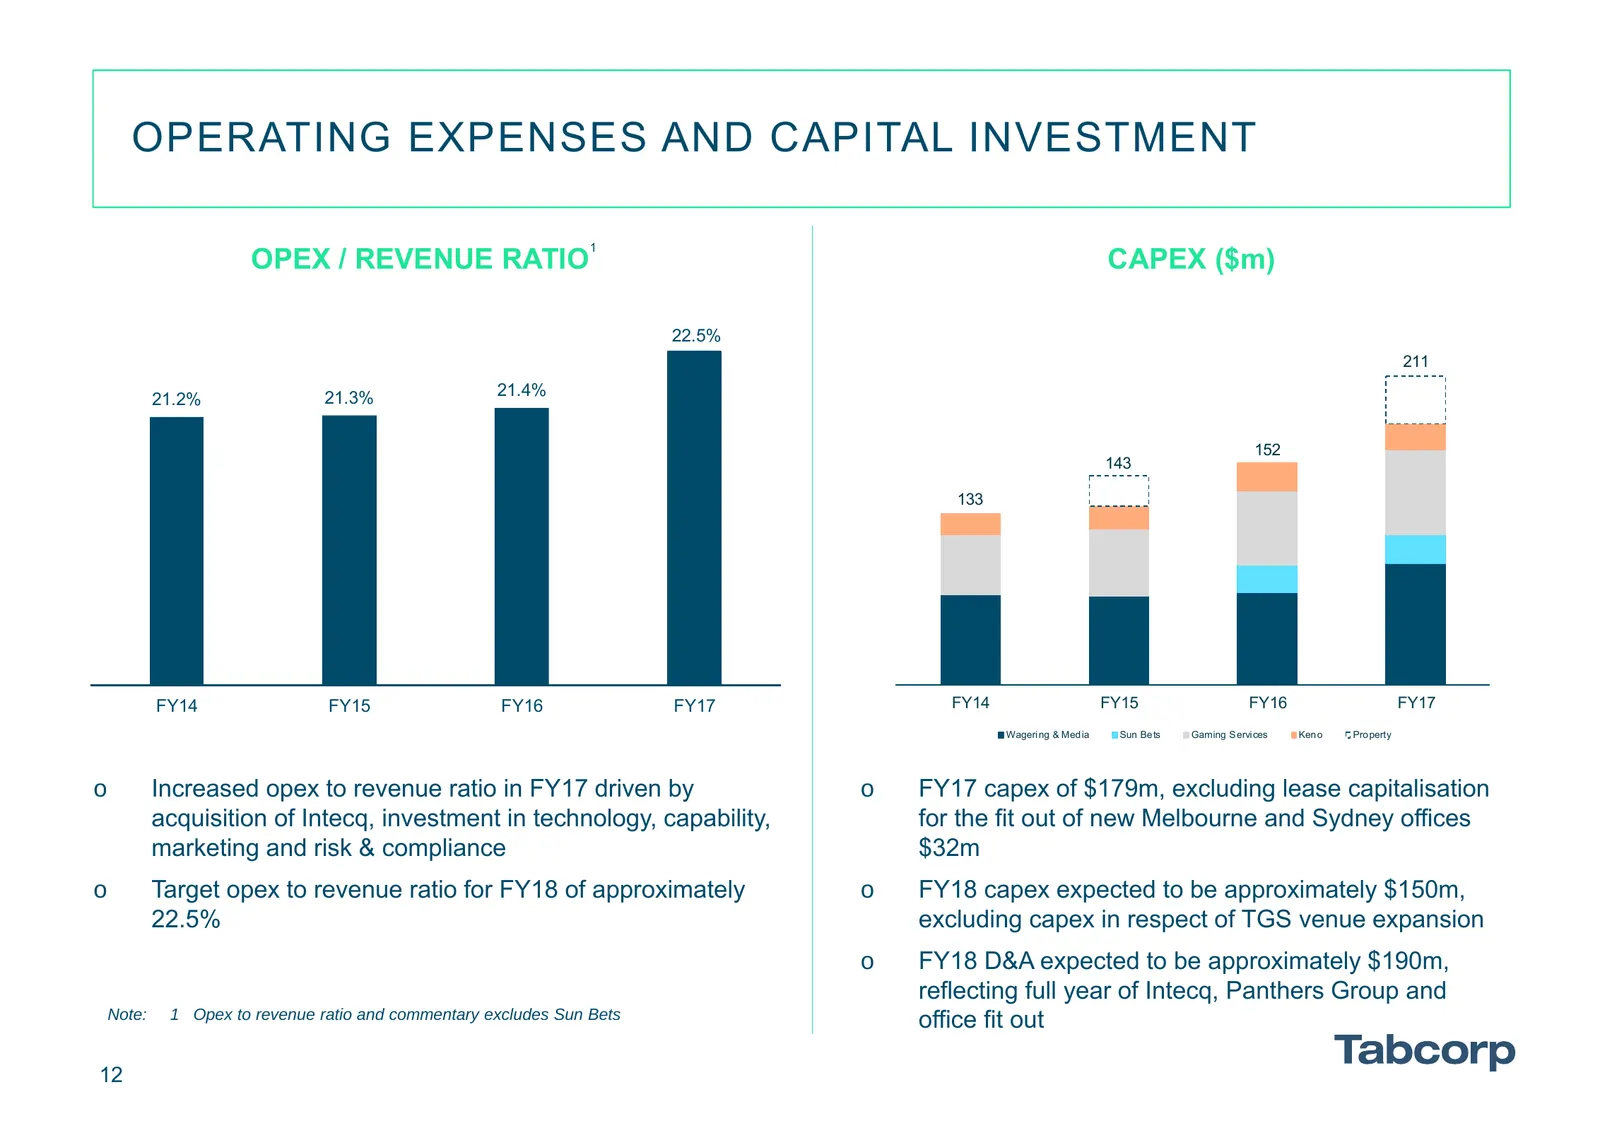
OPERATING EXPENSES AND CAPITAL INVESTMENT 1 OPEX / REVENUE RATIO CAPEX ($m) 22.5% 211 21.2% 21.3% 21.4% 152 143 133 FY14 FY15 FY16 FY17 FY14 FY15 FY16 FY17 Wageri ng & Med ia Sun Be ts Gaming S ervi ces Ken o Pro perty o Increased opex to revenue ratio in FY17 driven by o FY17 capex of $179m, exclud
Slide 13: Capital Management
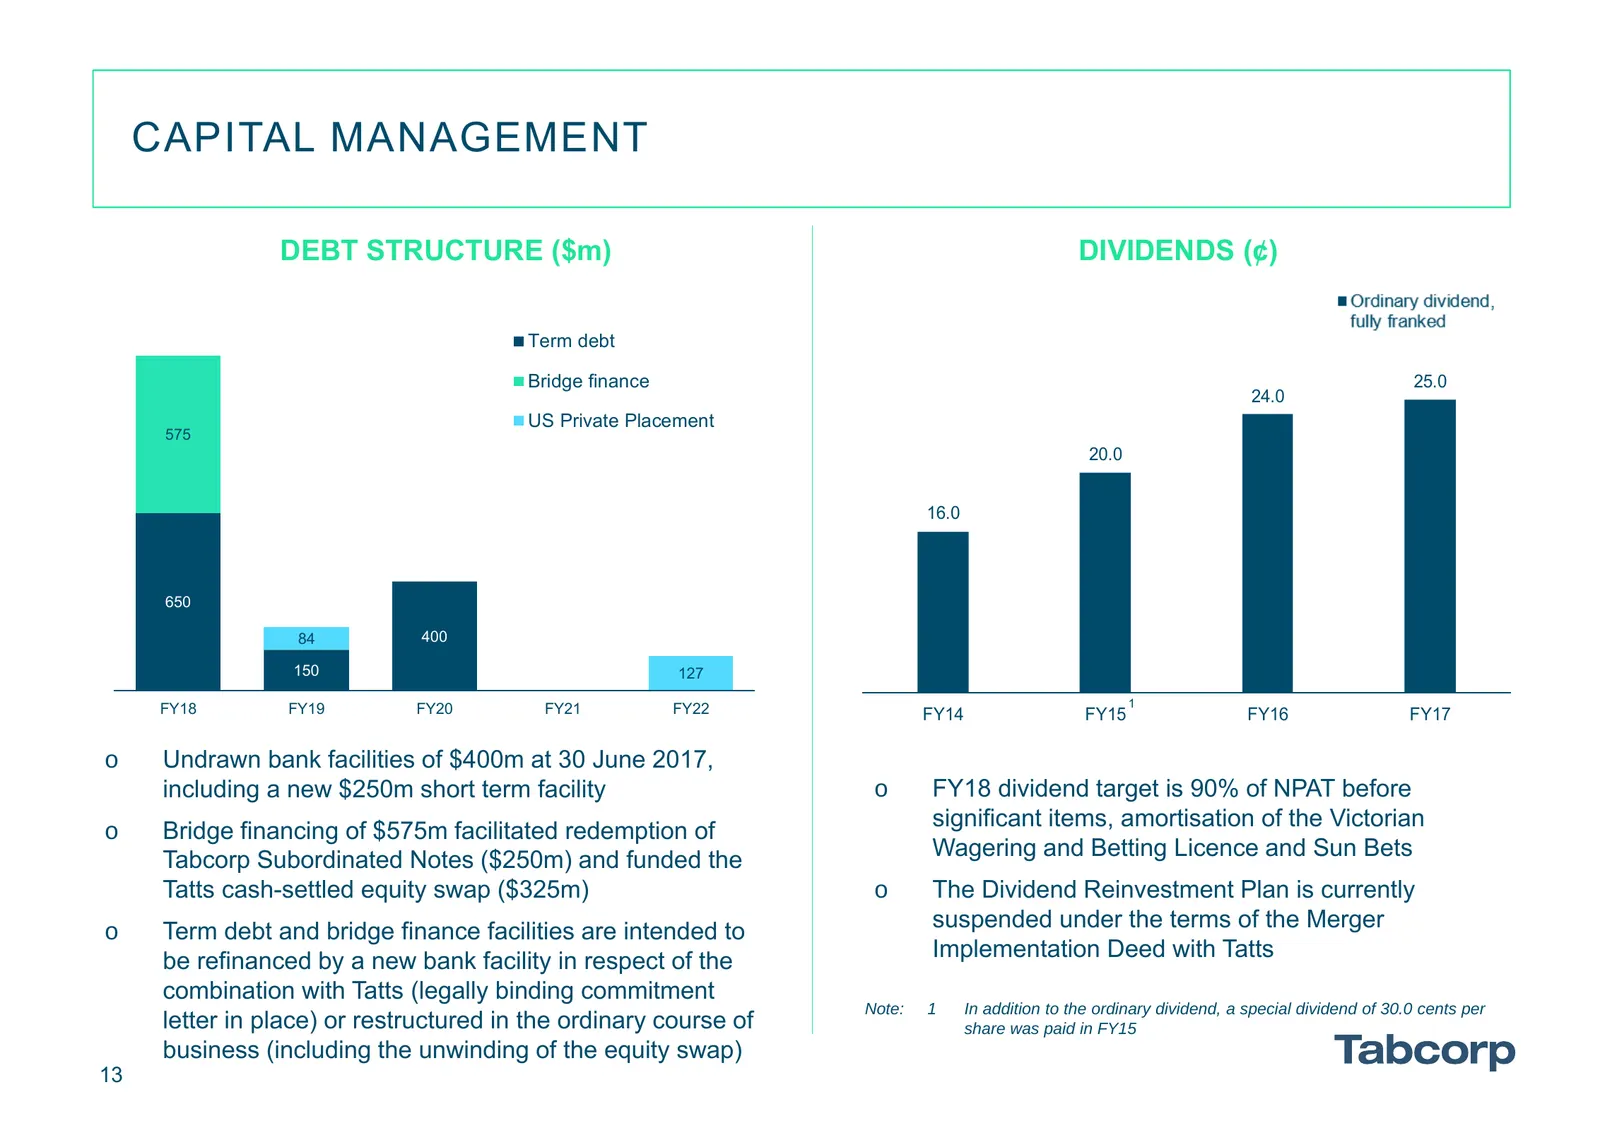
CAPITAL MANAGEMENT DEBT STRUCTURE ($m) DIVIDENDS (¢) Term debt Bridge finance 25.0 24.0 US Private Placement 575 20.0 16.0 650 84 400 150 127 FY18 FY19 FY20 FY21 FY22 1 FY14 FY15 FY16 FY17 o Undrawn bank facilities of $400m at 30 June 2017, including a new $250m short term facility o FY18 dividend t
Slide 14: Combination with Tatts
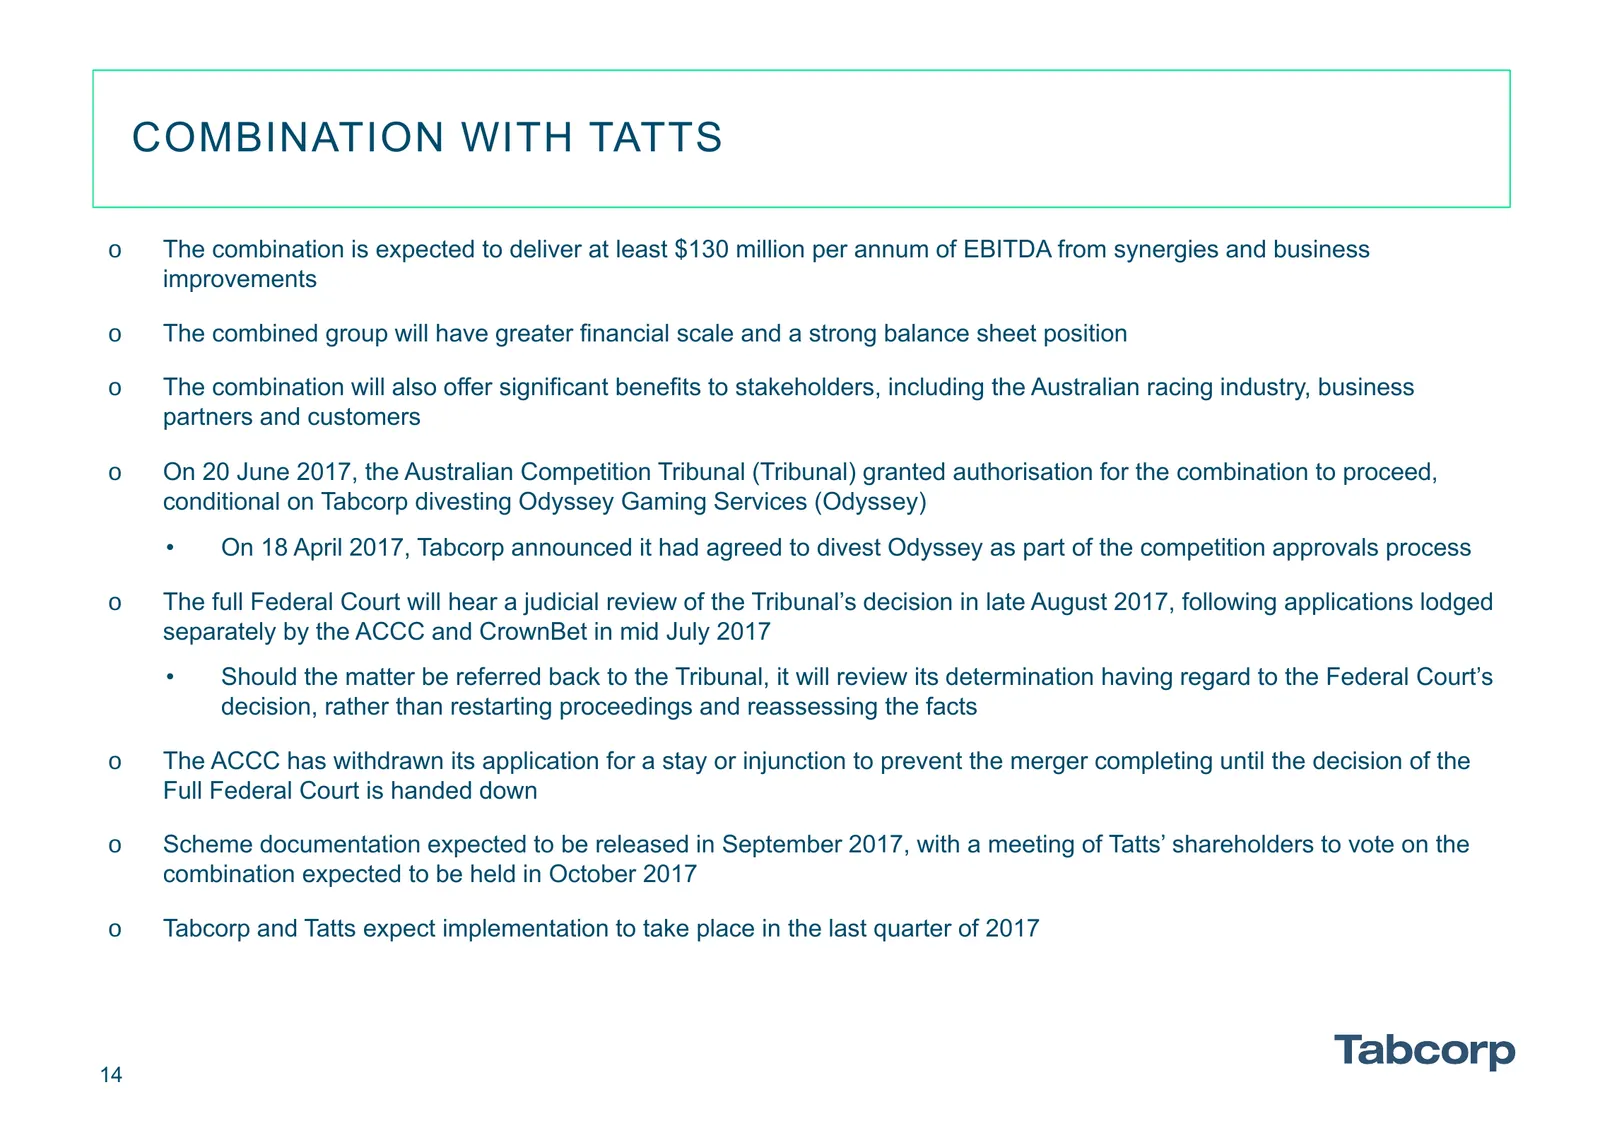
COMBINATION WITH TATTS o The combination is expected to deliver at least $130 million per annum of EBITDA from synergies and business improvements o The combined group will have greater financial scale and a strong balance sheet position o The combination will also offer significant benefits to stak
Slide 15: Conclusion
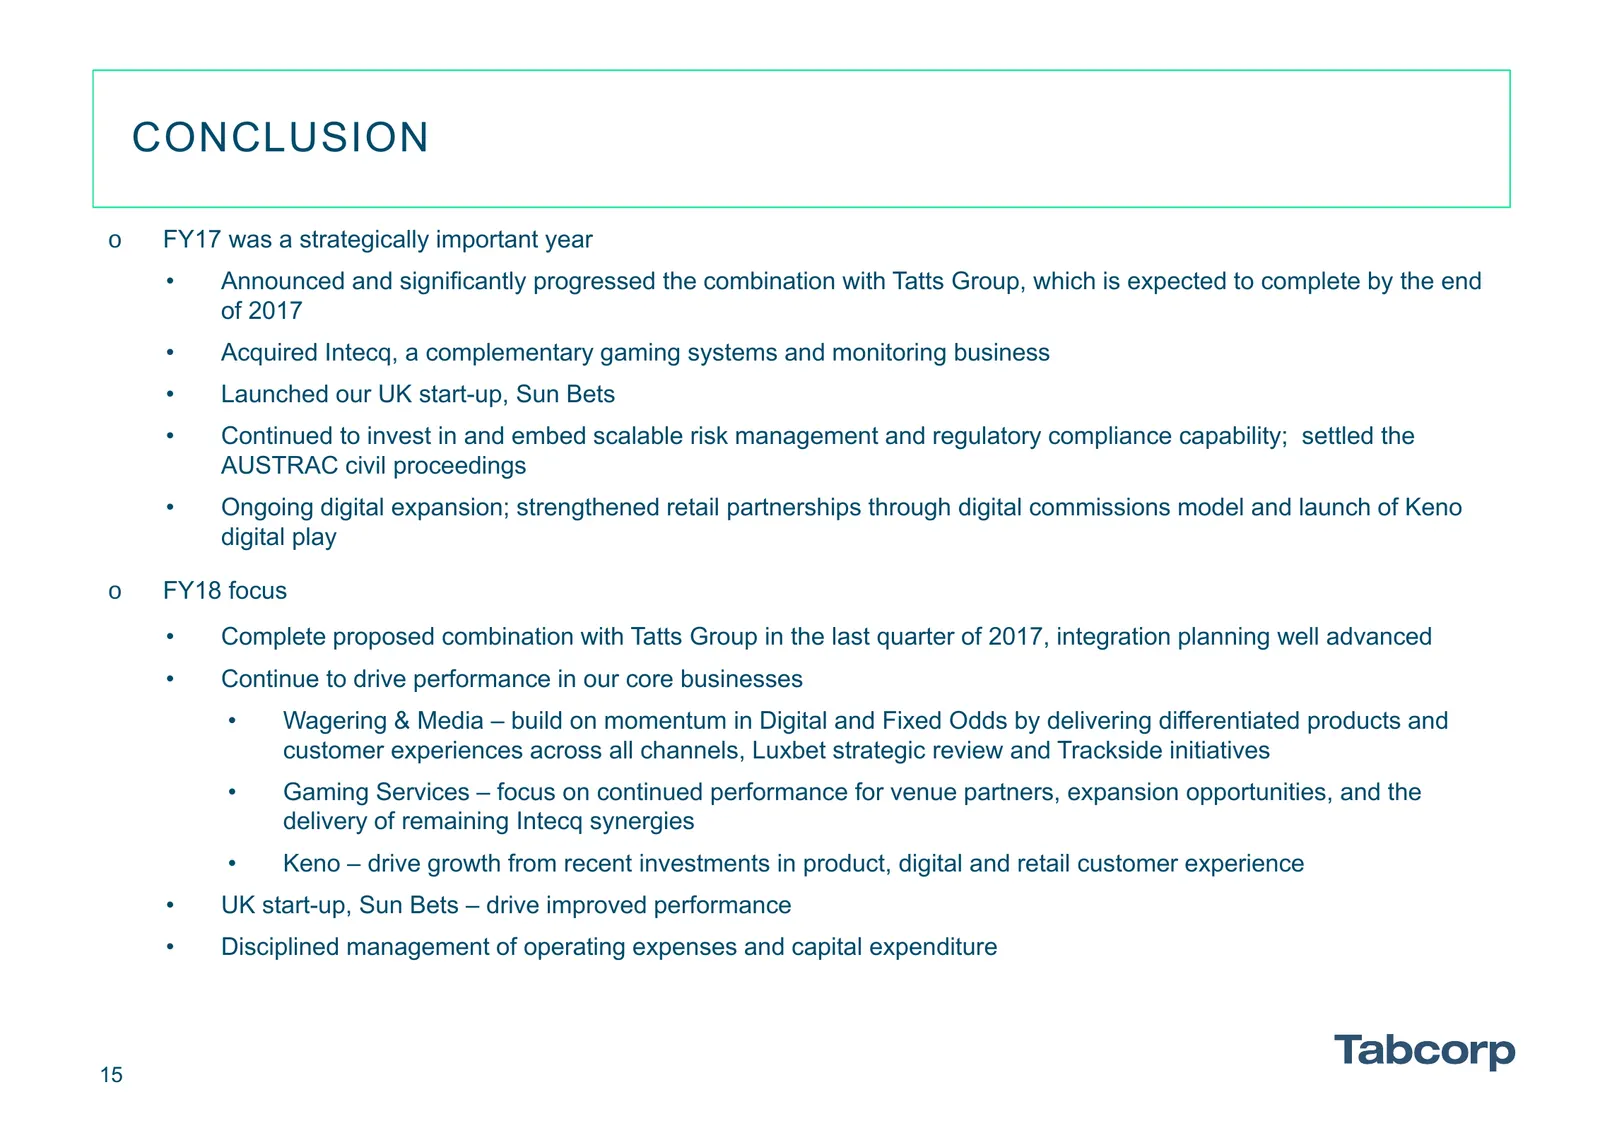
CONCLUSION o FY17 was a strategically important year • Announced and significantly progressed the combination with Tatts Group, which is expected to complete by the end of 2017 • Acquired Intecq, a complementary gaming systems and monitoring business • Launched our UK start-up, Sun Bets • Continued
Slide 16: Appendices
APPENDICES 16
Slide 17: Appendices
APPENDICES 1. Wagering & Media: Financial data 2. Wagering & Media: Revenues by state and product 3. Wagering & Media: TAB Fixed Odds turnover and yields 4. Balance sheet 5. Cashflow 17
Slide 18: 1. Wagering & Media: Financial Data
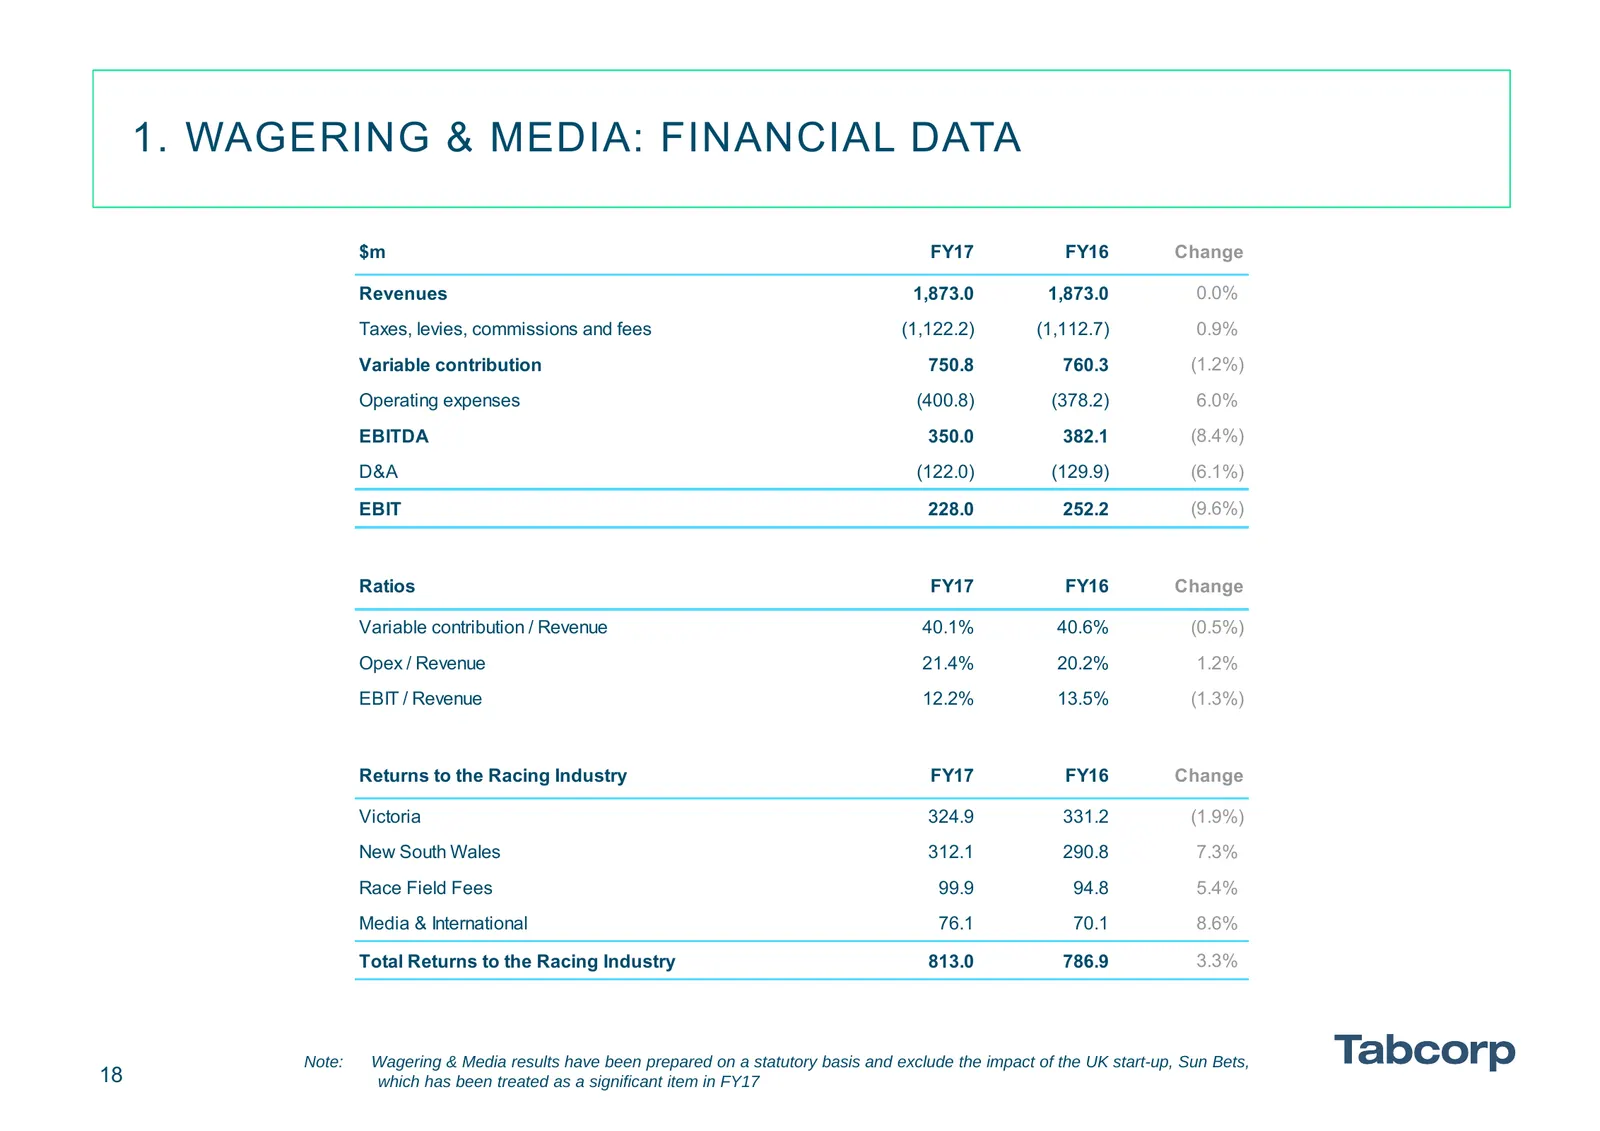
1. WAGERING & MEDIA: FINANCIAL DATA $m FY17 FY16 Change Revenues 1,873.0 1,873.0 0.0% Taxes, levies, commissions and fees (1,122.2) (1,112.7) 0.9% Variable contribution 750.8 760.3 (1.2%) Operating expenses (400.8) (378.2) 6.0% EBITDA 350.0 382.1 (8.4%) D&A (122.0) (129.9) (6.1%) EBIT 228.0 252.2 (9
Slide 19: 2. Wagering & Media: Revenues by State and Product
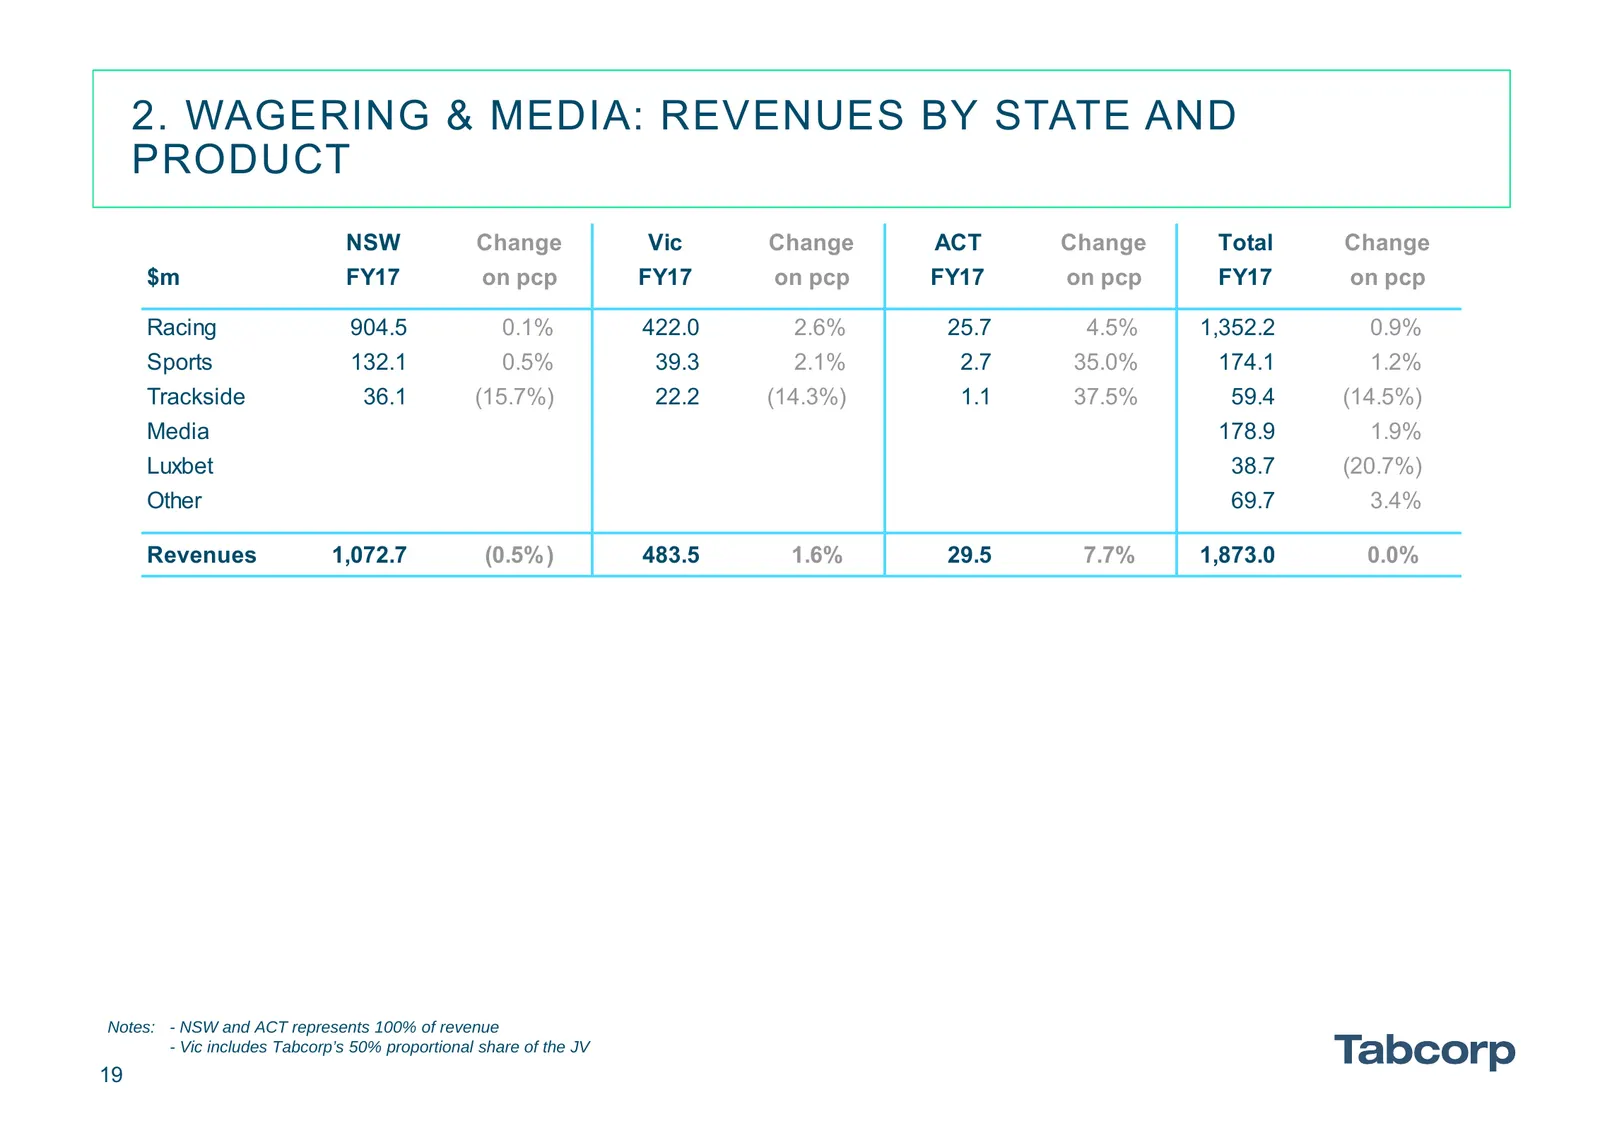
2. WAGERING & MEDIA: REVENUES BY STATE AND PRODUCT NSW Change Vic Change ACT Change Total Change $m FY17 on pcp FY17 on pcp FY17 on pcp FY17 on pcp Racing 904.5 0.1% 422.0 2.6% 25.7 4.5% 1,352.2 0.9% Sports 132.1 0.5% 39.3 2.1% 2.7 35.0% 174.1 1.2% Trackside 36.1 (15.7%) 22.2 (14.3%) 1.1 37.5% 59.4
Slide 20: 3. Wagering & Media: TAB Fixed Odds T/O and Yields
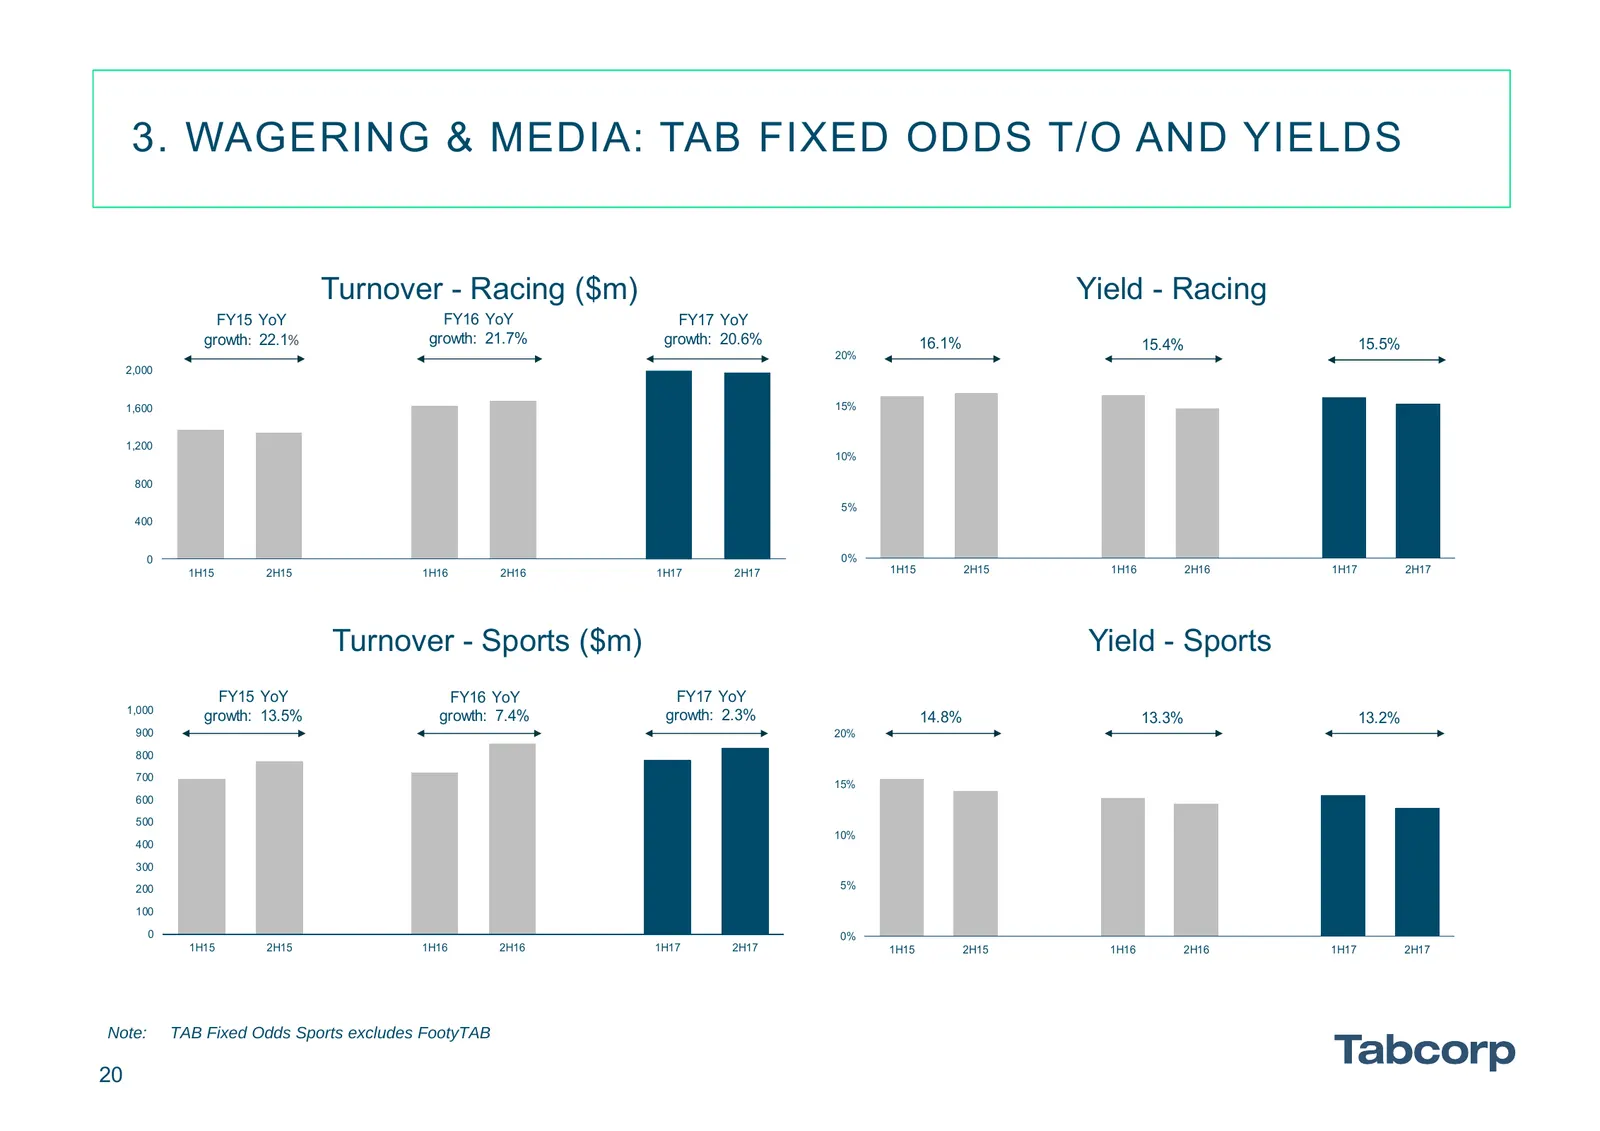
3. WAGERING & MEDIA: TAB FIXED ODDS T/O AND YIELDS Turnover - Racing ($m) Yield - Racing FY15 YoY FY16 YoY FY17 YoY growth: 22.1% growth: 21.7% growth: 20.6% 16.1% 15.4% 15.5% 20% 2,000 1,600 15% 1,200 10% 800 5% 400 0 0% 1H15 2H15 1H16 2H16 1H17 2H17 1H15 2H15 1H16 2H16 1H17 2H17 Turnover - Sports
Slide 21: 4. Balance Sheet
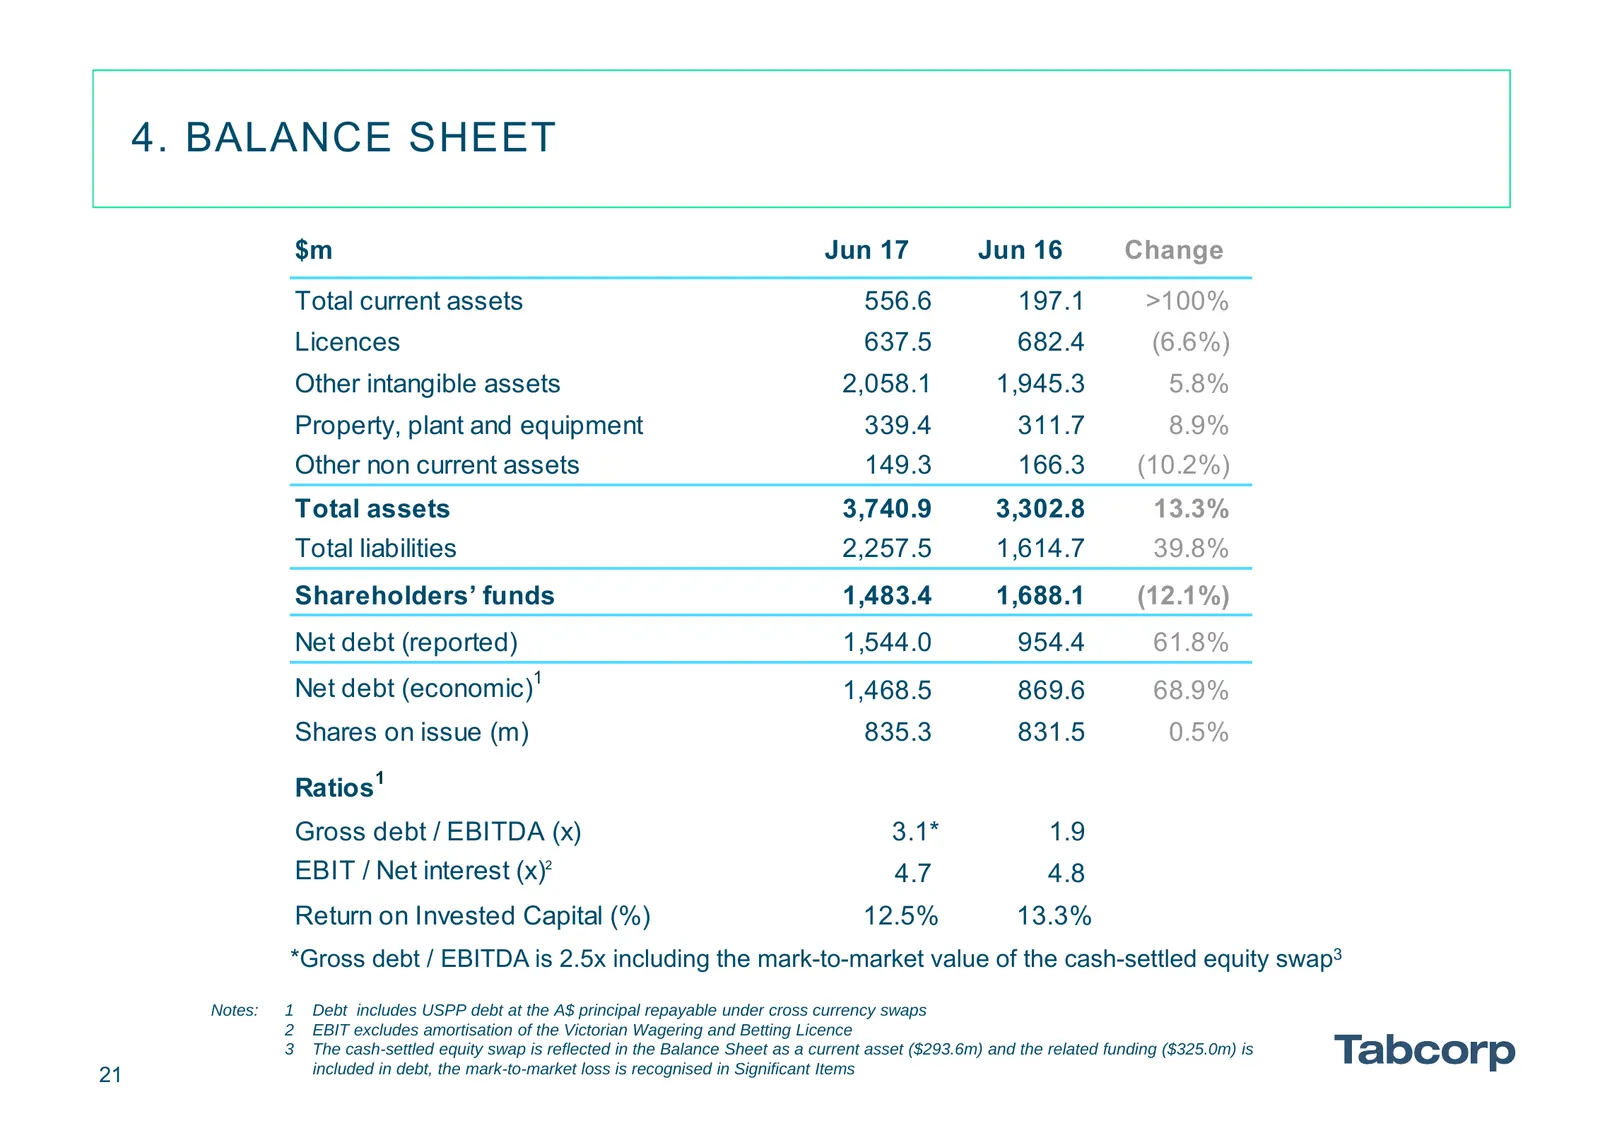
4. BALANCE SHEET $m Jun 17 Jun 16 Change Total current assets 556.6 197.1 >100% Licences 637.5 682.4 (6.6%) Other intangible assets 2,058.1 1,945.3 5.8% Property, plant and equipment 339.4 311.7 8.9% Other non current assets 149.3 166.3 (10.2%) Total assets 3,740.9 3,302.8 13.3% Total liabilities 2,
Slide 22: 5. Cashflow
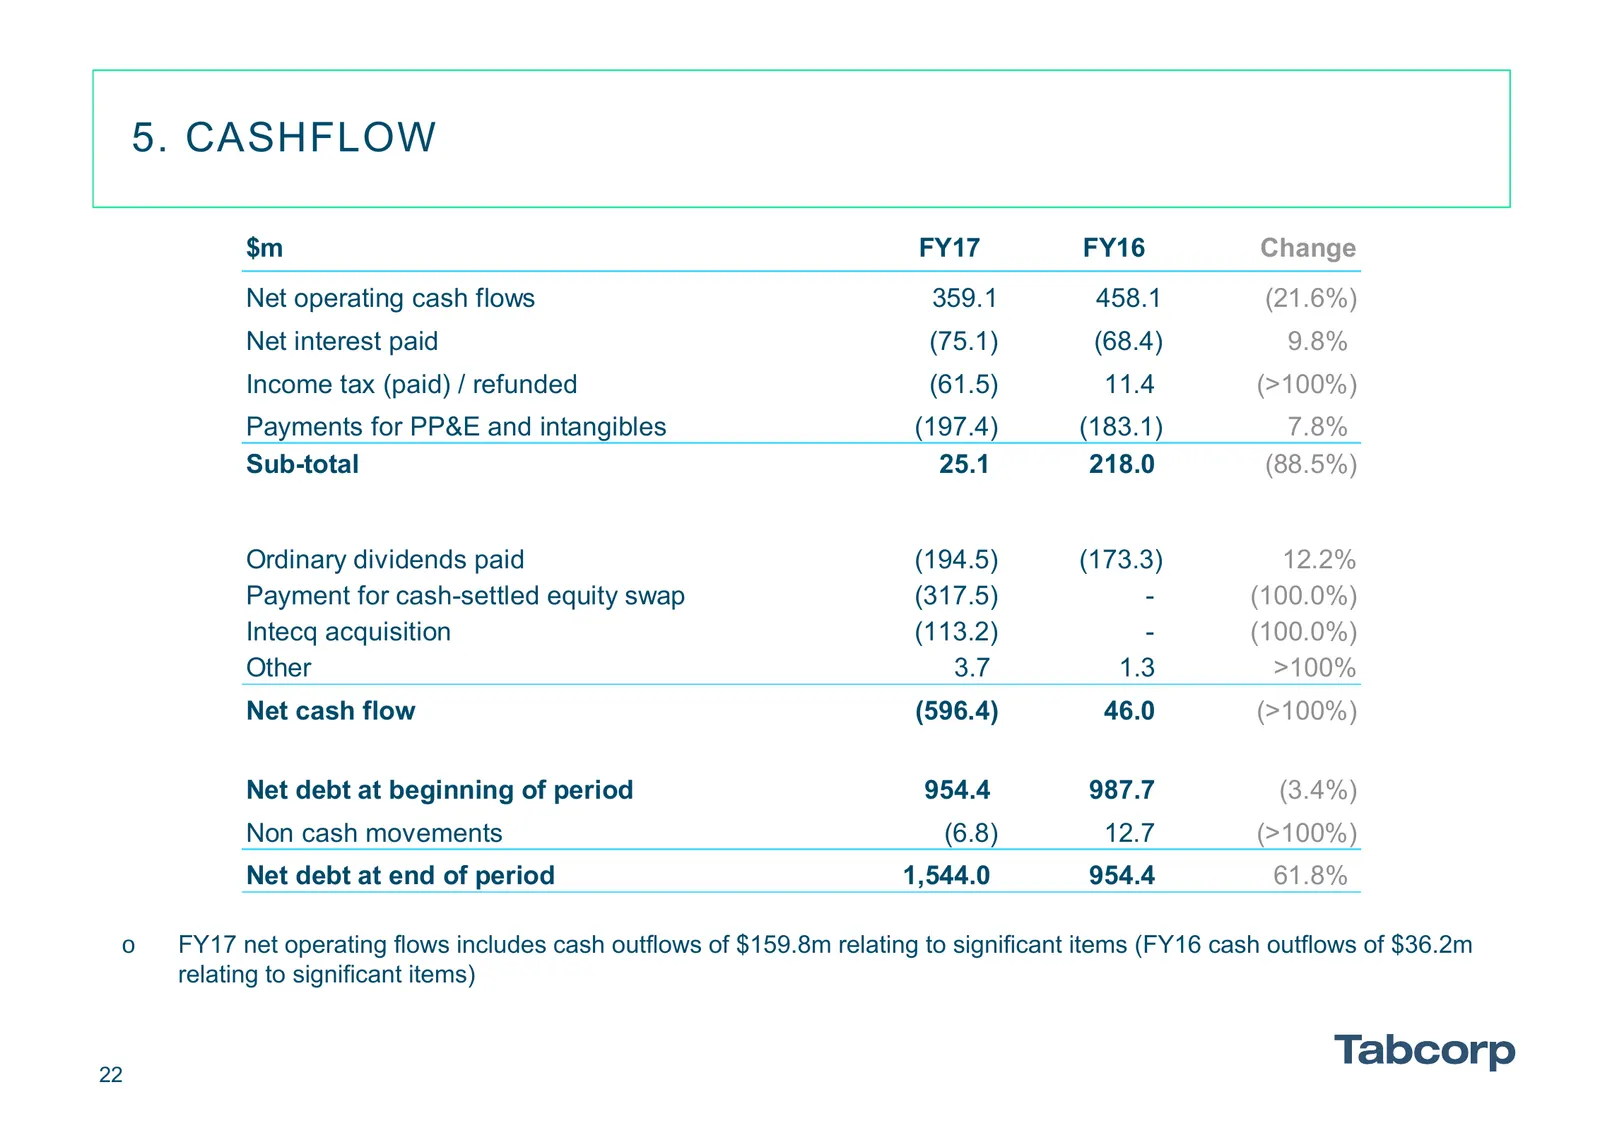
5. CASHFLOW $m FY17 FY16 Change Net operating cash flows 359.1 458.1 (21.6%) Net interest paid (75.1) (68.4) 9.8% Income tax (paid) / refunded (61.5) 11.4 (>100%) Payments for PP&E and intangibles (197.4) (183.1) 7.8% Sub-total 25.1 218.0 (88.5%) Ordinary dividends paid (194.5) (173.3) 12.2% Payment
Slide 23: Disclaimer
DISCLAIMER This Presentation contains summary information about the current activities of Tabcorp Holdings Limited (Tabcorp) and its subsidiaries (Tabcorp Group). It should be read in conjunction with the Tabcorp Group’s other periodic and continuous disclosure announcements lodged with the Australi
Slide 24: To Advance the Way We Play
TO ADVANCE THE WAY WE PLAY Tabcorp | 2 KENO | wr | TAB | Lu bet | TESG | INTEC:
Source: Internet Archive copy of tabcorp.com.au
More decks from Tabcorp Holdings Limited
 FY2026 Earnings Presentation40 slides · Aug 26, 2026
 FY2026 Earnings Presentation39 slides · Aug 25, 2026
 Investor Presentation (August 2026)16 slides · Aug 10, 2026
 Macquarie Australia Conference 202614 slides · May 5, 2026
 1H26 Earnings Presentation39 slides · Feb 25, 2026
 Shareholder Meeting (October 2025)17 slides · Oct 20, 2025