Old Mutual Ltd. · JSE:OMU
Old Mutual — FY2017 Earnings Presentation
36 slides from Old Mutual's earnings presentation, Mar 15, 2018

Slide 1: 2017 Results Presentation
2017 RESULTS PRESENTATION 15 March 2018 INVESTMENT | SAVINGS | INSURANCE | BANKING
Slide 2: Disclaimer
DISCLAIMER These materials do not constitute or form a part of, and should not be construed as, any offer or solicitation or advertisement to purchase and/or subscribe for Securities in South Africa, including an offer to the public for the sale of, or subscription for, or the solicitation or advert
Slide 3: Presentation Agenda
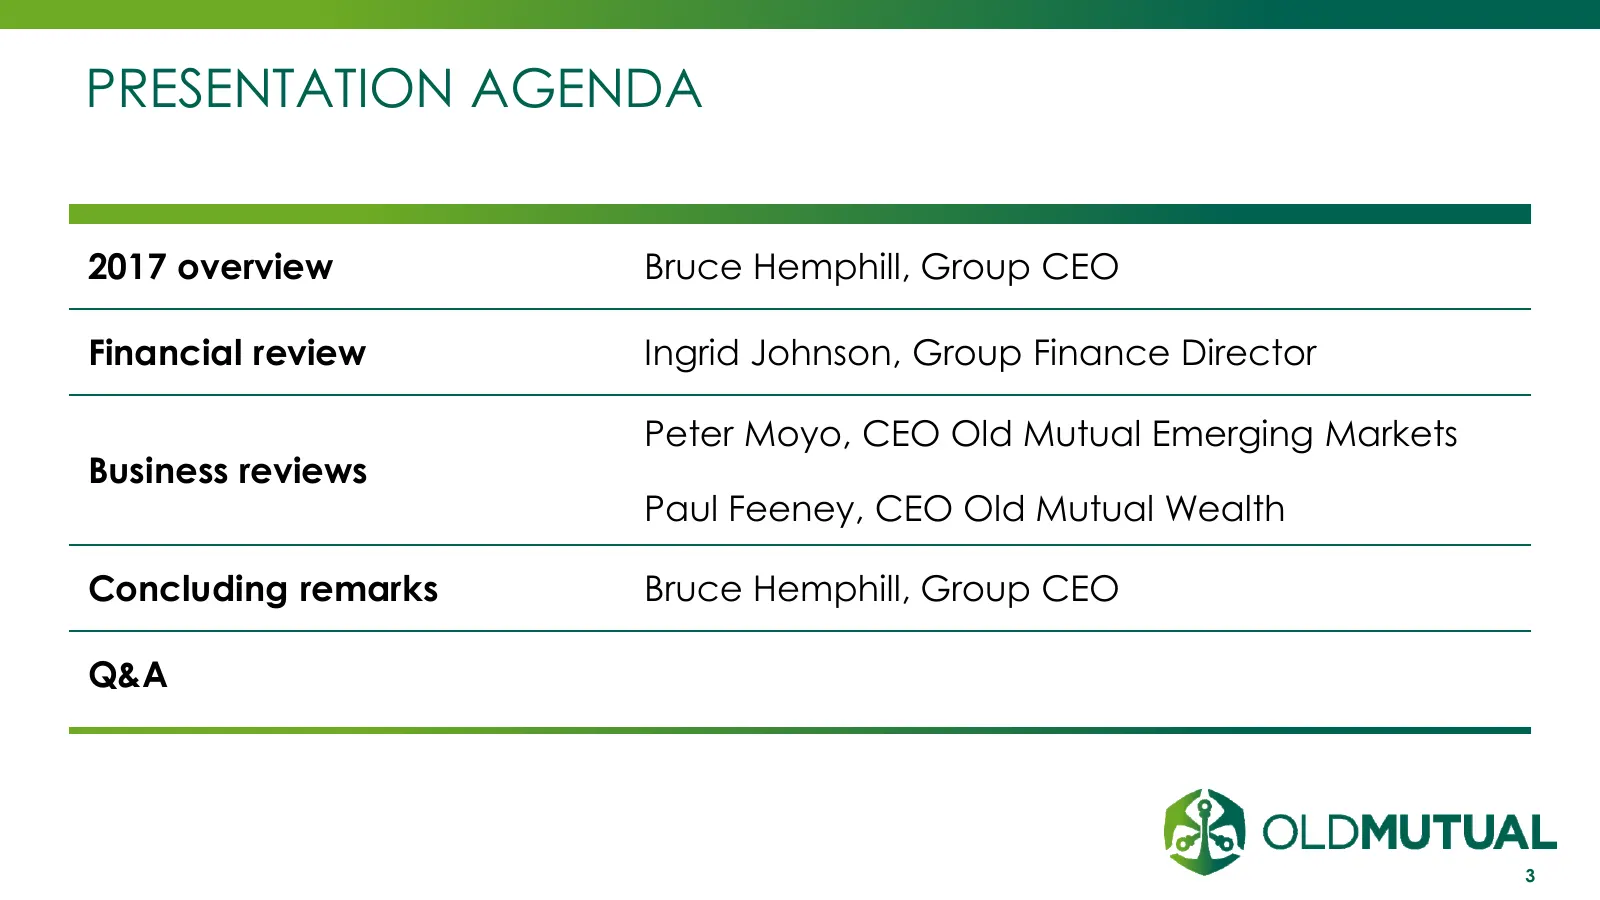
PRESENTATION AGENDA 2017 overview Bruce Hemphill, Group CEO Financial review Ingrid Johnson, Group Finance Director Peter Moyo, CEO Old Mutual Emerging Markets Business reviews Paul Feeney, CEO Old Mutual Wealth Concluding remarks Bruce Hemphill, Group CEO Q&A 3
Slide 4: Delivering on our promises
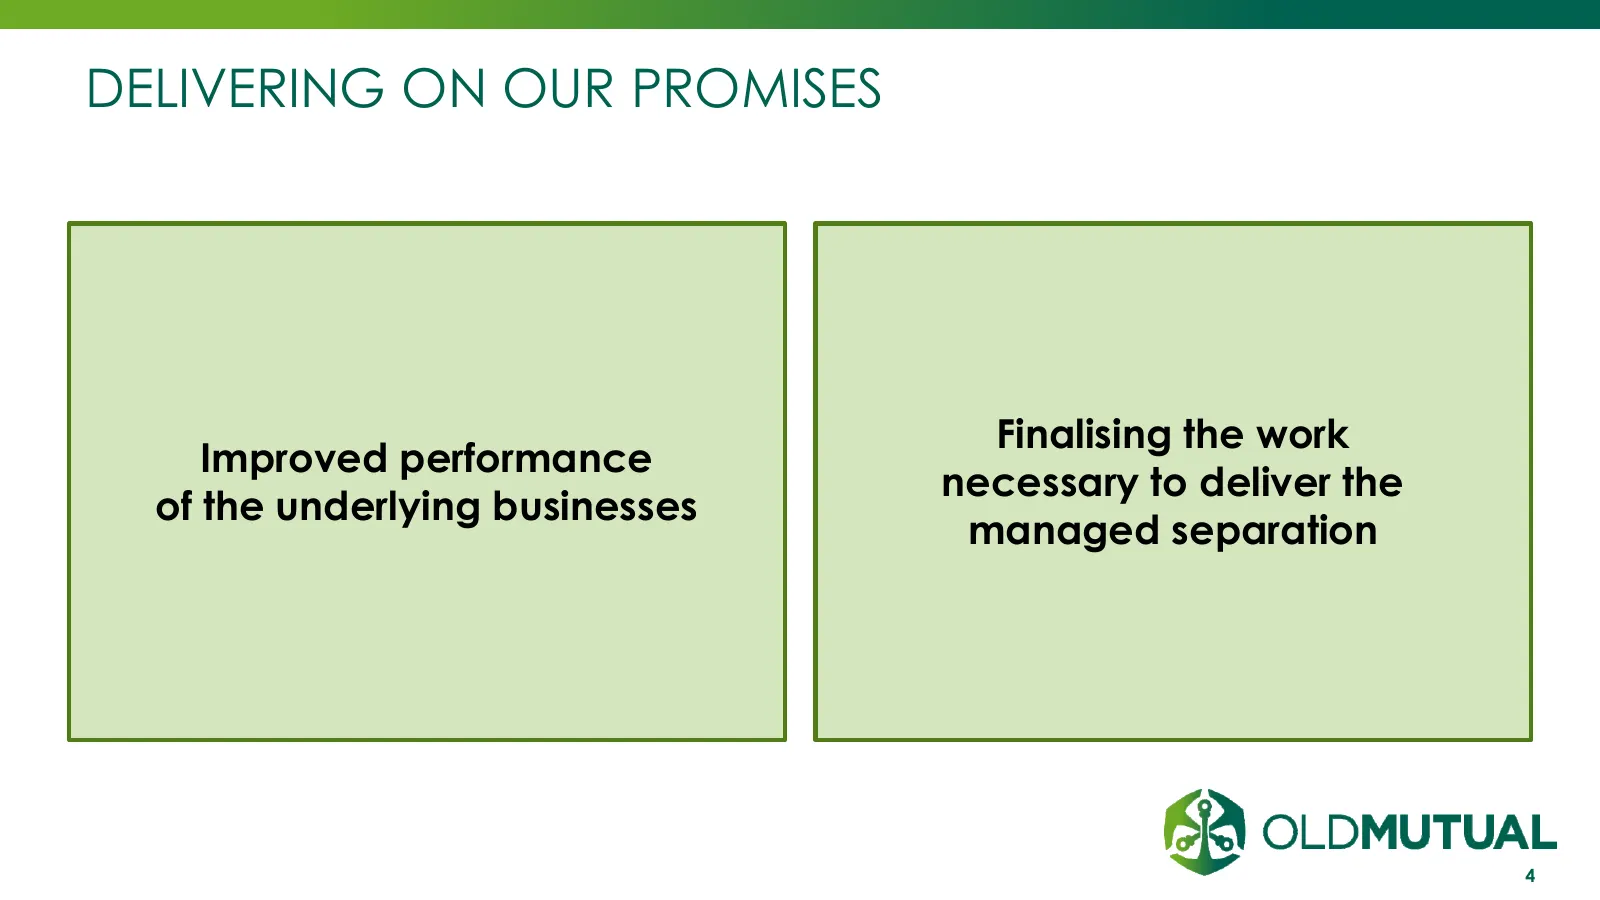
DELIVERING ON OUR PROMISES Finalising the work Improved performance necessary to deliver the of the underlying businesses managed separation 4
Slide 5: Financial performance ahead of expectations
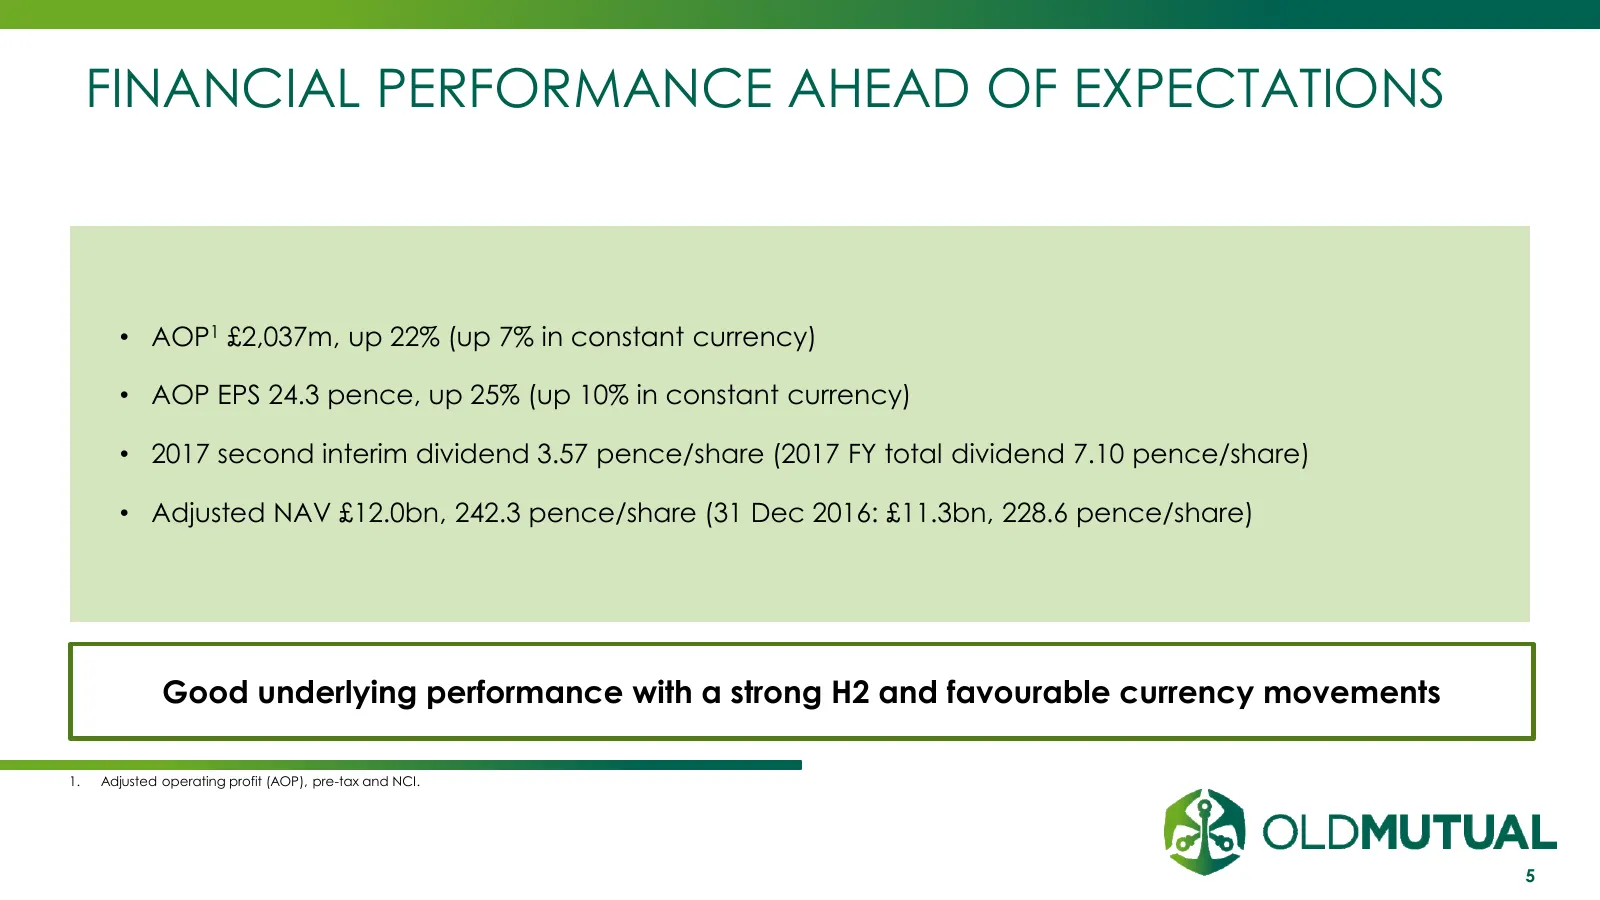
FINANCIAL PERFORMANCE AHEAD OF EXPECTATIONS • AOP1 £2,037m, up 22% (up 7% in constant currency) • AOP EPS 24.3 pence, up 25% (up 10% in constant currency) • 2017 second interim dividend 3.57 pence/share (2017 FY total dividend 7.10 pence/share) • Adjusted NAV £12.0bn, 242.3 pence/share (31 Dec 2016:
Slide 6: Resilient performance by strong businesses
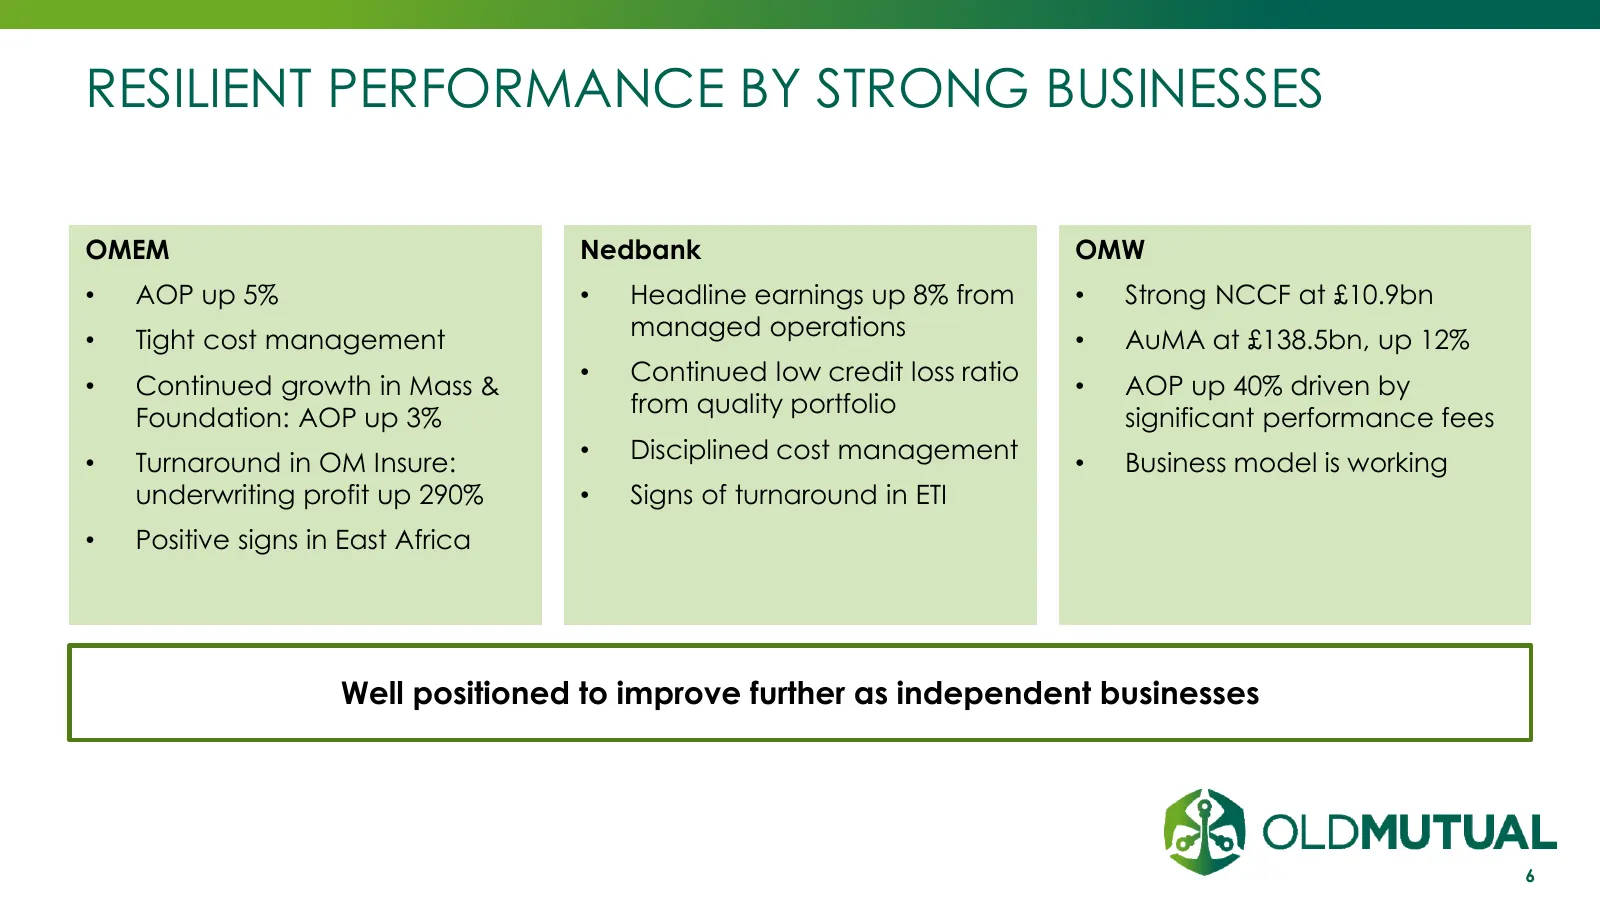
RESILIENT PERFORMANCE BY STRONG BUSINESSES OMEM Nedbank OMW • AOP up 5% • Headline earnings up 8% from • Strong NCCF at £10.9bn managed operations • Tight cost management • AuMA at £138.5bn, up 12% • Continued low credit loss ratio • Continued growth in Mass & • AOP up 40% driven by from quality por
Slide 7: Well advanced with preparations for delivery of the managed separation
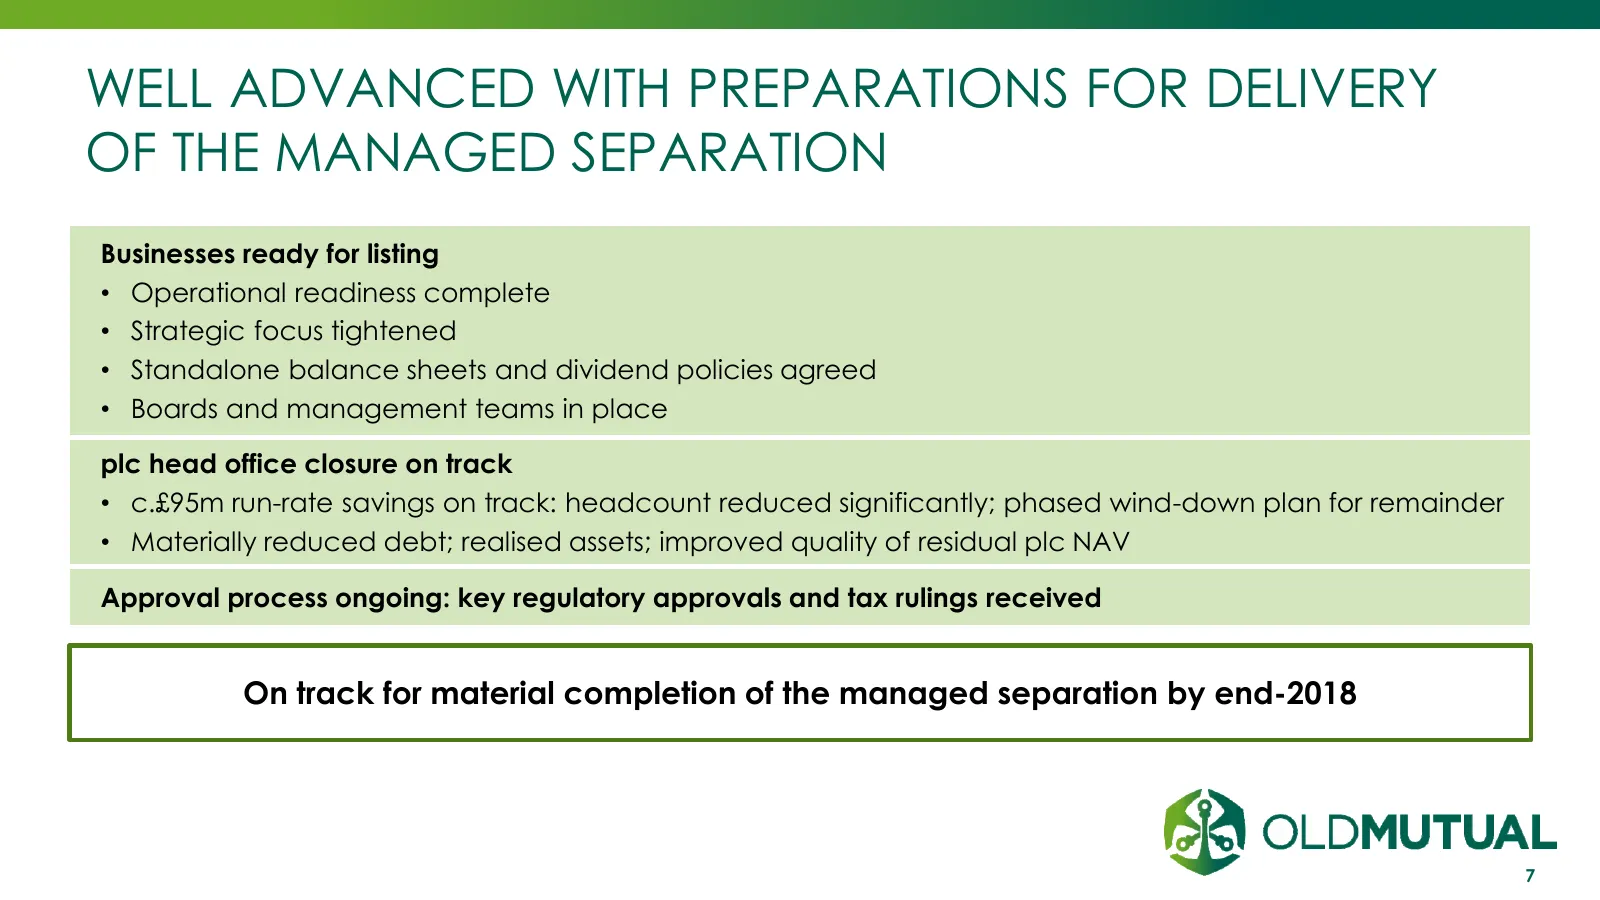
WELL ADVANCED WITH PREPARATIONS FOR DELIVERY OF THE MANAGED SEPARATION Businesses ready for listing • Operational readiness complete • Strategic focus tightened • Standalone balance sheets and dividend policies agreed • Boards and management teams in place plc head office closure on track • c.£95m r
Slide 8: Expected steps to completion
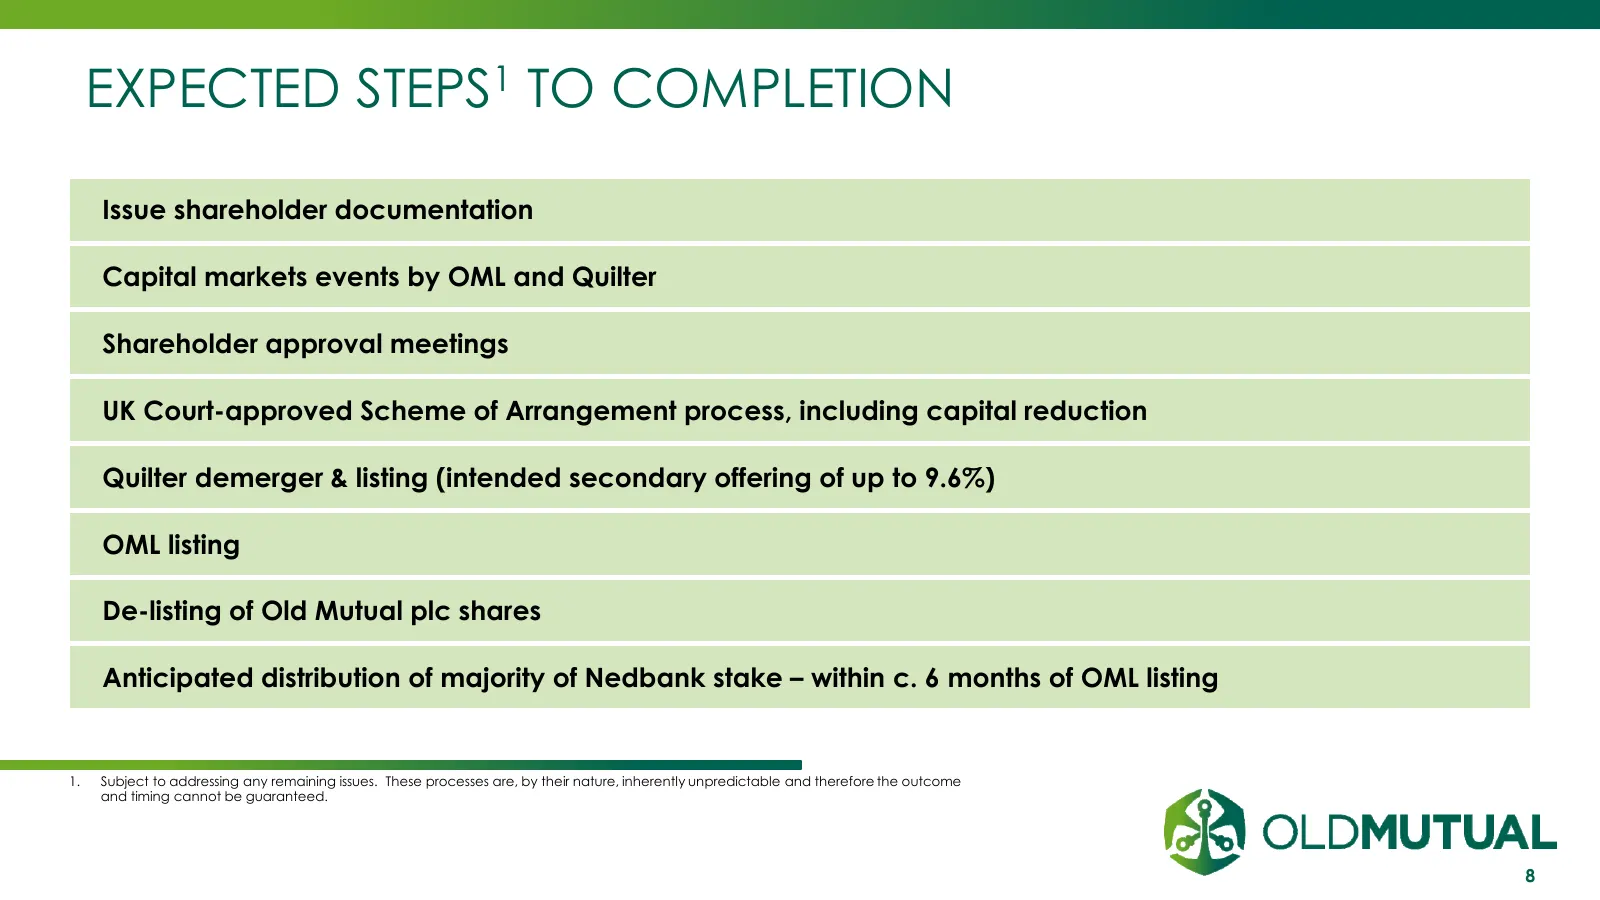
EXPECTED STEPS1 TO COMPLETION Issue shareholder documentation Capital markets events by OML and Quilter Shareholder approval meetings UK Court-approved Scheme of Arrangement process, including capital reduction Quilter demerger & listing (intended secondary offering of up to 9.6%) OML listing De-lis
Slide 9: Financial Review
FINANCIAL REVIEW Ingrid Johnson 15 March 2018 INVESTMENT | SAVINGS | INSURANCE | BANKING
Slide 10: Growth in operating profit
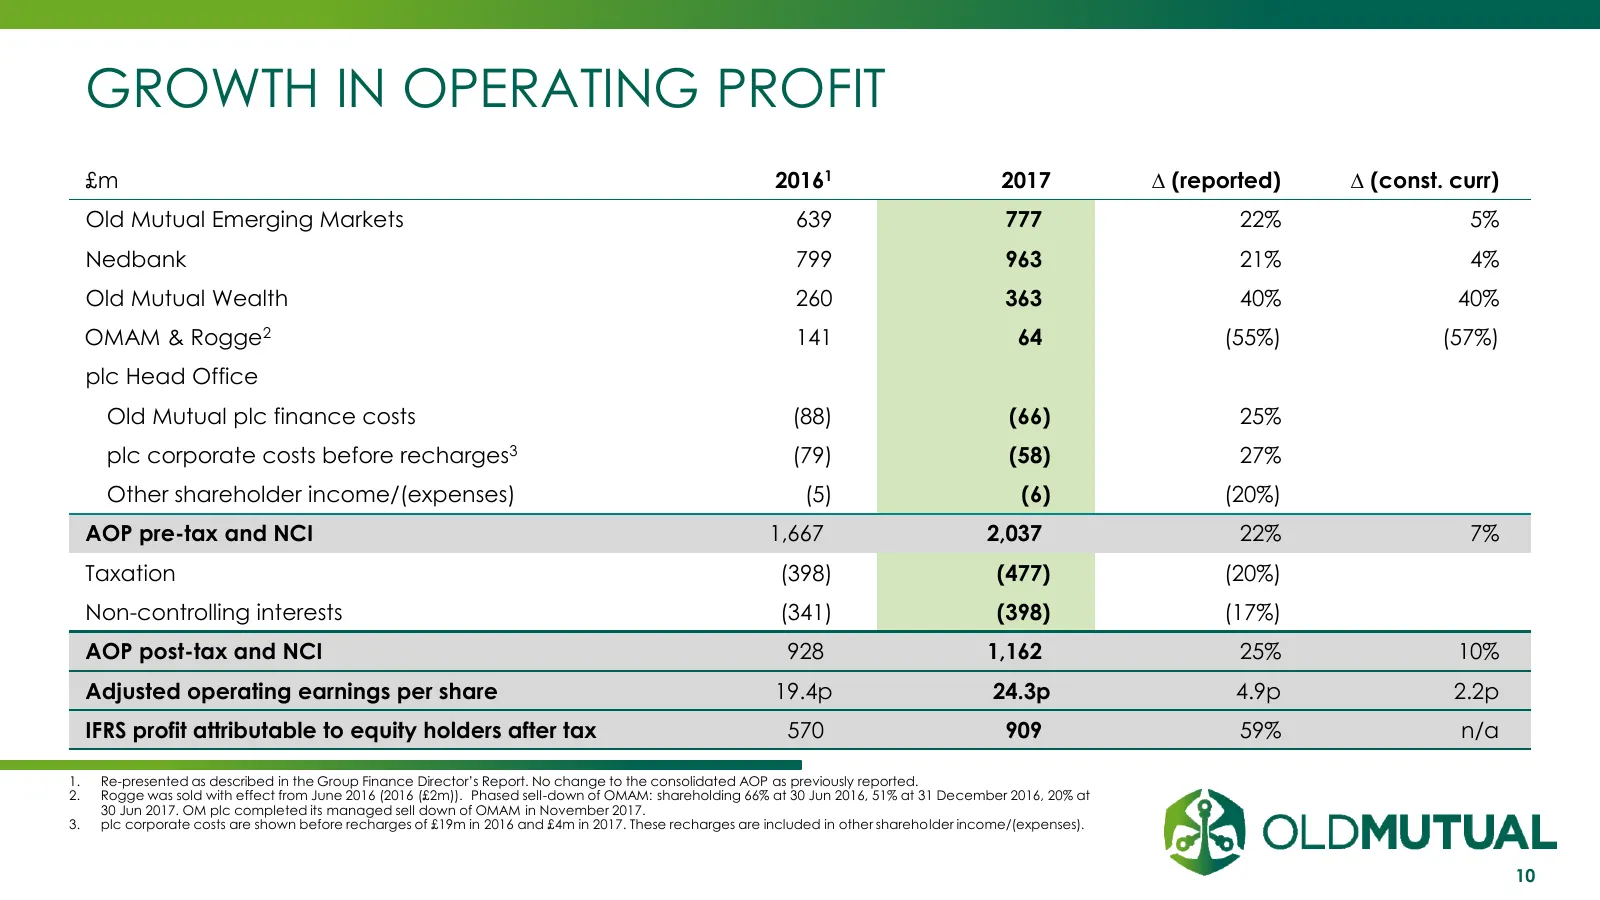
GROWTH IN OPERATING PROFIT £m 20161 2017 ∆ (reported) ∆ (const. curr) Old Mutual Emerging Markets 639 777) 22% 5% Nedbank 799 963) 21% 4% Old Mutual Wealth 260 363) 40% 40% OMAM & Rogge2 141 64) (55%) (57%) plc Head Office Old Mutual plc finance costs (88) (66) 25% plc corporate costs before recharg
Slide 11: Sources & uses of plc cash
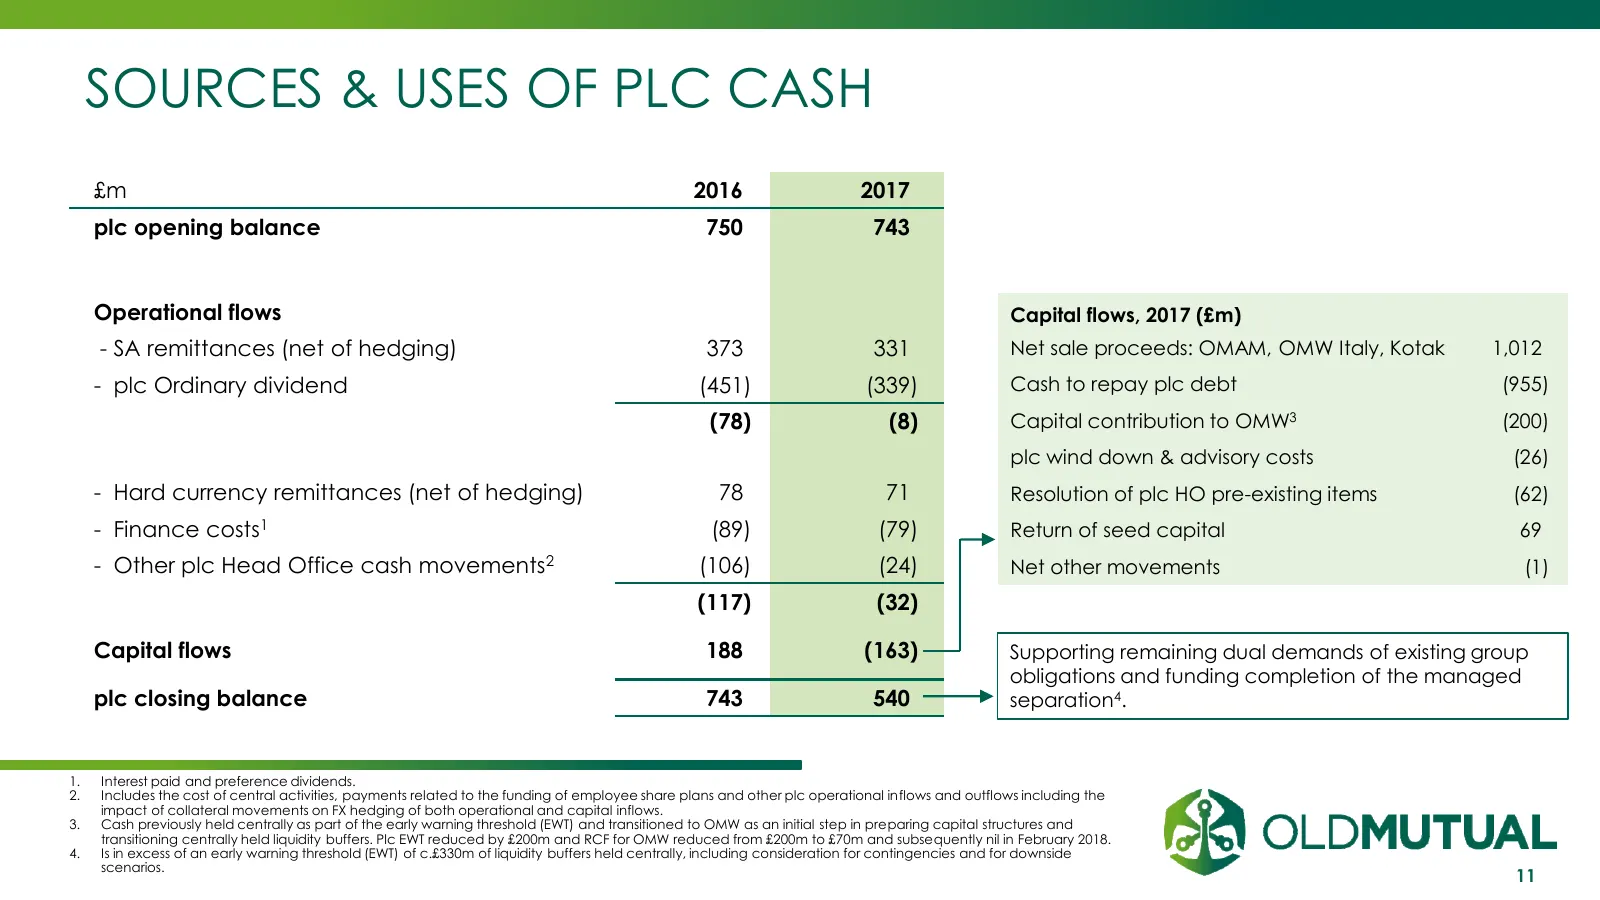
SOURCES & USES OF PLC CASH £m 2016) 2017) plc opening balance 750) 743) Operational flows Capital flows, 2017 (£m) - SA remittances (net of hedging) 373) 331) Net sale proceeds: OMAM, OMW Italy, Kotak 1,012) - plc Ordinary dividend (451) (339) Cash to repay plc debt (955) (78) (8) Capital contributi
Slide 12: Development of residual plc NAV
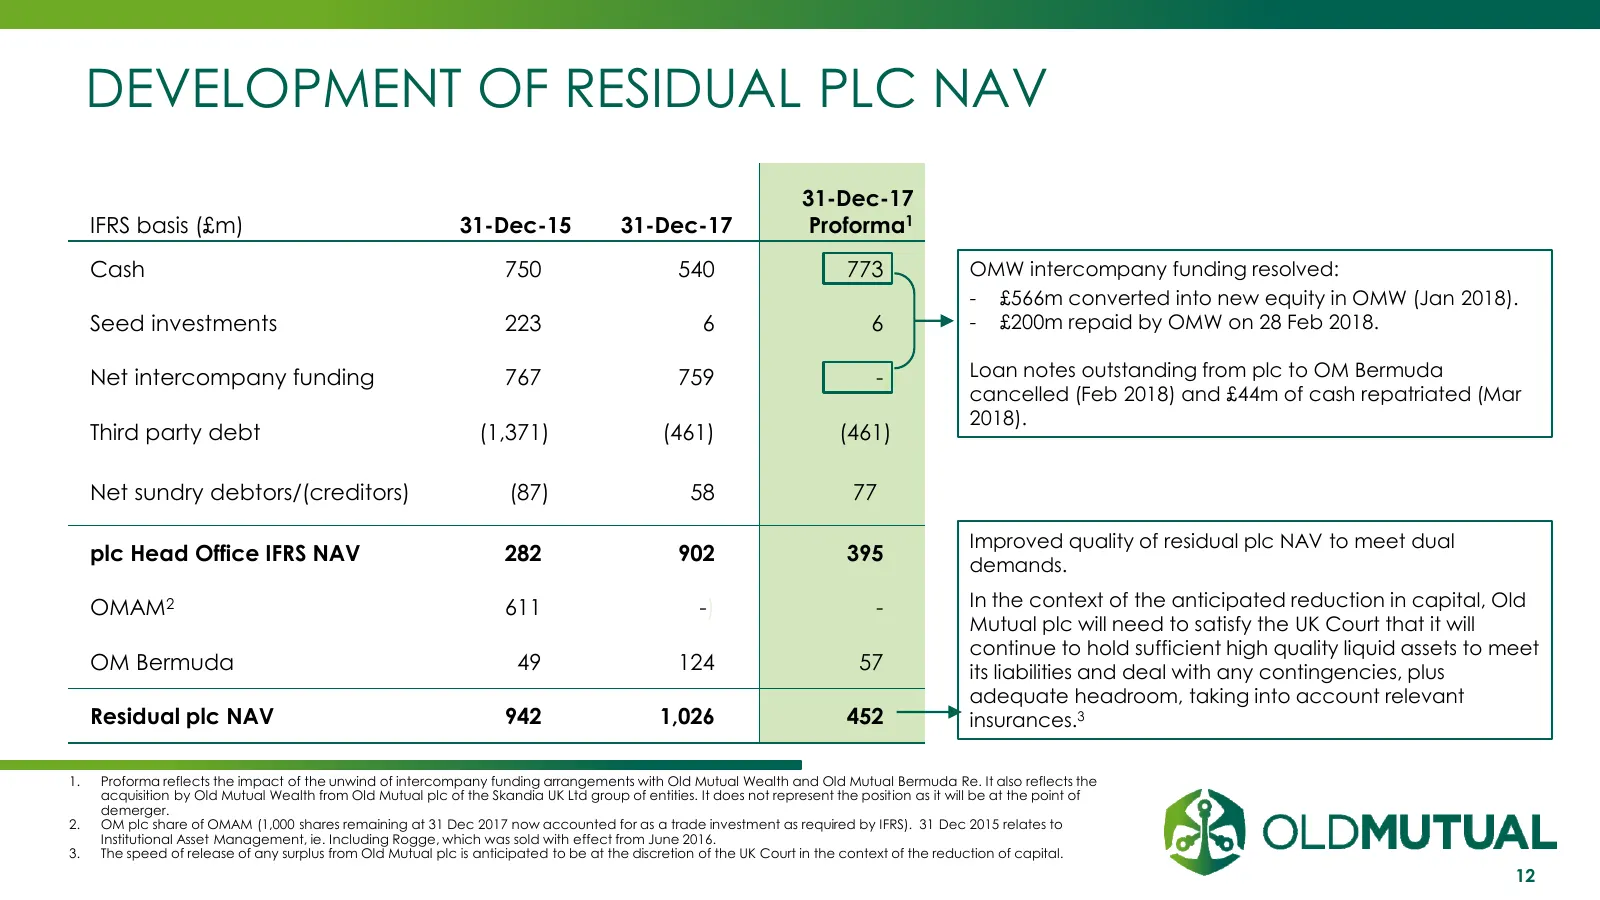
DEVELOPMENT OF RESIDUAL PLC NAV 31-Dec-17 IFRS basis (£m) 31-Dec-15 31-Dec-17 Proforma1 Cash 750) 540 773) OMW intercompany funding resolved: - £566m converted into new equity in OMW (Jan 2018). Seed investments 223) 6 6) - £200m repaid by OMW on 28 Feb 2018. Net intercompany funding 767) 759 -) Loa
Slide 13: Addressing cash demands of group structure
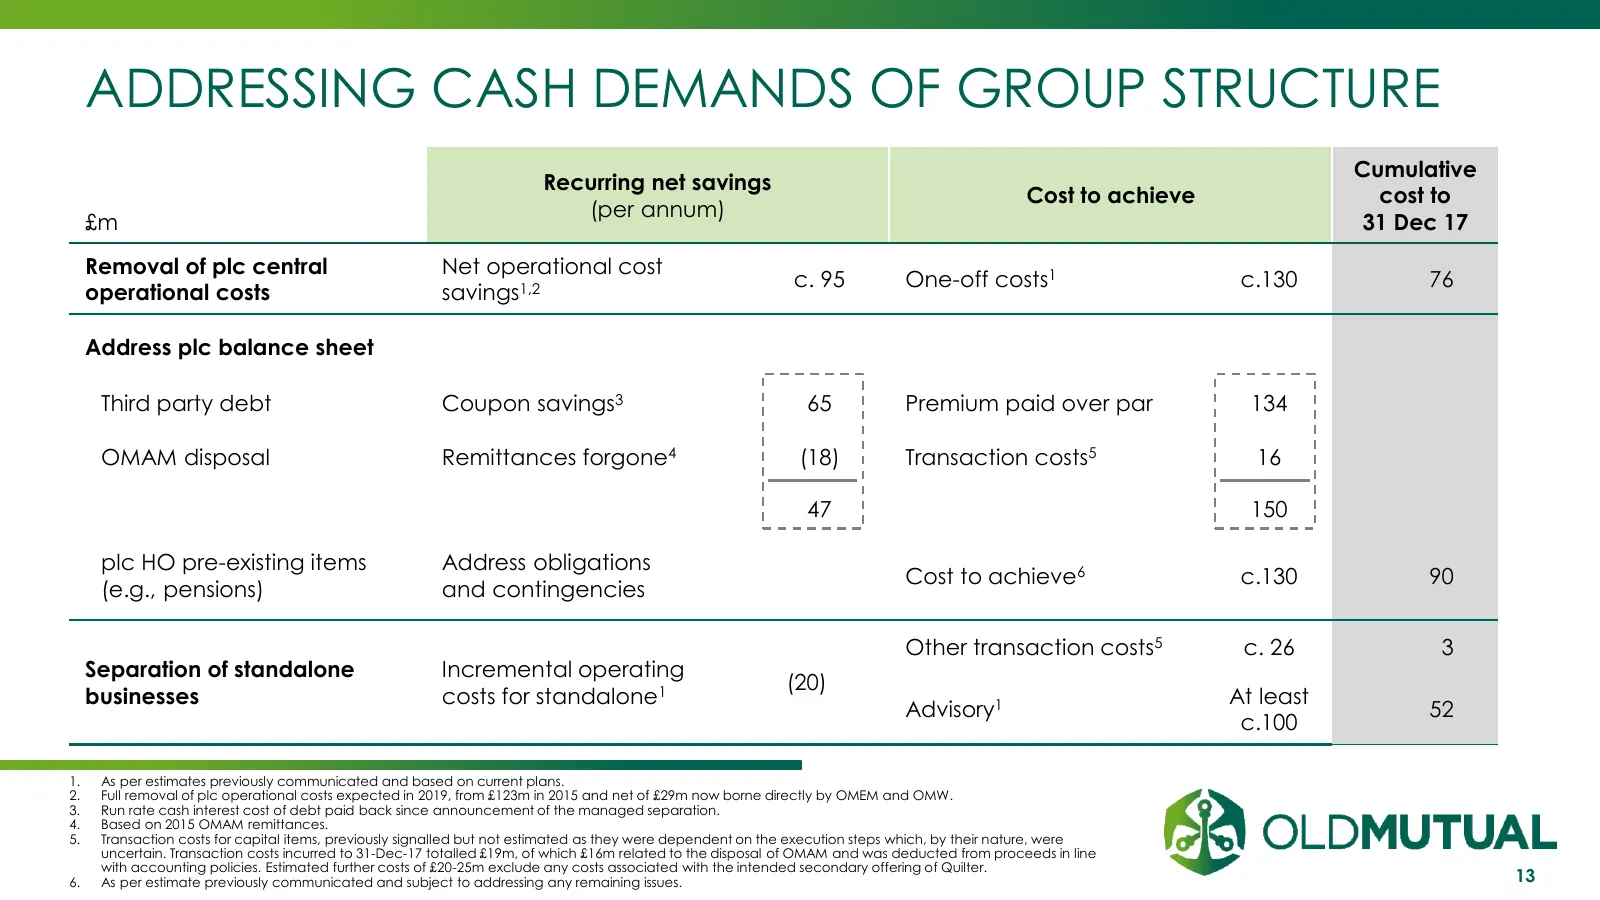
ADDRESSING CASH DEMANDS OF GROUP STRUCTURE Cumulative Recurring net savings Cost to achieve cost to (per annum) £m 31 Dec 17 Removal of plc central Net operational cost c. 95 One-off costs1 c.130 76 operational costs savings1,2 Address plc balance sheet Third party debt Coupon savings3 65 Premium pa
Slide 14: Setting up businesses for independence with strong capital bases
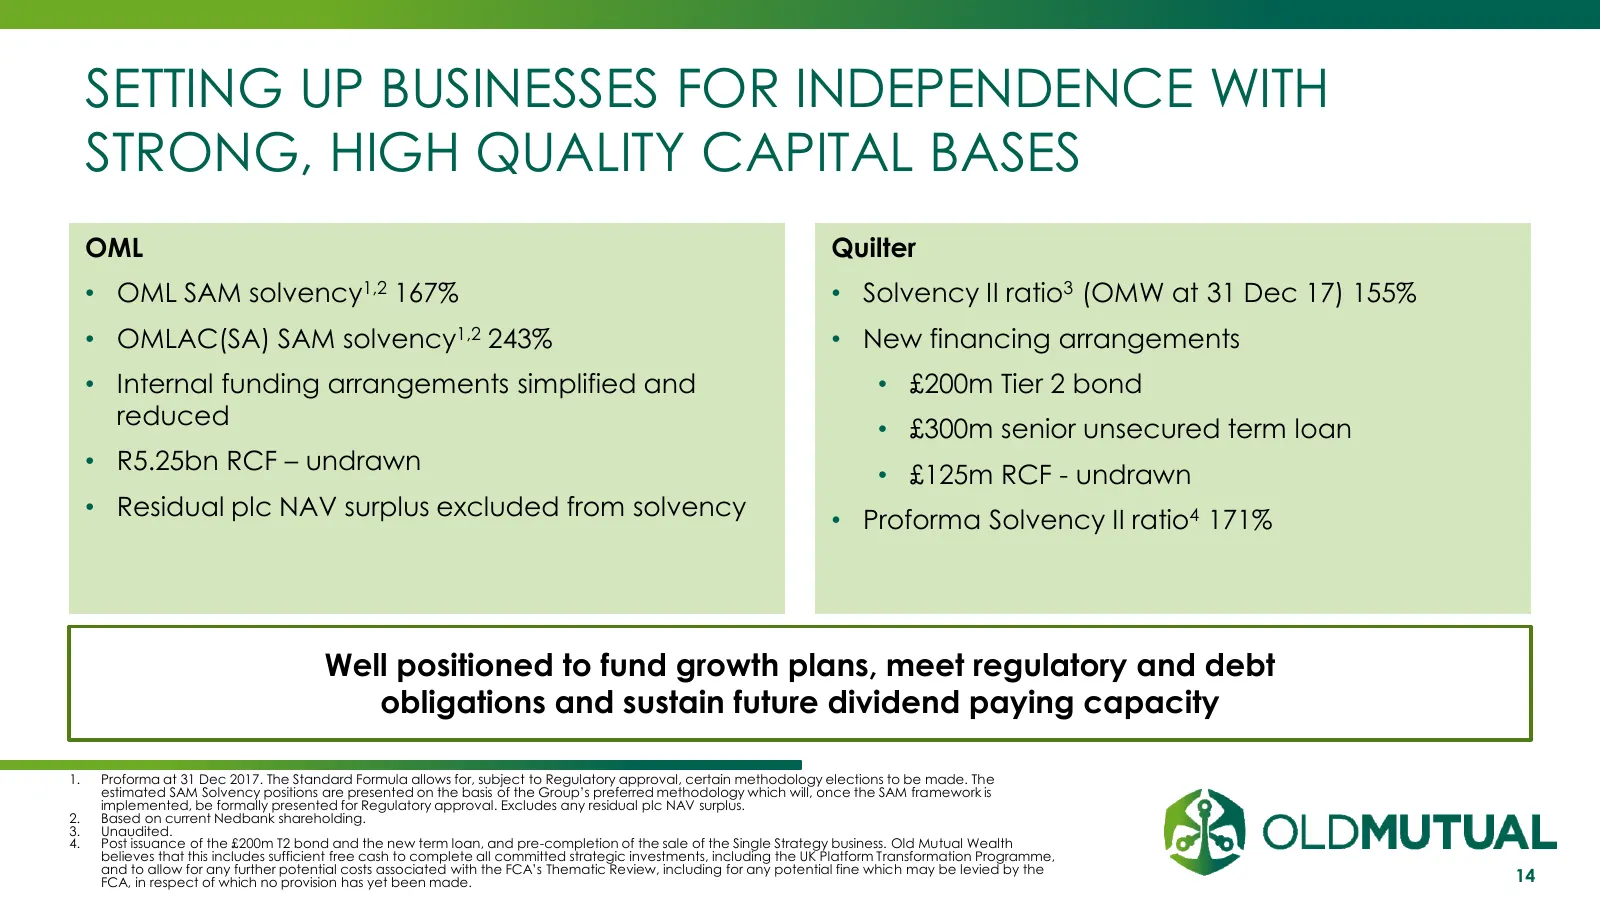
SETTING UP BUSINESSES FOR INDEPENDENCE WITH STRONG, HIGH QUALITY CAPITAL BASES OML Quilter • OML SAM solvency1,2 167% • Solvency II ratio3 (OMW at 31 Dec 17) 155% • OMLAC(SA) SAM solvency1,2 243% • New financing arrangements • Internal funding arrangements simplified and • £200m Tier 2 bond reduced
Slide 15: Managing capital effectively
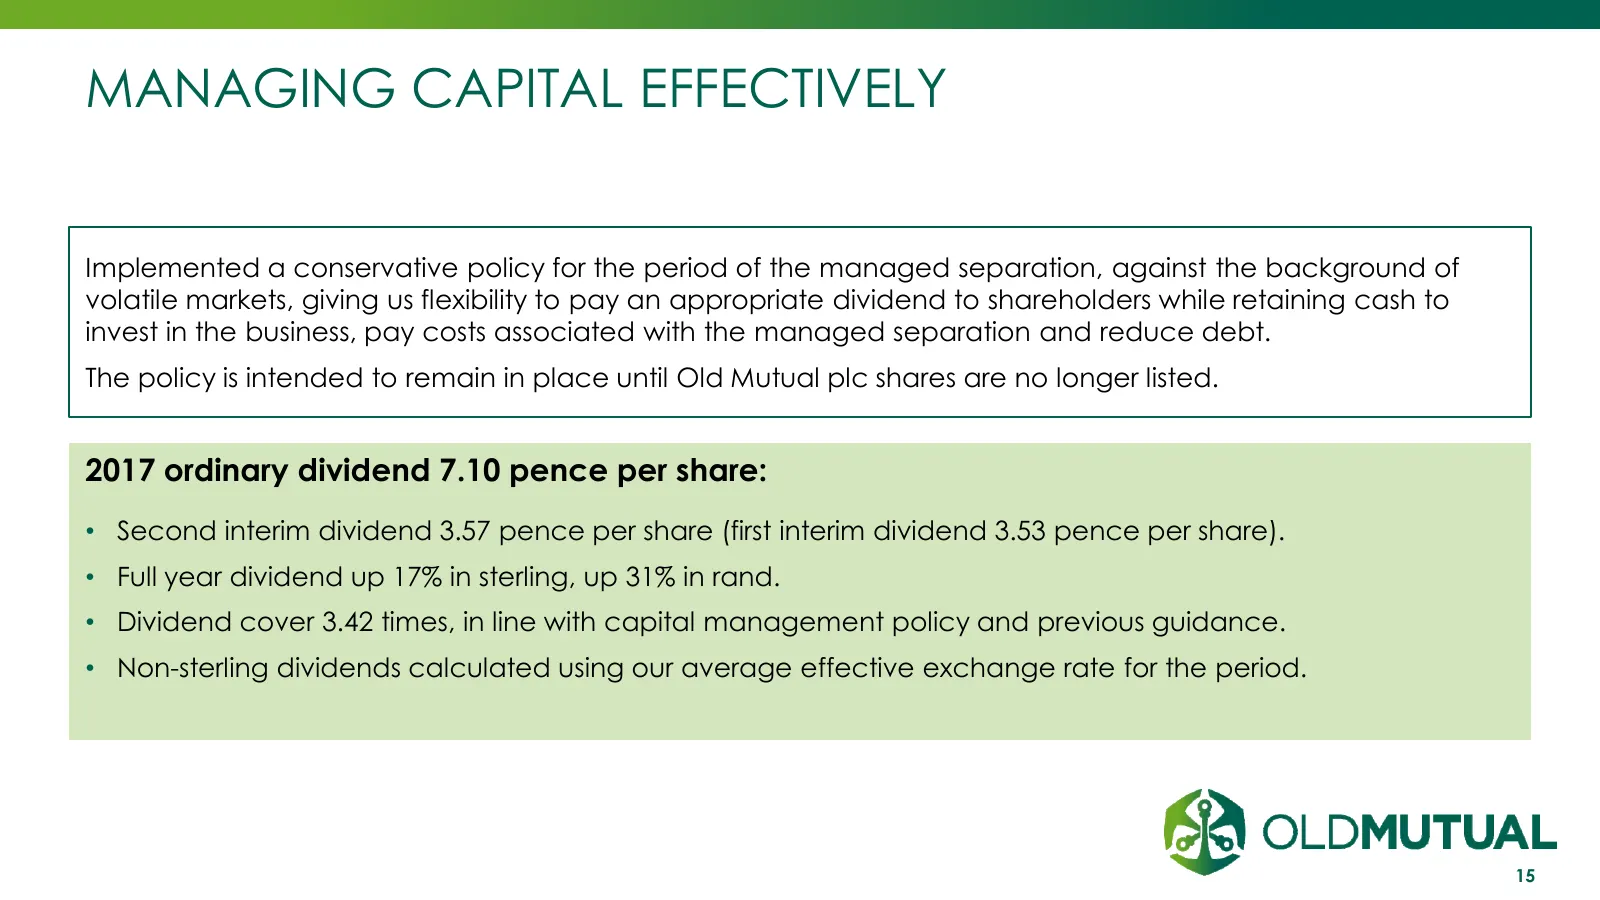
MANAGING CAPITAL EFFECTIVELY Implemented a conservative policy for the period of the managed separation, against the background of volatile markets, giving us flexibility to pay an appropriate dividend to shareholders while retaining cash to invest in the business, pay costs associated with the mana
Slide 16: Unlocking value for plc shareholders
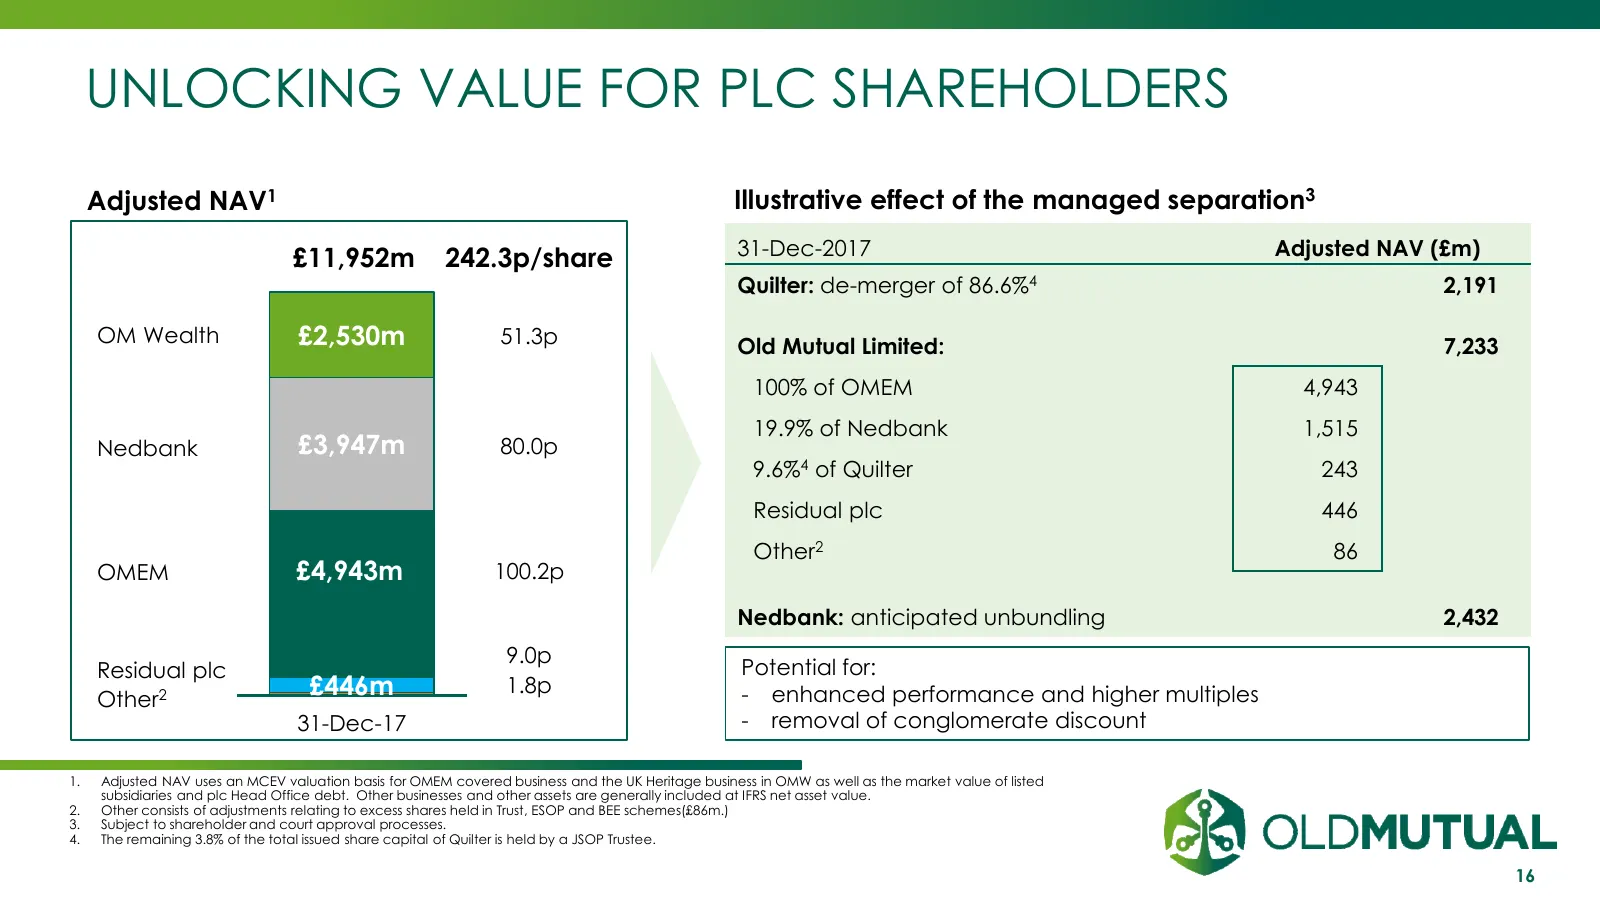
UNLOCKING VALUE FOR PLC SHAREHOLDERS Adjusted NAV1 Illustrative effect of the managed separation3 31-Dec-2017 Adjusted NAV (£m) £11,952m 242.3p/share Quilter: de-merger of 86.6%4 2,1916 OM Wealth £2,530m 51.3p Old Mutual Limited: 7,2336 100% of OMEM 4,943 19.9% of Nedbank 1,515 Nedbank £3,947m 80.0p
Slide 17: Delivered on our financial promises
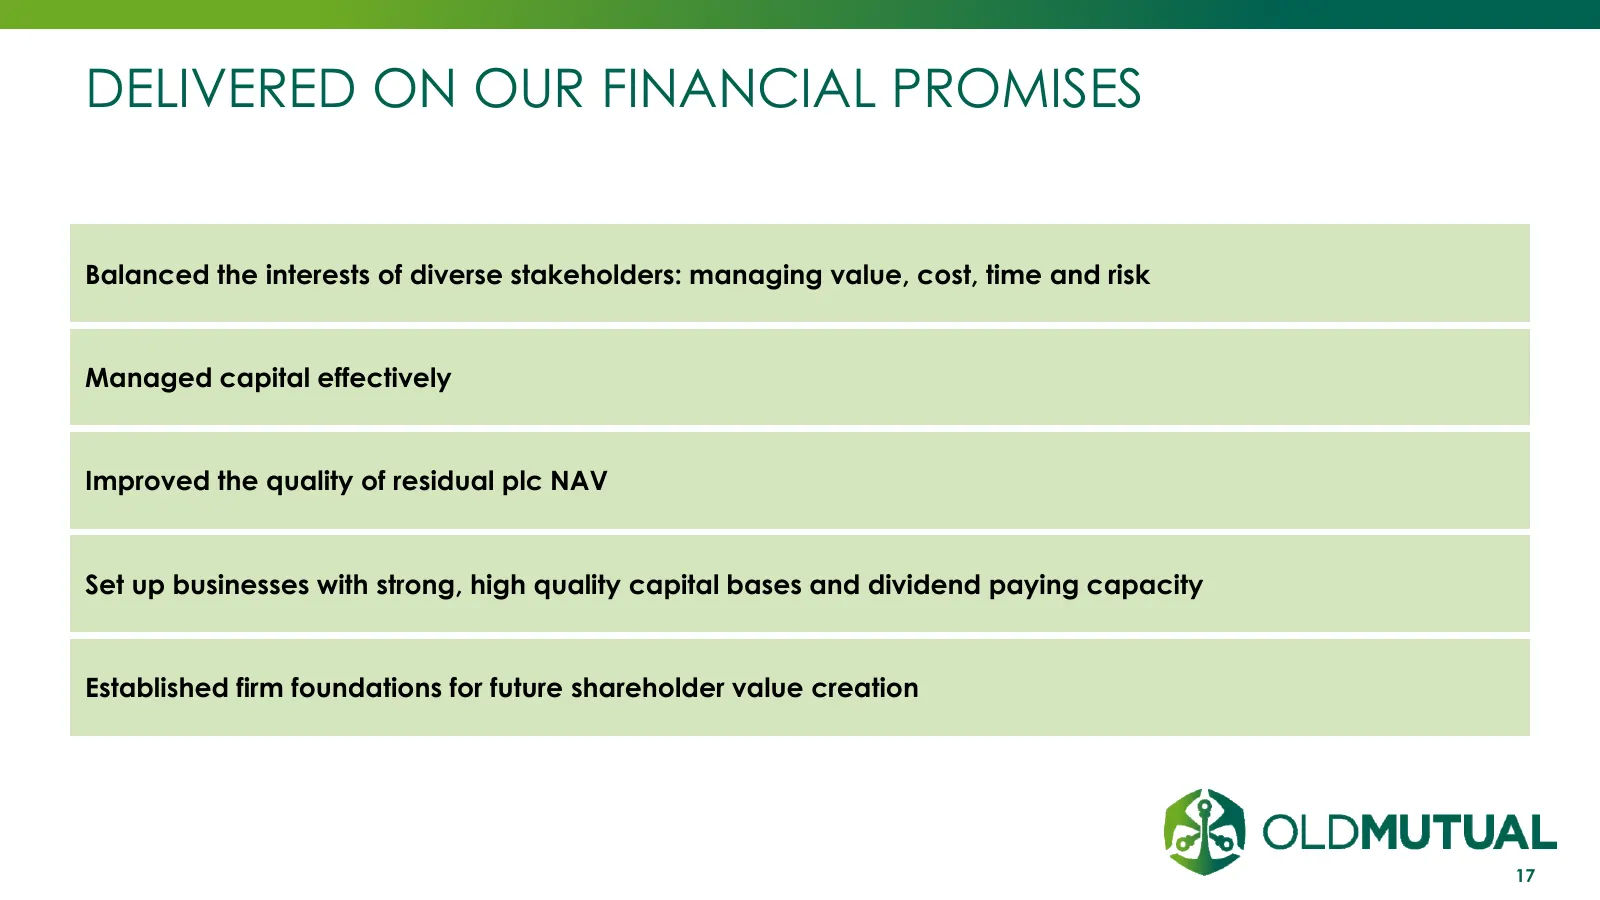
DELIVERED ON OUR FINANCIAL PROMISES Balanced the interests of diverse stakeholders: managing value, cost, time and risk Managed capital effectively Improved the quality of residual plc NAV Set up businesses with strong, high quality capital bases and dividend paying capacity Established firm foundat
Slide 18: Old Mutual Emerging Markets
OLD MUTUAL EMERGING MARKETS Peter Moyo INVESTMENT | SAVINGS | INSURANCE | BANKING
Slide 19: Resilient performance in challenging conditions
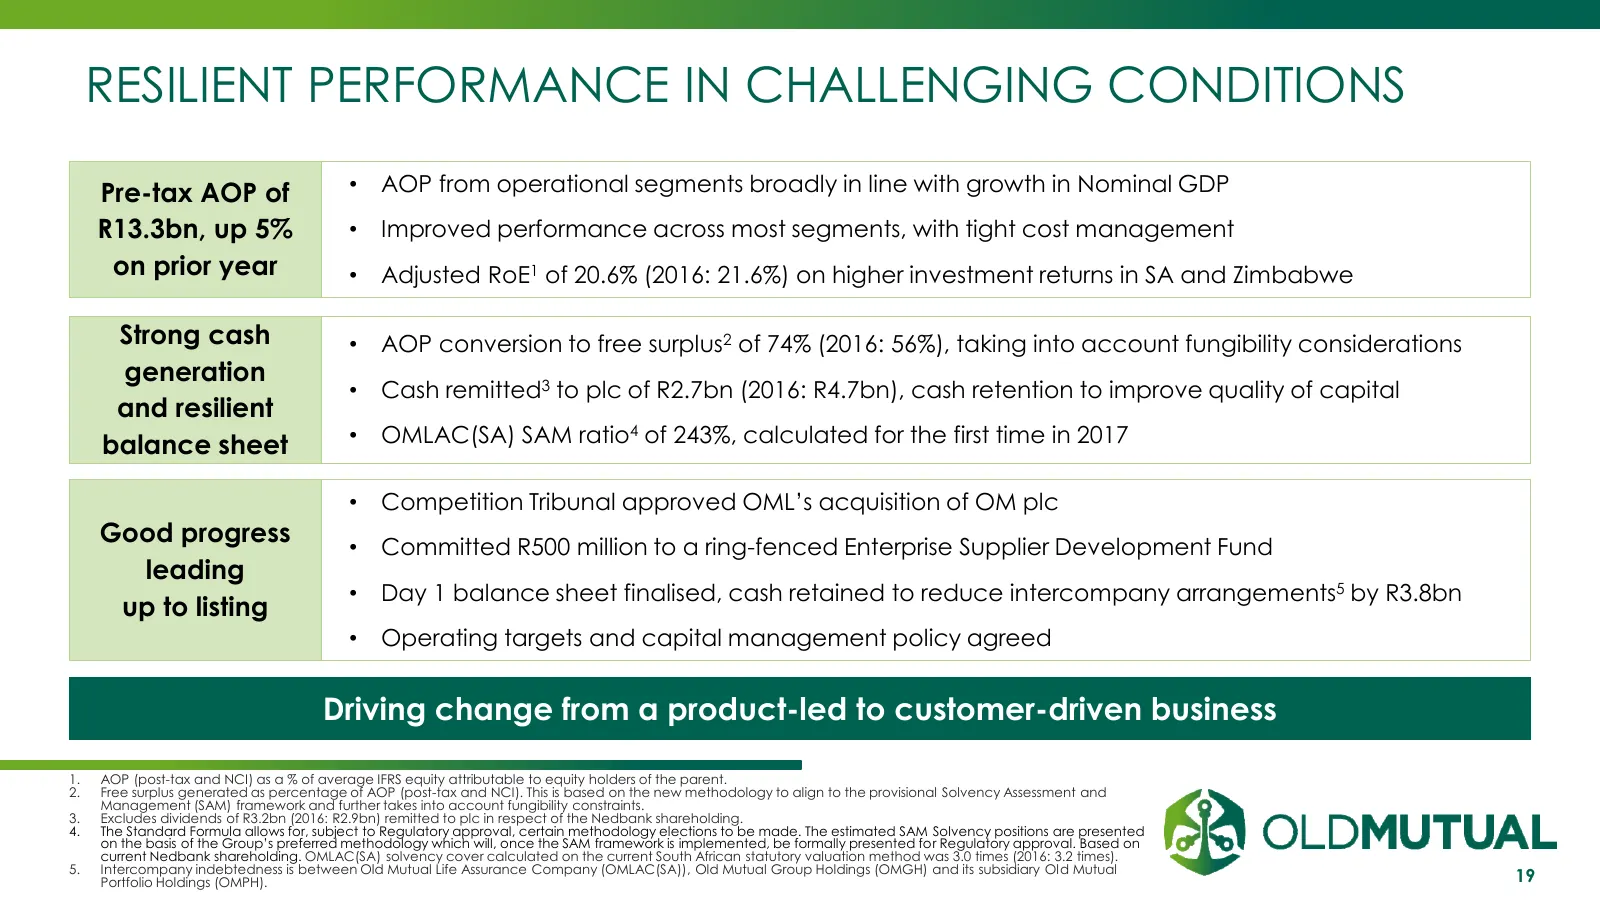
RESILIENT PERFORMANCE IN CHALLENGING CONDITIONS Pre-tax AOP of • AOP from operational segments broadly in line with growth in Nominal GDP R13.3bn, up 5% • Improved performance across most segments, with tight cost management on prior year • Adjusted RoE1 of 20.6% (2016: 21.6%) on higher investment r
Slide 20: Continued momentum in operating segments
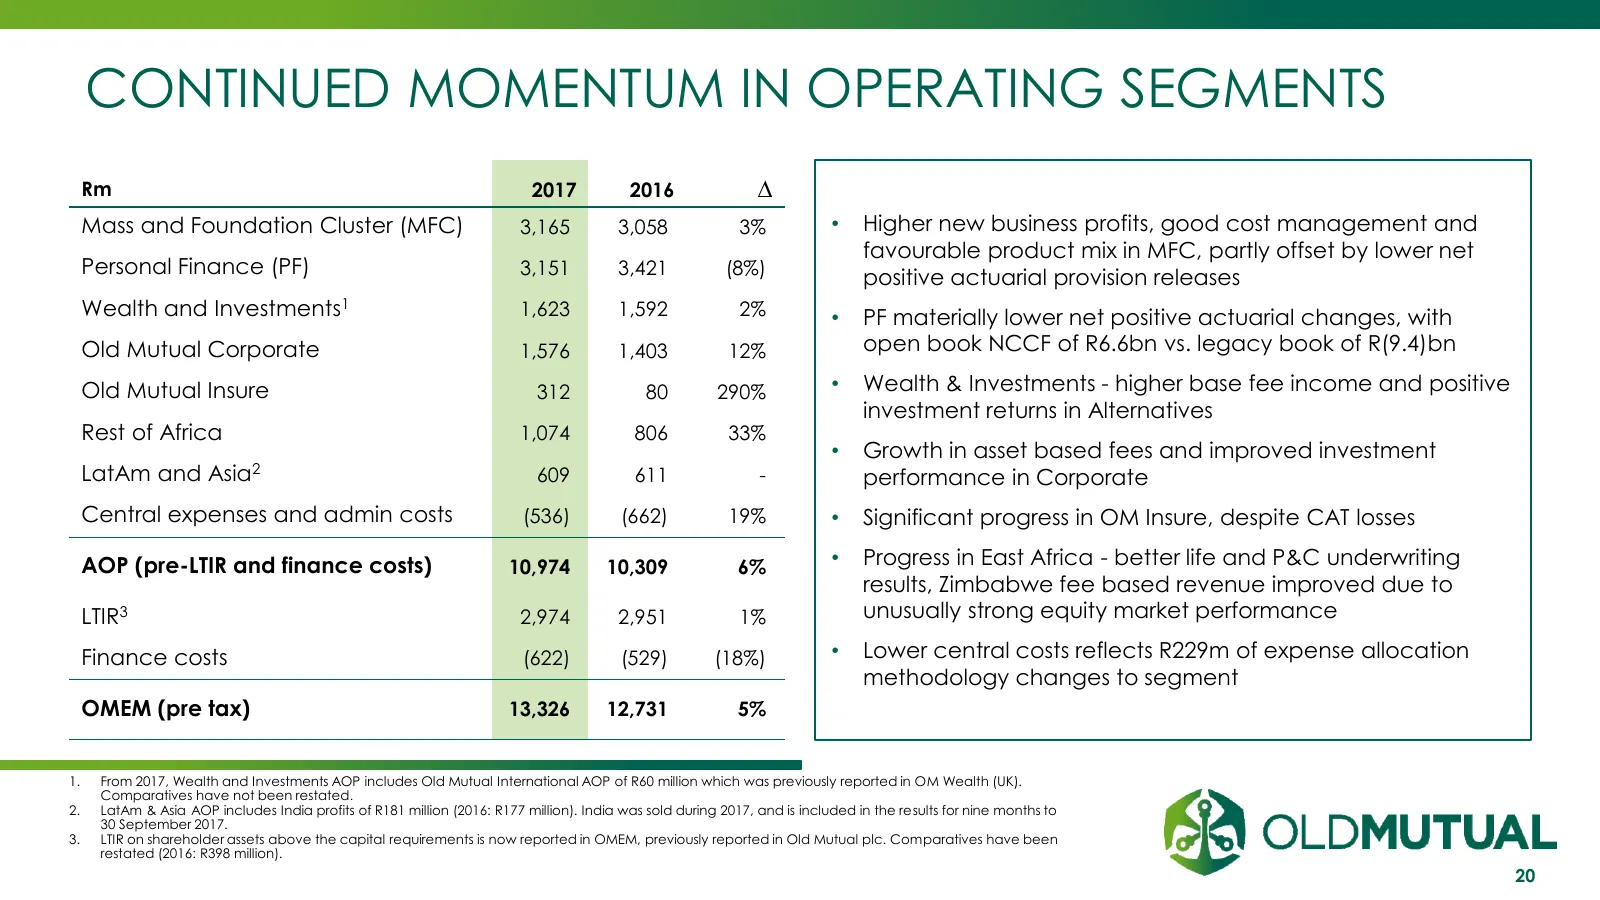
CONTINUED MOMENTUM IN OPERATING SEGMENTS Rm 2017 2016 ∆ Mass and Foundation Cluster (MFC) 3,165 3,058 3% • Higher new business profits, good cost management and favourable product mix in MFC, partly offset by lower net Personal Finance (PF) 3,151 3,421 (8%) positive actuarial provision releases Weal
Slide 21: Progress on our 8 battlegrounds
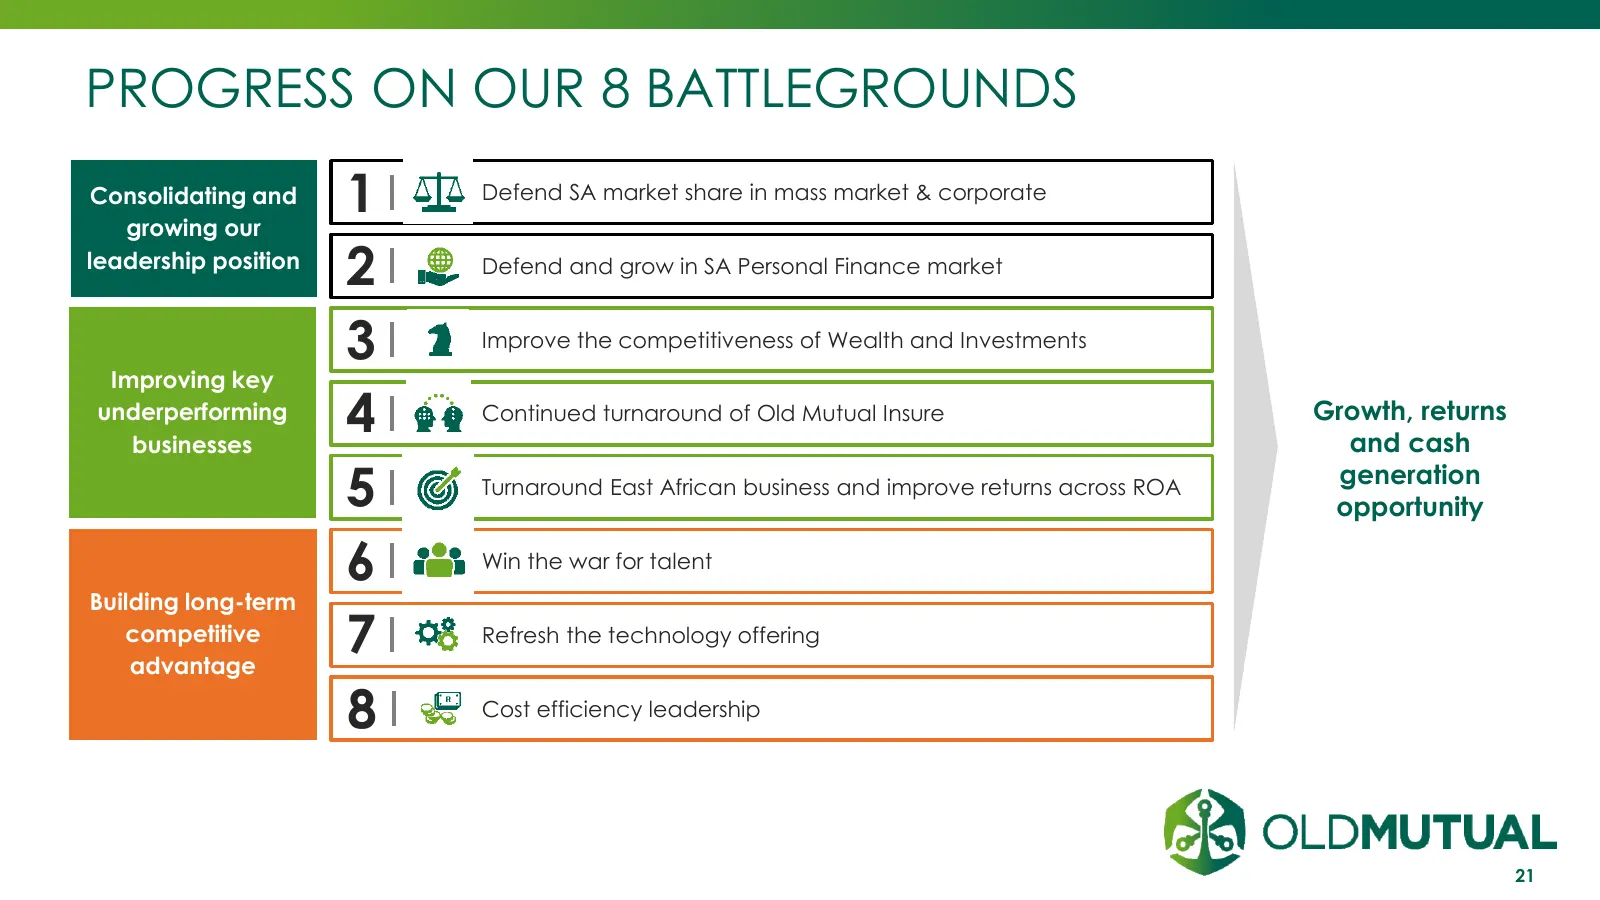
PROGRESS ON OUR 8 BATTLEGROUNDS Consolidating and growing our 1 Defend SA market share in mass market & corporate leadership position 2 Defend and grow in SA Personal Finance market 3 Improve the competitiveness of Wealth and Investments Improving key underperforming businesses 4 Continued turnaroun
Slide 22: A compelling investment proposition for OML
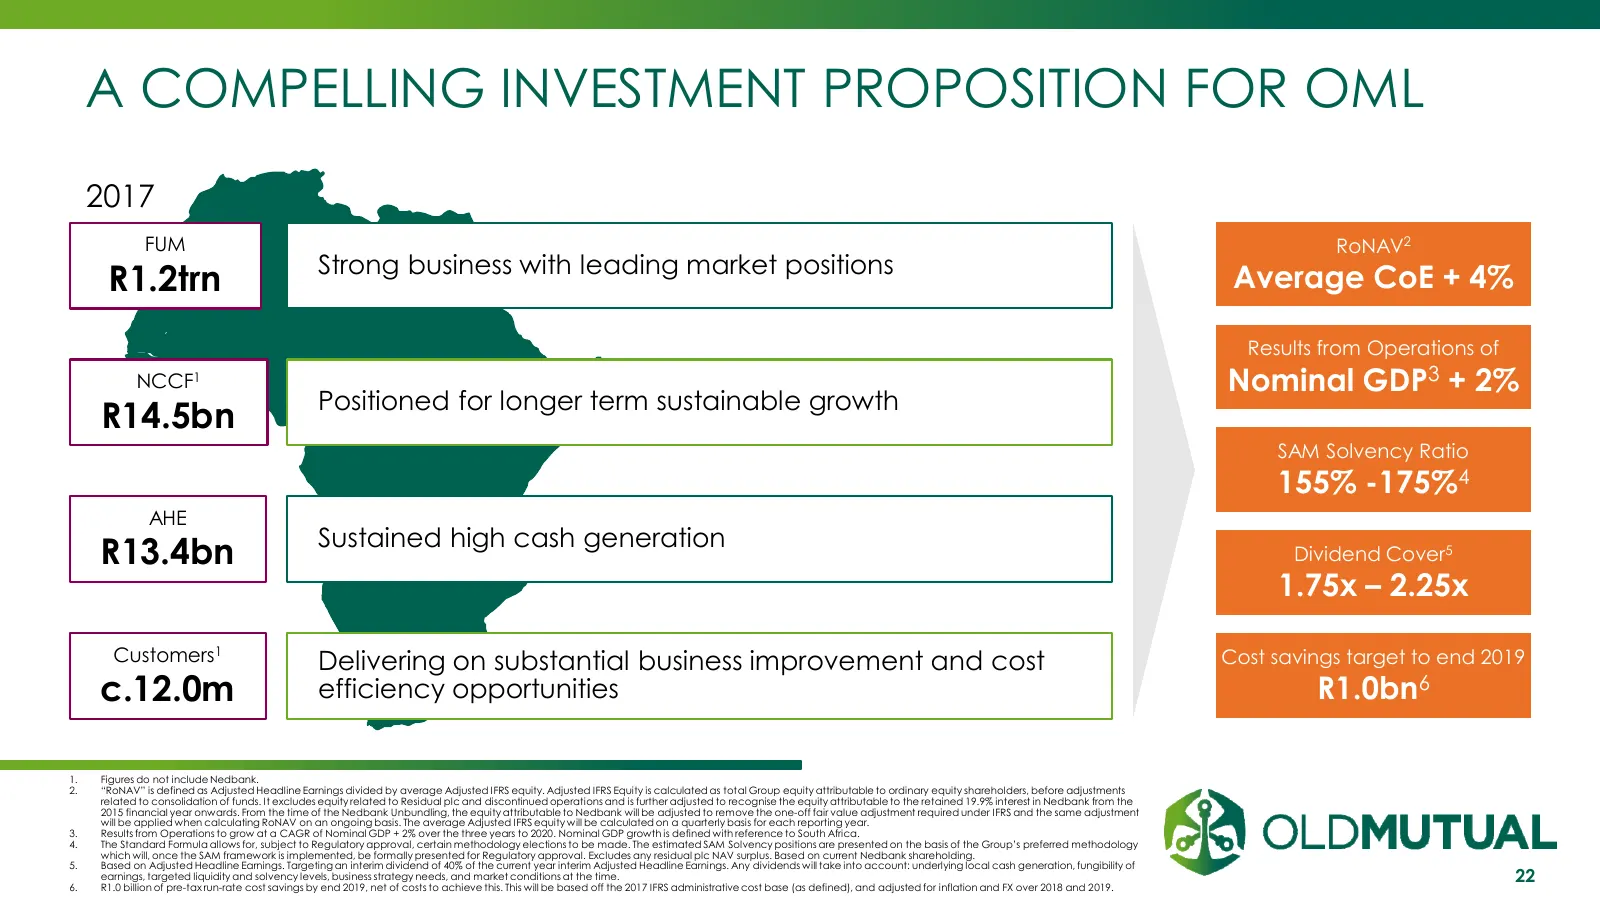
A COMPELLING INVESTMENT PROPOSITION FOR OML 2017 FUM RoNAV2 Strong business with leading market positions R1.2trn Average CoE + 4% Results from Operations of NCCF1 Nominal GDP3 + 2% Positioned for longer term sustainable growth R14.5bn SAM Solvency Ratio 155% -175%4 AHE Sustained high cash generatio
Slide 23: Old Mutual Wealth
OLD MUTUAL WEALTH Paul Feeney INVESTMENT | SAVINGS | INSURANCE | BANKING 23
Slide 24: OMW: Strong results and good progress
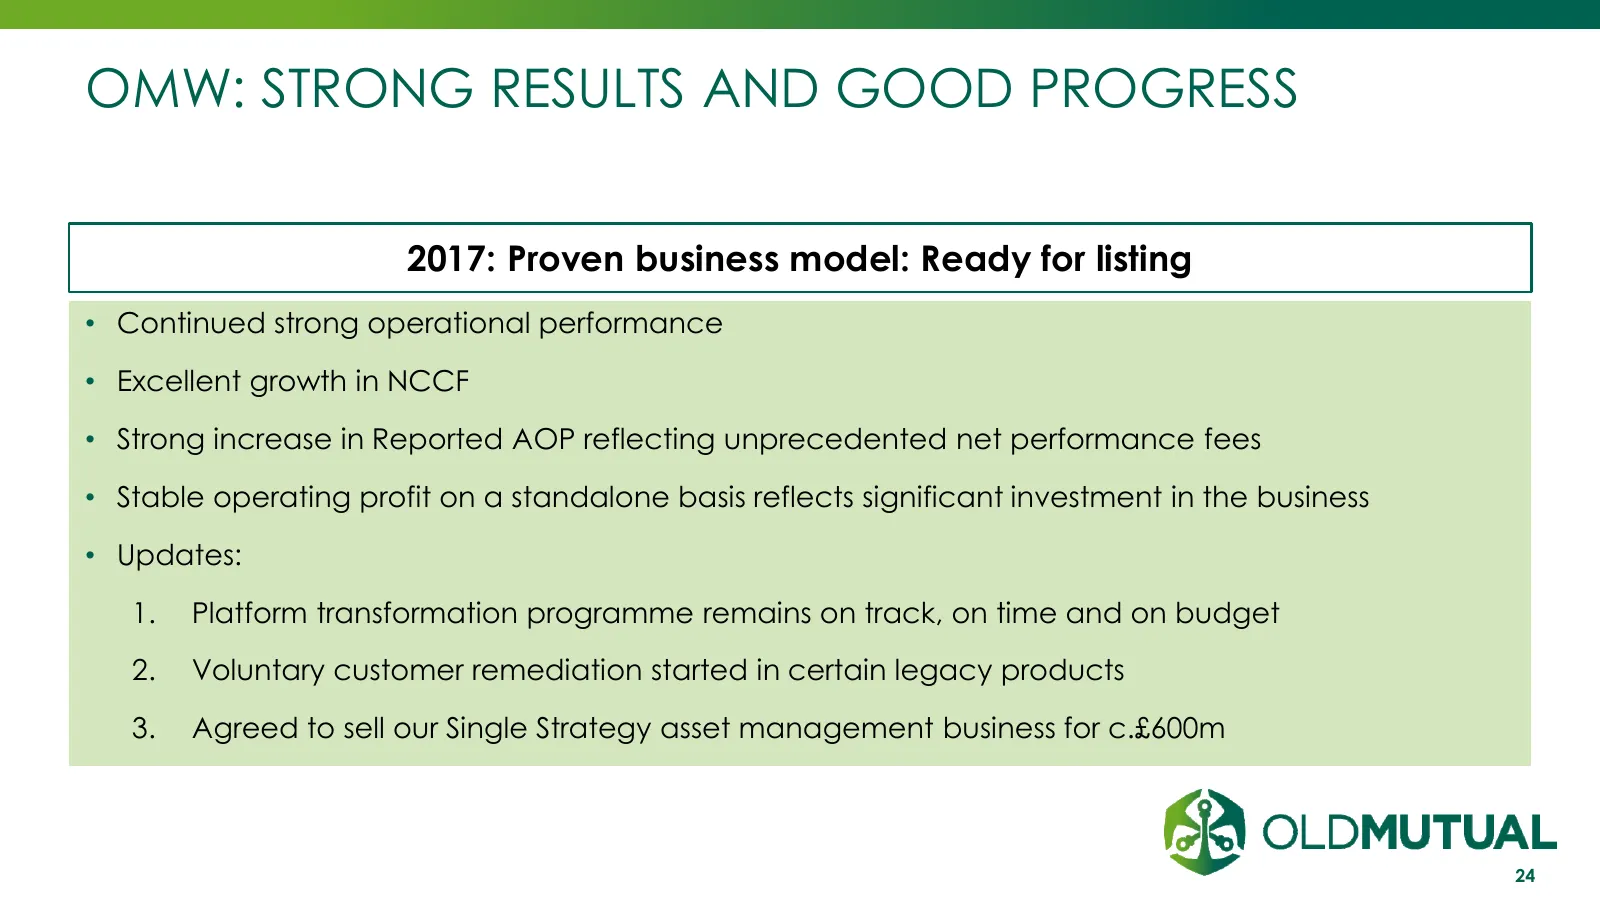
OMW: STRONG RESULTS AND GOOD PROGRESS 2017: Proven business model: Ready for listing • Continued strong operational performance • Excellent growth in NCCF • Strong increase in Reported AOP reflecting unprecedented net performance fees • Stable operating profit on a standalone basis reflects signific
Slide 25: Strong operational performance on reported basis
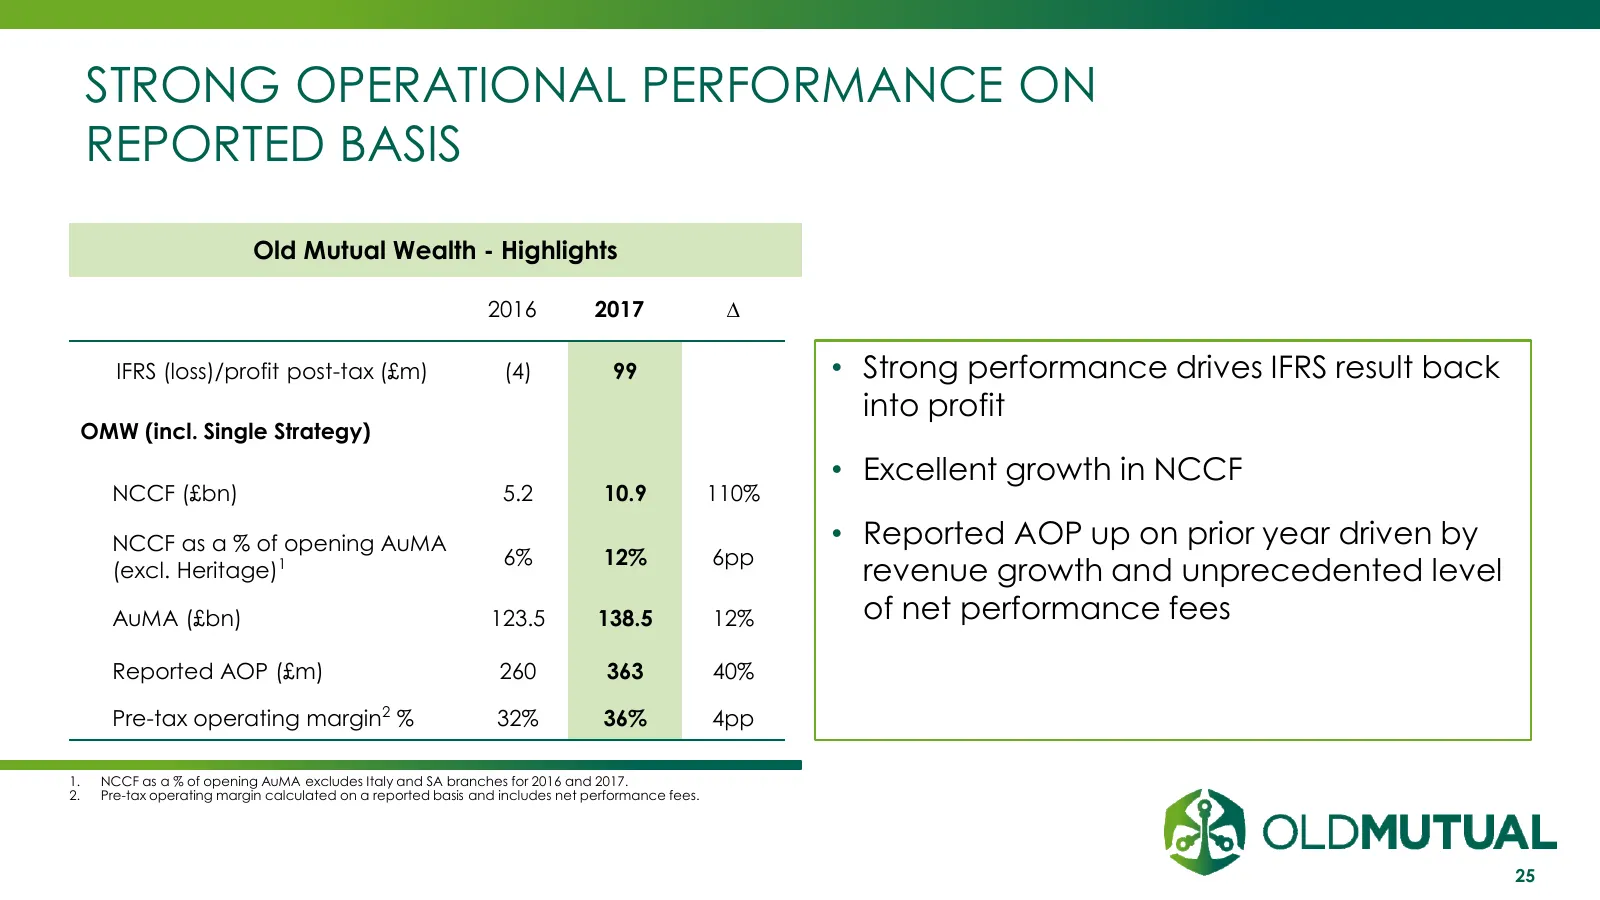
STRONG OPERATIONAL PERFORMANCE ON REPORTED BASIS Old Mutual Wealth - Highlights 2016 2017 ∆ IFRS (loss)/profit post-tax (£m) (4) 99 • Strong performance drives IFRS result back into profit OMW (incl. Single Strategy) • Excellent growth in NCCF NCCF (£bn) 5.2 10.9 110% NCCF as a % of opening AuMA • R
Slide 26: Excellent NCCF growth
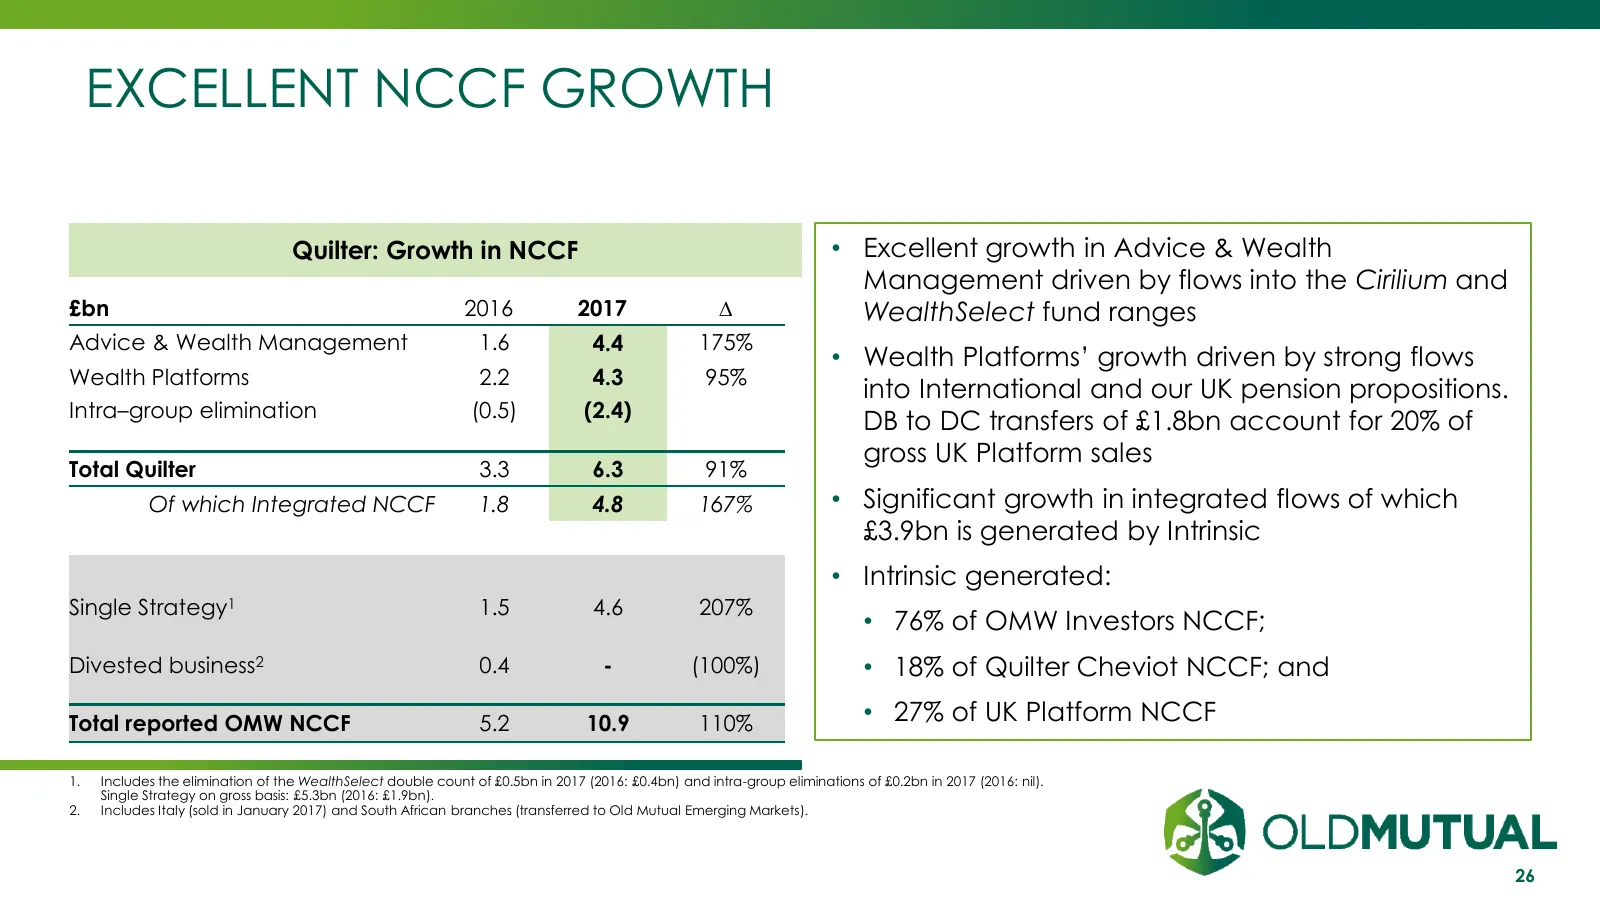
EXCELLENT NCCF GROWTH Quilter: Growth in NCCF • Excellent growth in Advice & Wealth Management driven by flows into the Cirilium and £bn 2016 2017 ∆ WealthSelect fund ranges Advice & Wealth Management 1.6 4.4 175% • Wealth Platforms’ growth driven by strong flows Wealth Platforms 2.2 4.3 95% into In
Slide 27: Financial results – standalone (Quilter) basis
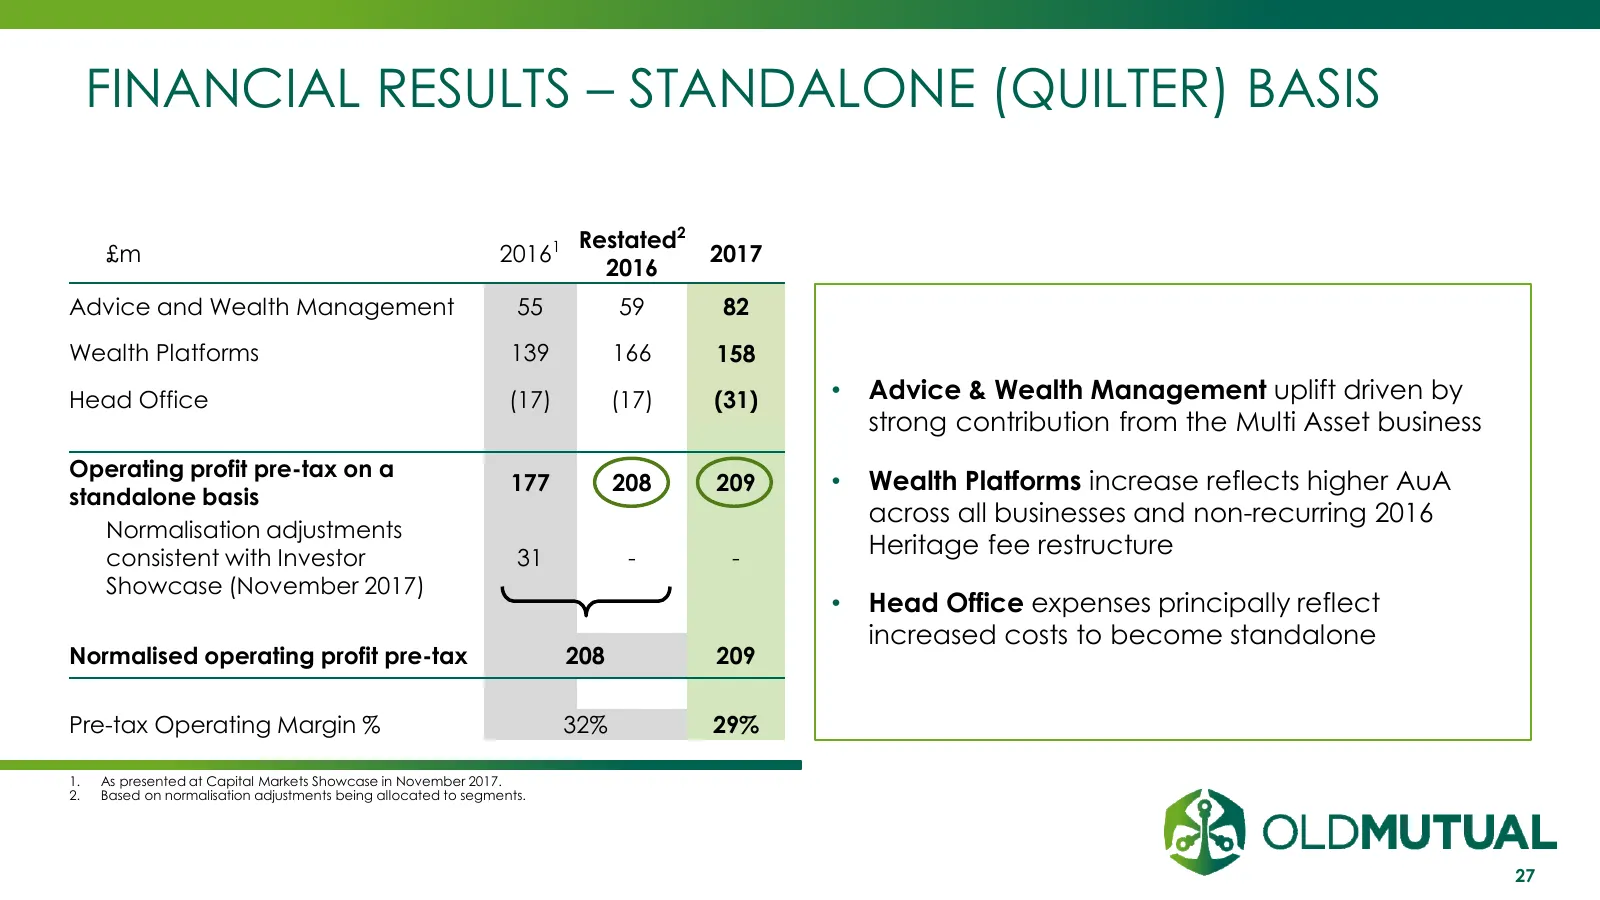
FINANCIAL RESULTS – STANDALONE (QUILTER) BASIS Restated2 £m 20161 2017 2016 Advice and Wealth Management 55 59 82 Wealth Platforms 139 166 158 Head Office (17) (17) (31) • Advice & Wealth Management uplift driven by strong contribution from the Multi Asset business Operating profit pre-tax on a 177
Slide 28: Quilter: Strong operational performance
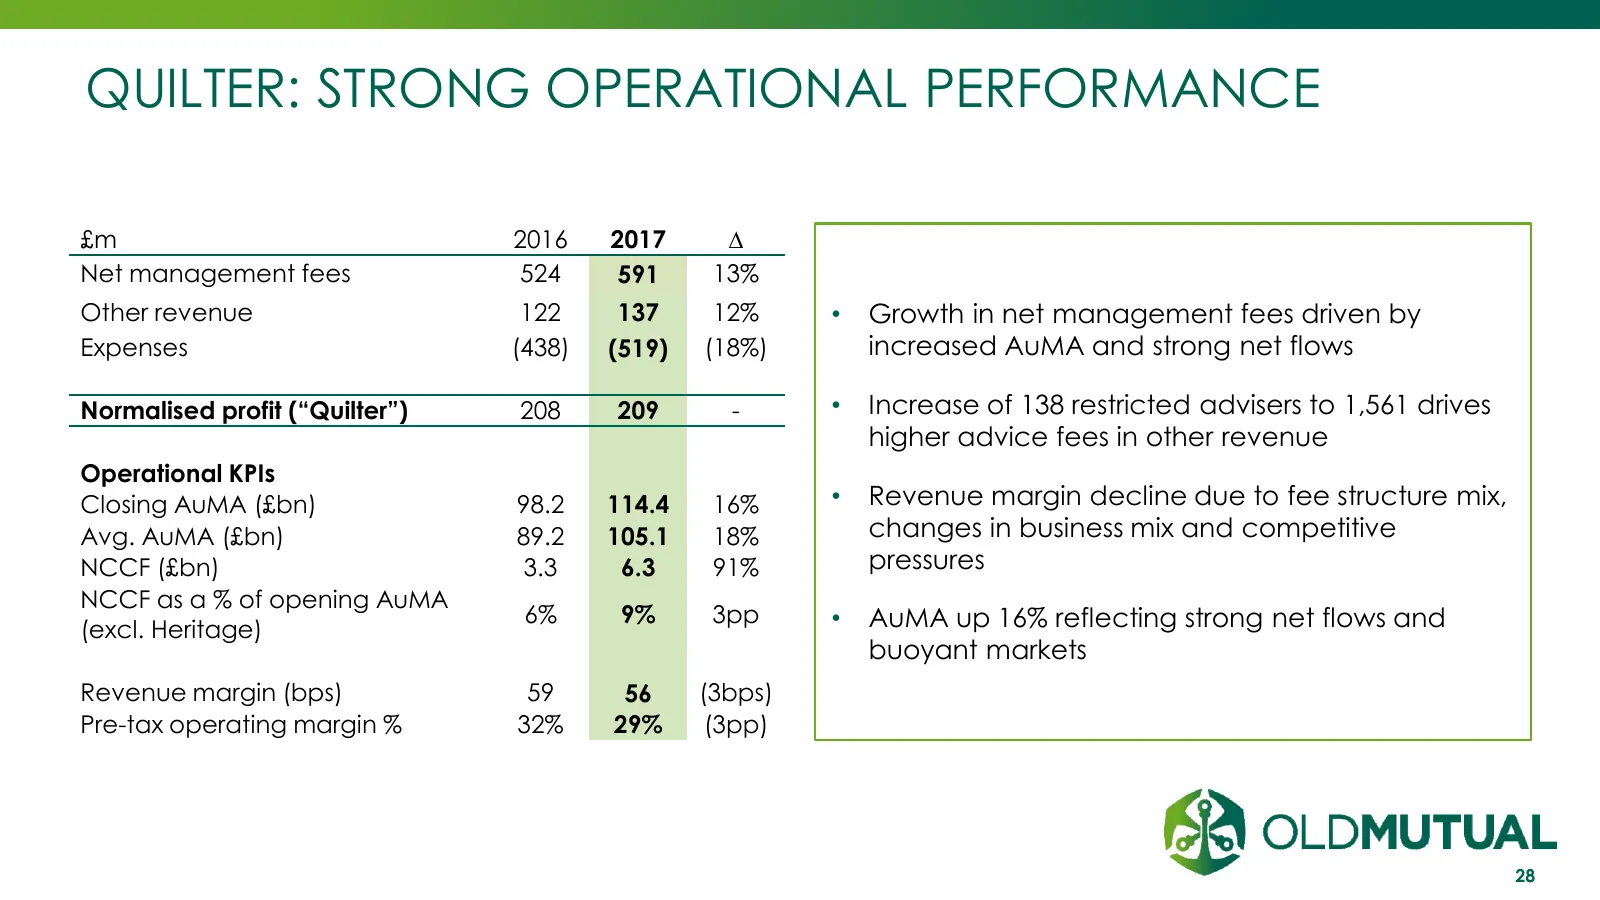
QUILTER: STRONG OPERATIONAL PERFORMANCE £m 2016 2017 ∆ Net management fees 524 591 13% Other revenue 122 137 12% • Growth in net management fees driven by Expenses (438) (519) (18%) increased AuMA and strong net flows Normalised profit (“Quilter”) 208 209 - • Increase of 138 restricted advisers to 1
Slide 29: Expense increase in line with guidance
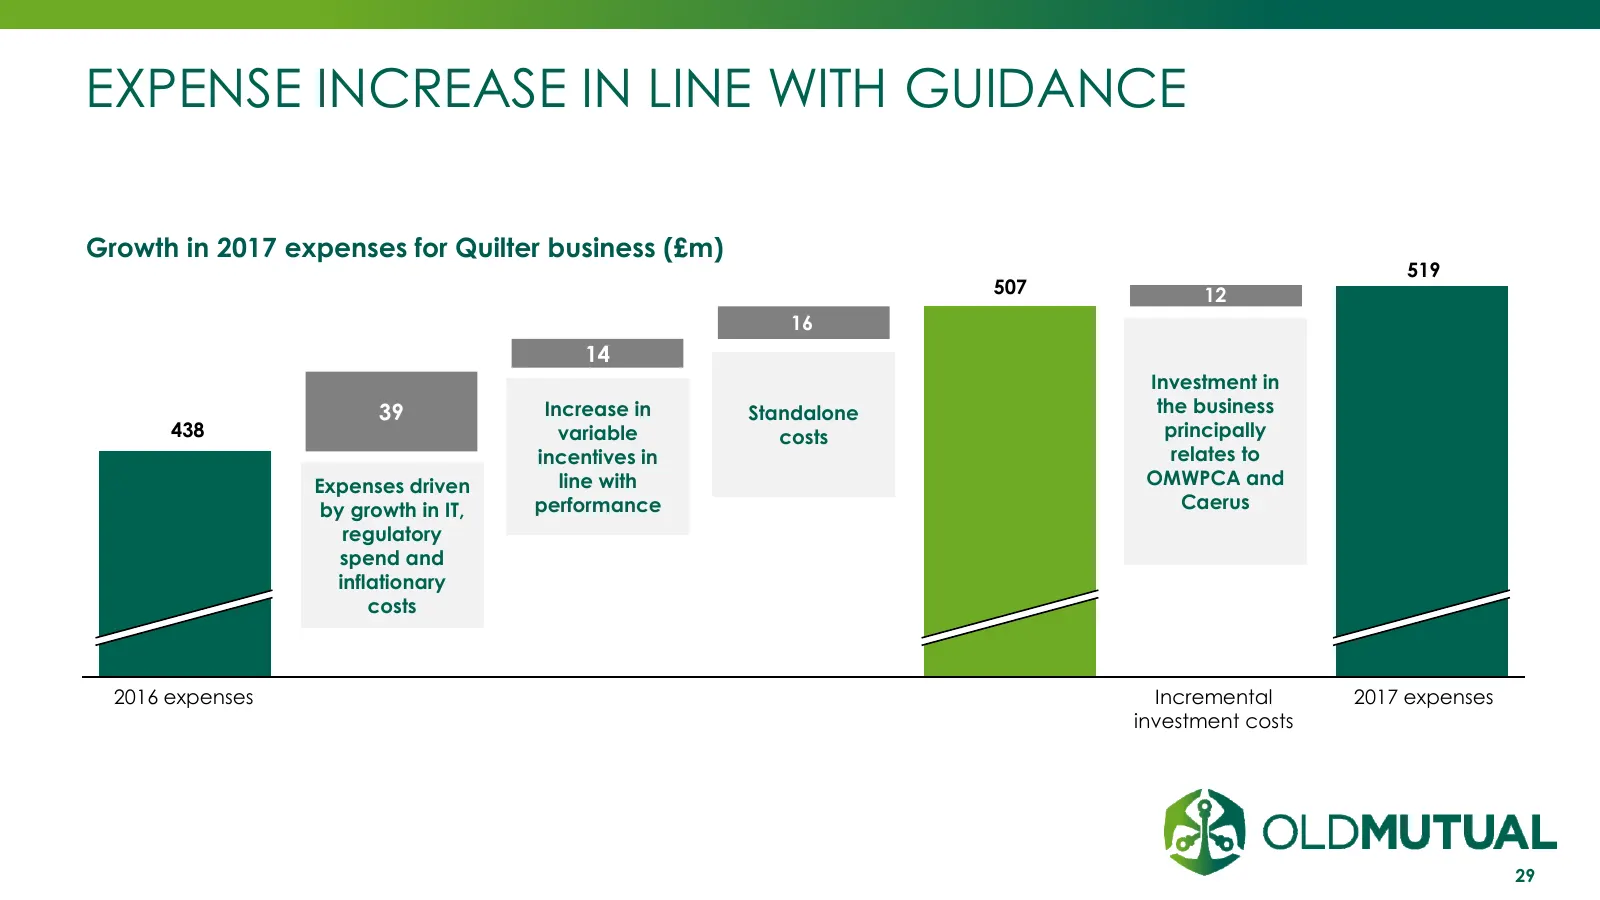
EXPENSE INCREASE IN LINE WITH GUIDANCE Growth in 2017 expenses for Quilter business (£m) 519 507 12 16 14 Investment in 39 Increase in Standalone the business 438 variable costs principally incentives in relates to Expenses driven line with OMWPCA and by growth in IT, performance Caerus regulatory s
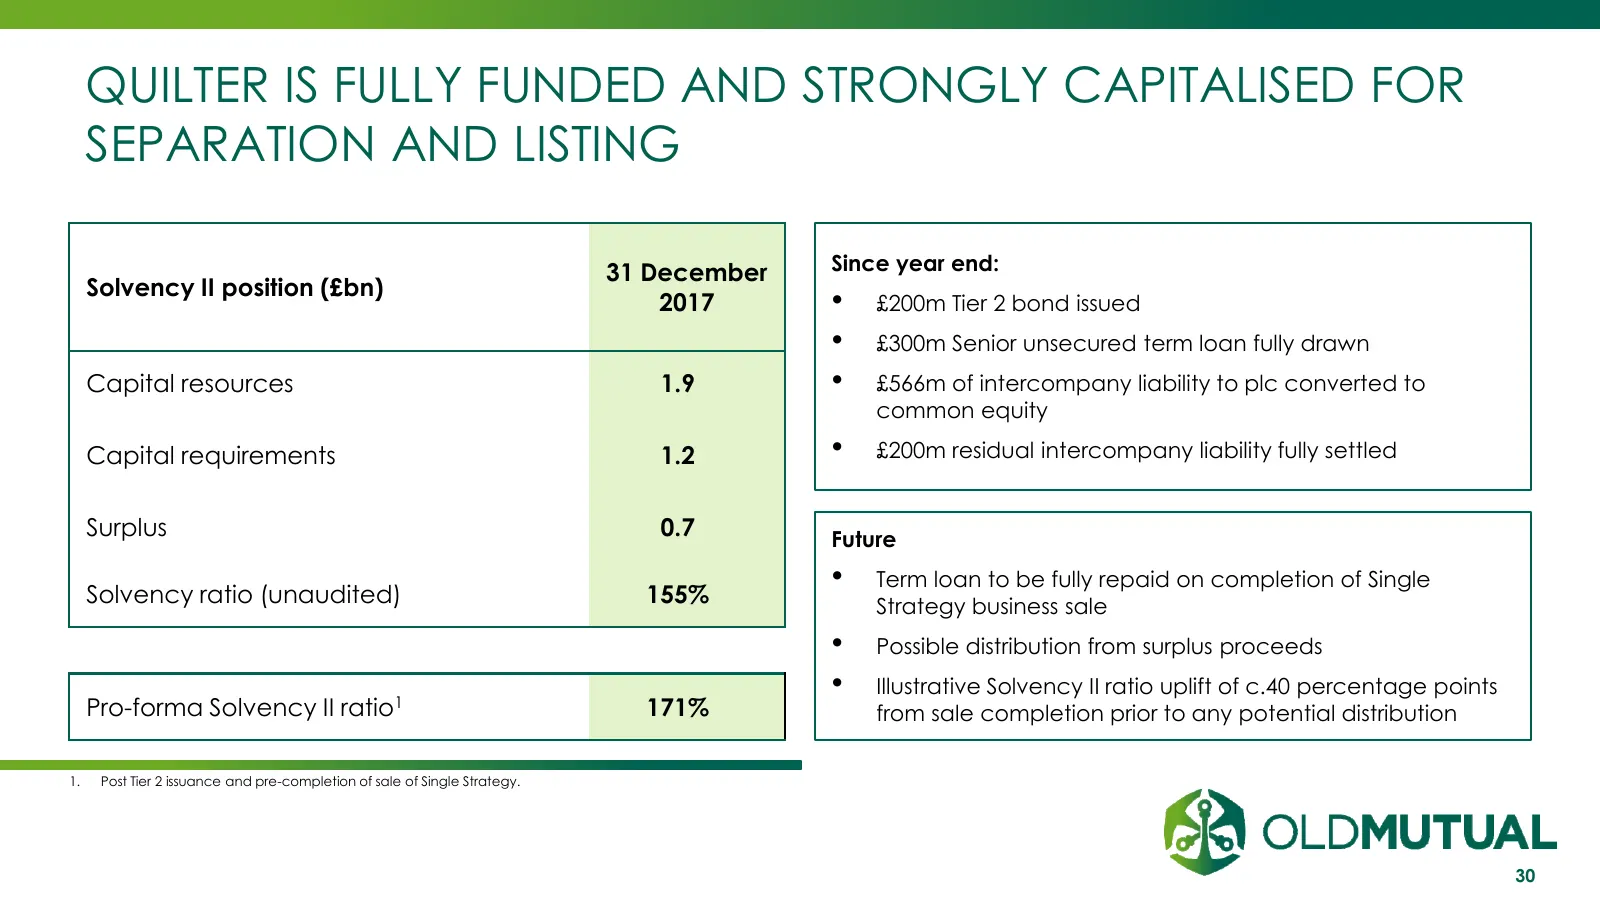
Slide 30: Quilter is fully funded and strongly capitalised for separation and listing
QUILTER IS FULLY FUNDED AND STRONGLY CAPITALISED FOR SEPARATION AND LISTING 31 December Since year end: Solvency II position (£bn) 2017 • £200m Tier 2 bond issued • £300m Senior unsecured term loan fully drawn Capital resources 1.9 • £566m of intercompany liability to plc converted to common equity
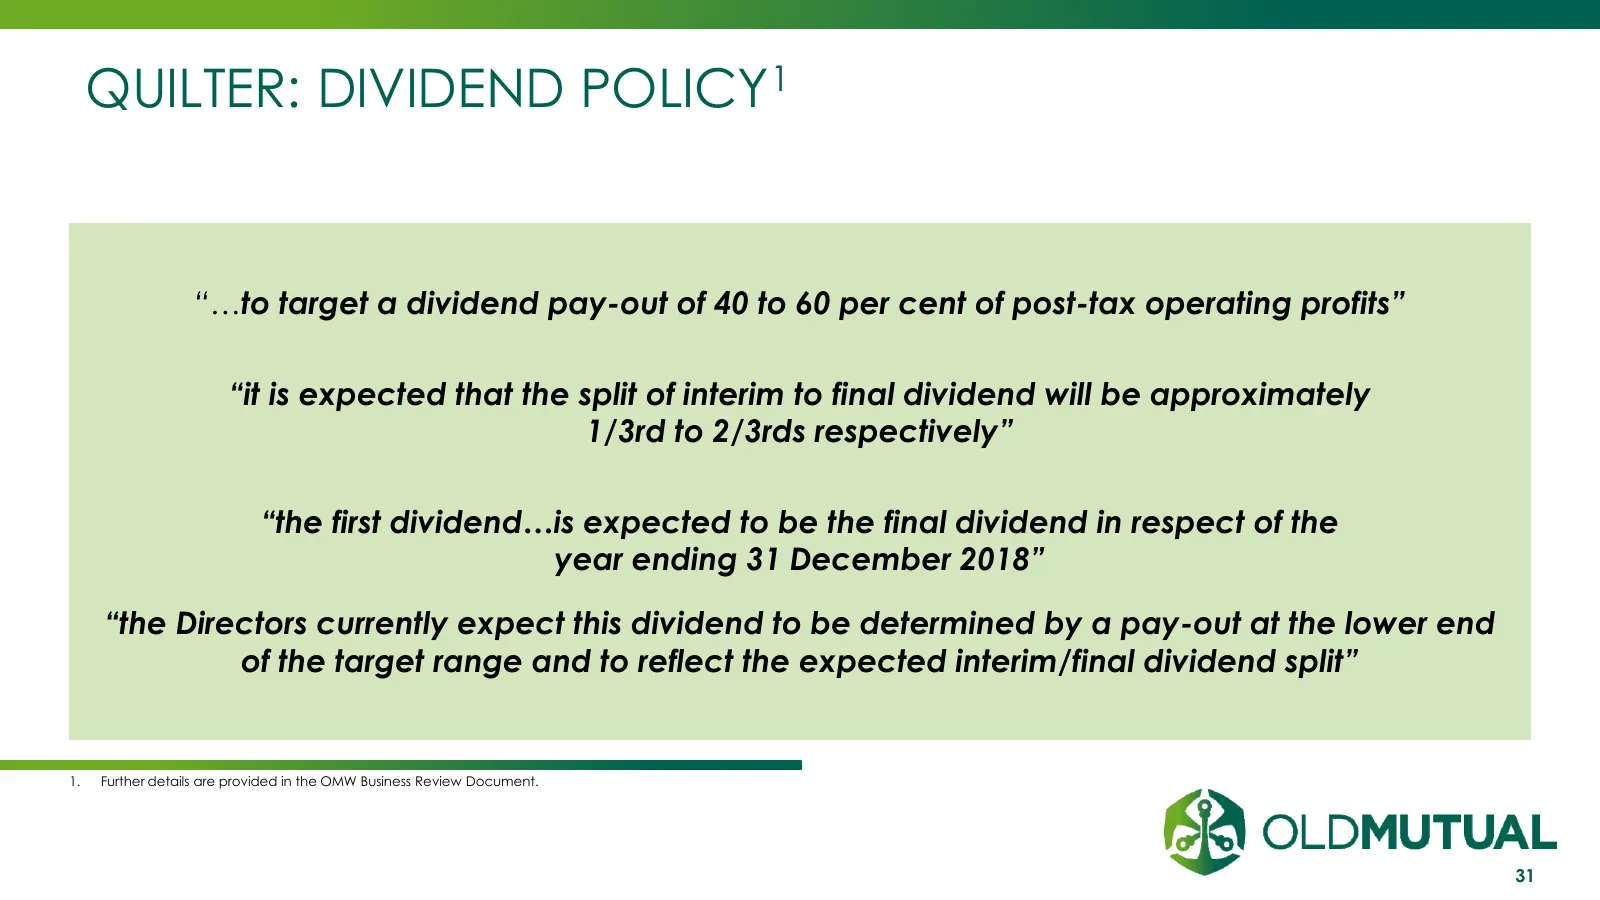
Slide 31: Quilter: Dividend policy
QUILTER: DIVIDEND POLICY1 “…to target a dividend pay-out of 40 to 60 per cent of post-tax operating profits” “it is expected that the split of interim to final dividend will be approximately 1/3rd to 2/3rds respectively” “the first dividend…is expected to be the final dividend in respect of the year
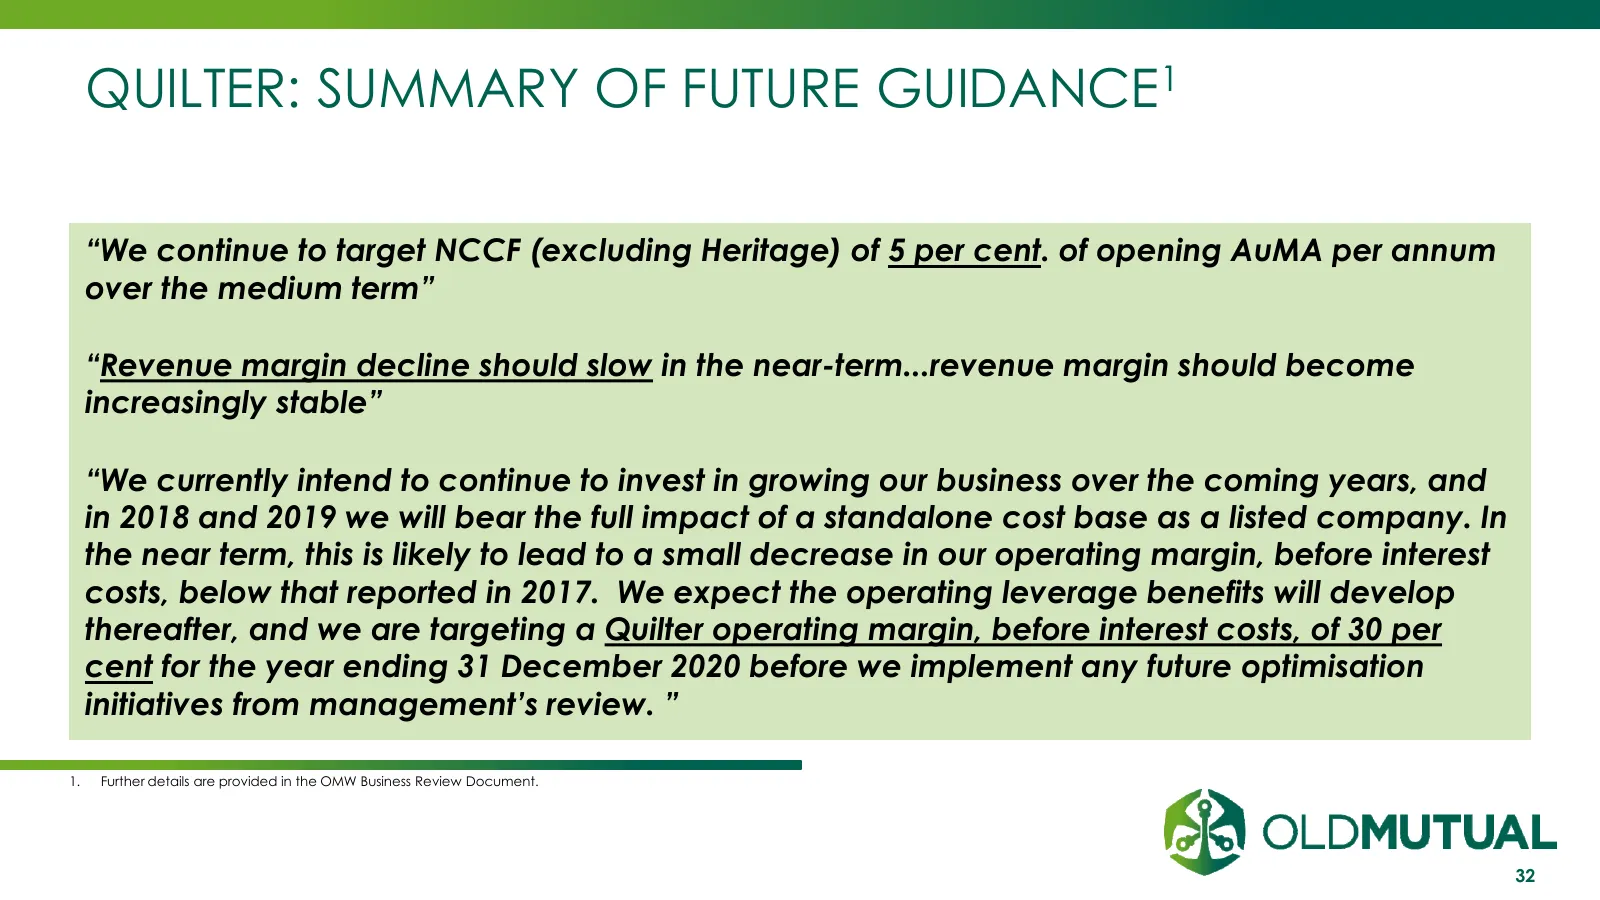
Slide 32: Quilter: Summary of future guidance
QUILTER: SUMMARY OF FUTURE GUIDANCE1 “We continue to target NCCF (excluding Heritage) of 5 per cent. of opening AuMA per annum over the medium term” “Revenue margin decline should slow in the near-term...revenue margin should become increasingly stable” “We currently intend to continue to invest in
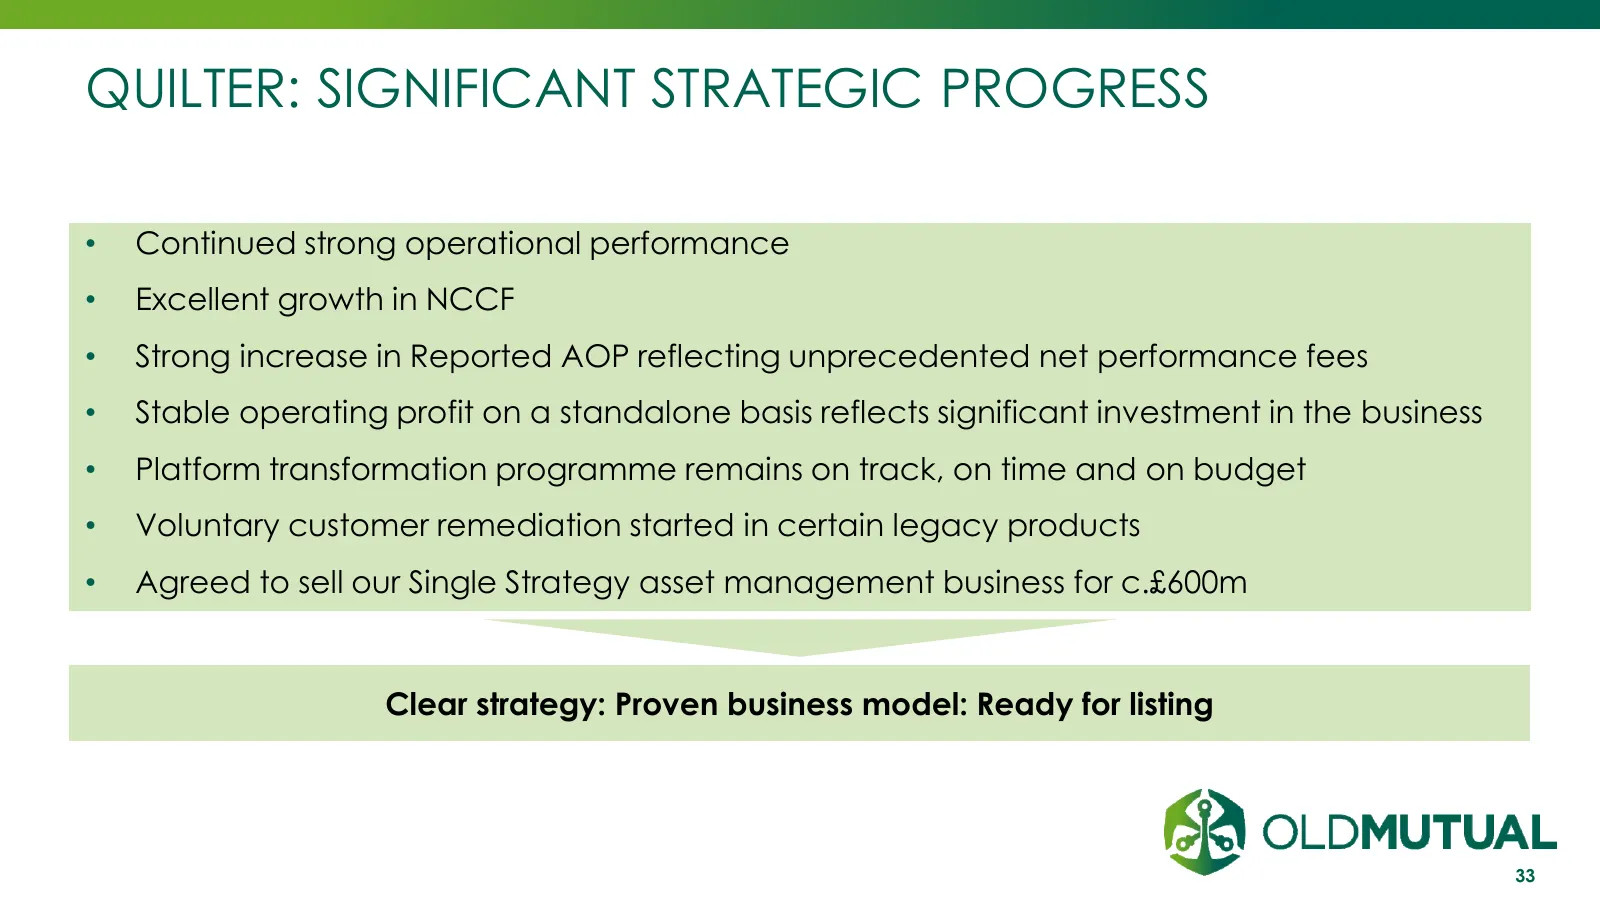
Slide 33: Quilter: Significant strategic progress
QUILTER: SIGNIFICANT STRATEGIC PROGRESS • Continued strong operational performance • Excellent growth in NCCF • Strong increase in Reported AOP reflecting unprecedented net performance fees • Stable operating profit on a standalone basis reflects significant investment in the business • Platform tra
Slide 34: Concluding Remarks
CONCLUDING REMARKS Bruce Hemphill 15 March 2018 INVESTMENT | SAVINGS | INSURANCE | BANKING
Slide 35: Concluding remarks
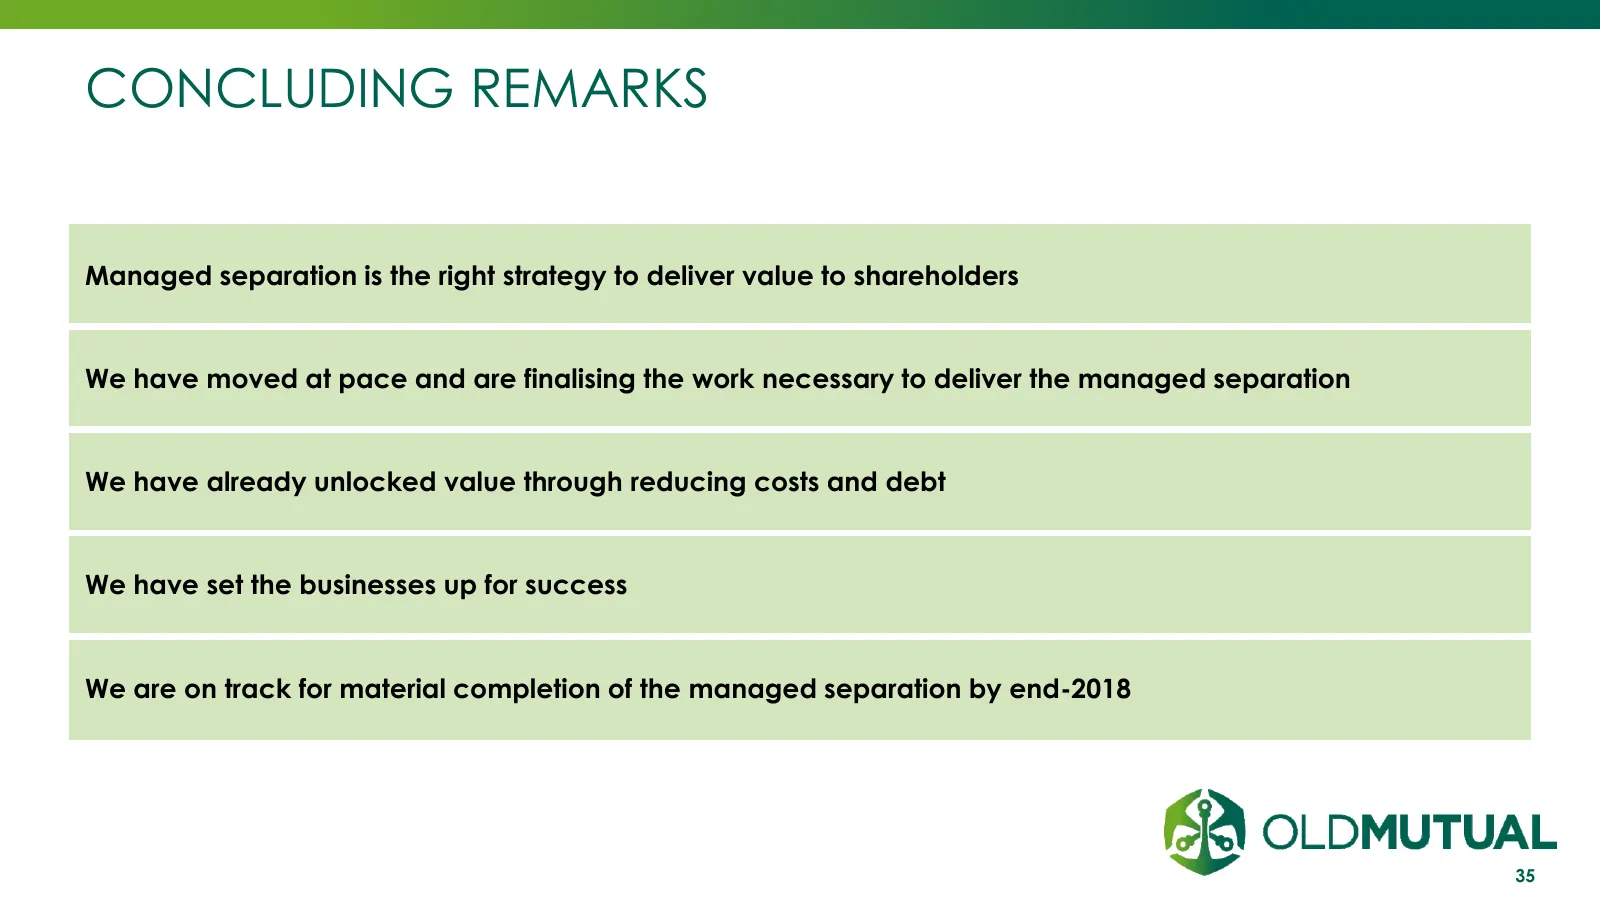
CONCLUDING REMARKS Managed separation is the right strategy to deliver value to shareholders We have moved at pace and are finalising the work necessary to deliver the managed separation We have already unlocked value through reducing costs and debt We have set the businesses up for success We are o

Slide 36: Q&A
Q&A 15 March 2018 INVESTMENT | SAVINGS | INSURANCE | BANKING
Source: Internet Archive copy of oldmutual.com
More decks from Old Mutual Ltd.
 FY2025 Earnings Presentation46 slides · Oct 12, 2026
 Q2 2026 Earnings Presentation48 slides · Sep 8, 2026
 H1 2025 Earnings Presentation45 slides · Sep 10, 2025
 FY2024 Earnings Presentation40 slides · Mar 18, 2025
 FY2023 Earnings Presentation39 slides · Mar 27, 2024
 H1 2024 Earnings Presentation33 slides · 2024