National Financial Partners Corp
National Financial Partners — Investor Presentation (September 2010)
33 slides from National Financial Partners's investor presentation, Sep 7, 2010

Slide 1: Investor Presentation Fall 2010
INVESTOR PRESENTATION Fall 2010 Exhibit 99.1

Slide 2: Related to Forward-Looking Statements
Related to Forward-Looking Statements Certain items in this presentation and in today’s discussion, including matters relating to revenue, net income, Adjusted EBITDA, cash earnings, cash earnings per diluted share and percentages or calculations using these measures, acquisitions, capital structure

Slide 3: Related to Non-GAAP Financial Information
Related to Non-GAAP Financial Information The Company analyzes its performance using historical and forward-looking non-GAAP measures called Adjusted EBITDA, cash earnings, cash earnings per diluted share, adjusted income before management fees and percentages or calculations using these measures. T

Slide 4: Jessica M. Bibliowicz
JESSICA M. BIBLIOWICZ Chairman, President and Chief Executive Officer

Slide 5: Who We Are
#9 Top Insurance Broker Globally (Best’s Review) Who We Are Leading provider of benefits, insurance and wealth management services Diverse client segments/strong demographic trends in target markets Corporate Client Group Individual Client Group Advisor Services Group Built through organic growth an
Slide 6: Leading independent distributor with national distribution network
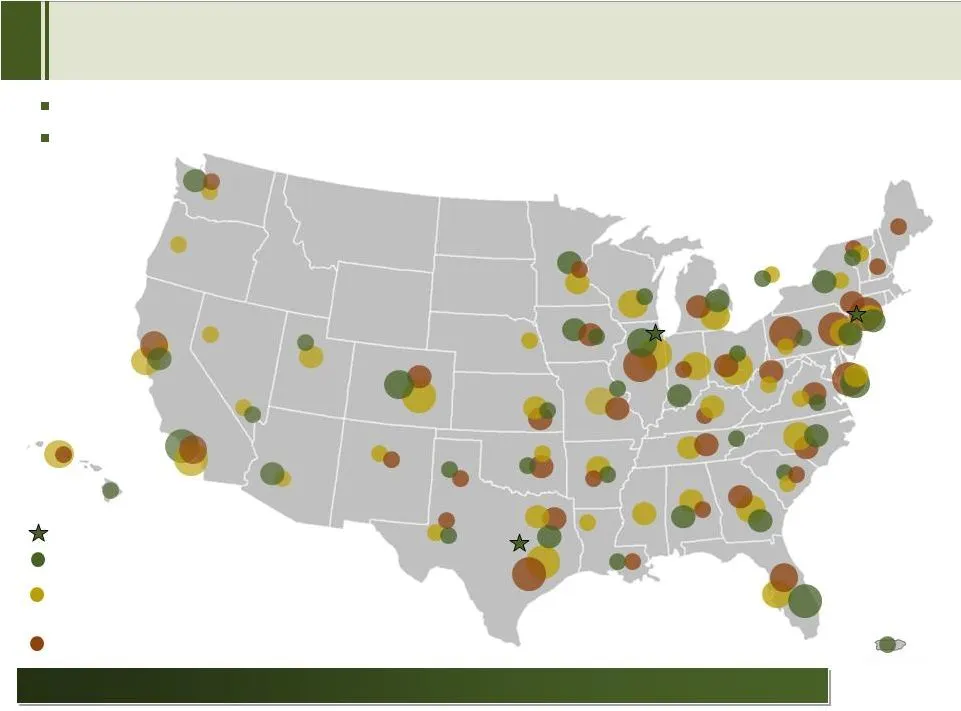
Leading independent distributor with national distribution network National Distribution Licensed in 50 states, Puerto Rico & Canada Locations in 44 states, Puerto Rico & Canada Corporate Office NFP Owned Firms Members of PartnersFinancial, Benefits Partners and The HighCap Group NFPSI Registered Re
Slide 7: NFP's Value Added
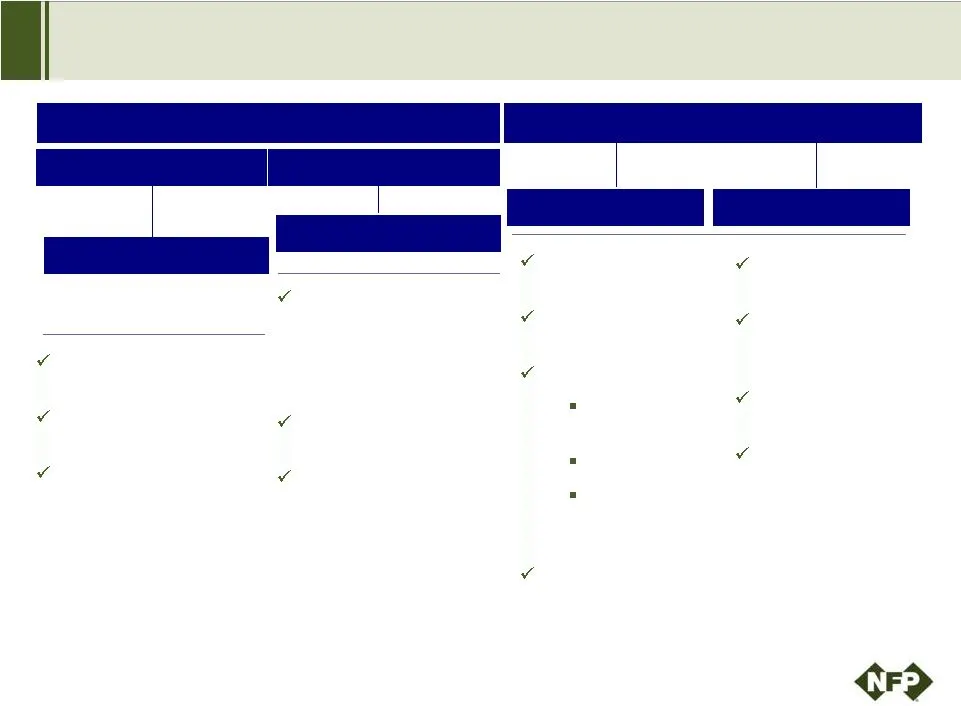
NFP’s Value Added Local expertise backed by national brand; provides best products & services to clients Open Architecture The NFP logo is a registered trademark of National Financial Partners Corp. All other trademarks used herein are the property of their respective owners. Preferred vendor relati
Slide 8: Evolution of NFP
Life Insurance Recurring Revenue INTERNAL INTEGRATION BUILDING SCALE 1998 - 2003 2004 - 2008 2009 2010 Evolution of NFP Life insurance acquisitions Targeted successful entrepreneurs Economic alignment Enhanced earnings quality — approximately 70% of acquisitions were benefits, platform firms & inves

Slide 9: Strength of Distribution Network
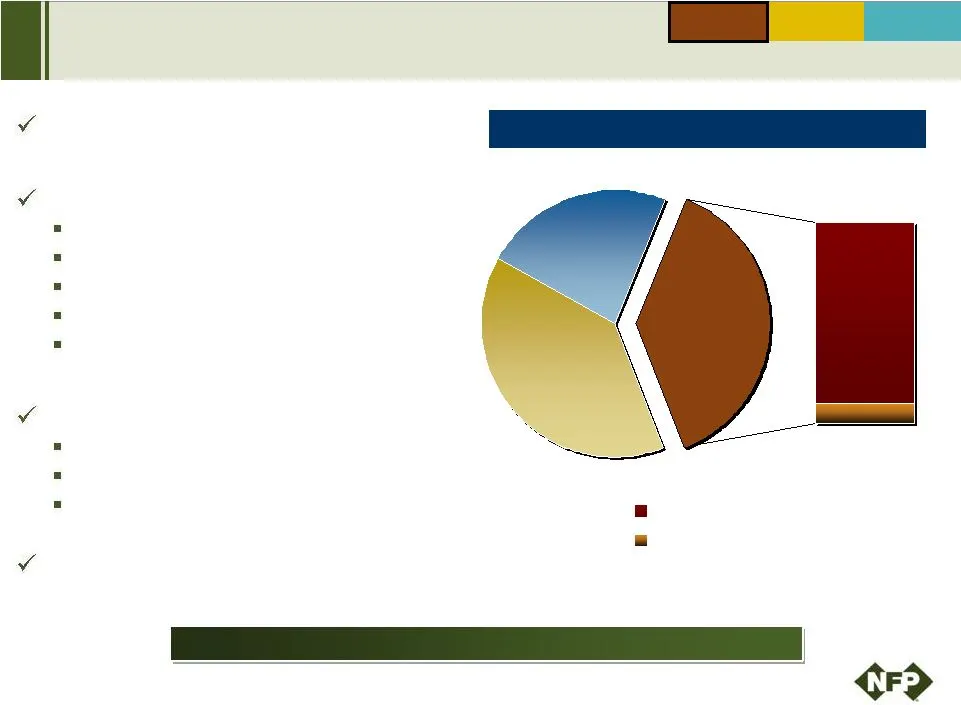
Strong relationships with key principals ensure motivation and retention Strength of Distribution Network Quality professionals History of growth/future motivation Diverse areas of expertise Experienced prior to joining NFP Extensive M&A due diligence Financial performance Professional reputation Ec
Slide 10: Corporate Client Group (CCG)
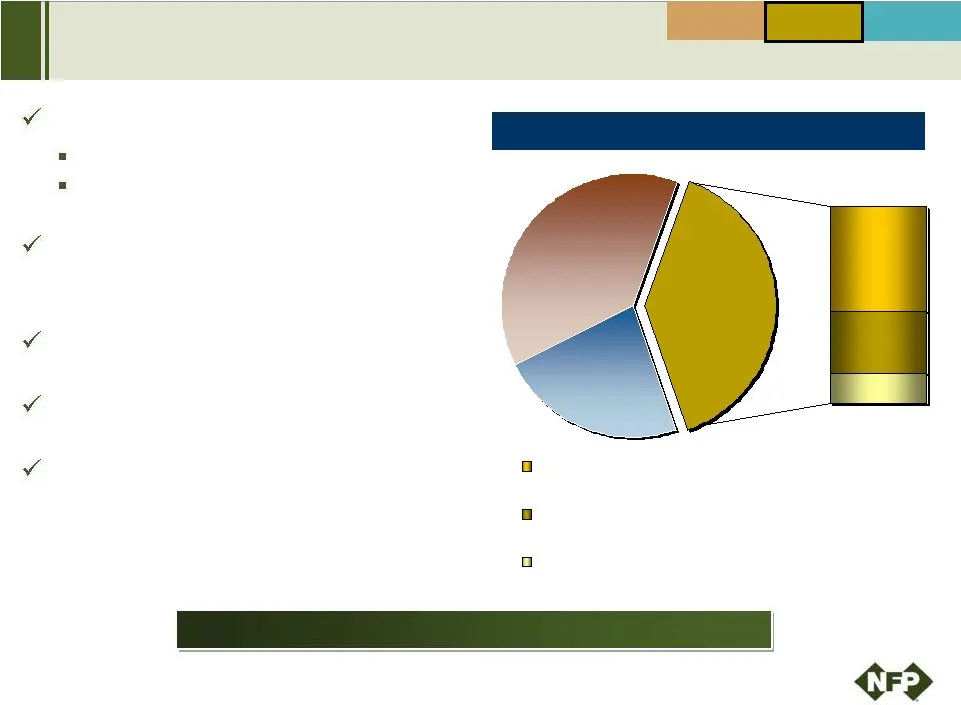
38% 10% 90% 2Q10 Revenue Breakdown CCG 2Q10 Organic revenue growth +3.7% INDIVIDUAL CLIENT GROUP CORPORATE CLIENT GROUP ADVISOR SERVICES GROUP NFP Corporate Benefits NFP Executive Benefits Corporate Client Group (CCG) A leader in corporate middle market Coordinated independent solutions Health & wel
Slide 11: Individual Client Group (ICG)
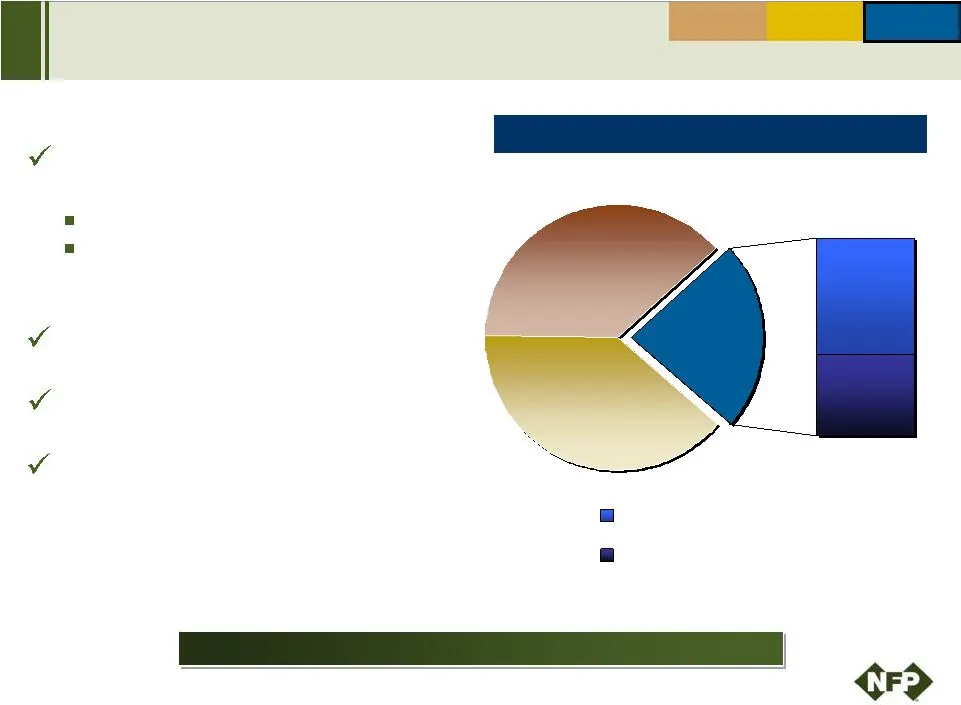
39% ICG 2Q10 Organic revenue growth +5.5% 2Q10 Revenue Breakdown INDIVIDUAL CLIENT GROUP CORPORATE CLIENT GROUP ADVISOR SERVICES GROUP 31% 15% 54% NFP Marketing Organization & Wholesale Life Brokerage NFP Retail Life NFP Investment Advisory Individual Client Group (ICG) A leader in independent deliv
Slide 12: Advisor Services Group (ASG)
23% 41% 59% ASG 2Q10 Organic revenue growth +16.0% 2Q10 Revenue Breakdown INDIVIDUAL CLIENT GROUP CORPORATE CLIENT GROUP ADVISOR SERVICES GROUP NFP Asset Based Fees NFP Commissions Advisor Services Group (ASG) Serves independent financial advisors Broker-dealer Corporate registered investment adviso

Slide 13: Growth Strategy
Growth Strategy Organic growth drivers Client-centric organization structure Regional service offerings Long-term margin opportunities Diversification and cross-selling Incentive plans Enhancing value of NFP brand across business lines External growth drivers Return to acquisitions Focus on recurrin

Slide 14: NFP's leadership recognized across business lines
NFP’s leadership recognized across business lines NFP Rankings #9 Top Insurance Broker Globally ( Best ’ s Review ) #1 Executive Benefits Provider by Non-Qualified Deferred Compensation Plans Administered ( PlanSponsor ) #1 independent distributor for top- tier carriers ( carrier data ) Top 10 Indep

Slide 15: Donna J. Blank
DONNA J. BLANK Chief Financial Officer

Slide 16: Financial Strengths
Financial Strengths Recent financial performance Strong operating cash flow Economic alignment Expanding recurring revenue Margin focus Financial flexibility
Slide 17: 2Q10 Financial Highlights
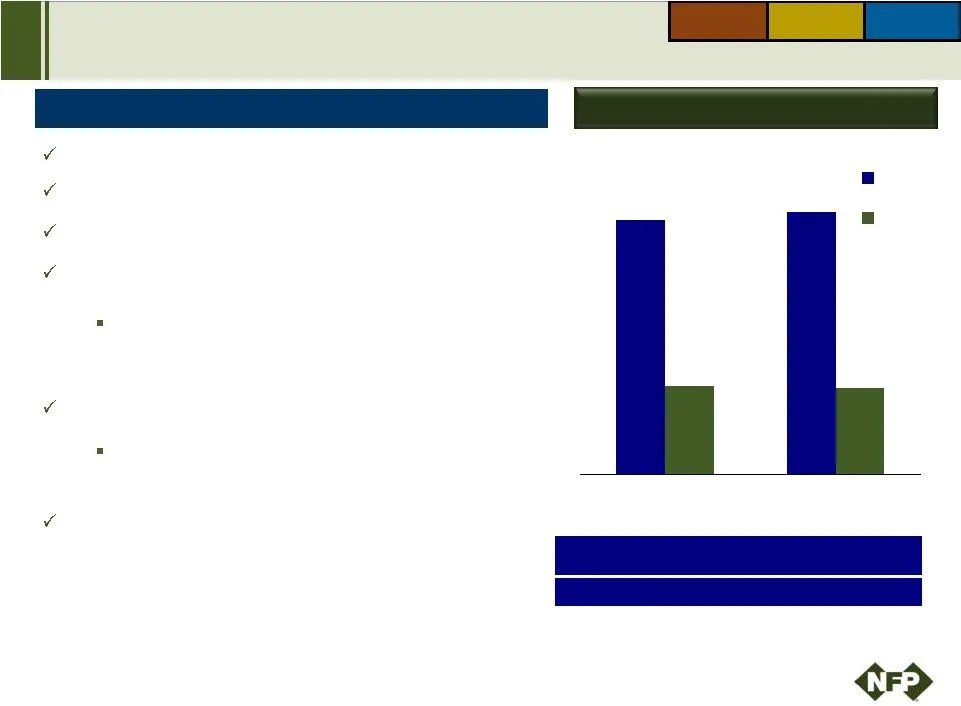
INDIVIDUAL CLIENT GROUP CORPORATE CLIENT GROUP ADVISOR SERVICES GROUP 2Q09 2Q10 Adjusted EBITDA Margin % Revenue & Adjusted EBITDA Overview of Results Revenue $234.9 million, +4.8% Organic revenue growth +7.3% Recurring revenue 58% versus 55% in 2Q09 Adjusted EBITDA $26.3 million Margin impacted by
Slide 18: Quarterly/Annual Operating Cash Flow
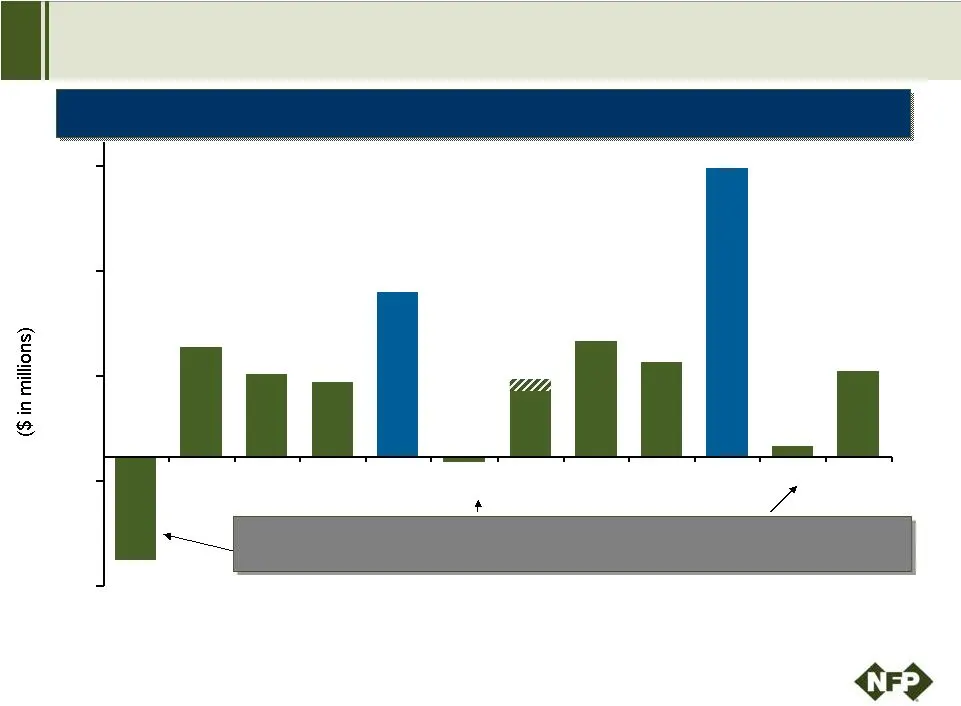
Quarterly/Annual Operating Cash Flow In Q1, larger payments to Principals typically occur as management fee bonuses for prior year performance are paid Quarterly/Annual Operating Cash Flow Strong Operating Cash Flow (1) Q1 and 12/31/08 YTD acquisitions include $14.4 million paid in connection with a
Slide 19: Economic Alignment
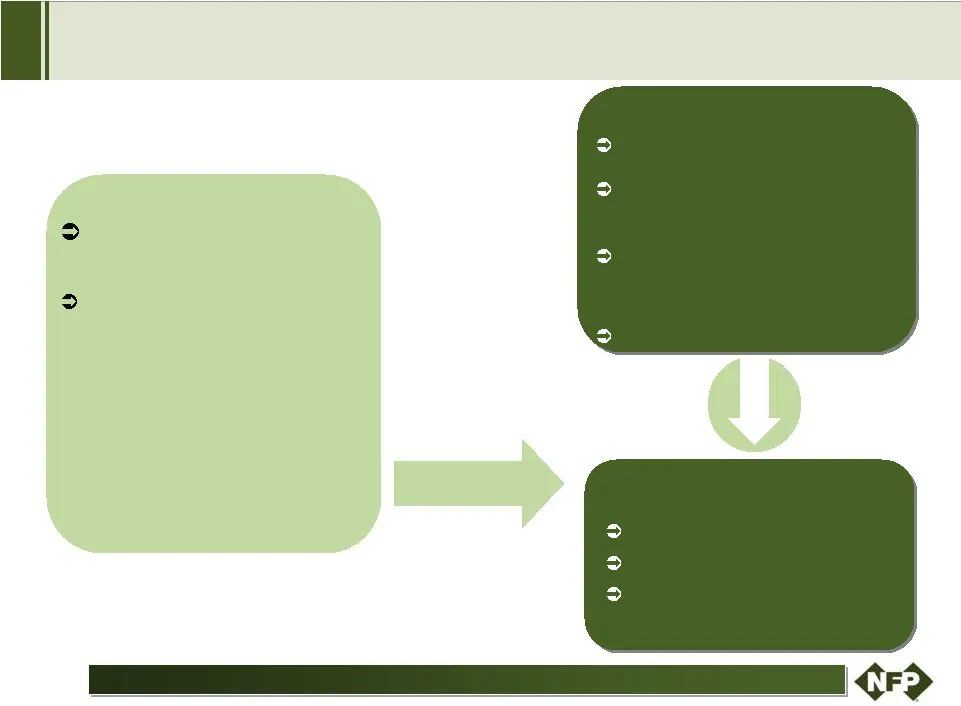
Wholly owned NFP subsidiary Managed by principals Employees of subsidiary OPERATING COMPANY Wholly-owned by principals After NFP priority, % of pre-tax profits earned as management fees 3/5 year evergreen non- compete/non-solicit upon principals’ exits Succession asset MANAGEMENT COMPANY Economic st

Slide 20
Slide 21: Annual Revenue
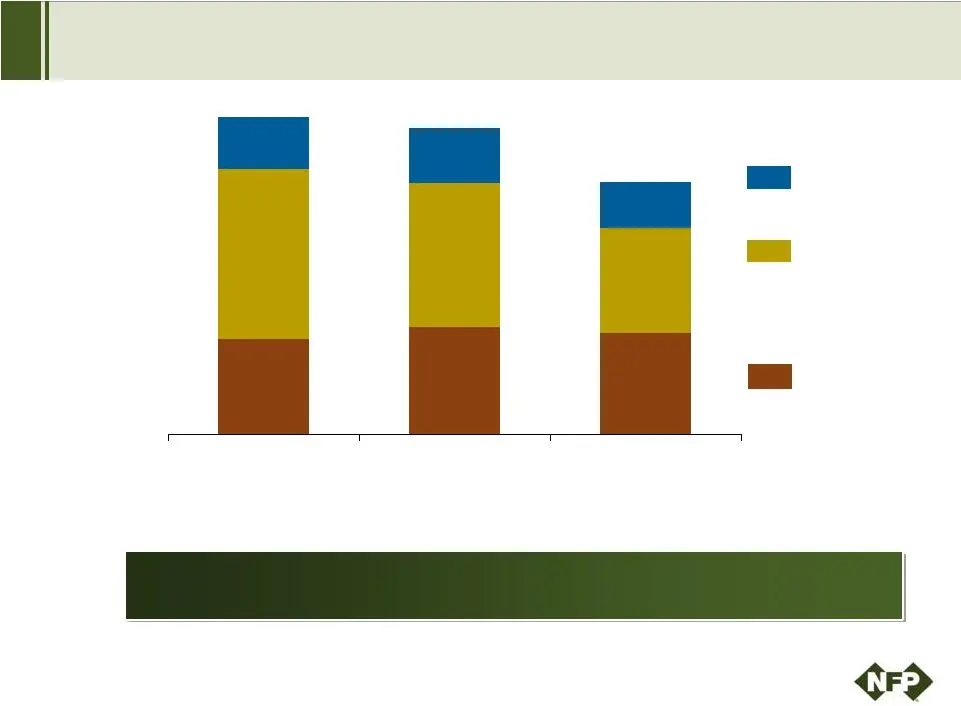
$361 $405 $380 $640 $538 $397 $194 $207 $171 Revenue impacted by life insurance market challenges; increased recurring revenue base Annual Revenue $1,194 $1,150 $948 (1) Advisor Services Group Individual Client Group Corporate Client Group ($ in millions) Recurring Revenue as % of Total Revenue (2)
Slide 22: Quarterly Revenue
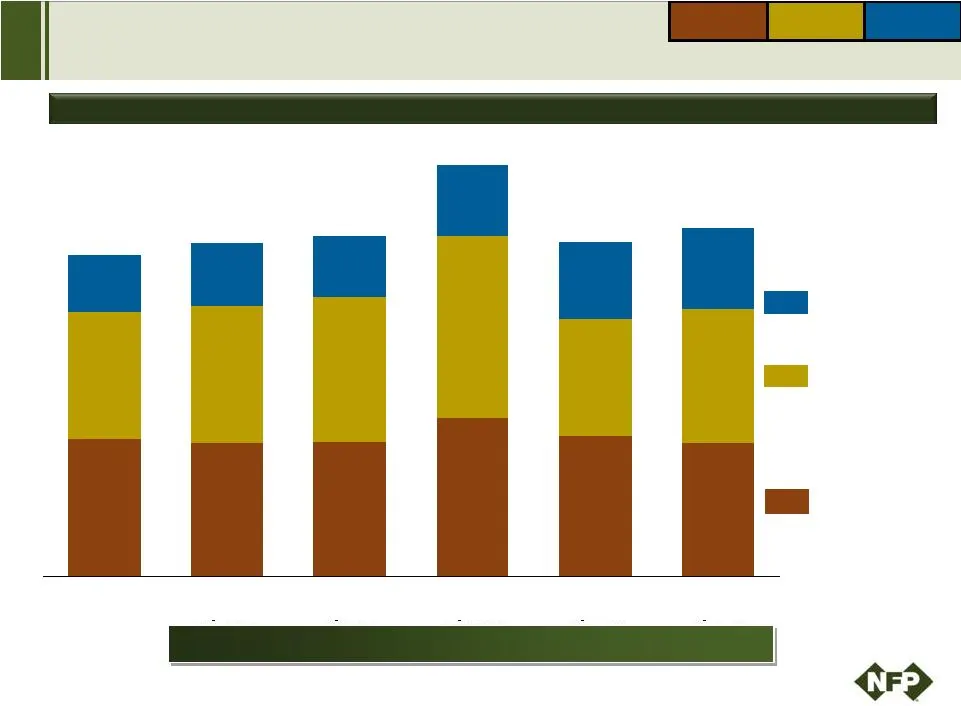
Revenue INDIVIDUAL CLIENT GROUP CORPORATE CLIENT GROUP ADVISOR SERVICES GROUP $92.5 $89.8 $90.7 $95.2 $89.5 $41.8 $107.0 $54.0 $51.3 $41.9 $39.4 $47.8 Seasonality within each business segment INDIVIDUAL CLIENT GROUP CORPORATE CLIENT GROUP ADVISOR SERVICES GROUP $85.1 $92.4 $97.4 $91.4 $78.7 $122.4 Q
Slide 23: Revenue growth has turned positive in 2010
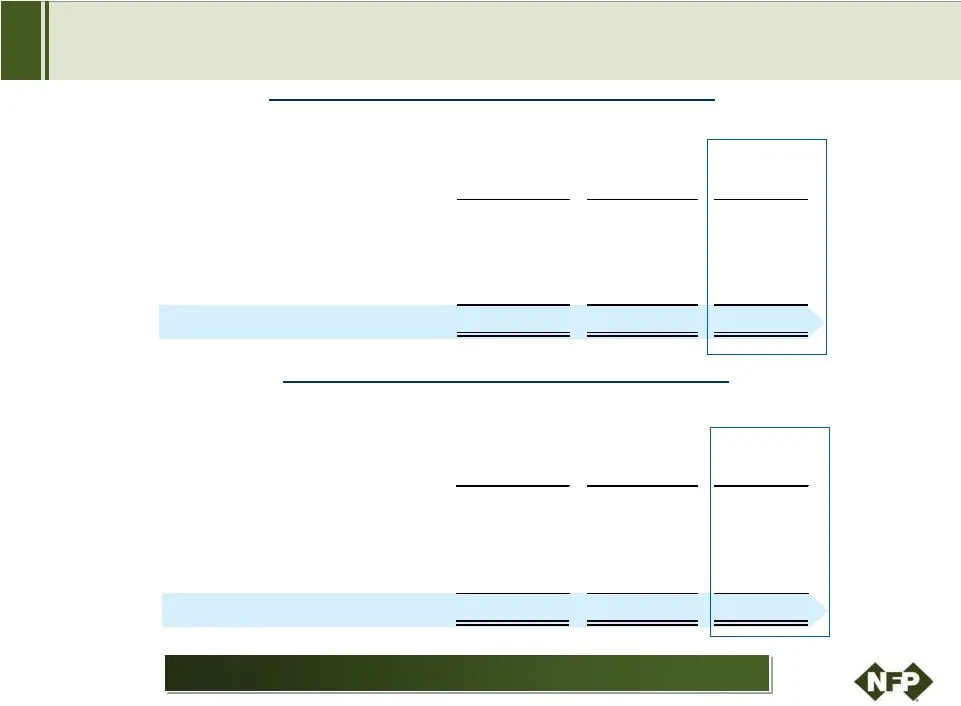
Consolidated Revenue growth has turned positive in 2010 FY FY YTD Corporate Client Group 12.3% -6.2% 1.3% Individual Client Group -15.9% -26.2% -4.2% Advisor Services Group 6.8% -17.4% 29.5% Consolidated -3.7% -17.6% 4.3% Organic Revenue Growth TOTAL REVENUE GROWTH ORGANIC REVENUE GROWTH FY FY YTD C
Slide 24: Annual Adjusted EBITDA
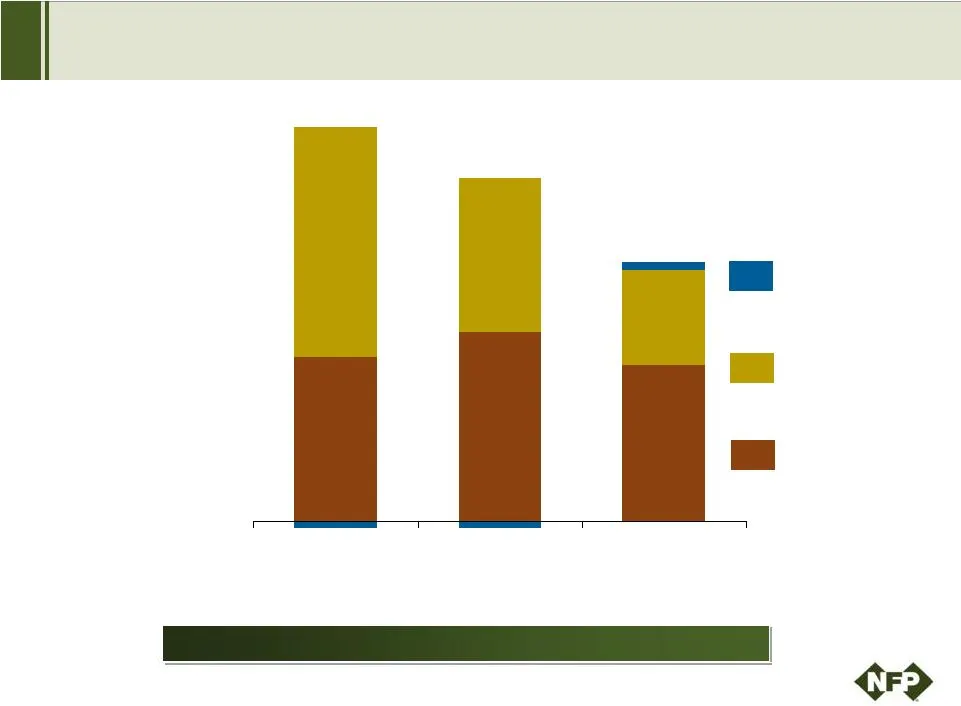
$70 $81 $67 $98 $65 $40 Margin % stable in 2009 despite revenue declines Annual Adjusted EBITDA Adjusted EBITDA Margin (1) Sum of the segments may not agree to total due to rounding. $3 -$3 -$2 $166 $144 $110 Advisor Services Group Individual Client Group Corporate Client Group ($ in millions) (1) 1
Slide 25: Quarterly Adjusted EBITDA Margin
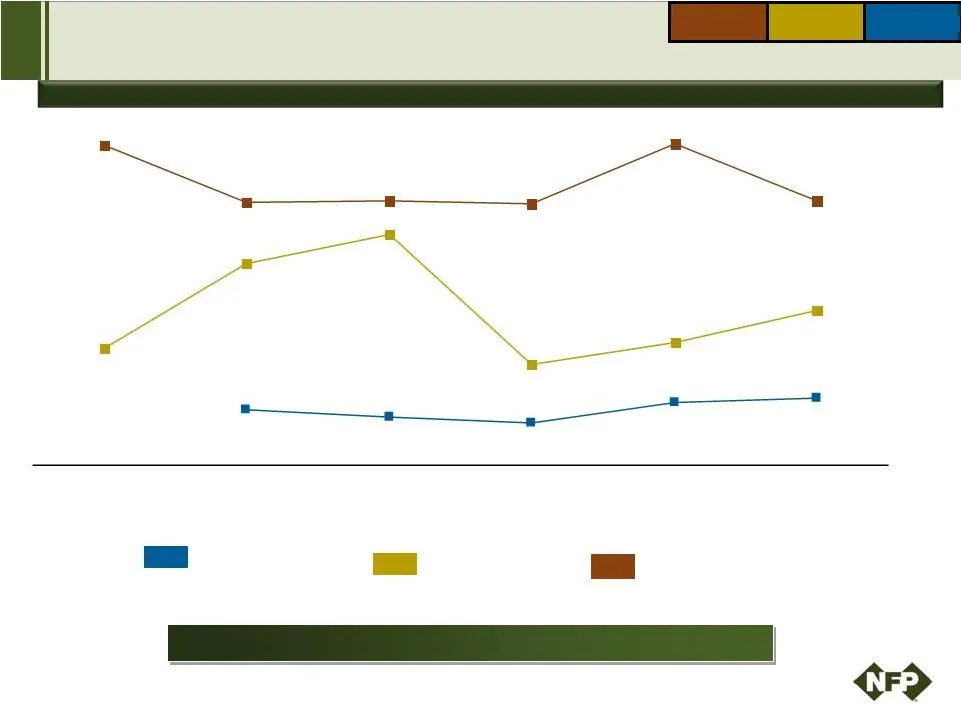
INDIVIDUAL CLIENT GROUP CORPORATE CLIENT GROUP ADVISOR SERVICES GROUP Margin % differs across business segments Adjusted EBITDA Margin % INDIVIDUAL CLIENT GROUP CORPORATE CLIENT GROUP ADVISOR SERVICES GROUP Advisor Services Group Corporate Client Group Individual Client Group Quarterly Adjusted EBIT
Slide 26: Debt Maturity Profile – Financial Flexibility
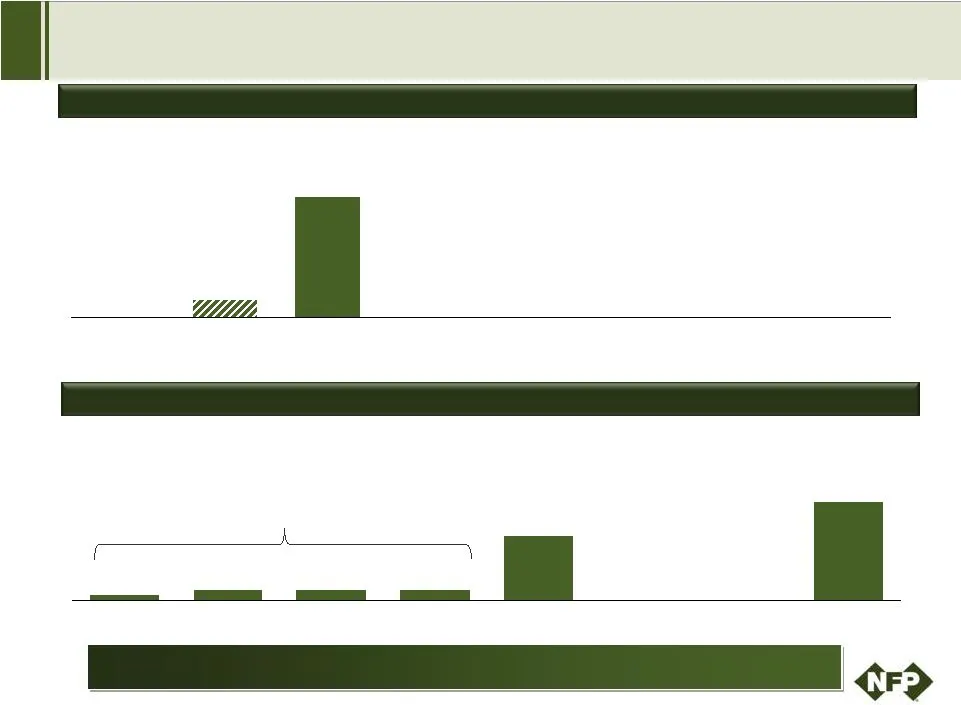
Maturity Profile as of 3/31/10 Maturity Profile as of 9/1/10 Lengthened debt maturities; spread future principal payments Debt Maturity Profile – Financial Flexibility $35.0 $230.0 $81.3 $12.5 $12.5 $12.5 $6.3 $125.0 Senior Secured Credit Facility Convertible Senior Notes Senior Secured Credit Facil

Slide 27: Balance Sheet/Recapitalization Highlights
Extinguishment of June 30, 2010 Term 2007 Convertible June 30, 2010 2010 (1) Loan (2) Notes (3) Pro Forma (4) Balance Sheet/Recapitalization Highlights (1) The Company completed its issuance of the 2010 Convertible Notes on June 15, 2010. (2) The Company closed its 2010 credit facility on July 8, 20

Slide 28: Well Positioned For the Future
Well Positioned For the Future Leader in benefits, insurance and wealth management Attractive markets Historical growth organically and through acquisitions Open architecture Financial flexibility Focus on long-term growth Organic growth opportunities Diversification and cross selling Acquisitions a

Slide 29: Cro
Cro NATIONAL FINANCIAL PARTNERS

Slide 30: Cro
Cro NATIONAL FINANCIAL PARTNERS

Slide 31: Reconciliation: Net Income to Cash Earnings
Reconciliation: Net Income to Cash Earnings (Dollars in thousands, except per share data) (1) Cash earnings is a non-GAAP measure, which the Company defines as net income excluding amortization of intangibles, depreciation, the after-tax impact of the impairment of goodwill and intangible assets and

Slide 32: Reconciliation: Net Income to Adjusted EBITDA
Corporate Individual Advisor Client Group Client Group Services Group Consolidated Reconciliation: Net Income to Adjusted EBITDA (1) Adjusted EBITDA is a non-GAAP measure, which the Company defines as net income excluding income tax expense, interest income, interest expense, other, net, amortizatio

Slide 33: Fall 2010
INVESTOR PRESENTATION FALL 2010
Source: SEC EDGAR · 8-K filed Sep 7, 2010
More decks from National Financial Partners Corp
 Q4 2012 Earnings Presentation19 slides · Feb 15, 2013
 Q3 2012 Earnings Presentation18 slides · Oct 31, 2012
 Q2 2012 Earnings Presentation19 slides · Jul 31, 2012
 Q1 2012 Earnings Presentation19 slides · Apr 27, 2012
 Q4 2011 Earnings Presentation18 slides · Feb 8, 2012
 Q3 2011 Earnings Presentation19 slides · Oct 28, 2011