Dynegy — Power and Gas Deep Dive Conference (Wolfe Trahan & Co.) 2013
34 slides from Dynegy's conference presentation, Apr 11, 2013
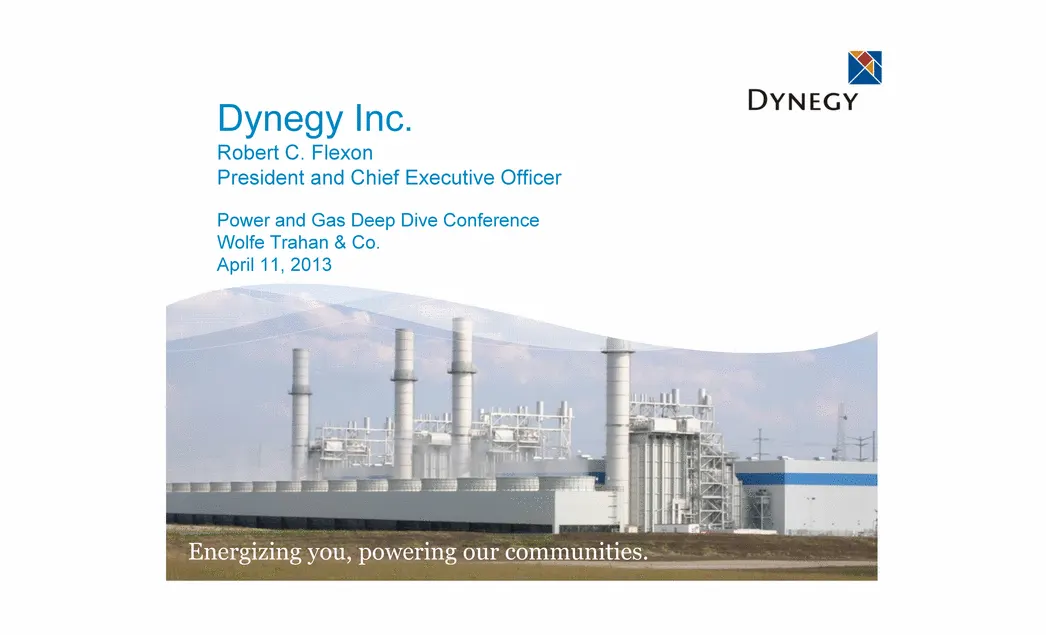
Slide 1: Dynegy Inc. Power and Gas Deep Dive Conference
Dynegy Inc. Robert C. Flexon President and Chief Executive Officer Power and Gas Deep Dive Conference Wolfe Trahan & Co. April 11, 2013
Slide 2: Cautionary Statement Regarding Forward-Looking Statements
Cautionary Statement Regarding Forward-Looking Statements This presentation contains statements reflecting assumptions, expectations, projections, intentions or beliefs about future events that are intended as “forward looking statements.” You can identify these statements by the fact that they do n
Slide 3: Agenda
3 Agenda Company Overview Refinancing Overview Dynegy’s Proposed Acquisition of Ameren Energy Resources Summary and Q&A
Slide 4: Company Overview
Company Overview DYNEGY
Slide 5: Dynegy's diverse asset portfolio
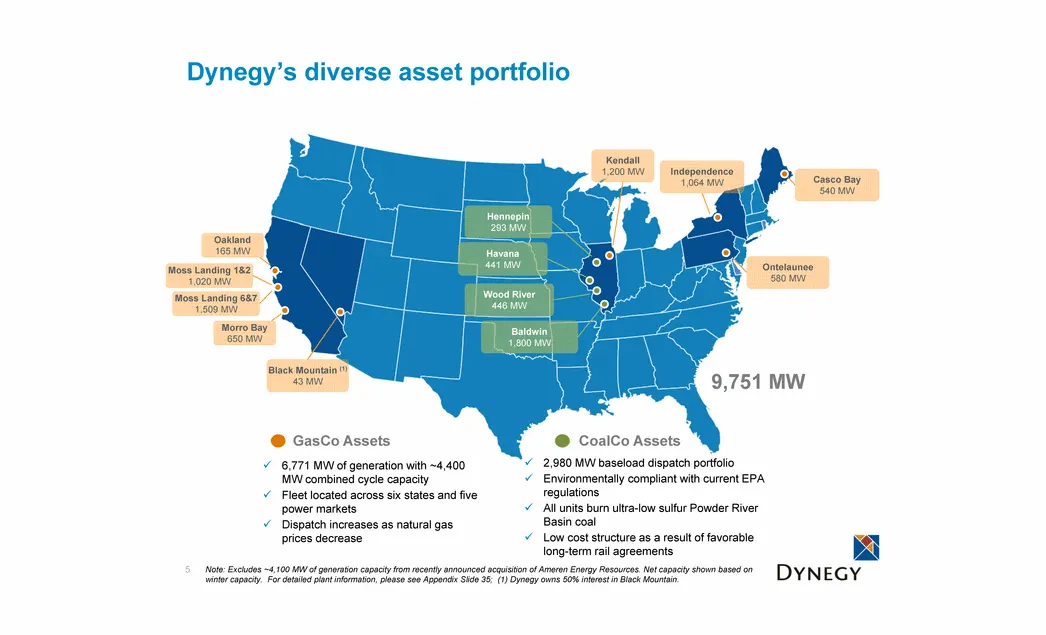
5 Dynegy’s diverse asset portfolio Oakland 165 MW Moss Landing 1&2 1,020 MW Moss Landing 6&7 1,509 MW Morro Bay 650 MW 6,771 MW of generation with ~4,400 MW combined cycle capacity Fleet located across six states and five power markets Dispatch increases as natural gas prices decrease GasCo Assets C
Slide 6: Dynegy: Key Investment Considerations
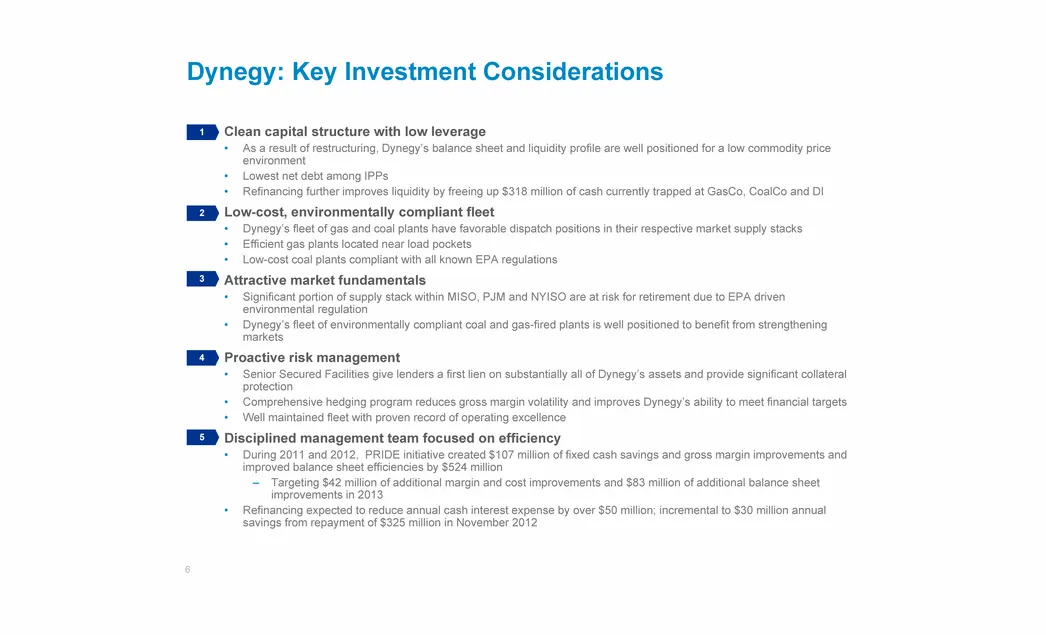
Dynegy: Key Investment Considerations Clean capital structure with low leverage As a result of restructuring, Dynegy’s balance sheet and liquidity profile are well positioned for a low commodity price environment Lowest net debt among IPPs Refinancing further improves liquidity by freeing up $318 mi
Slide 7: Clean capital structure with low leverage
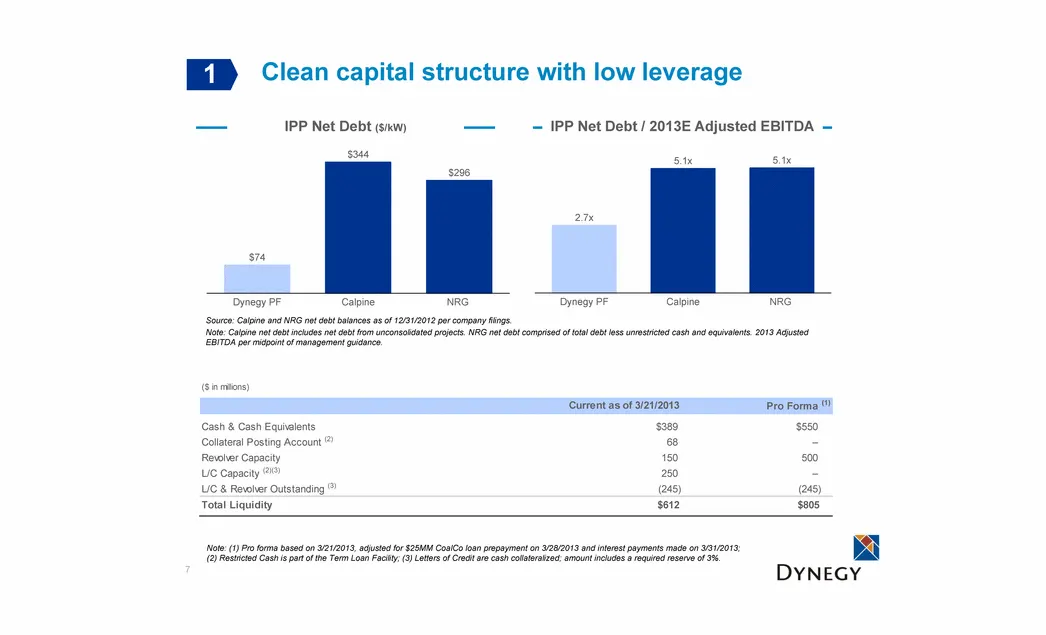
7 Clean capital structure with low leverage 1 IPP Net Debt ($/kW) IPP Net Debt / 2013E Adjusted EBITDA Note: (1) Pro forma based on 3/21/2013, adjusted for $25MM CoalCo loan prepayment on 3/28/2013 and interest payments made on 3/31/2013; (2) Restricted Cash is part of the Term Loan Facility; (3) Le
Slide 8: GasCo fleet benefits in both low and high gas price environments
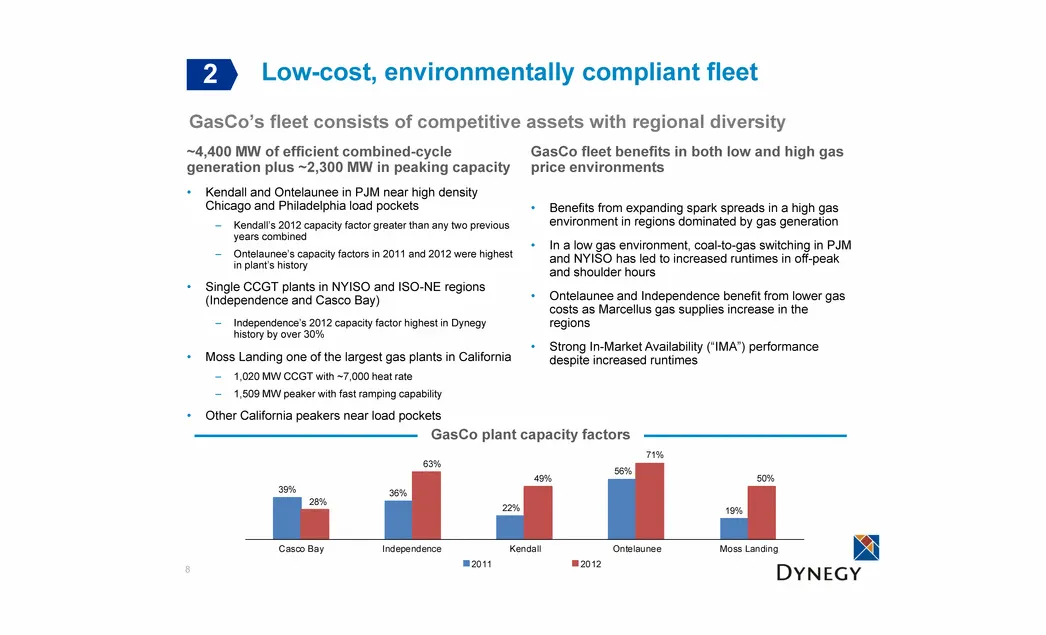
GasCo fleet benefits in both low and high gas price environments Benefits from expanding spark spreads in a high gas environment in regions dominated by gas generation In a low gas environment, coal-to-gas switching in PJM and NYISO has led to increased runtimes in off-peak and shoulder hours Ontela
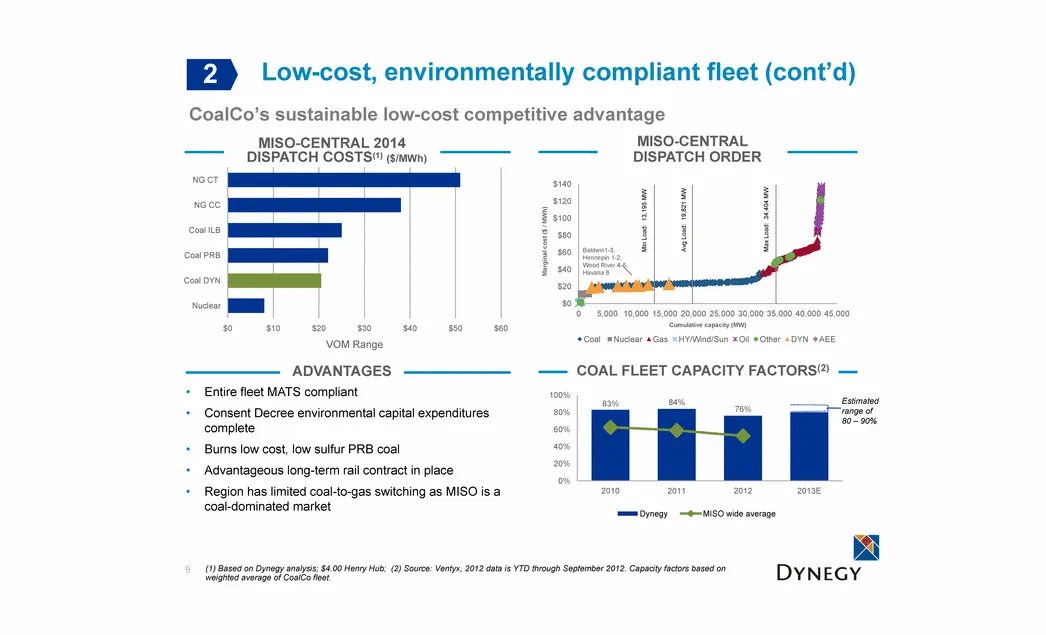
Slide 9: Low-cost, environmentally compliant fleet: CoalCo dispatch costs
MISO-CENTRAL 2014 DISPATCH COSTS(1) ($/MWh) MISO-CENTRAL DISPATCH ORDER Entire fleet MATS compliant Consent Decree environmental capital expenditures complete Burns low cost, low sulfur PRB coal Advantageous long-term rail contract in place Region has limited coal-to-gas switching as MISO is a coal-
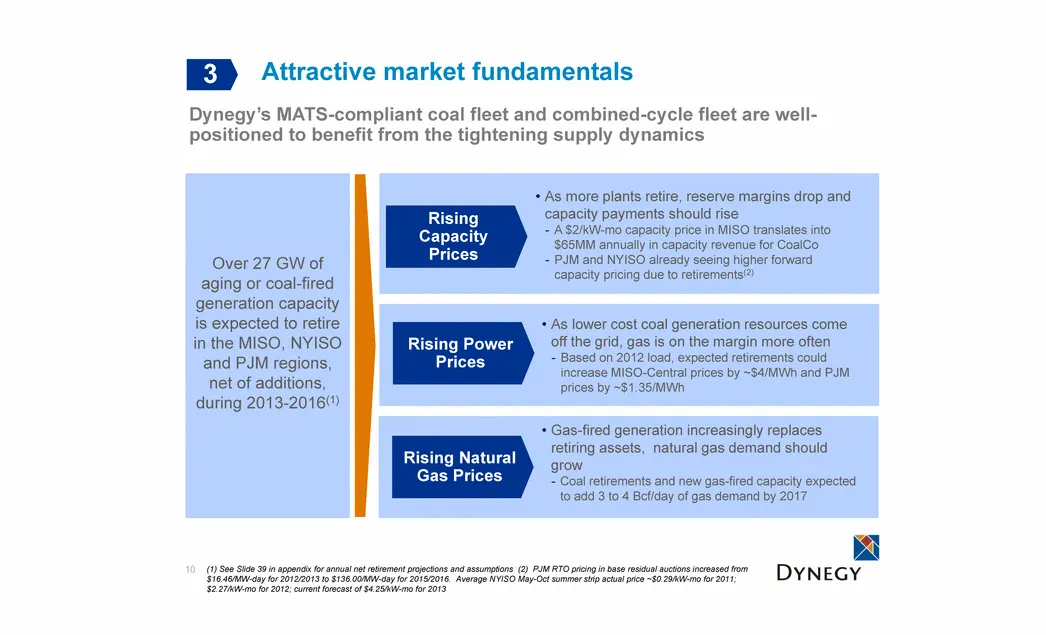
Slide 10: Attractive market fundamentals
Attractive market fundamentals 10 Rising Natural Gas Prices Rising Capacity Prices Rising Power Prices As more plants retire, reserve margins drop and capacity payments should rise A $2/kW-mo capacity price in MISO translates into $65MM annually in capacity revenue for CoalCo PJM and NYISO already s
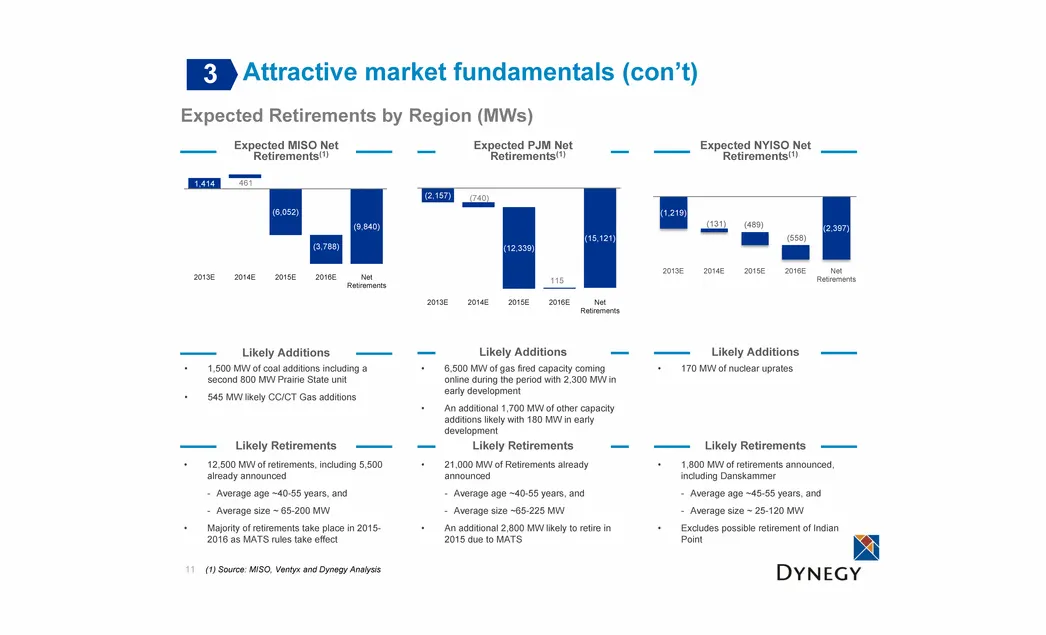
Slide 11: Attractive market fundamentals: expected net retirements
11 (1) Source: MISO, Ventyx and Dynegy Analysis Attractive market fundamentals (con’t) Expected MISO Net Retirements(1) 6,500 MW of gas fired capacity coming online during the period with 2,300 MW in early development An additional 1,700 MW of other capacity additions likely with 180 MW in early dev
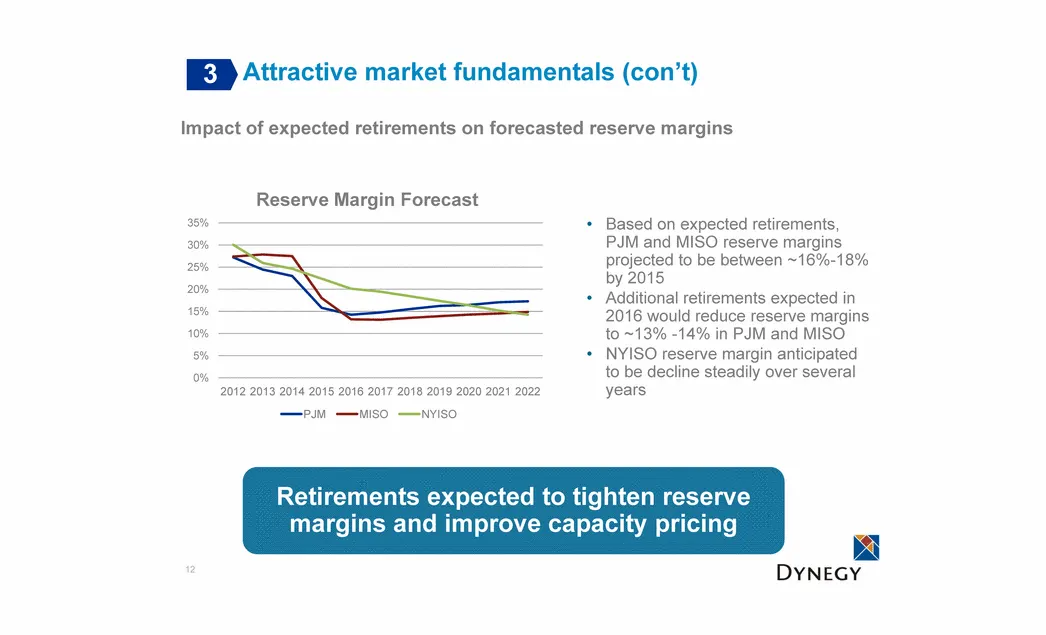
Slide 12: Attractive market fundamentals: reserve margins
12 Attractive market fundamentals (con’t) 3 Based on expected retirements, PJM and MISO reserve margins projected to be between ~16%-18% by 2015 Additional retirements expected in 2016 would reduce reserve margins to ~13% -14% in PJM and MISO NYISO reserve margin anticipated to be decline steadily o
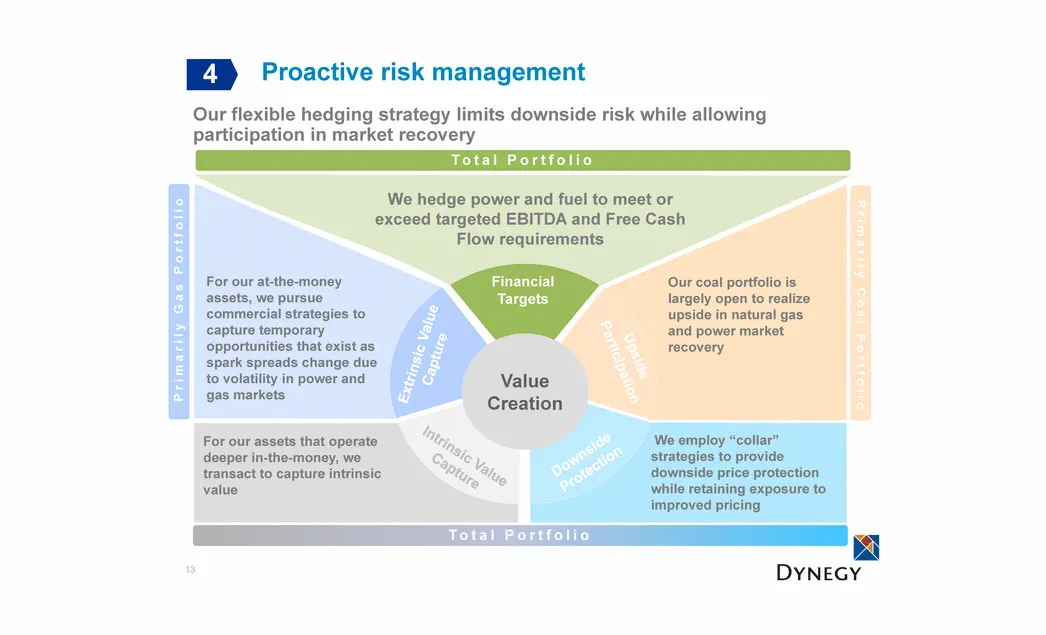
Slide 13: Value Creation: proactive risk management
Value Creation We hedge power and fuel to meet or exceed targeted EBITDA and Free Cash Flow requirements Our coal portfolio is largely open to realize upside in natural gas and power market recovery Upside Participation Downside Protection Extrinsic Value Capture Financial Targets Intrinsic Value Ca
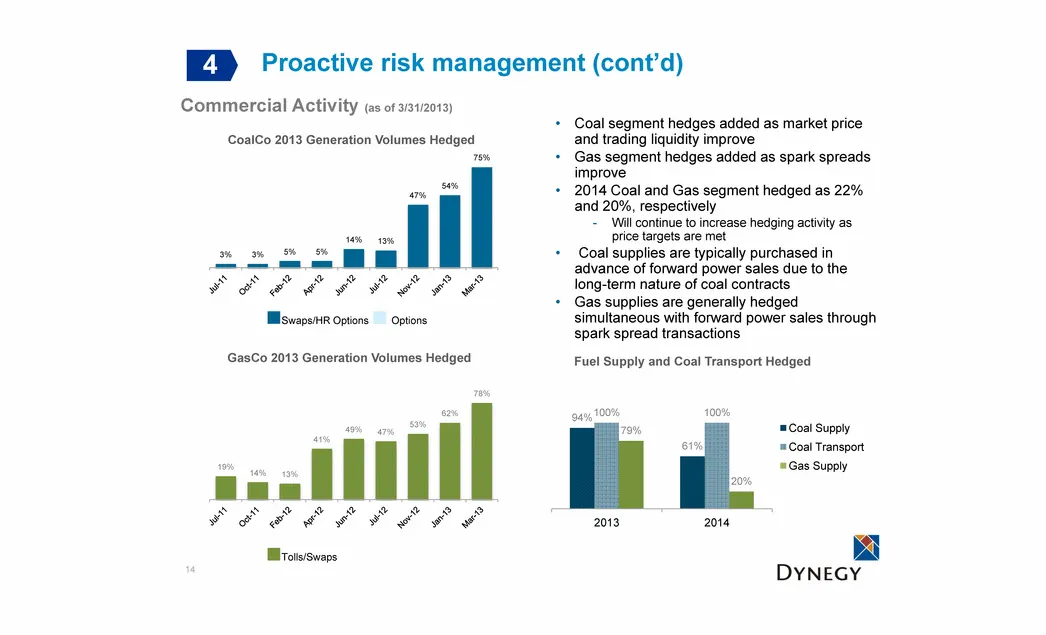
Slide 14: Commercial Activity and hedging
Commercial Activity (as of 3/31/2013) 14 Fuel Supply and Coal Transport Hedged Proactive risk management (cont’d) 4 Coal segment hedges added as market price and trading liquidity improve Gas segment hedges added as spark spreads improve 2014 Coal and Gas segment hedged as 22% and 20%, respectively
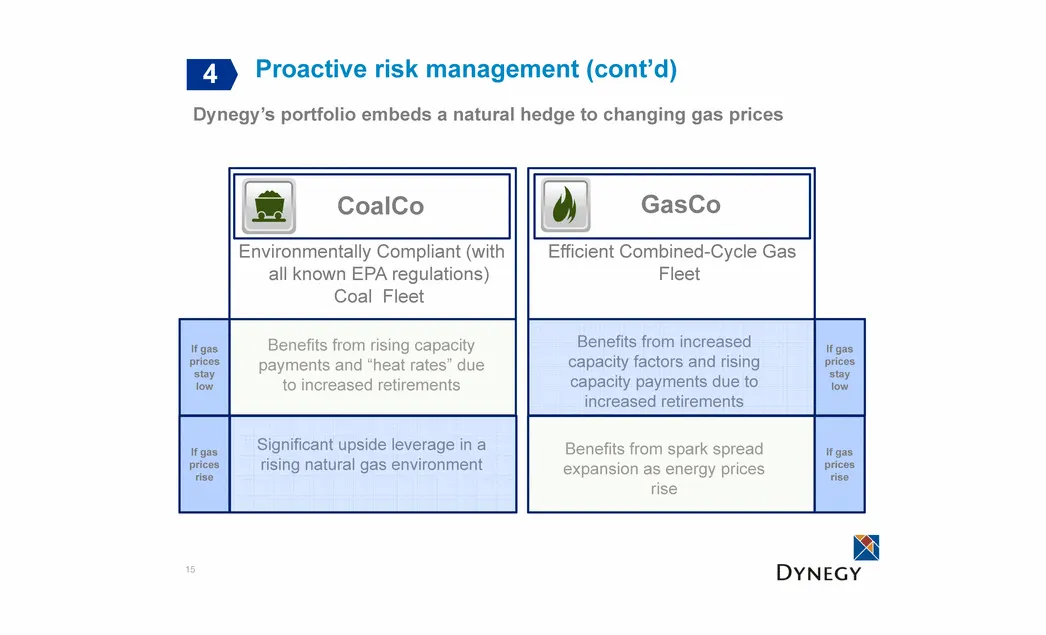
Slide 15: Natural hedge to changing gas prices
15 Environmentally Compliant (with all known EPA regulations) Coal Fleet If gas prices stay low If gas prices rise Benefits from rising capacity payments and “heat rates” due to increased retirements Significant upside leverage in a rising natural gas environment Benefits from increased capacity fac
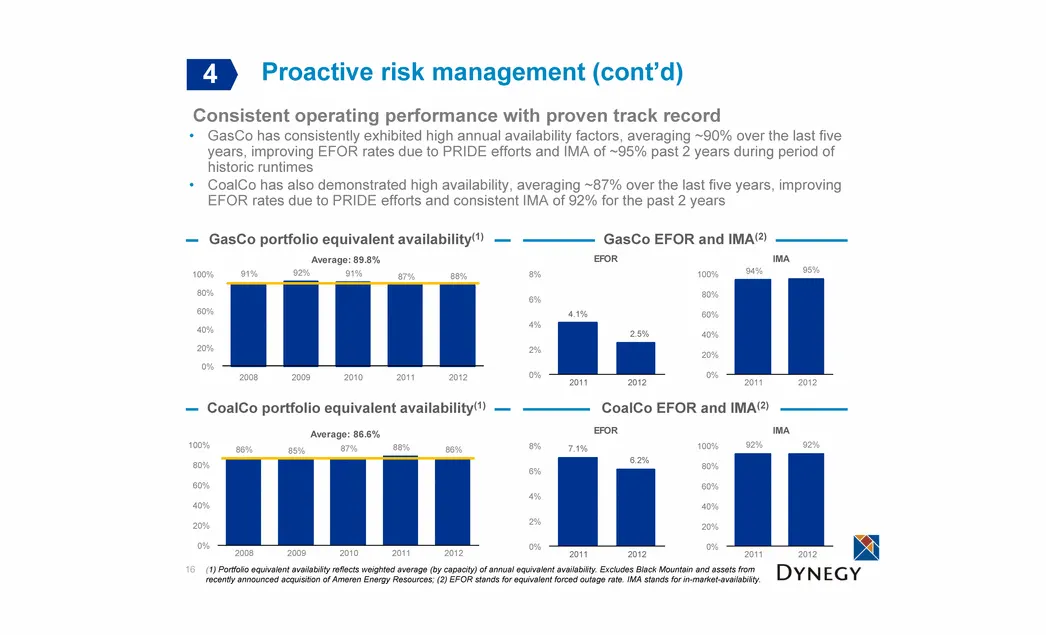
Slide 16: Consistent operating performance with proven track record
GasCo has consistently exhibited high annual availability factors, averaging ~90% over the last five years, improving EFOR rates due to PRIDE efforts and IMA of ~95% past 2 years during period of historic runtimes CoalCo has also demonstrated high availability, averaging ~87% over the last five year
Slide 17: PRIDE: Producing Results through Innovation by Dynegy Employees
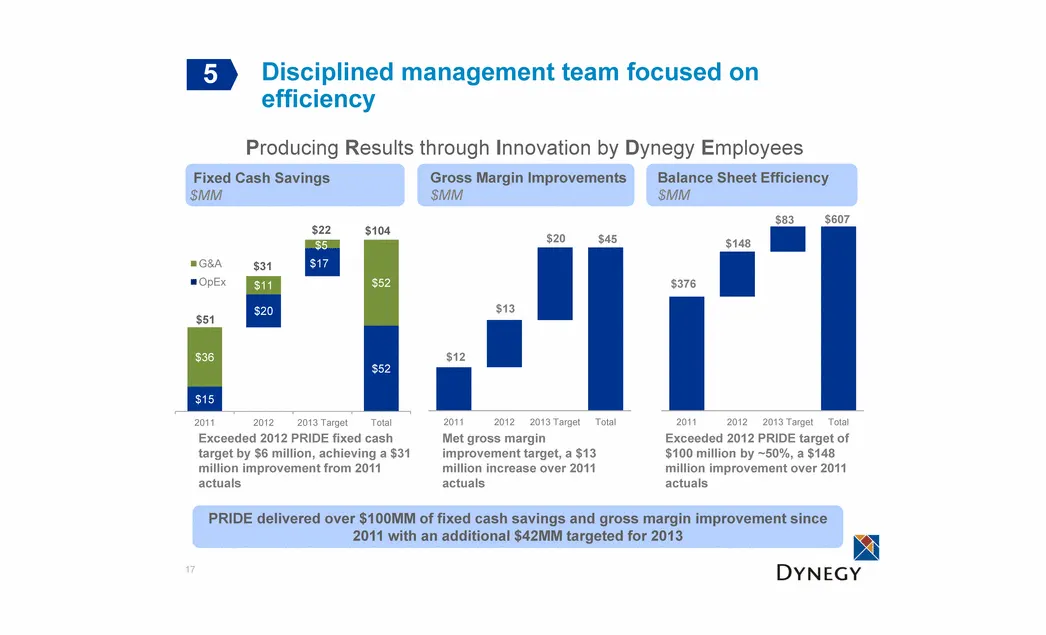
Fixed Cash Savings $MM Gross Margin Improvements $MM Balance Sheet Efficiency $MM Producing Results through Innovation by Dynegy Employees Exceeded 2012 PRIDE fixed cash target by $6 million, achieving a $31 million improvement from 2011 actuals Exceeded 2012 PRIDE target of $100 million by ~50%, a
Slide 18: Refinancing Overview
Refinancing Overview DYNEGY
Slide 19: Capitalizing on opportunities to refinance in competitive capital market
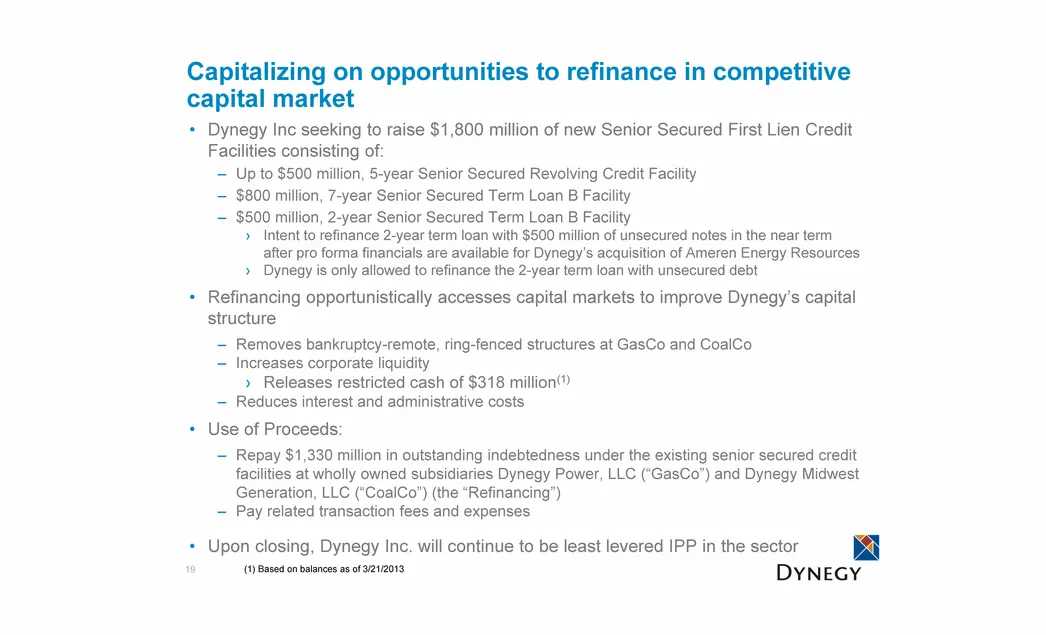
Capitalizing on opportunities to refinance in competitive capital market Dynegy Inc seeking to raise $1,800 million of new Senior Secured First Lien Credit Facilities consisting of: Up to $500 million, 5-year Senior Secured Revolving Credit Facility $800 million, 7-year Senior Secured Term Loan B Fa
Slide 20: Simplifying to create an established capital structure
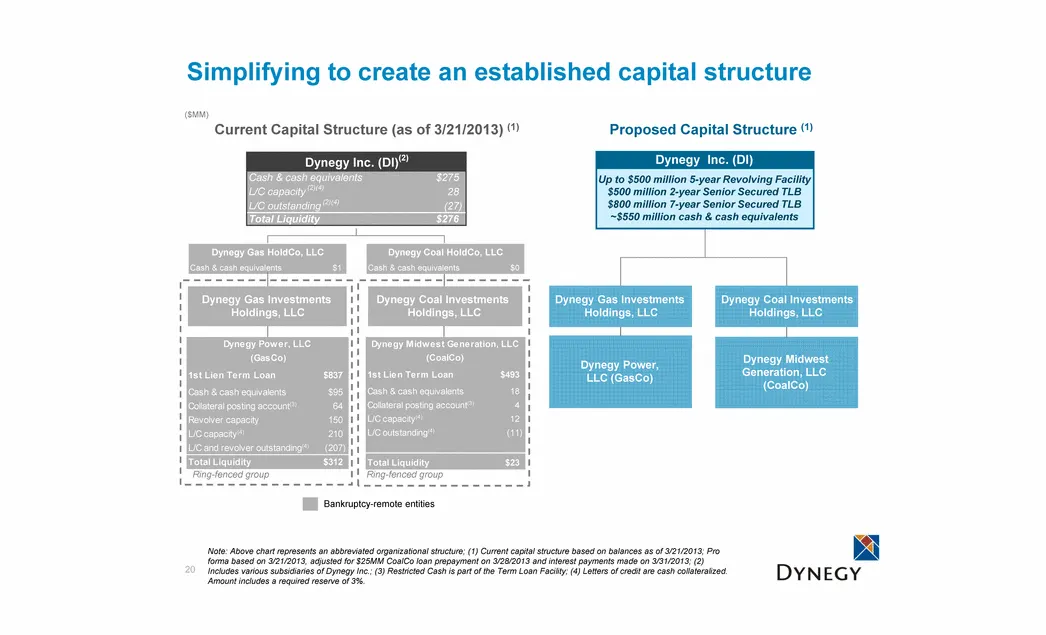
Dynegy Inc. (DI) Dynegy Midwest Generation, LLC (CoalCo) Dynegy Power, LLC (GasCo) Simplifying to create an established capital structure Proposed Capital Structure (1) Up to $500 million 5-year Revolving Facility $500 million 2-year Senior Secured TLB $800 million 7-year Senior Secured TLB ~$550 mi
Slide 21: Dynegy's Proposed Acquisition of Ameren Energy Resources
21 Dynegy’s Proposed Acquisition of Ameren Energy Resources
Slide 22: AER's coal generation and retail business is a natural fit with CoalCo
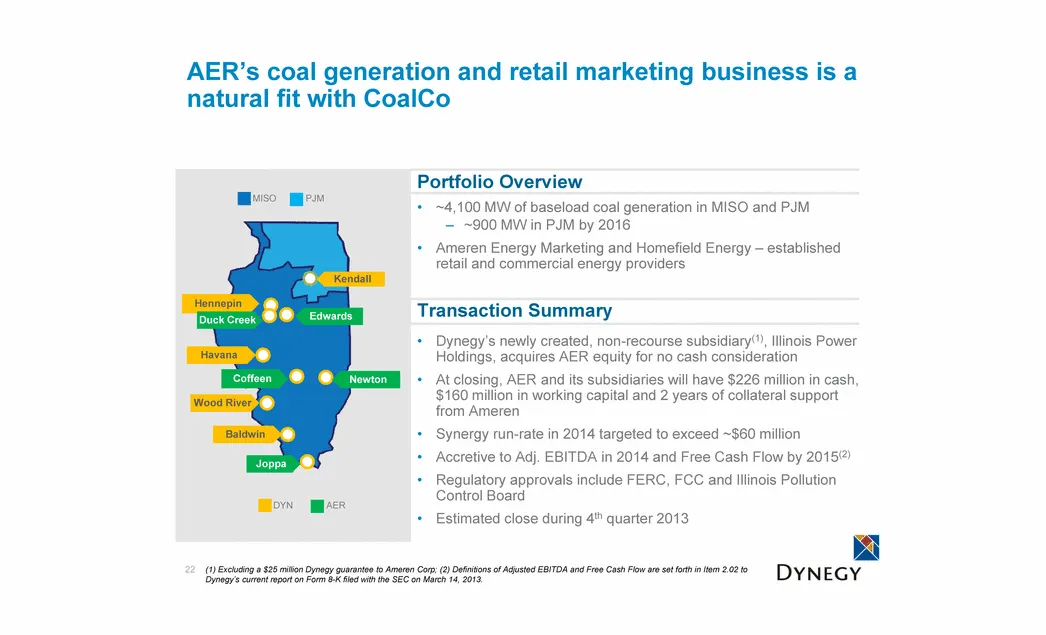
AER’s coal generation and retail marketing business is a natural fit with CoalCo Portfolio Overview ~4,100 MW of baseload coal generation in MISO and PJM ~900 MW in PJM by 2016 Ameren Energy Marketing and Homefield Energy – established retail and commercial energy providers 22 MISO Kendall Hennepin
Slide 23: Transaction structured to mitigate risk and ensure liquidity
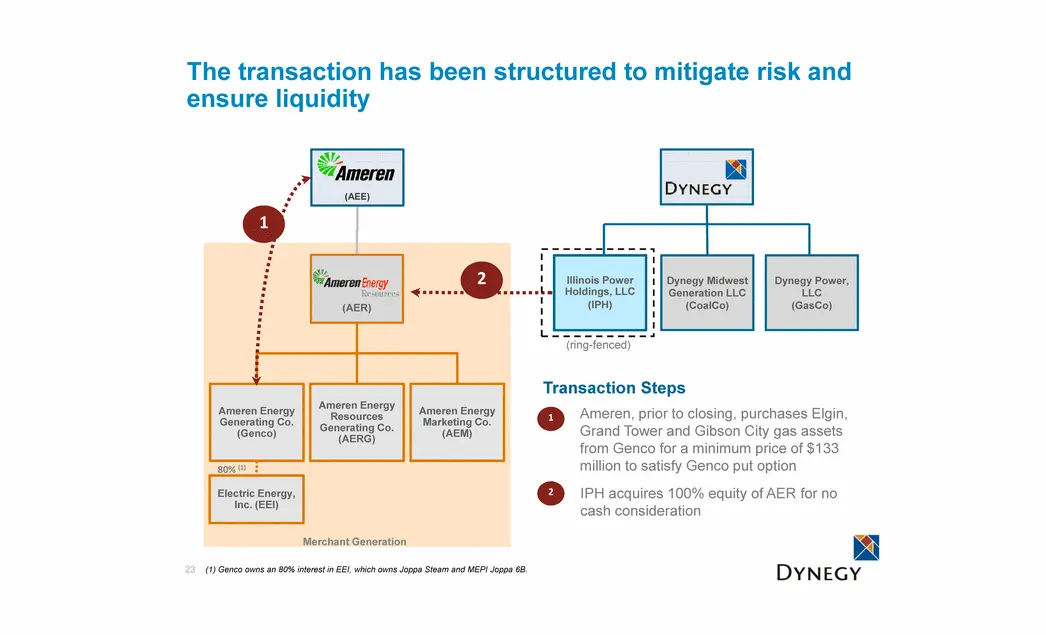
(1) Genco owns an 80% interest in EEI, which owns Joppa Steam and MEPI Joppa 6B. The transaction has been structured to mitigate risk and ensure liquidity 23 Merchant Generation (AEE) (AER) Illinois Power Holdings, LLC (IPH) Ameren Energy Generating Co. (Genco) Ameren Energy Resources Generating Co.
Slide 24: Acquisition terms require minimal capital commitment
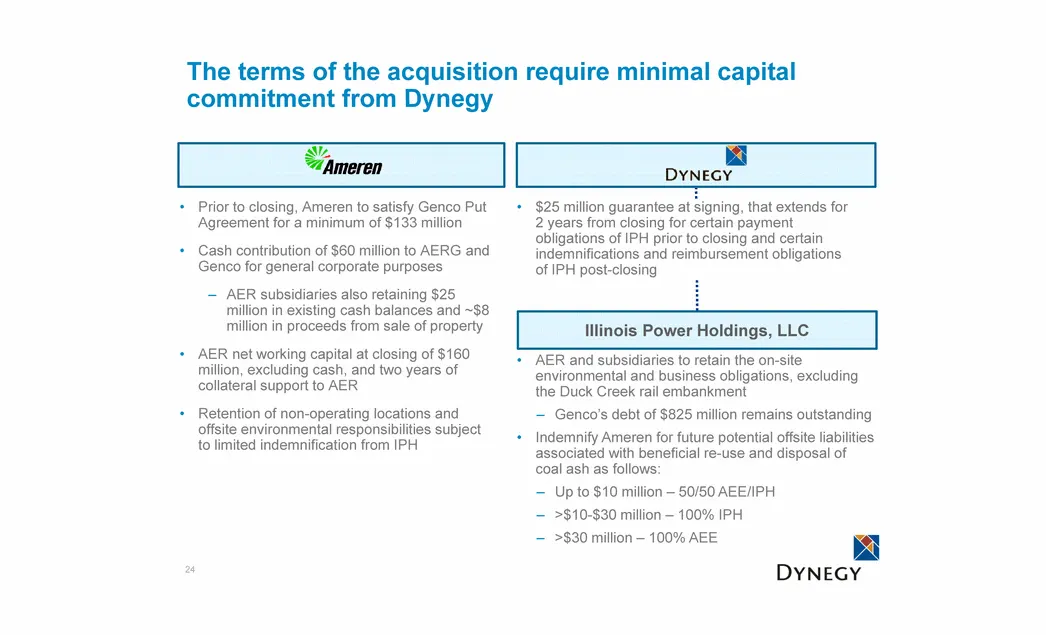
$25 million guarantee at signing, that extends for 2 years from closing for certain payment obligations of IPH prior to closing and certain indemnifications and reimbursement obligations of IPH post-closing The terms of the acquisition require minimal capital commitment from Dynegy Prior to closing,
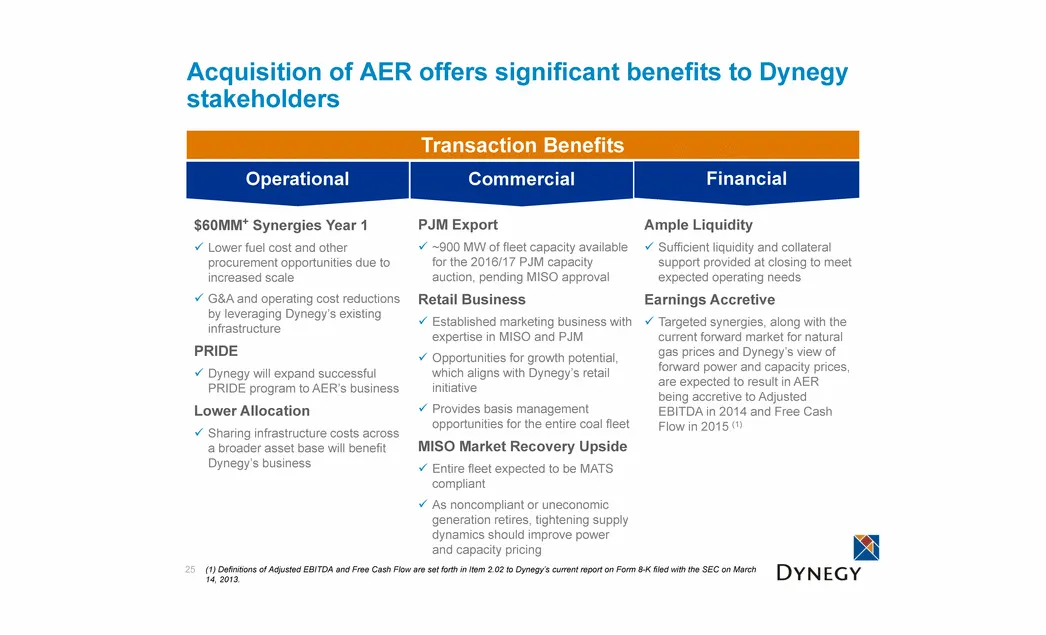
Slide 25: Acquisition of AER offers significant benefits to Dynegy stakeholders
PJM Export ~900 MW of fleet capacity available for the 2016/17 PJM capacity auction, pending MISO approval Retail Business Established marketing business with expertise in MISO and PJM Opportunities for growth potential, which aligns with Dynegy’s retail initiative Provides basis management opportun
Slide 26: Summary and Q&A
Summary and Q&A DYNEGY
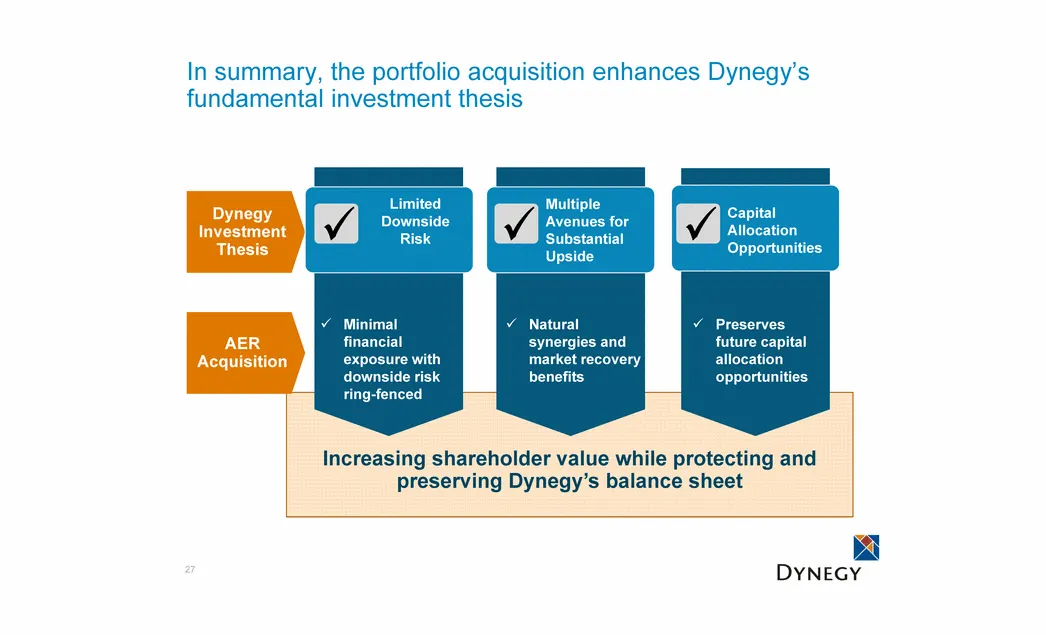
Slide 27: Dynegy Investment Thesis
AER Acquisition Dynegy Investment Thesis In summary, the portfolio acquisition enhances Dynegy’s fundamental investment thesis 27 Capital Allocation Opportunities Multiple Avenues for Substantial Upside Limited Downside Risk Increasing shareholder value while protecting and preserving Dynegy’s balan
Slide 28: Appendix
Anoe SEE Sas DYNEGY
Slide 29: Dynegy Generation Facilities
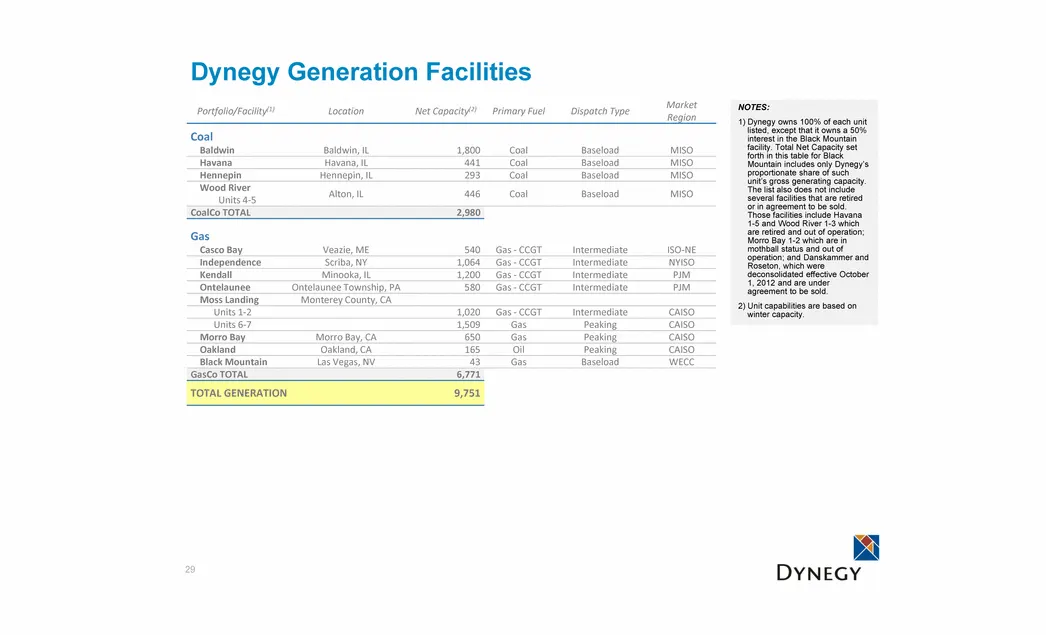
29 Dynegy Generation Facilities Portfolio/Facility(1) Location Net Capacity(2) Primary Fuel Dispatch Type Market Region Coal Baldwin Baldwin, IL 1,800 Coal Baseload MISO Havana Havana, IL 441 Coal Baseload MISO Hennepin Hennepin, IL 293 Coal Baseload MISO Wood River Units 4-5 Alton, IL 446 Coal Base
Slide 30: Summary of Indicative Terms
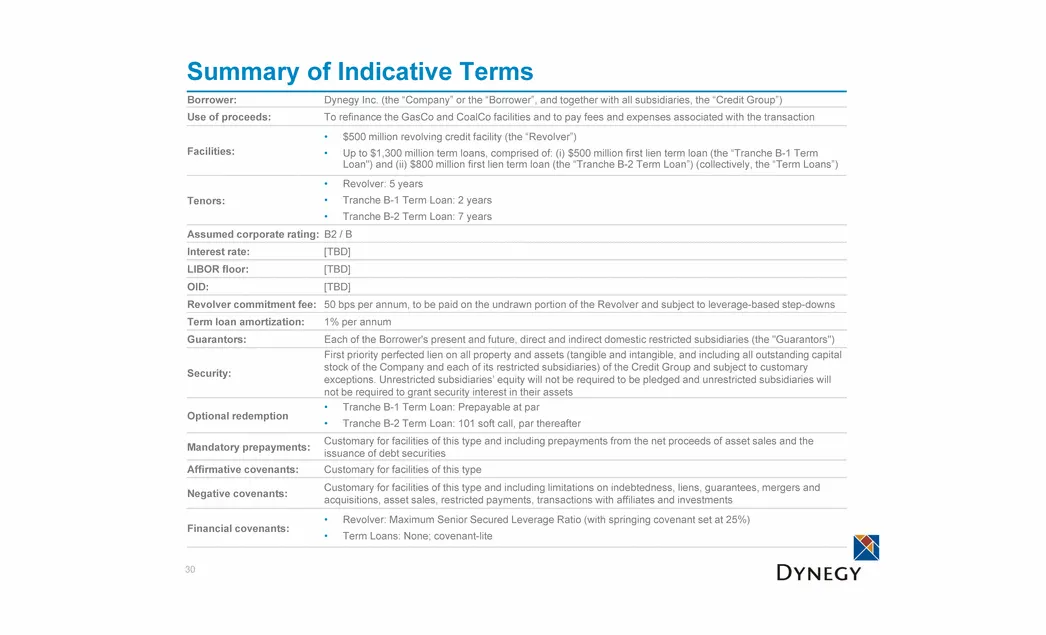
Summary of Indicative Terms 30 Borrower: Dynegy Inc. (the “Company” or the “Borrower”, and together with all subsidiaries, the “Credit Group”) Use of proceeds: To refinance the GasCo and CoalCo facilities and to pay fees and expenses associated with the transaction Facilities: $500 million revolving
Slide 31: Preliminary Sources/Uses and Pro forma Capitalization
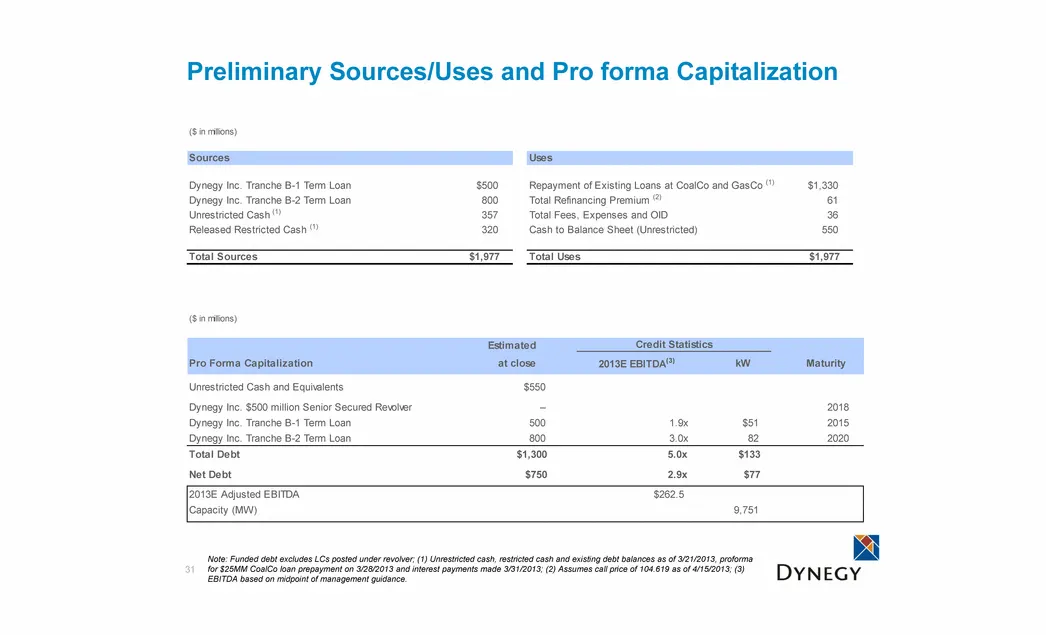
Preliminary Sources/Uses and Pro forma Capitalization 31 Note: Funded debt excludes LCs posted under revolver; (1) Unrestricted cash, restricted cash and existing debt balances as of 3/21/2013, proforma for $25MM CoalCo loan prepayment on 3/28/2013 and interest payments made 3/31/2013; (2) Assumes c
Slide 32: Compliance Profiles: Environmental Control Technologies
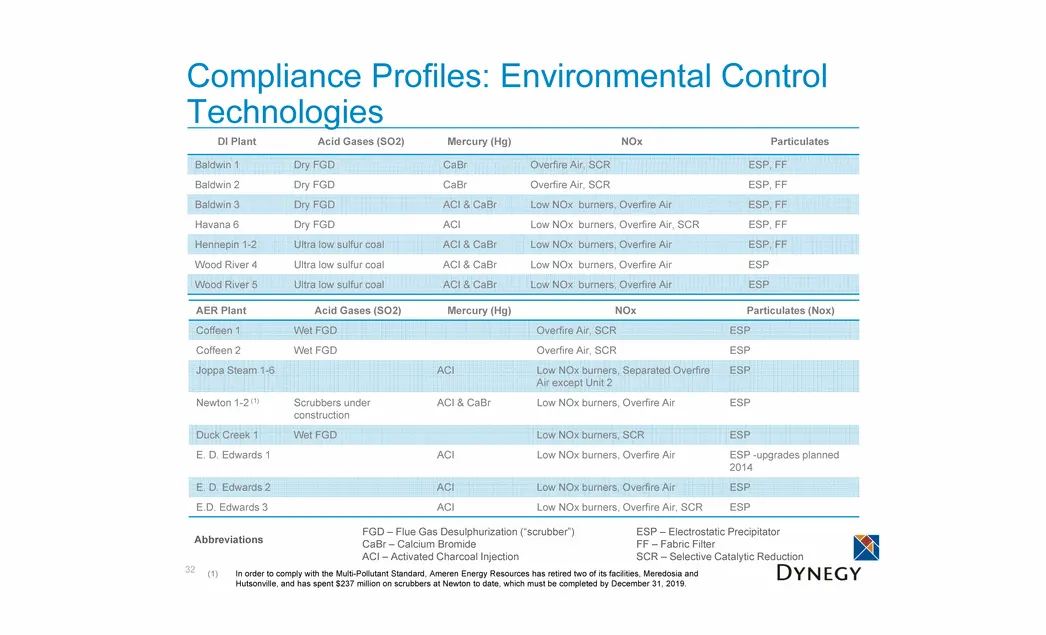
Compliance Profiles: Environmental Control Technologies 32 DI Plant Acid Gases (SO2) Mercury (Hg) NOx Particulates Baldwin 1 Dry FGD CaBr Overfire Air, SCR ESP, FF Baldwin 2 Dry FGD CaBr Overfire Air, SCR ESP, FF Baldwin 3 Dry FGD ACI & CaBr Low NOx burners, Overfire Air ESP, FF Havana 6 Dry FGD ACI
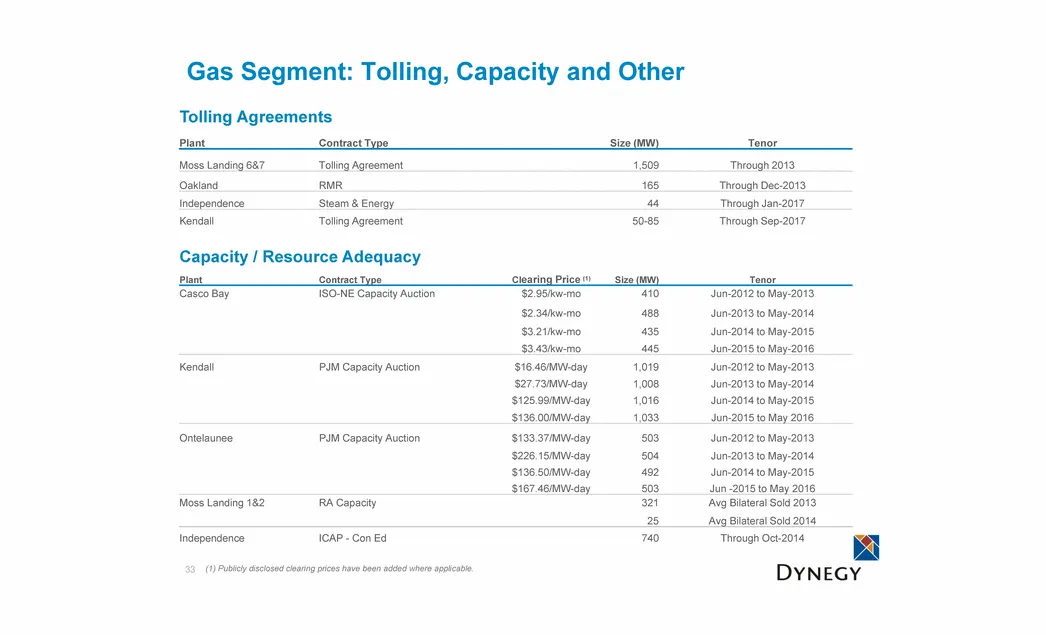
Slide 33: Tolling Agreements and Capacity Contracts
Tolling Agreements Plant Contract Type Size (MW) Tenor Moss Landing 6&7 Tolling Agreement 1,509 Through 2013 Oakland RMR 165 Through Dec-2013 Independence Steam & Energy 44 Through Jan-2017 Kendall Tolling Agreement 50-85 Through Sep-2017 Capacity / Resource Adequacy Plant Contract Type Clearing Pri
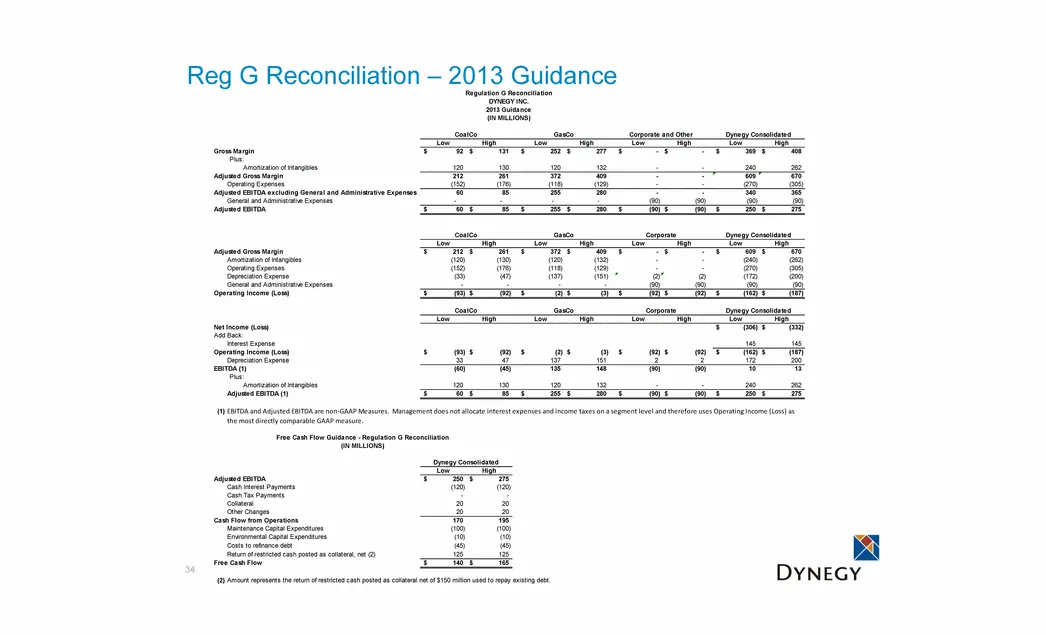
Slide 34: Reg G Reconciliation – 2013 Guidance
34 Reg G Reconciliation – 2013 Guidance Low High Low High Low High Low High Gross Margin 92 $ 131 $ 252 $ 277 $ - $ - $ 369 $ 408 $ Plus: Amortization of Intangibles 120 130 120 132 - - 240 262 Adjusted Gross Margin 212 261 372 409 - - 609 670 Operating Expenses (152) (176) (118) (129) - - (270) (30
Source: SEC EDGAR · 8-K filed Apr 11, 2013
More decks from Dynegy Inc
 FY2017 Earnings Presentation30 slides · Feb 26, 2018
 Debt Investor Presentation (December 2017)10 slides · Dec 11, 2017
 Merger or Acquisition (October 2017)28 slides · Oct 31, 2017
 Debt Investor Presentation (October 2016)44 slides · Oct 3, 2016
 IPO Roadshow (June 2016)17 slides · Jun 15, 2016
 Investor Day (April 2014)94 slides · Apr 11, 2014