Strategic Hotels and Resorts Inc
Strategic Hotels and Resorts — Investor Presentation (May 2007)
18 slides from Strategic Hotels and Resorts's investor presentation, May 23, 2007

Slide 1: Strategic Hotels & Resorts
STRATEGIC Hotels &° Resorts
Slide 2: Highlights
Highlights Unparalleled high quality hotel portfolio Unrecognized NAV appreciation Embedded internal investment opportunities Deep management team focused on execution “Life cycle” driven capital recycling program Building Long-Term Earnings Growth
Slide 3: Strategic Portfolio
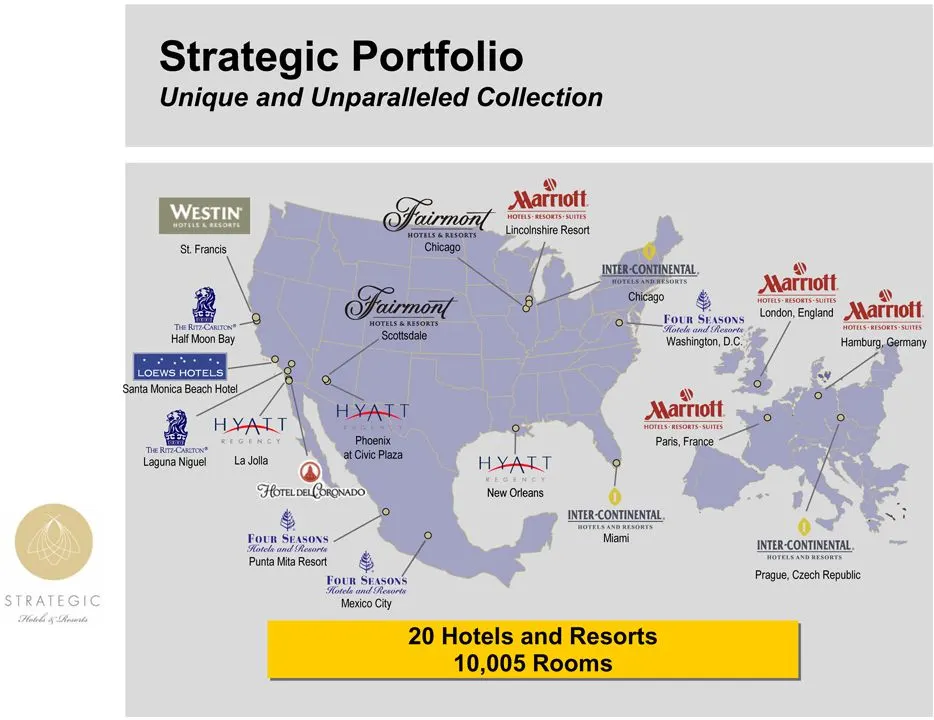
Strategic Portfolio Unique and Unparalleled Collection & Foun Srasoys Yow nd tems Poiatiareot — &
Slide 4
Slide 5
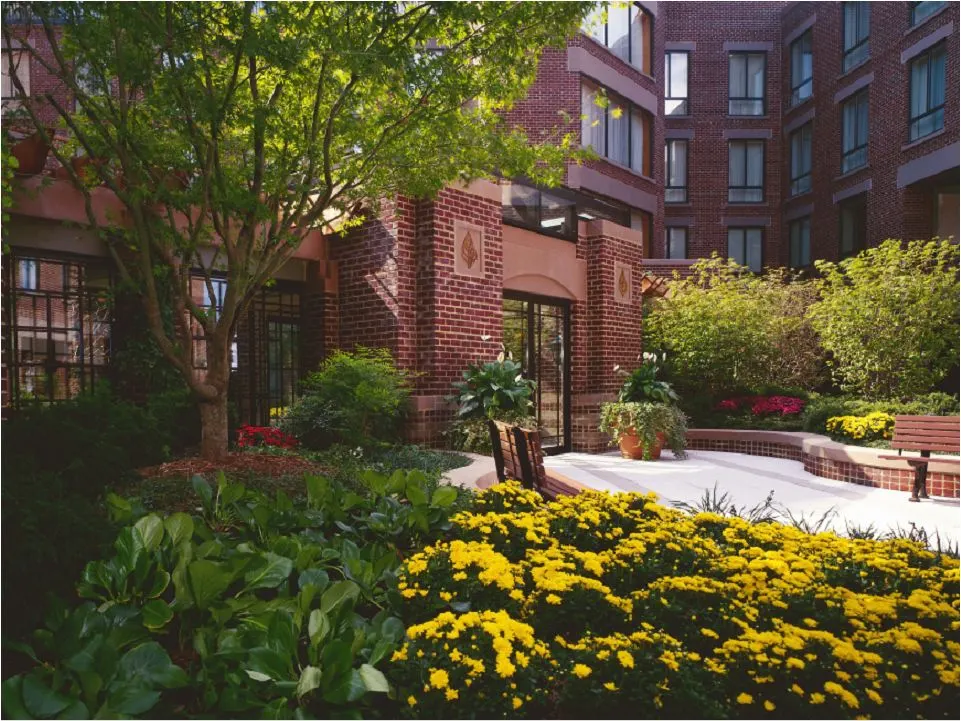
Slide 6
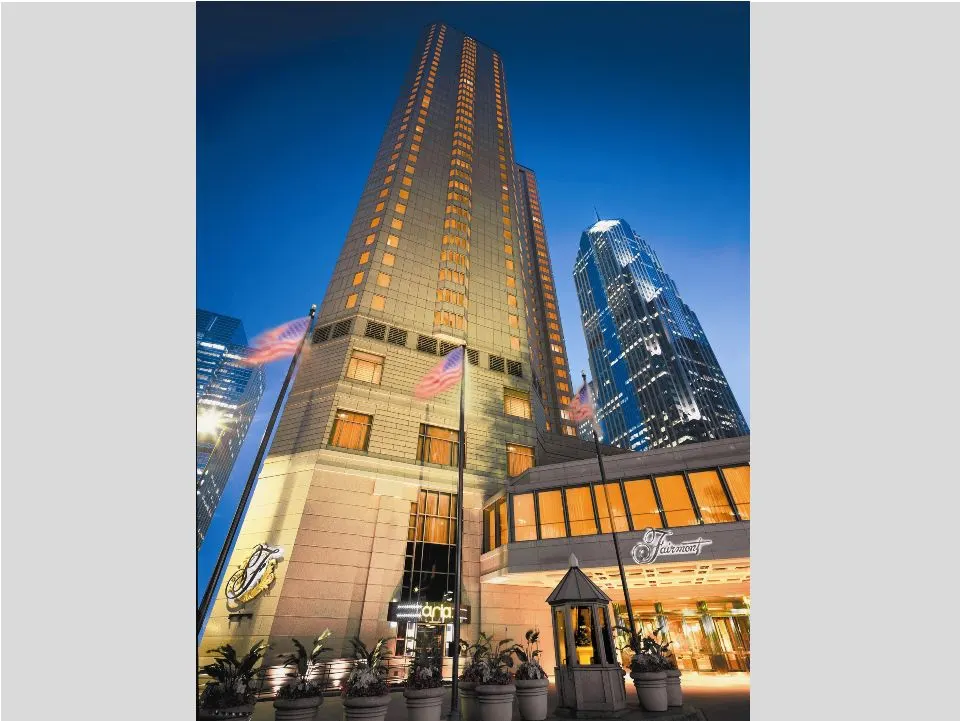
Slide 7
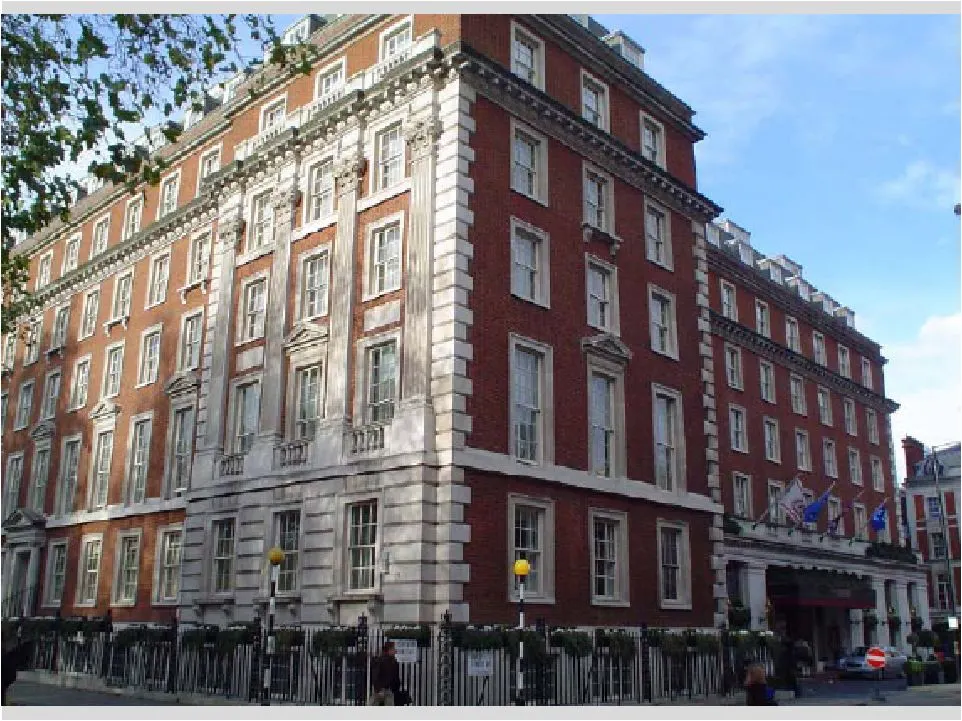
Slide 8
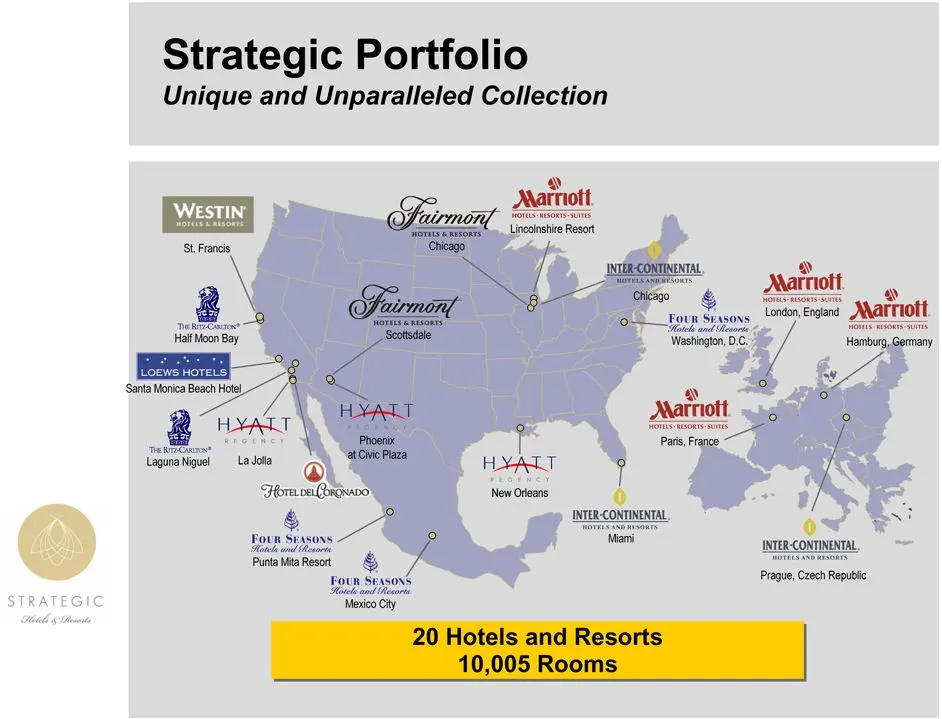
Slide 9: Strategic Portfolio
Strategic Portfolio Unique and Unparalleled Collection WESTI IN" & Four Seasoys ots and esote Punta Mita Resort
Slide 10: Growing Earnings Potential
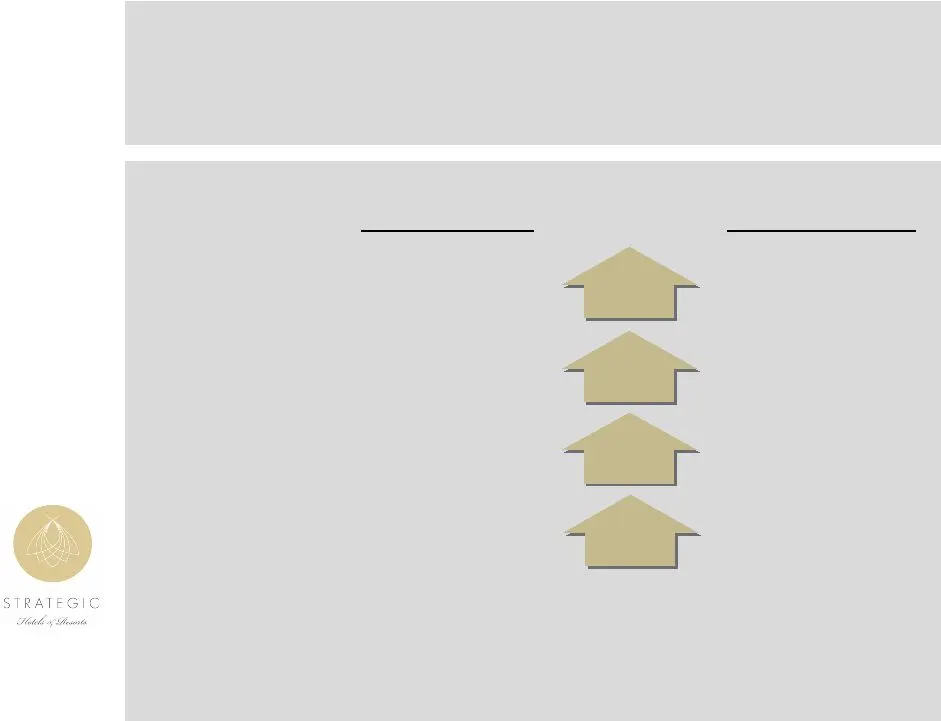
Growing Earnings Potential Total North America Hotels Q1 2006 Q1 2007 RevPAR $150 22.7% $184 Total RevPAR $268 28.0% $343 ADR $203 23.2% $250 GOP/room $8,709 28.9% $11,227
Slide 11: Strong Balance Sheet
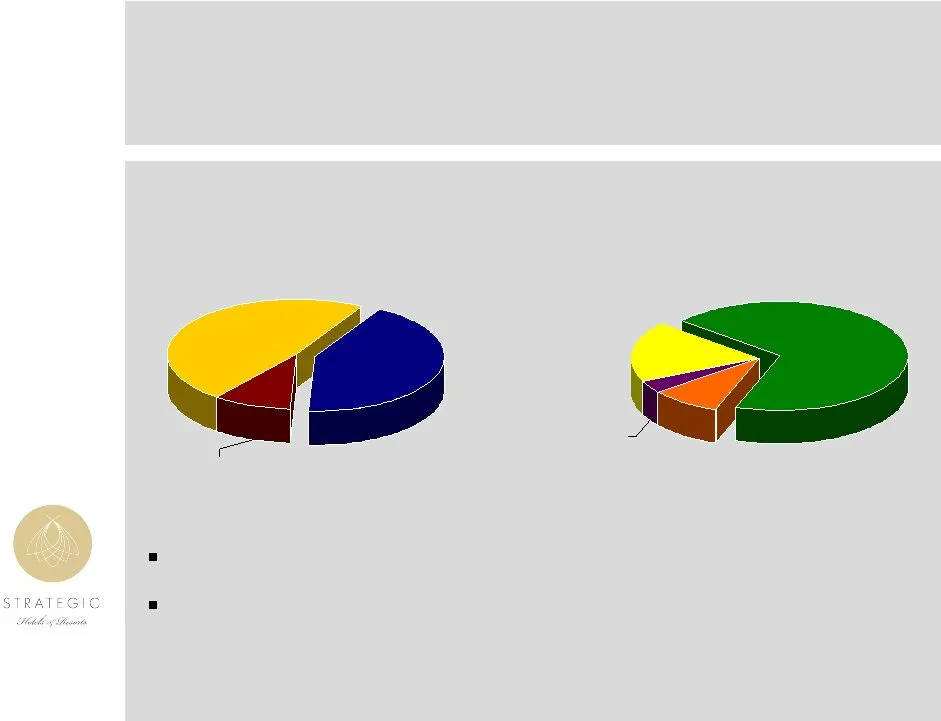
Net Debt 42% Mortgage Debt 69% Strong Balance Sheet $440 million additional line of credit capacity Consolidated Total Enterprise Value $3.6 billion 5.3% average borrowing cost 83% fixed rate Consolidated Total Leverage $2.0 billion Common Equity 48% Preferred Equity 10% Preferred Equity 18% Line of
Slide 12: Components of Value
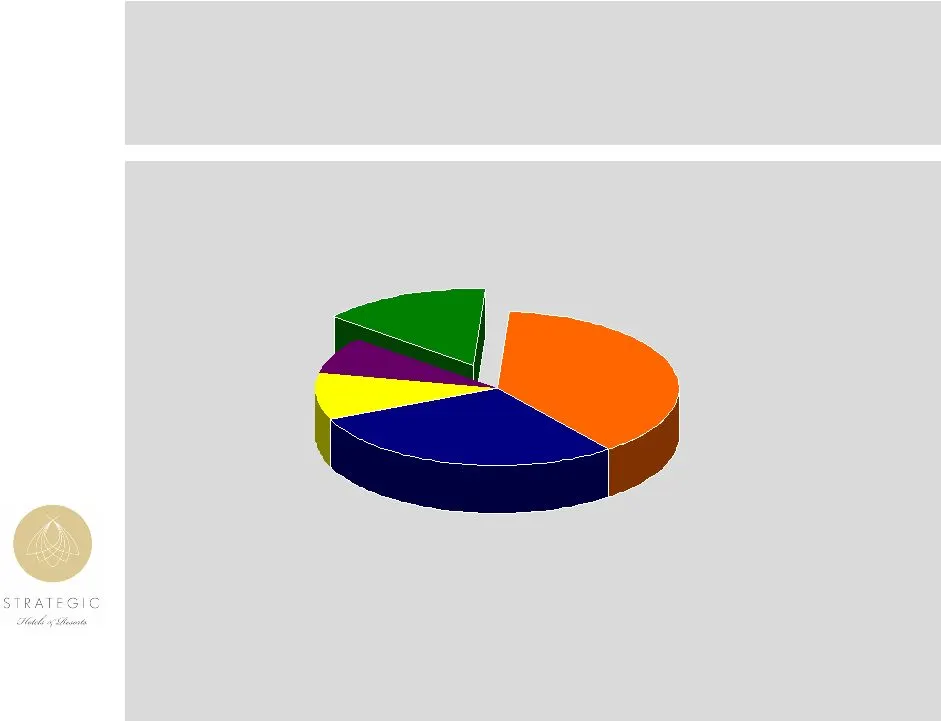
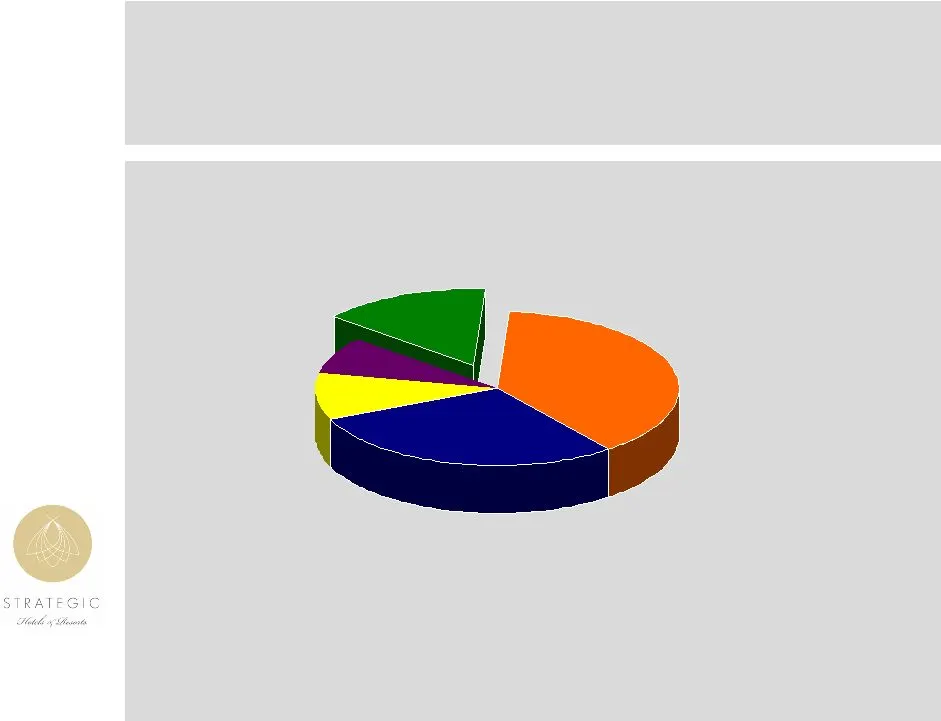
Components of Value Hidden Value Driven by Non-Income Producing Assets Meetings & Business Hotels 45% of EBITDA Ocean Front Resorts 34% of EBITDA Non-Income Producing Assets European Hotels 12% of EBITDA Non-Core Assets 9% of EBITDA
Slide 13: 2007 Completions
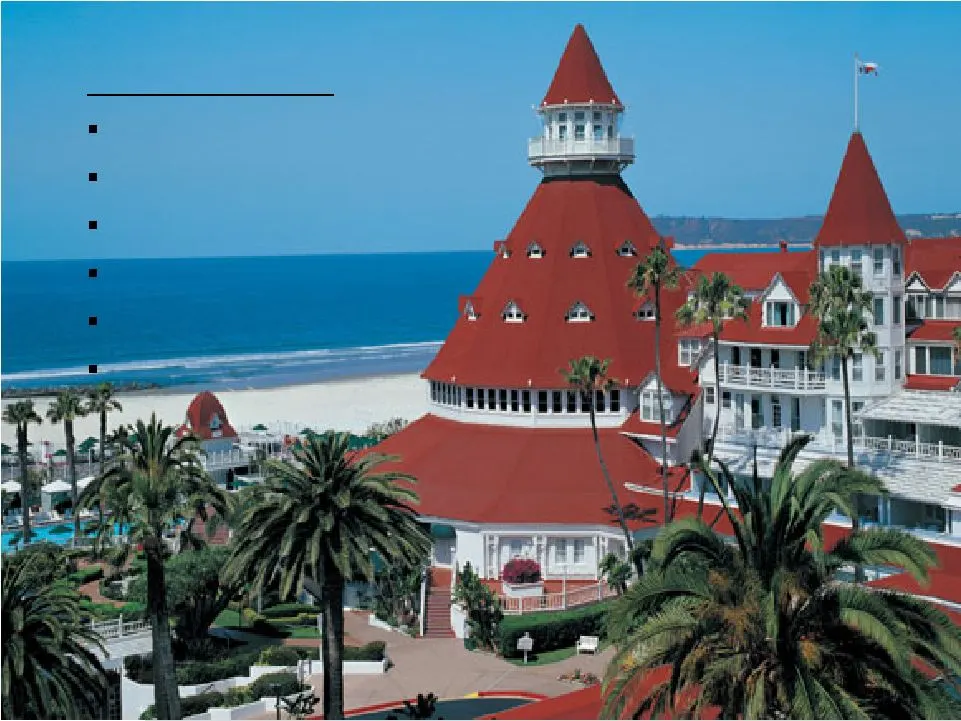
2007 Completions Hotel del Coronado 213 room renovation 35 unit / 78 room addition Retail reconfiguration New restaurant Spa Beach Club
Slide 14: 2007 Completions Four Seasons Punta Mita
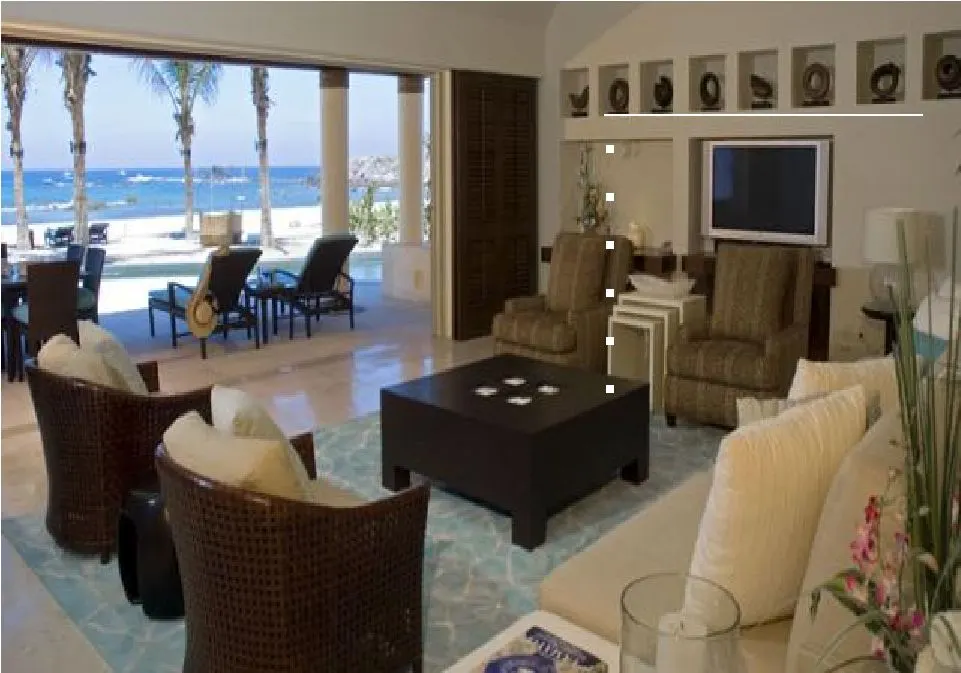
2007 Completions Four Seasons Punta Mita 5 room suite 23 rooms and river pool Retail expansion New restaurant Expanded health club Outdoor meeting space

Slide 15: Capital Projects
Capital Projects 2007 Completions Ritz-Carlton Laguna Niguel – 3 room addition – Wine room – Suite renovation InterContinental Chicago – Wine room – Starbucks Fairmont Chicago – Gold lounge InterContinental Miami – Starbucks Fairmont Scottsdale – 79 Gold rooms – Michael Mina restaurant – Gerber bar
Slide 16: Components of Value
Components of Value Hidden Value Driven by Non-Income Producing Assets Meetings & Business Hotels 45% of EBITDA Ocean Front Resorts 34% of EBITDA Non-Income Producing Assets European Hotels 12% of EBITDA Non-Core Assets 9% of EBITDA

Slide 17: Summary
Summary Newly acquired high growth portfolio Programmed multi-year investment strategy Conversion of non-income producing assets into earnings Underpinning real estate values

Slide 18: Strategic Hotels & Resorts
STRATEGIC Hotels 5 Resorts
Source: SEC EDGAR · 8-K filed May 23, 2007
More decks from Strategic Hotels and Resorts Inc
 Investor Presentation (June 2015)43 slides · Jun 1, 2015
 Investor Presentation (February 2015)43 slides · Feb 24, 2015
 Investor Presentation (January 2015)44 slides · Jan 26, 2015
 Investor Presentation (November 2014)50 slides · Nov 5, 2014
 Investor Presentation (October 2014)50 slides · Oct 3, 2014
 Investor Day (September 2014)67 slides · Sep 22, 2014