Edwards A G — Lehman Brothers Financial Services Conference 2007
39 slides from Edwards A G's conference presentation, Sep 10, 2007
Slide 1: Filed by Wachovia Corporation pursuant to Rule 425
Filed by Wachovia Corporation pursuant to Rule 425 under the Securities Act of 1933, as amended, and deemed filed pursuant to Rule 14a-6(b) under the Securities Exchange Act of 1934, as amended Subject Company: A.G. Edwards, Inc. Commission File No.: 1-8527 Date: September 10, 2007 This filing may c

Slide 2: Forward-looking statements (continued)
synergies and cost savings from the Merger or the Golden West Merger may not be fully realized or realized within the expected time frame; (3) the risk that revenues following the Merger or the Golden West Merger may be lower than expected; (4) deposit attrition, operating costs, customer loss and b
Slide 3: Turbulent Times Call for Strong Management
THE FOLLOWING PRESENTATION WAS USED IN A CONFERENCE WITH INVESTORS AND OTHERS AND WAS MADE AVAILABLE ON WACHOVIA’S WEBSITE. Wachovia Corporation Turbulent Times Call for Strong Management Lehman Brothers Financial Services Conference September 10, 2007 Ken Thompson Chairman and CEO
Slide 4: Execution excellence drives long-term track record
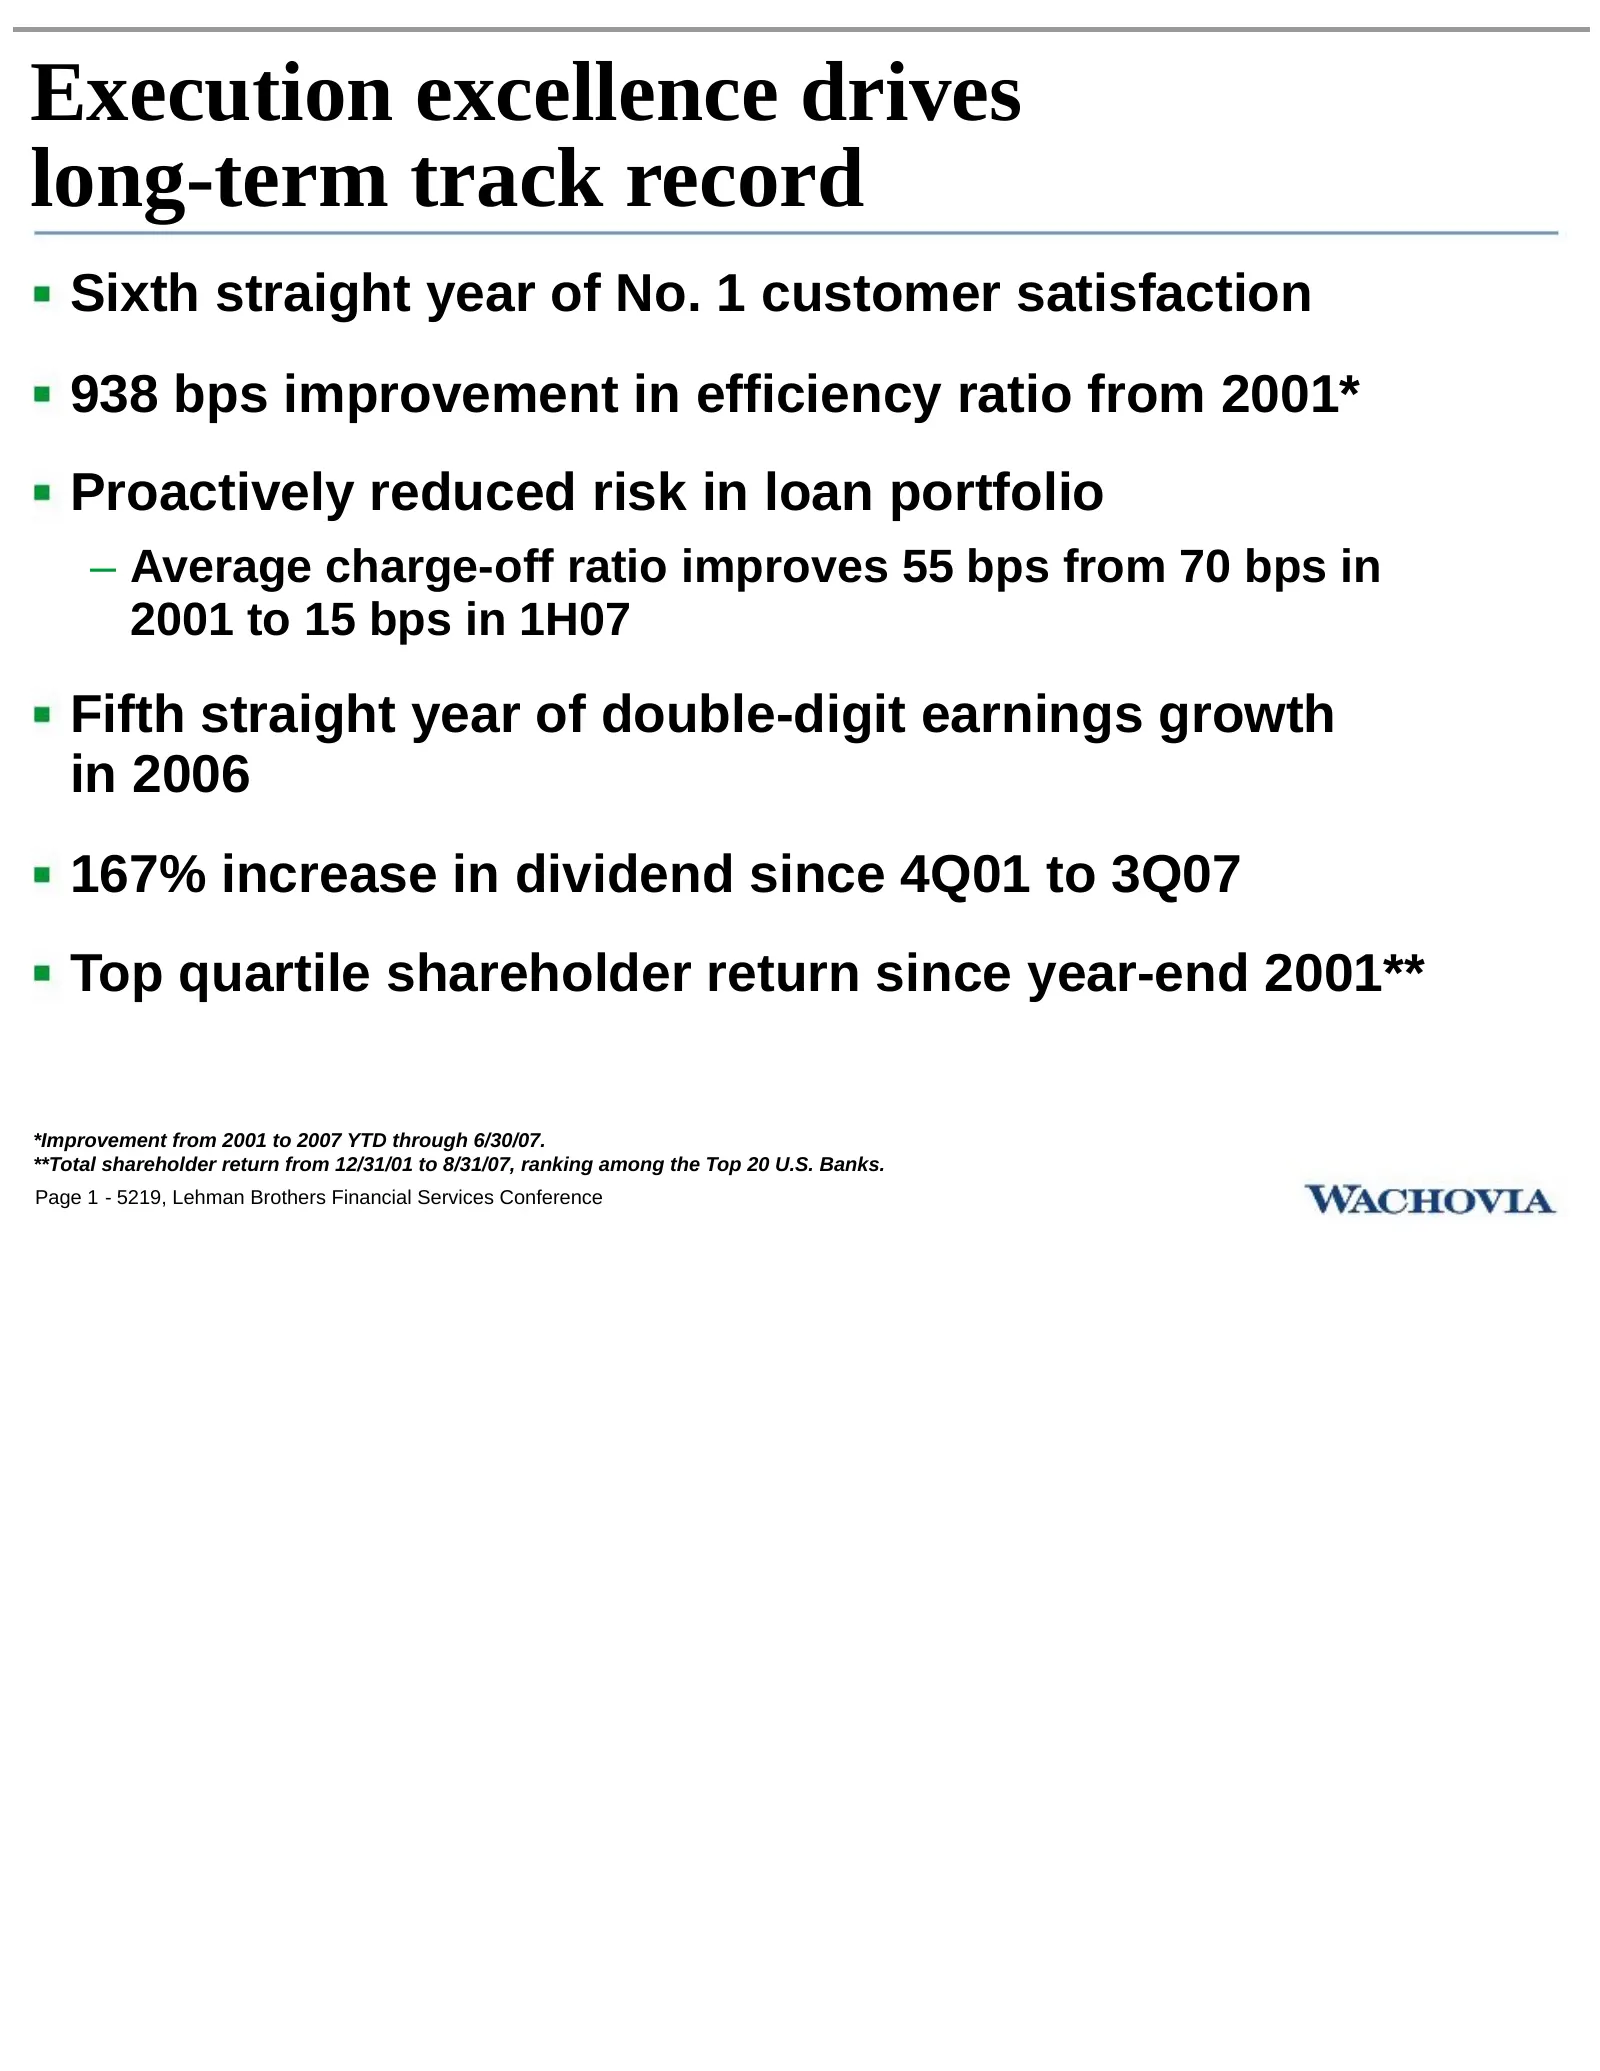
Execution excellence drives long-term track record Sixth straight year of No. 1 customer satisfaction 938 bps improvement in efficiency ratio from 2001* Proactively reduced risk in loan portfolio – Average charge-off ratio improves 55 bps from 70 bps in 2001 to 15 bps in 1H07 Fifth straight year of
Slide 5: Wachovia in perspective: A great footprint drives sustainable long-term growth
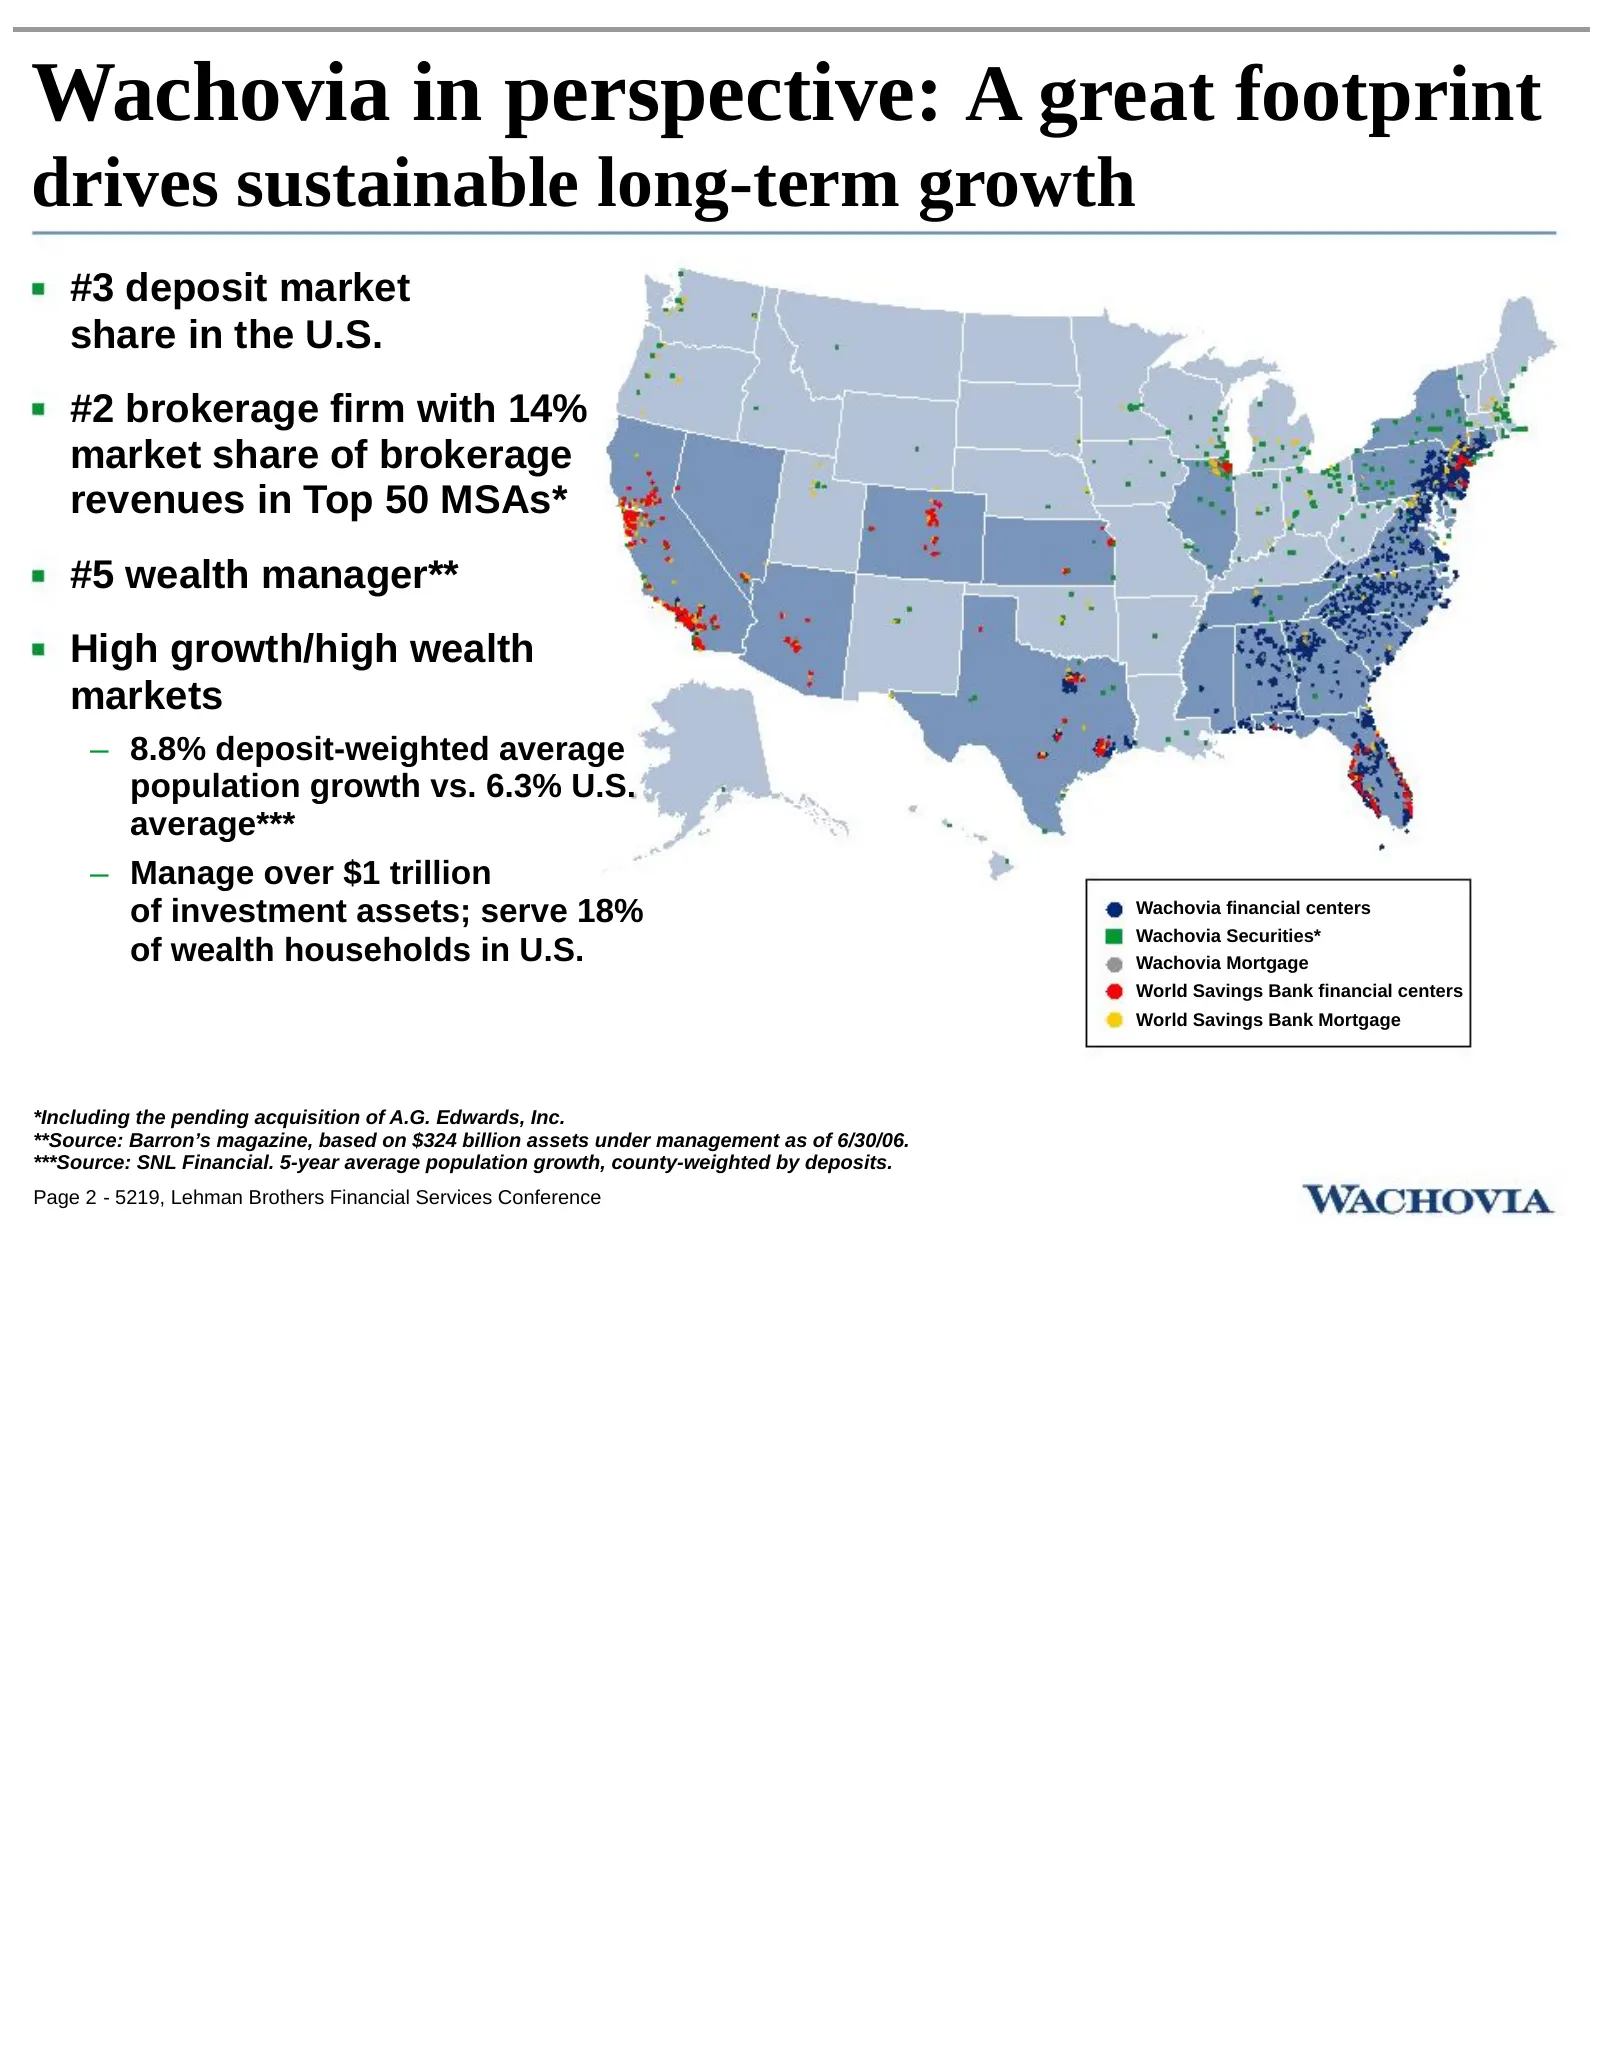
Wachovia in perspective: A great footprint drives sustainable long-term growth #3 deposit market share in the U.S. #2 brokerage firm with 14% market share of brokerage revenues in Top 50 MSAs* #5 wealth manager** High growth/high wealth markets – 8.8% deposit-weighted average population growth vs. 6
Slide 6: Wachovia in perspective: Well-managed, diversified businesses
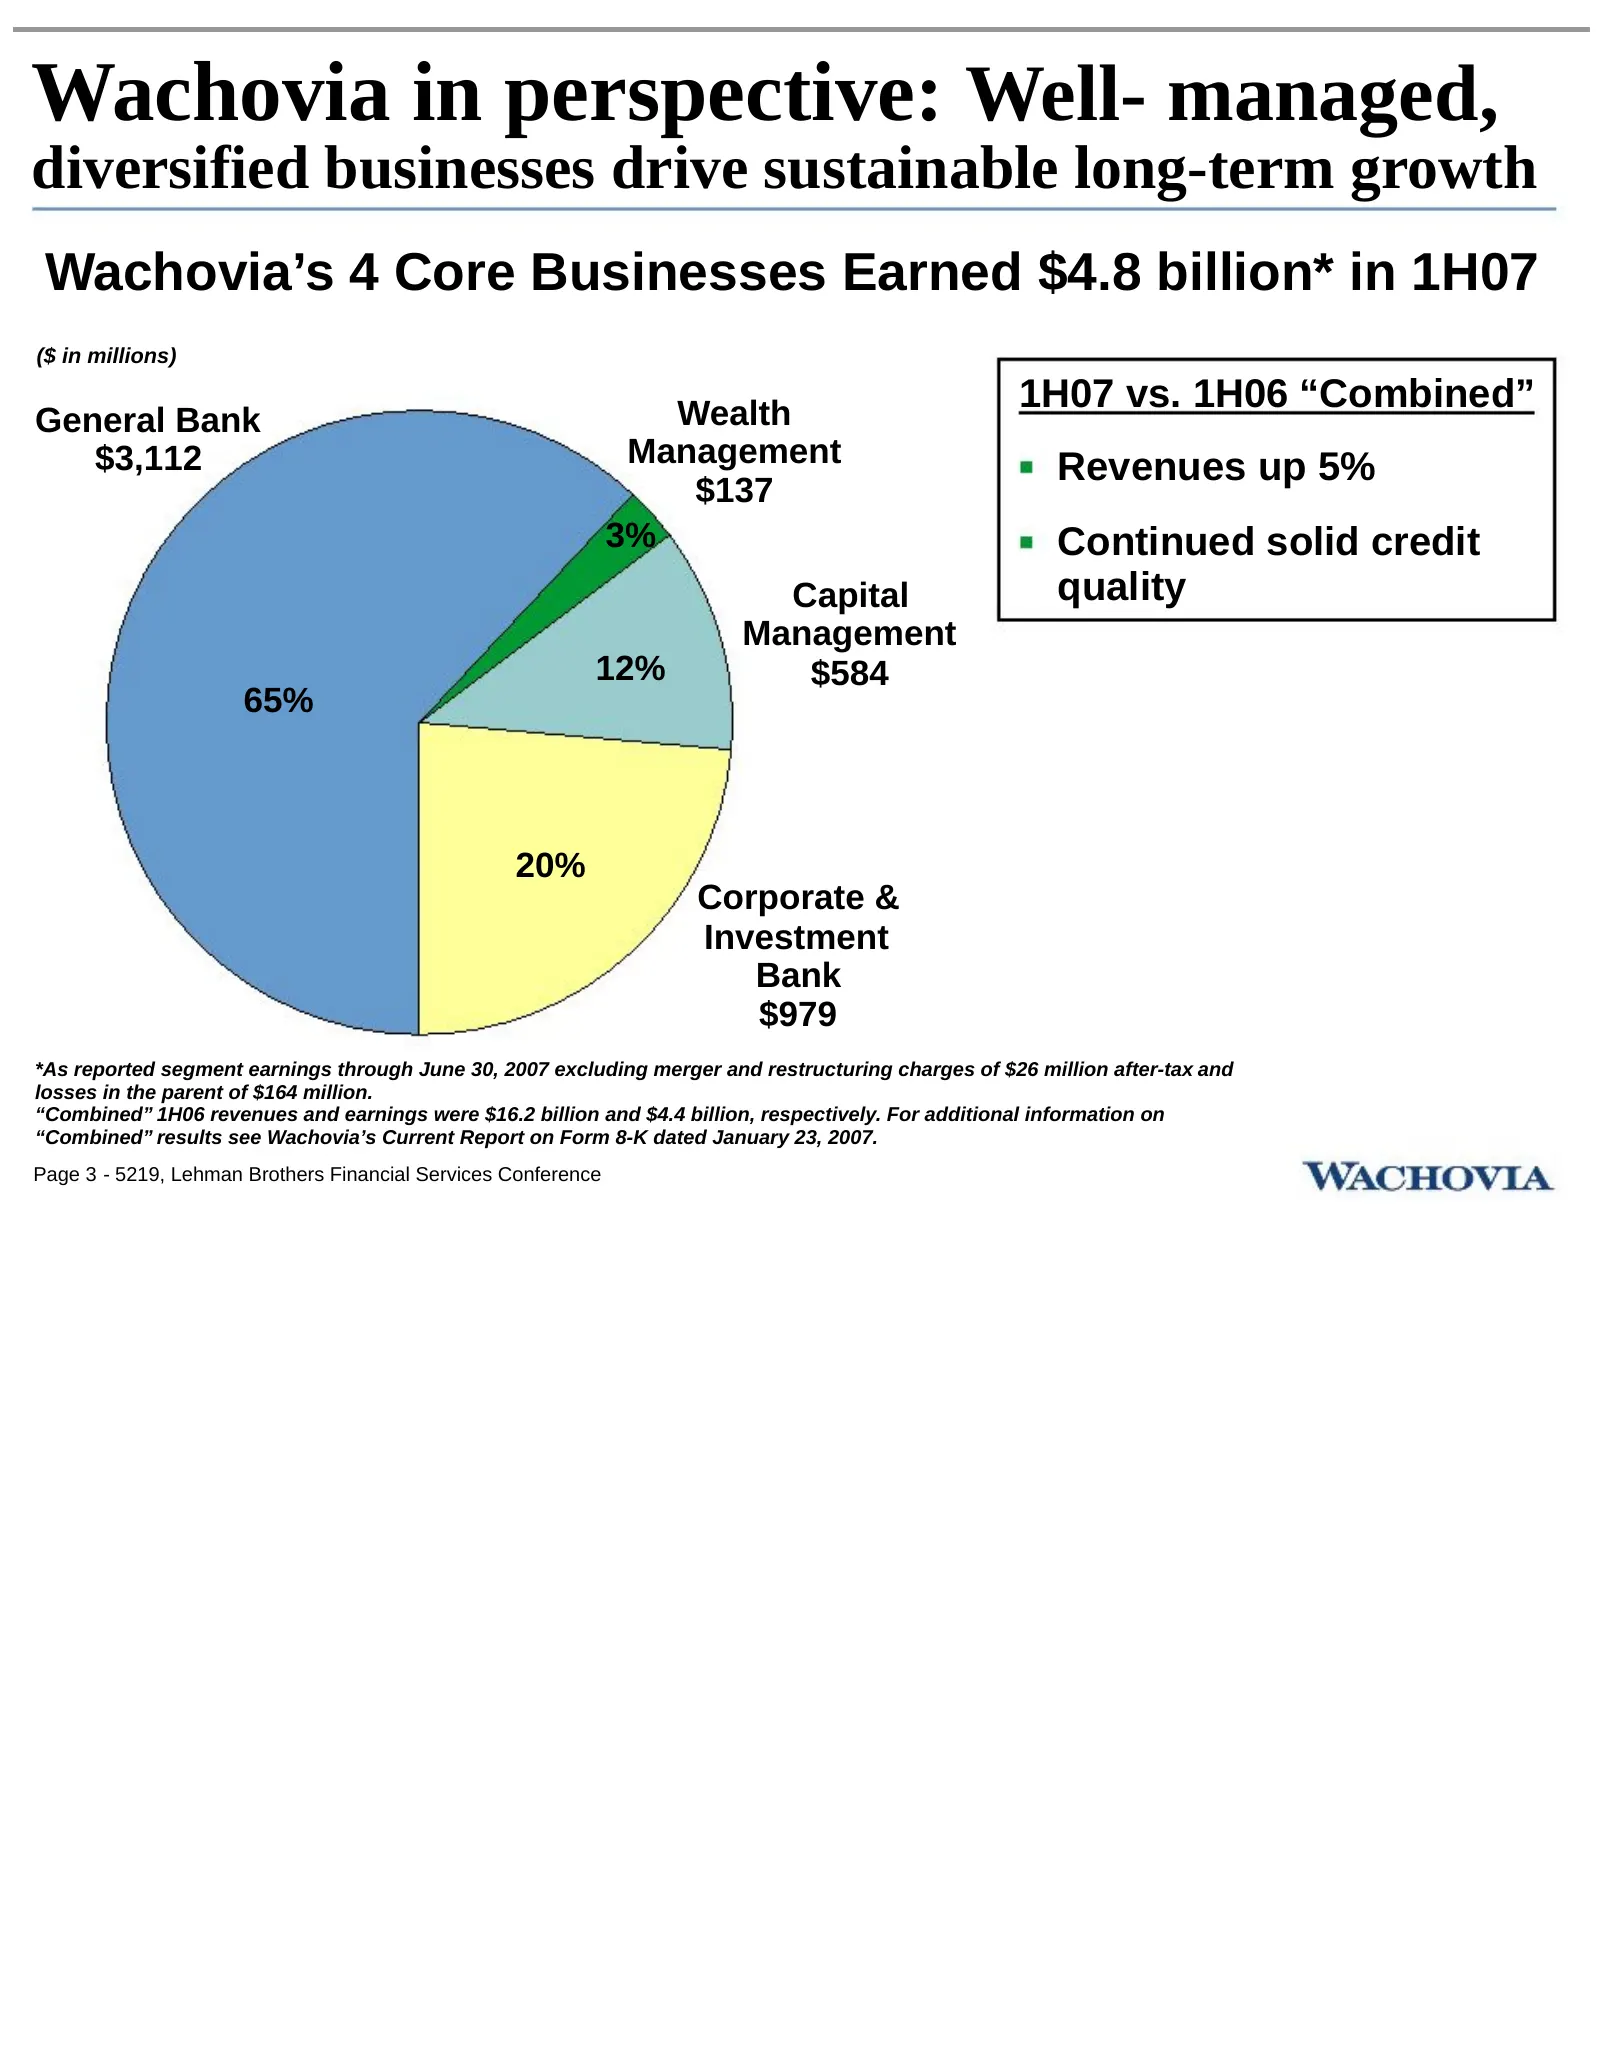
Wachovia in perspective: Well- managed, diversified businesses drive sustainable long-term growth Wachovia’s 4 Core Businesses Earned $4.8 billion* in 1H07 ($ in millions) Wealth 1H07 vs. 1H06 “Combined” General Bank $3,112 Management Revenues up 5% $137 3% Continued solid credit Capital quality Man
Slide 7: General Banking Group: Well positioned for growth
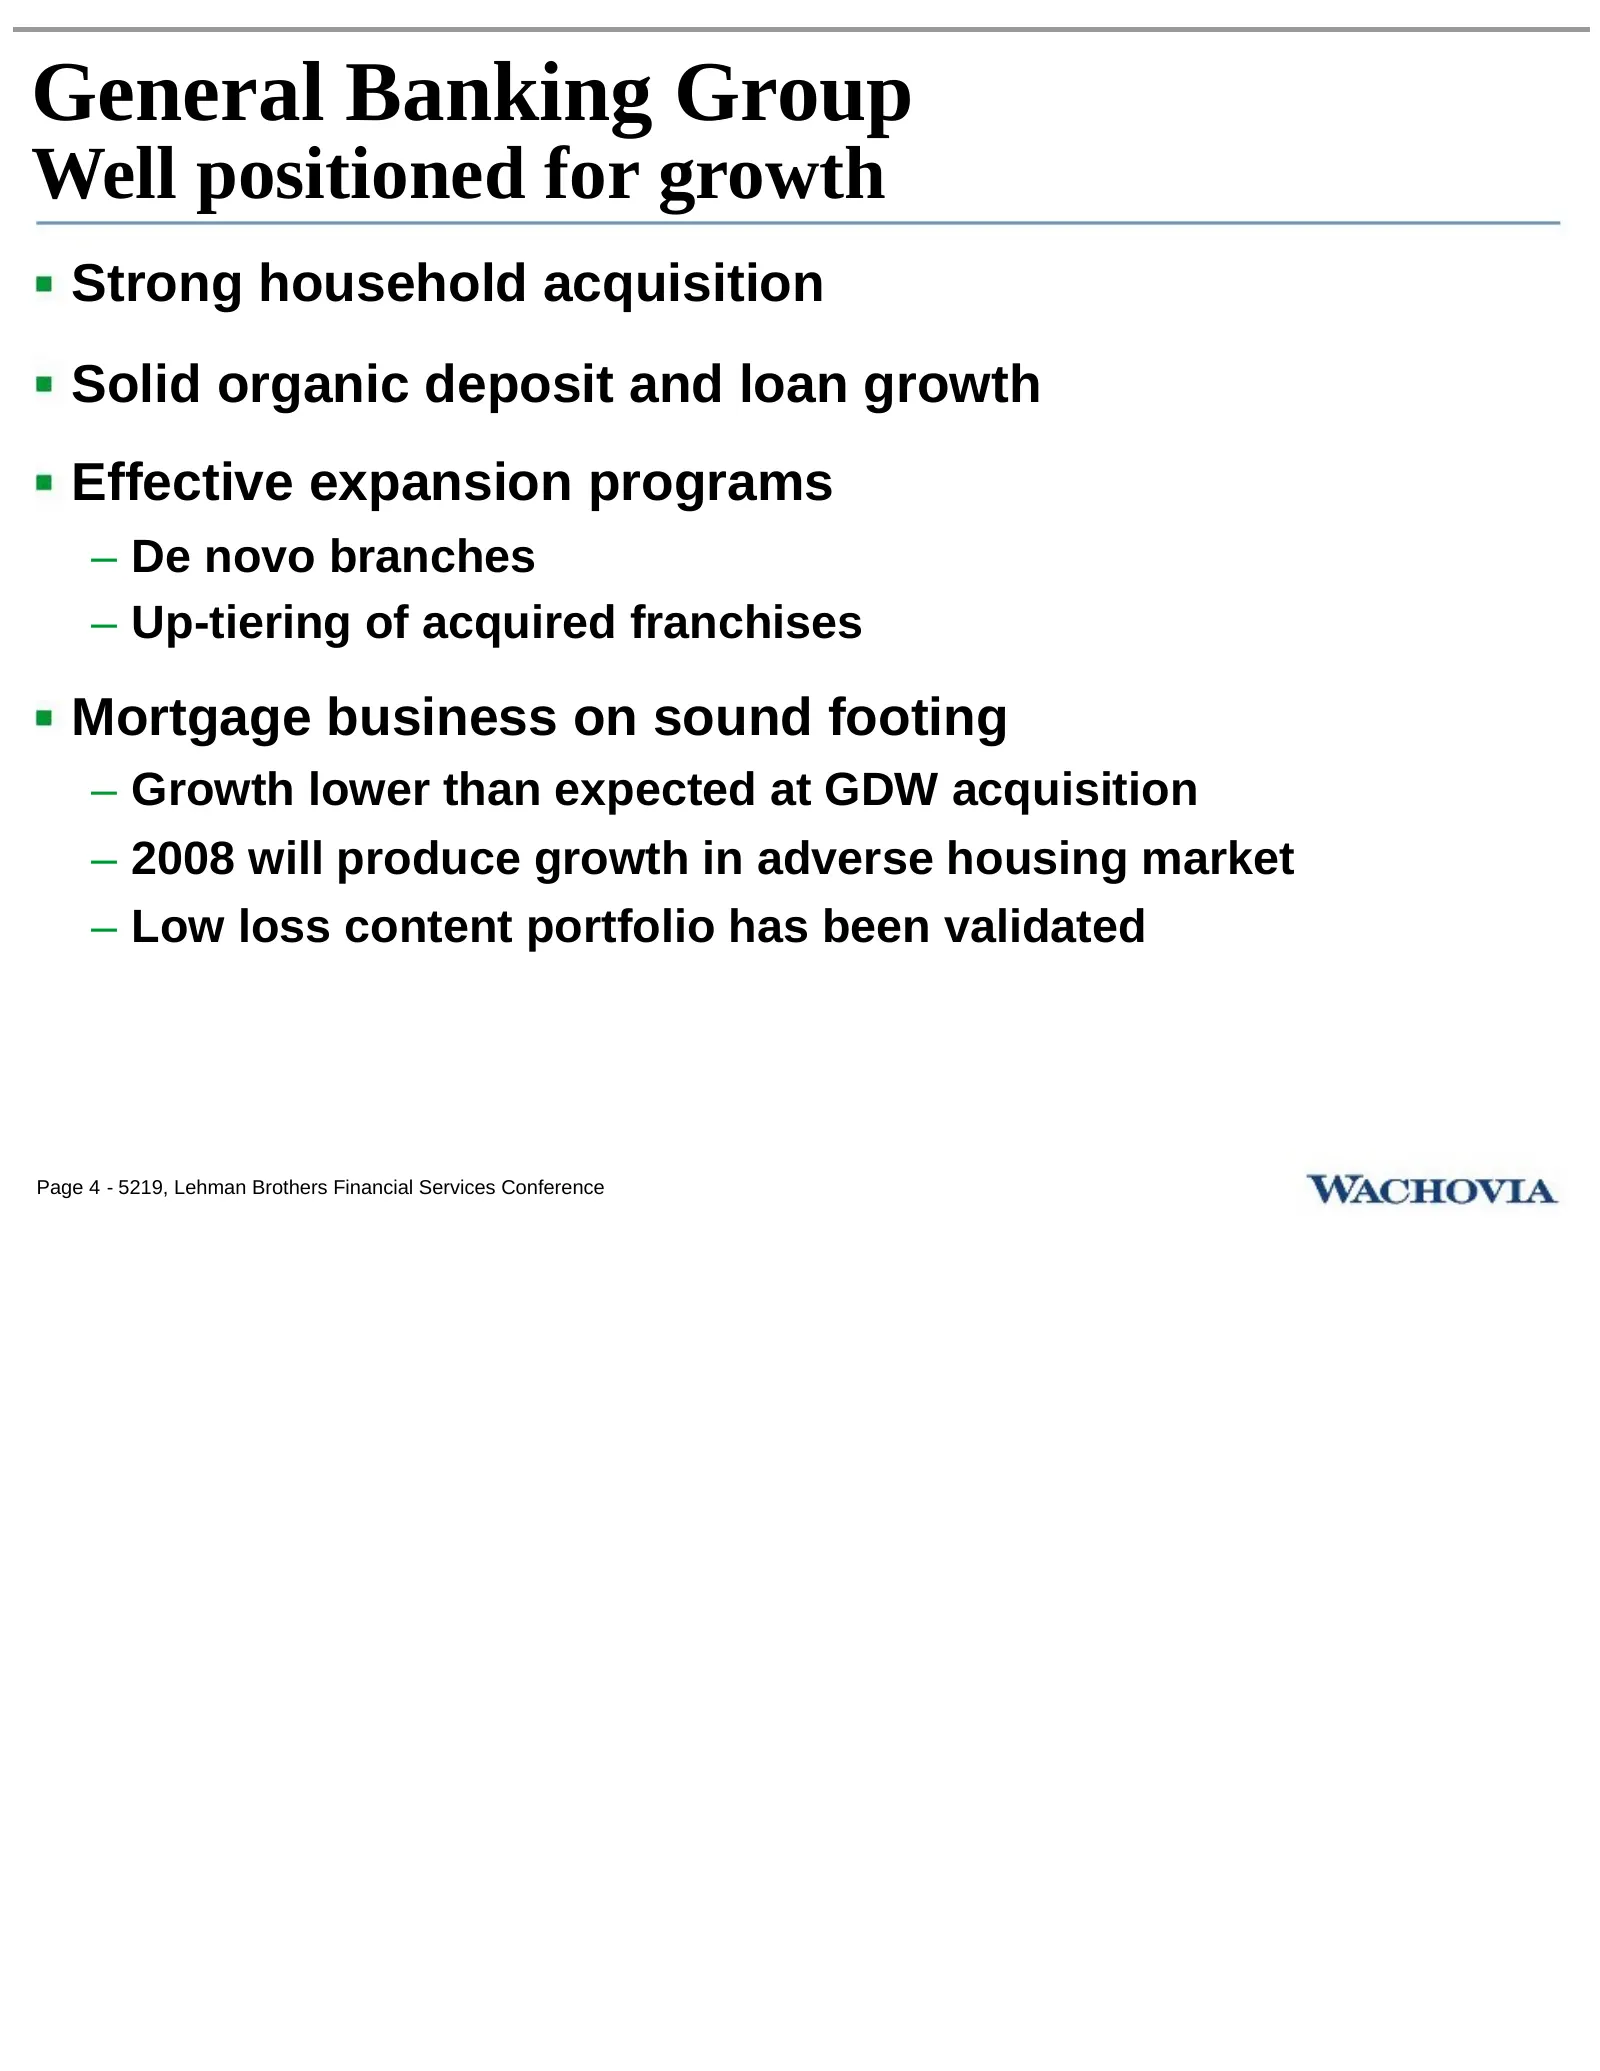
General Banking Group Well positioned for growth Strong household acquisition Solid organic deposit and loan growth Effective expansion programs – De novo branches – Up-tiering of acquired franchises Mortgage business on sound footing – Growth lower than expected at GDW acquisition – 2008 will produ
Slide 8: General Bank: Improving customer retention and acquisition
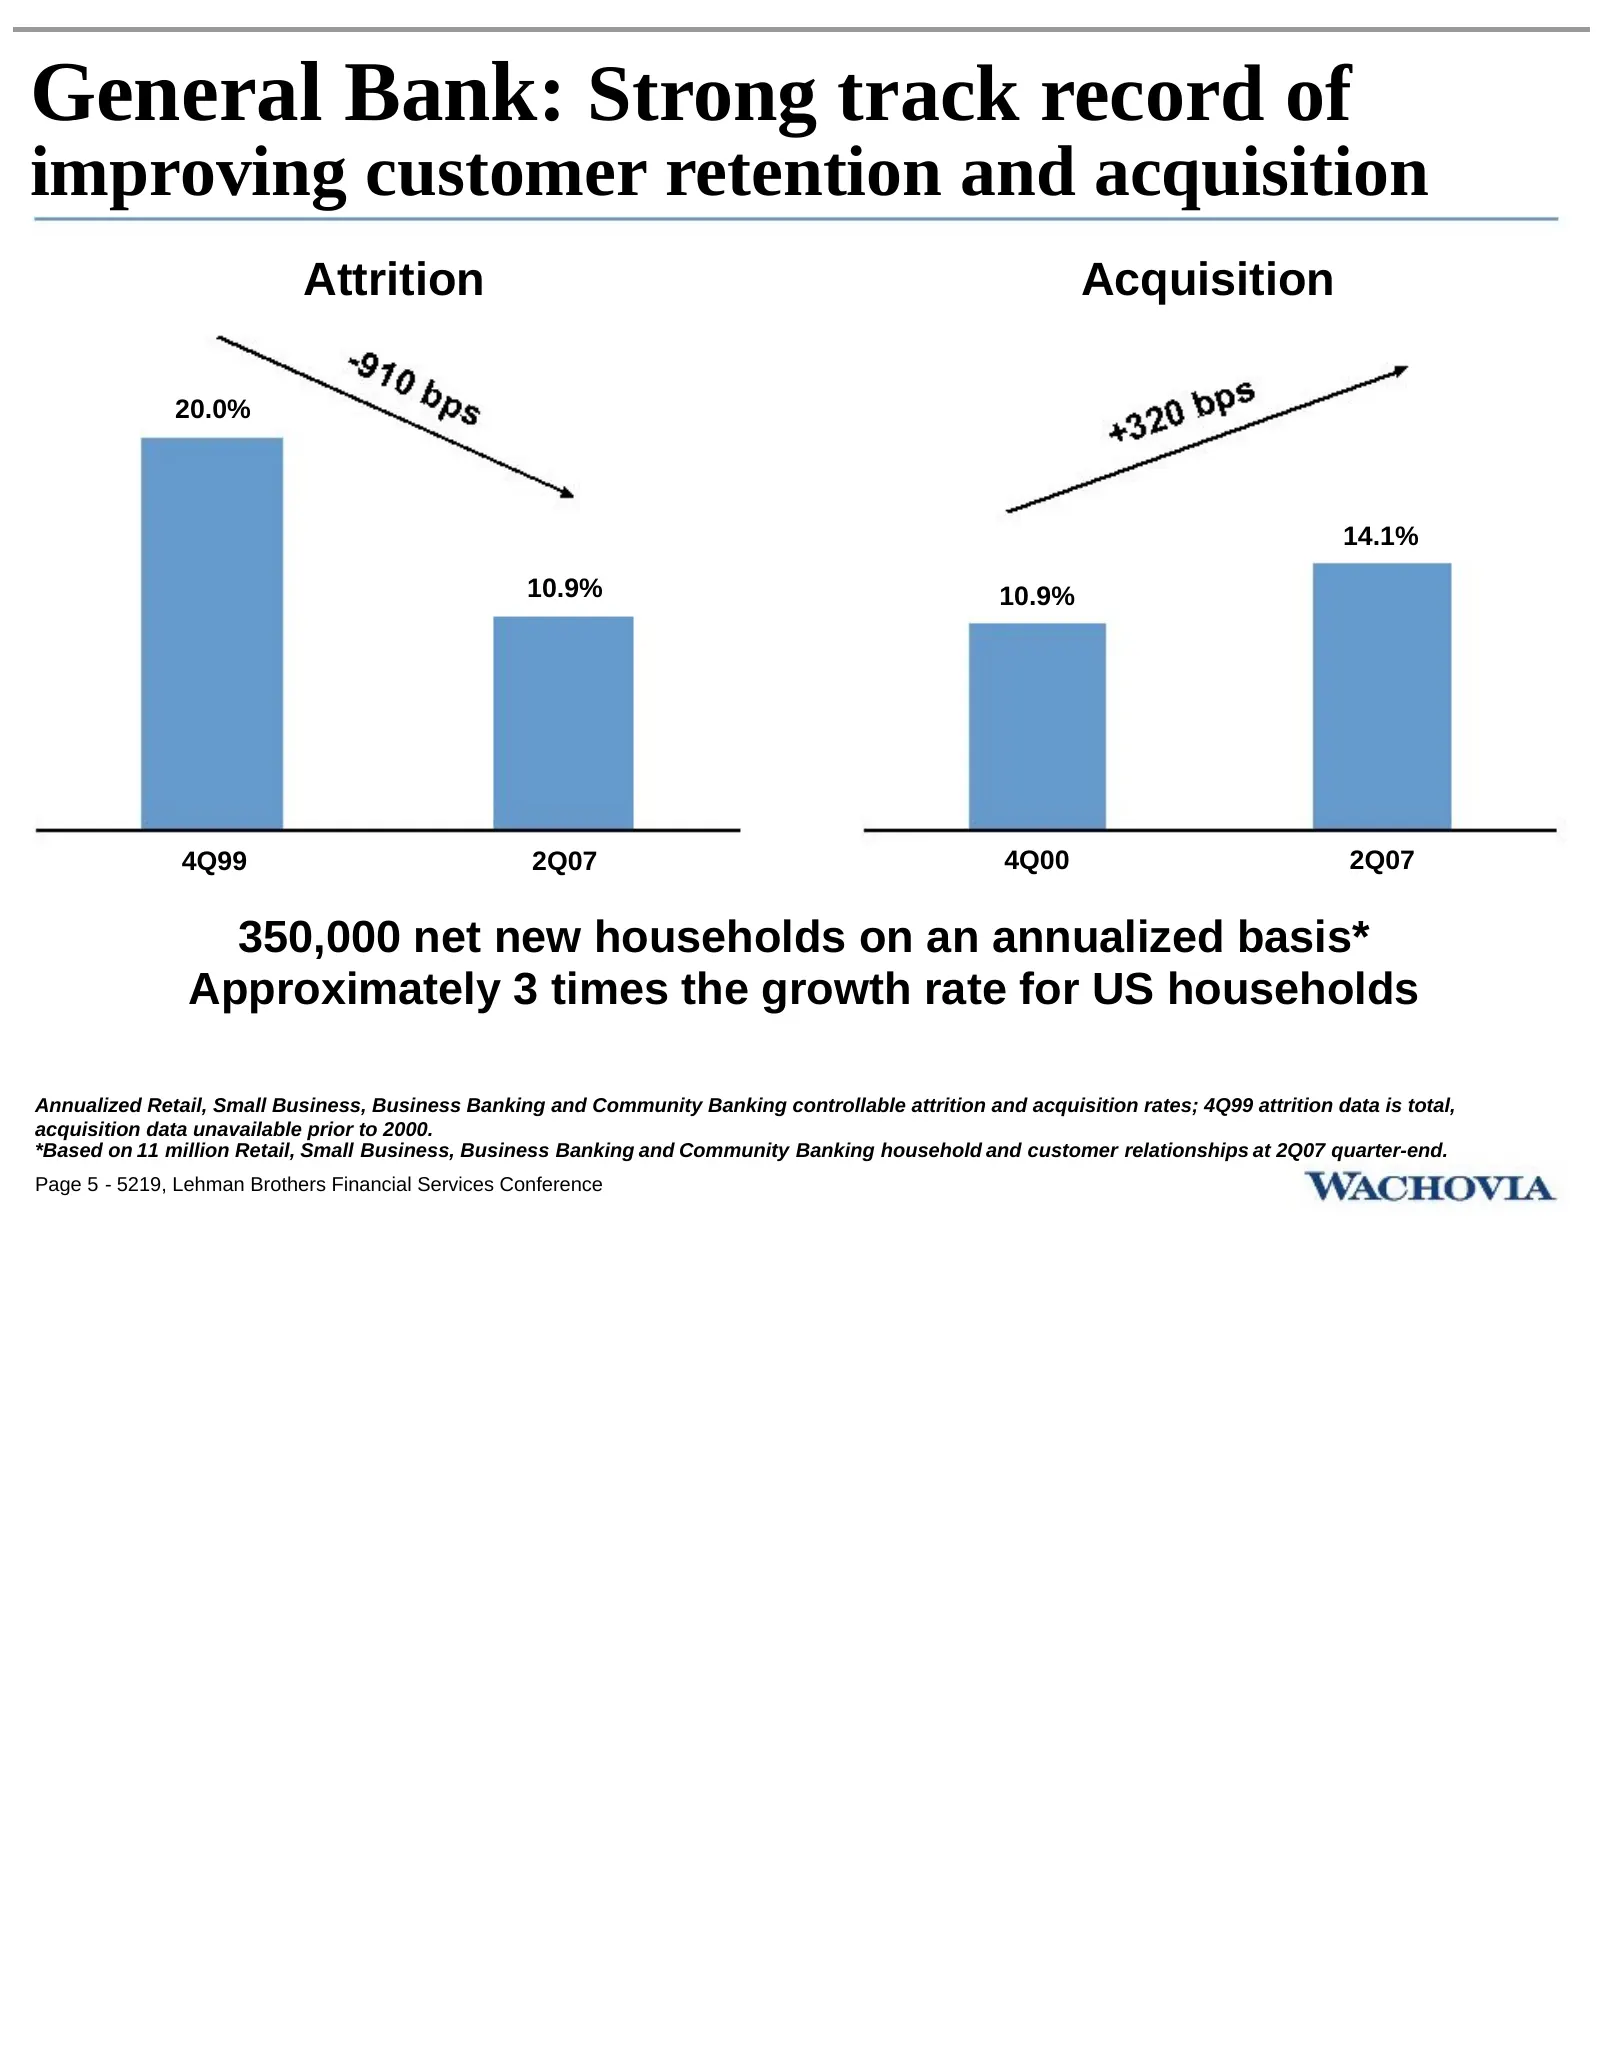
General Bank: Strong track record of improving customer retention and acquisition Attrition Acquisition 20.0% 14.1% 10.9% 10.9% 4Q99 2Q07 4Q00 2Q07 350,000 net new households on an annualized basis* Approximately 3 times the growth rate for US households Annualized Retail, Small Business, Business B
Slide 9: General Bank: De Novo success drives long-term growth
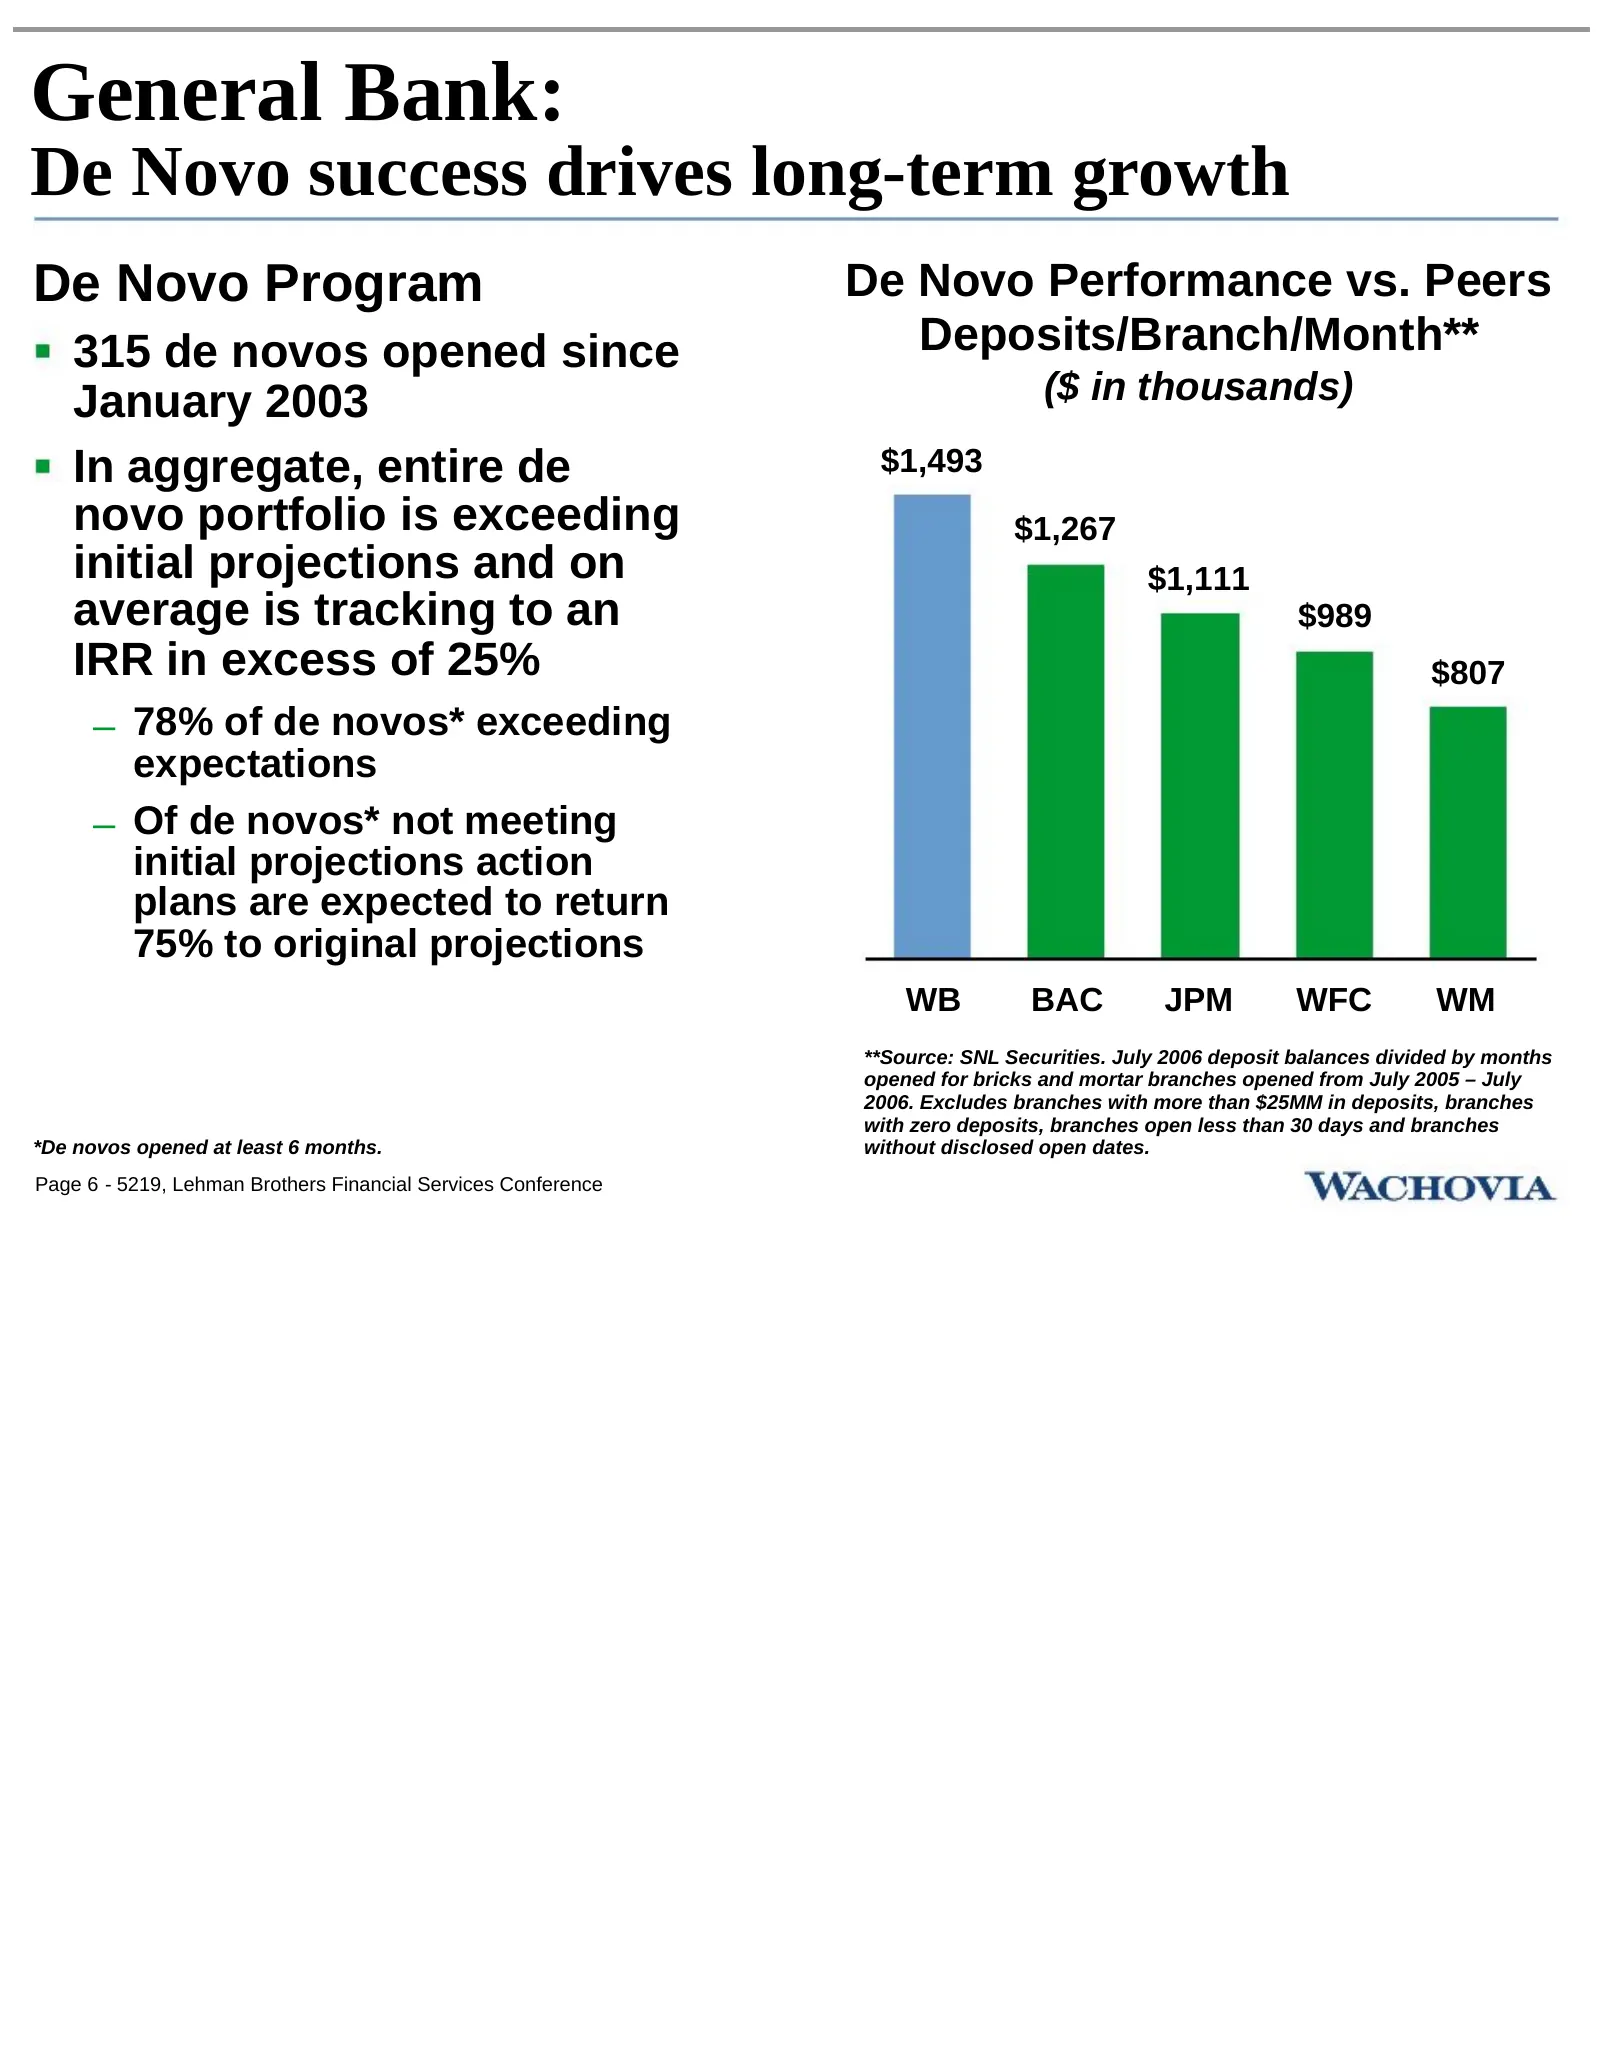
General Bank: De Novo success drives long-term growth De Novo Program De Novo Performance vs. Peers 315 de novos opened since Deposits/Branch/Month** January 2003 ($ in thousands) In aggregate, entire de $1,493 novo portfolio is exceeding $1,267 initial projections and on $1,111 average is tracking
Slide 10: General Bank: Track record of leveraging acquisitions
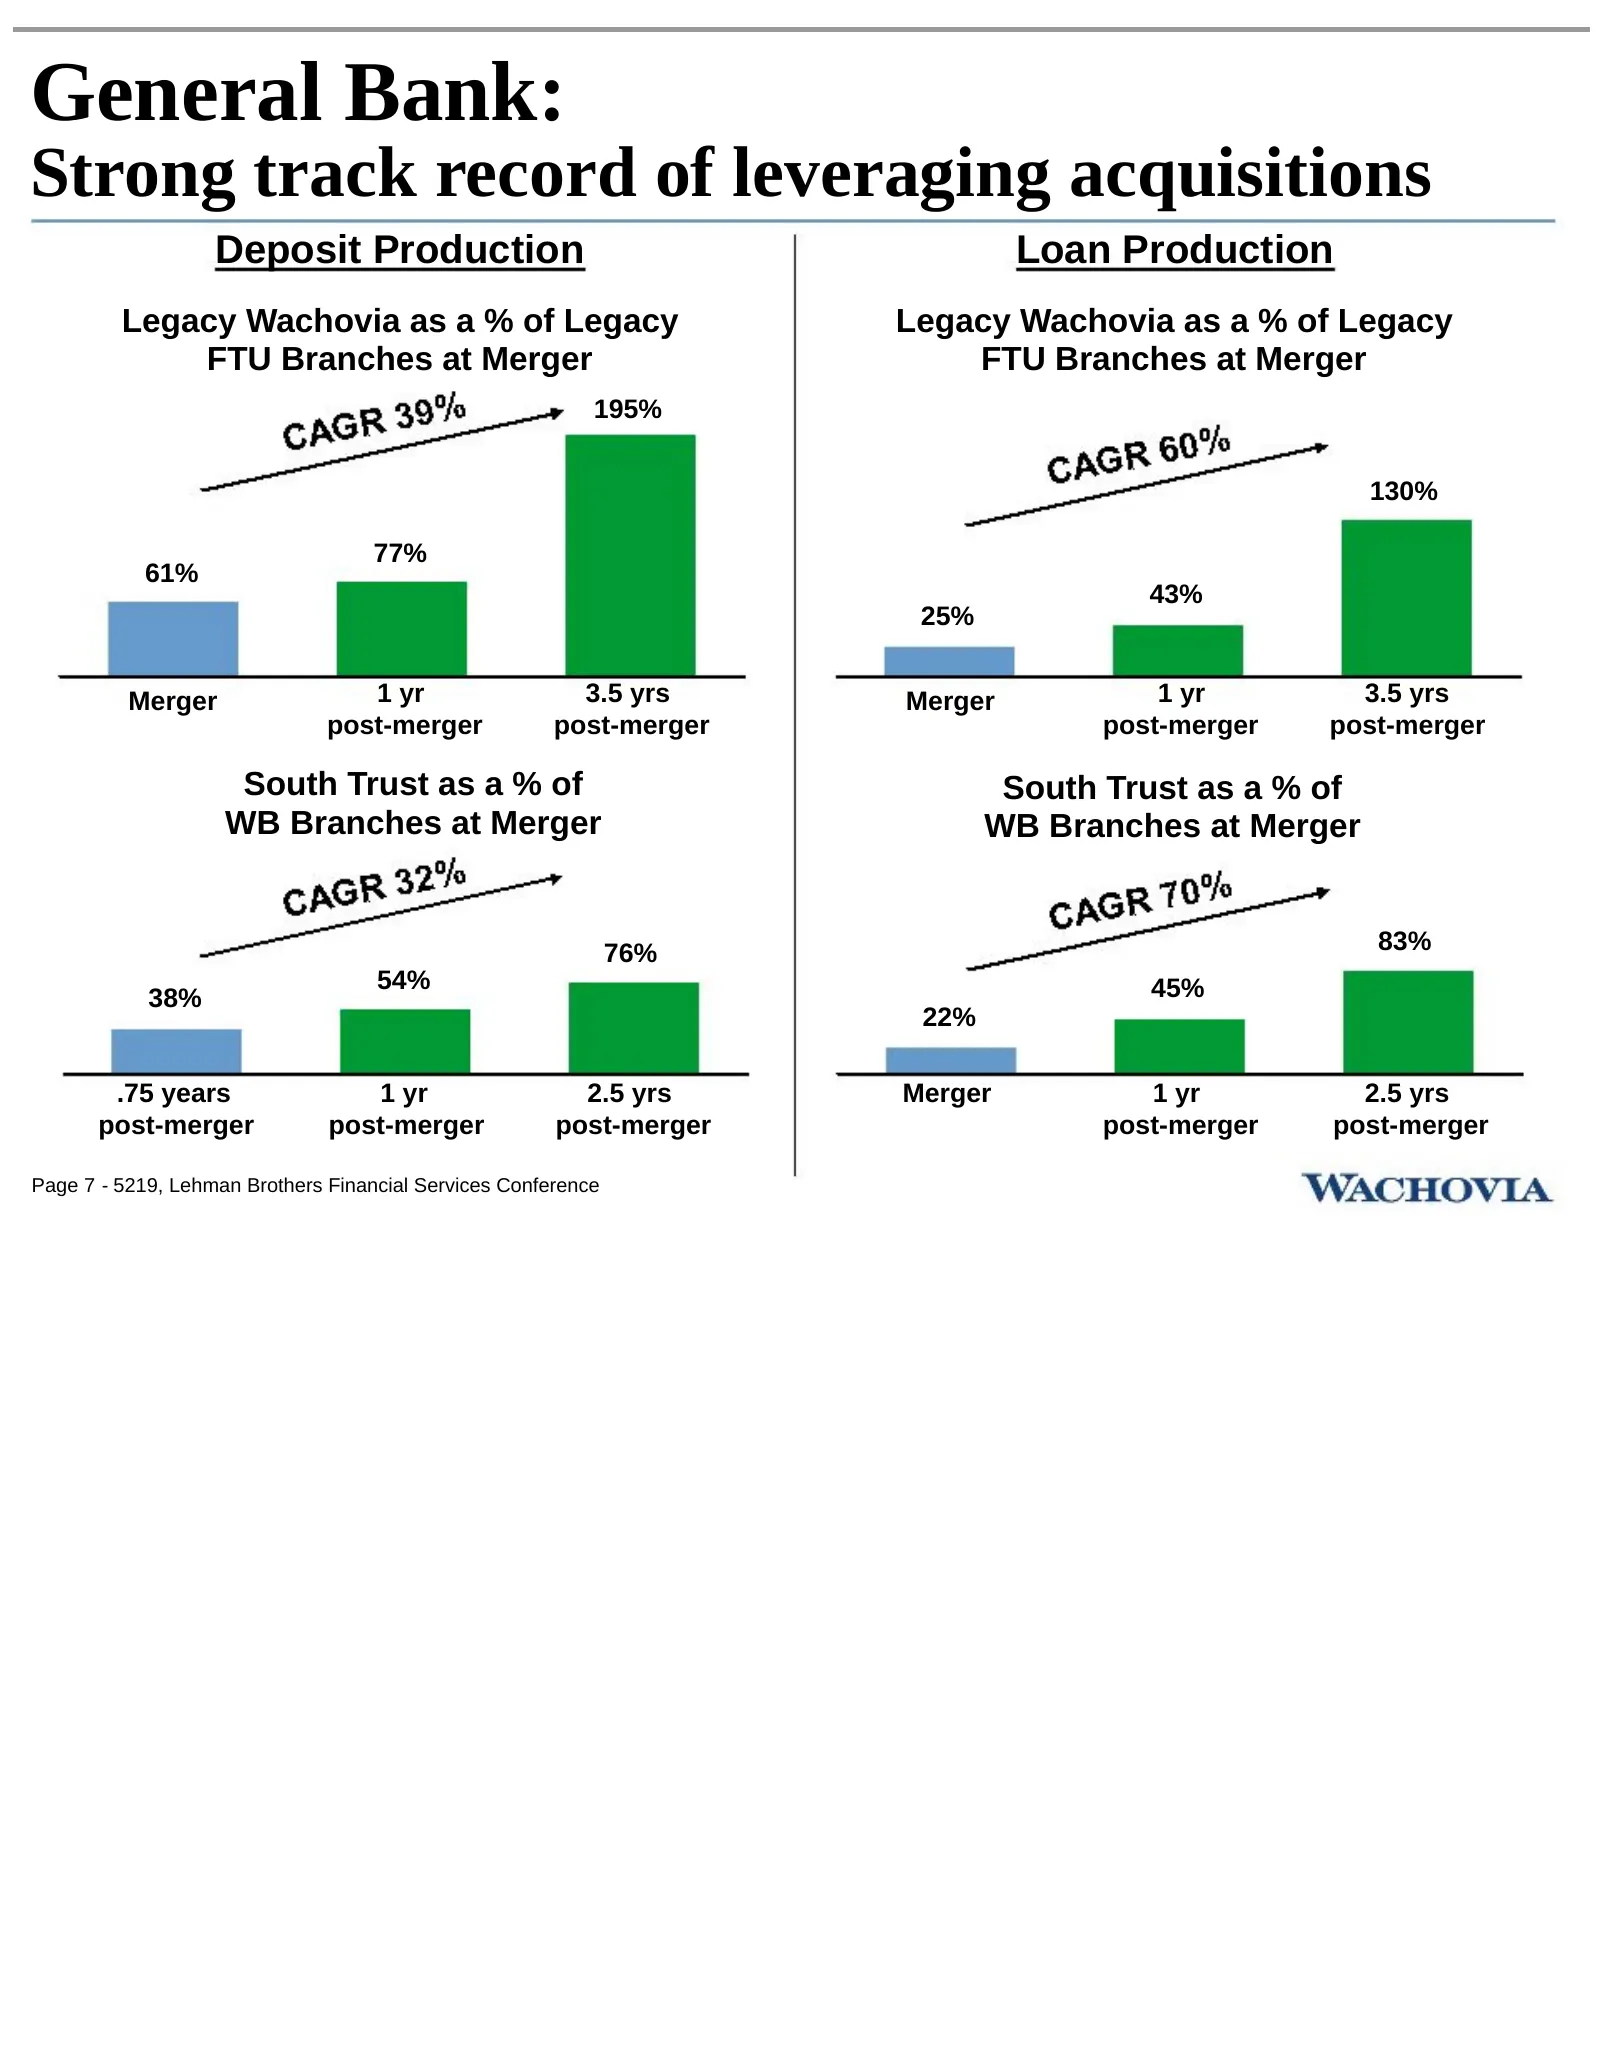
General Bank: Strong track record of leveraging acquisitions Deposit Production Loan Production Legacy Wachovia as a % of Legacy Legacy Wachovia as a % of Legacy FTU Branches at Merger FTU Branches at Merger 195% 130% 77% 61% 43% 25% Merger 1 yr 3.5 yrs Merger 1 yr 3.5 yrs post-merger post-merger po
Slide 11: General Bank: Strong track record of sales growth
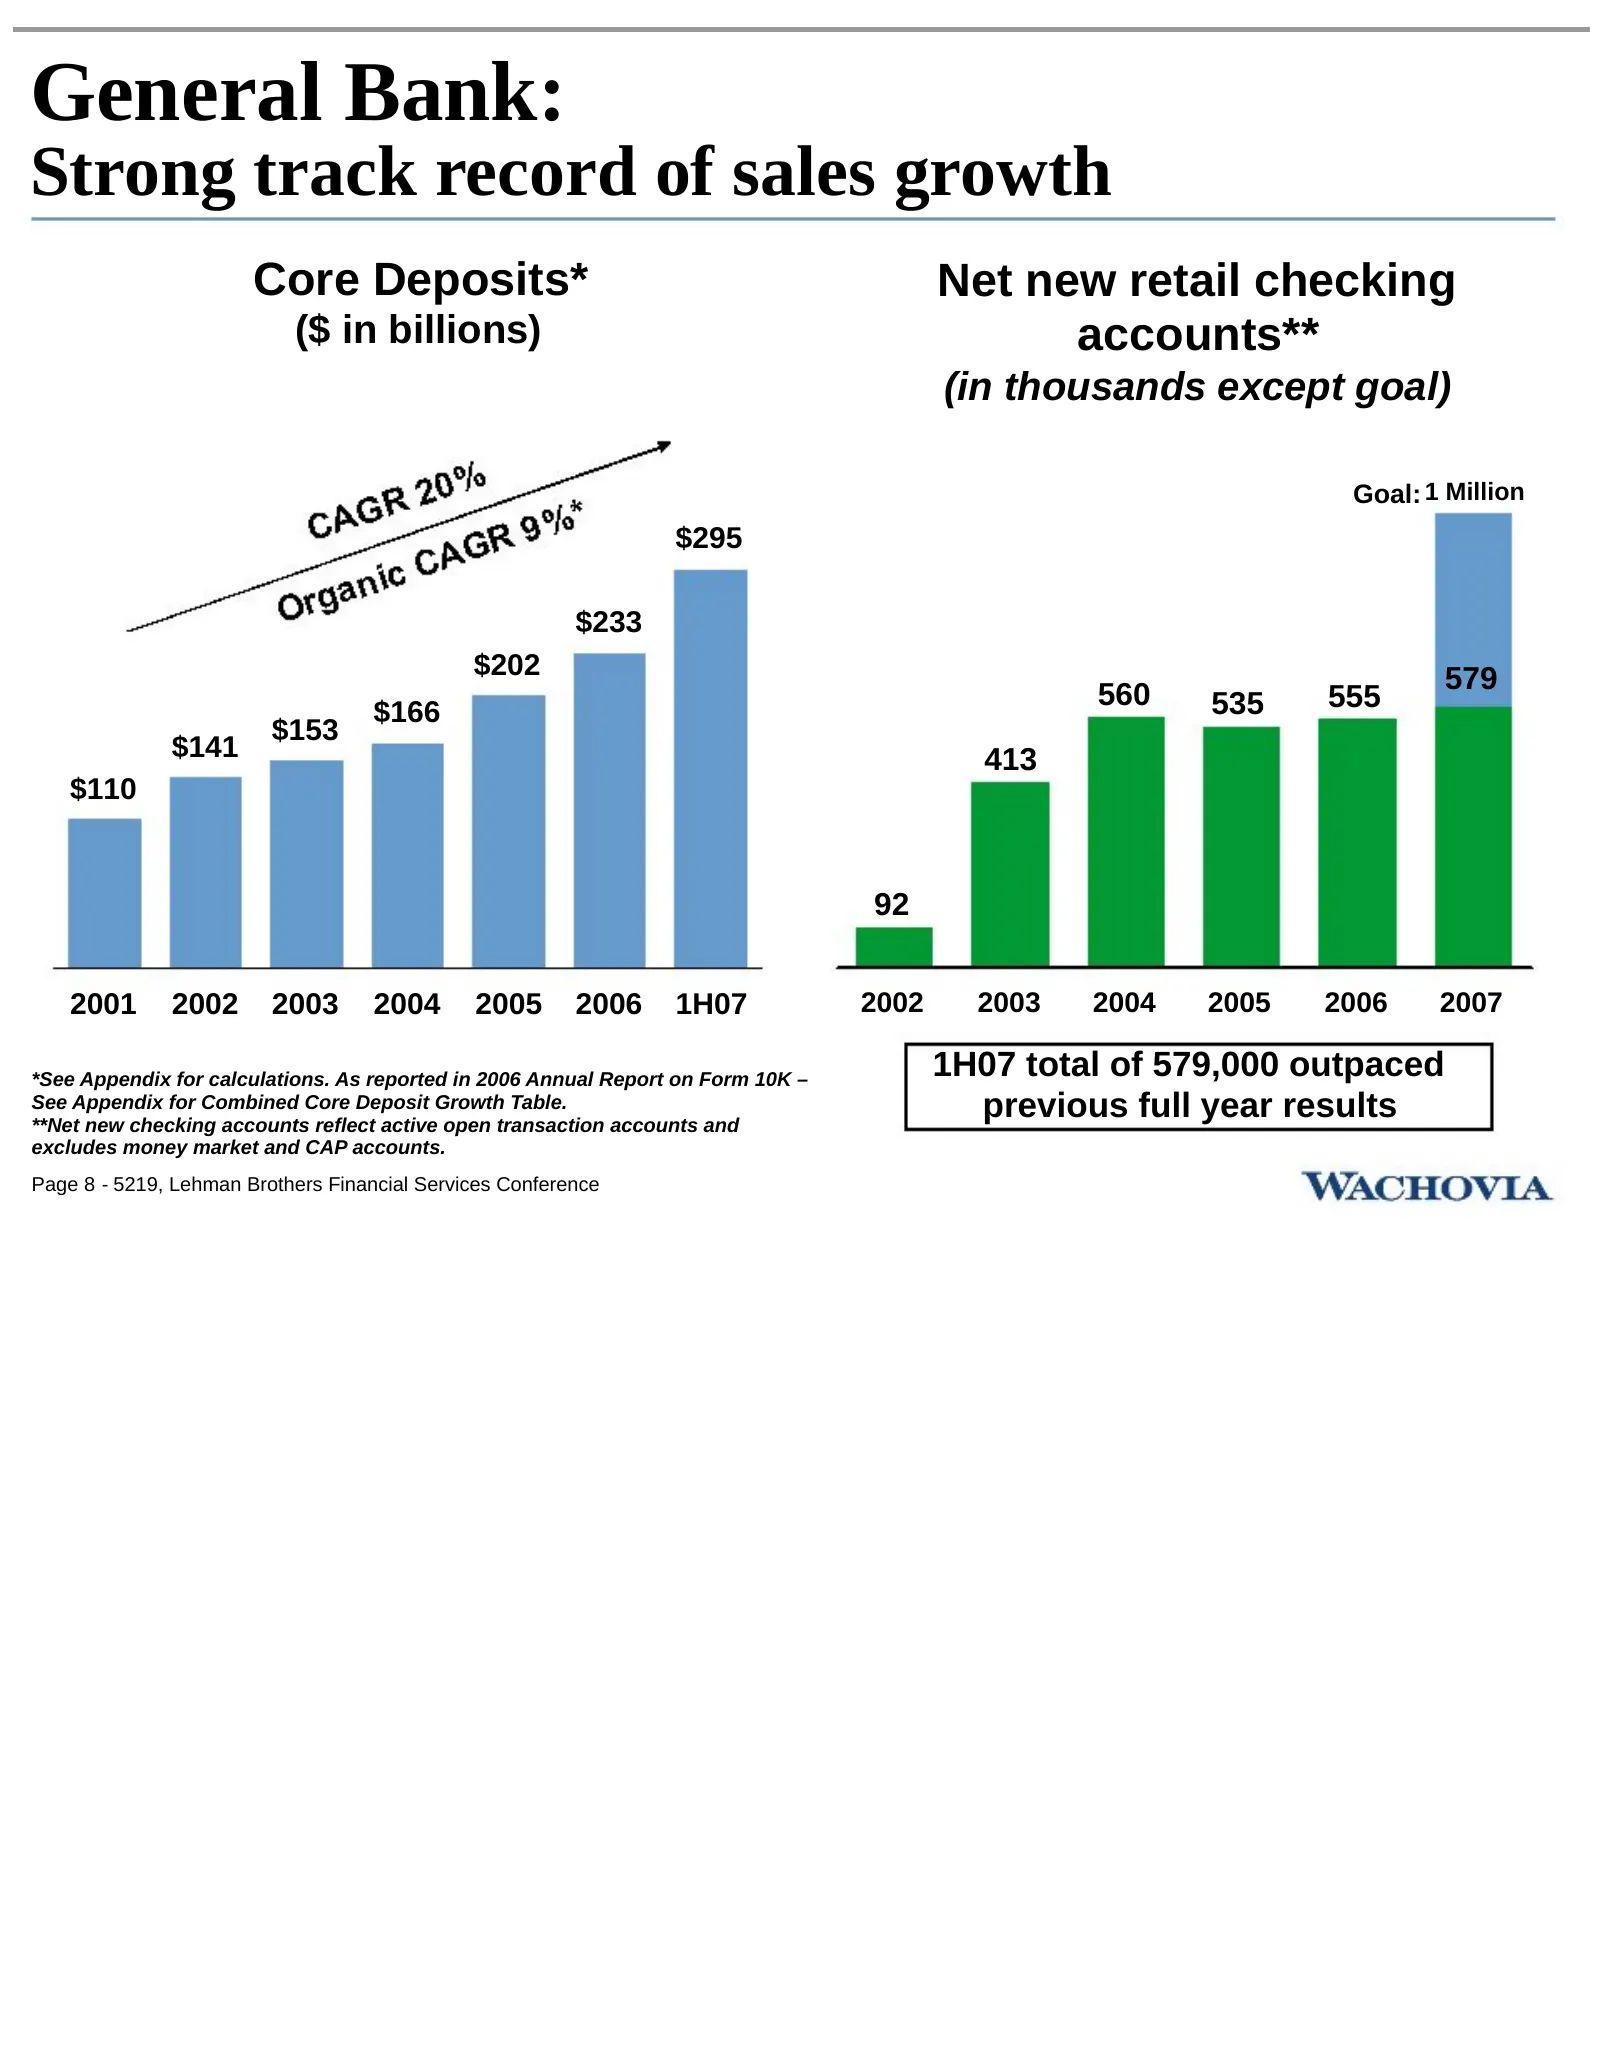
General Bank: Strong track record of sales growth Core Deposits* Net new retail checking ($ in billions) accounts** (in thousands except goal) Goal: 1 Million $295 $233 $202 579 560 535 555 $166 $153 $141 413 $110 92 2001 2002 2003 2004 2005 2006 1H07 2002 2003 2004 2005 2006 2007 *See Appendix for
Slide 12: General Bank: Leveraging the Golden West acquisition
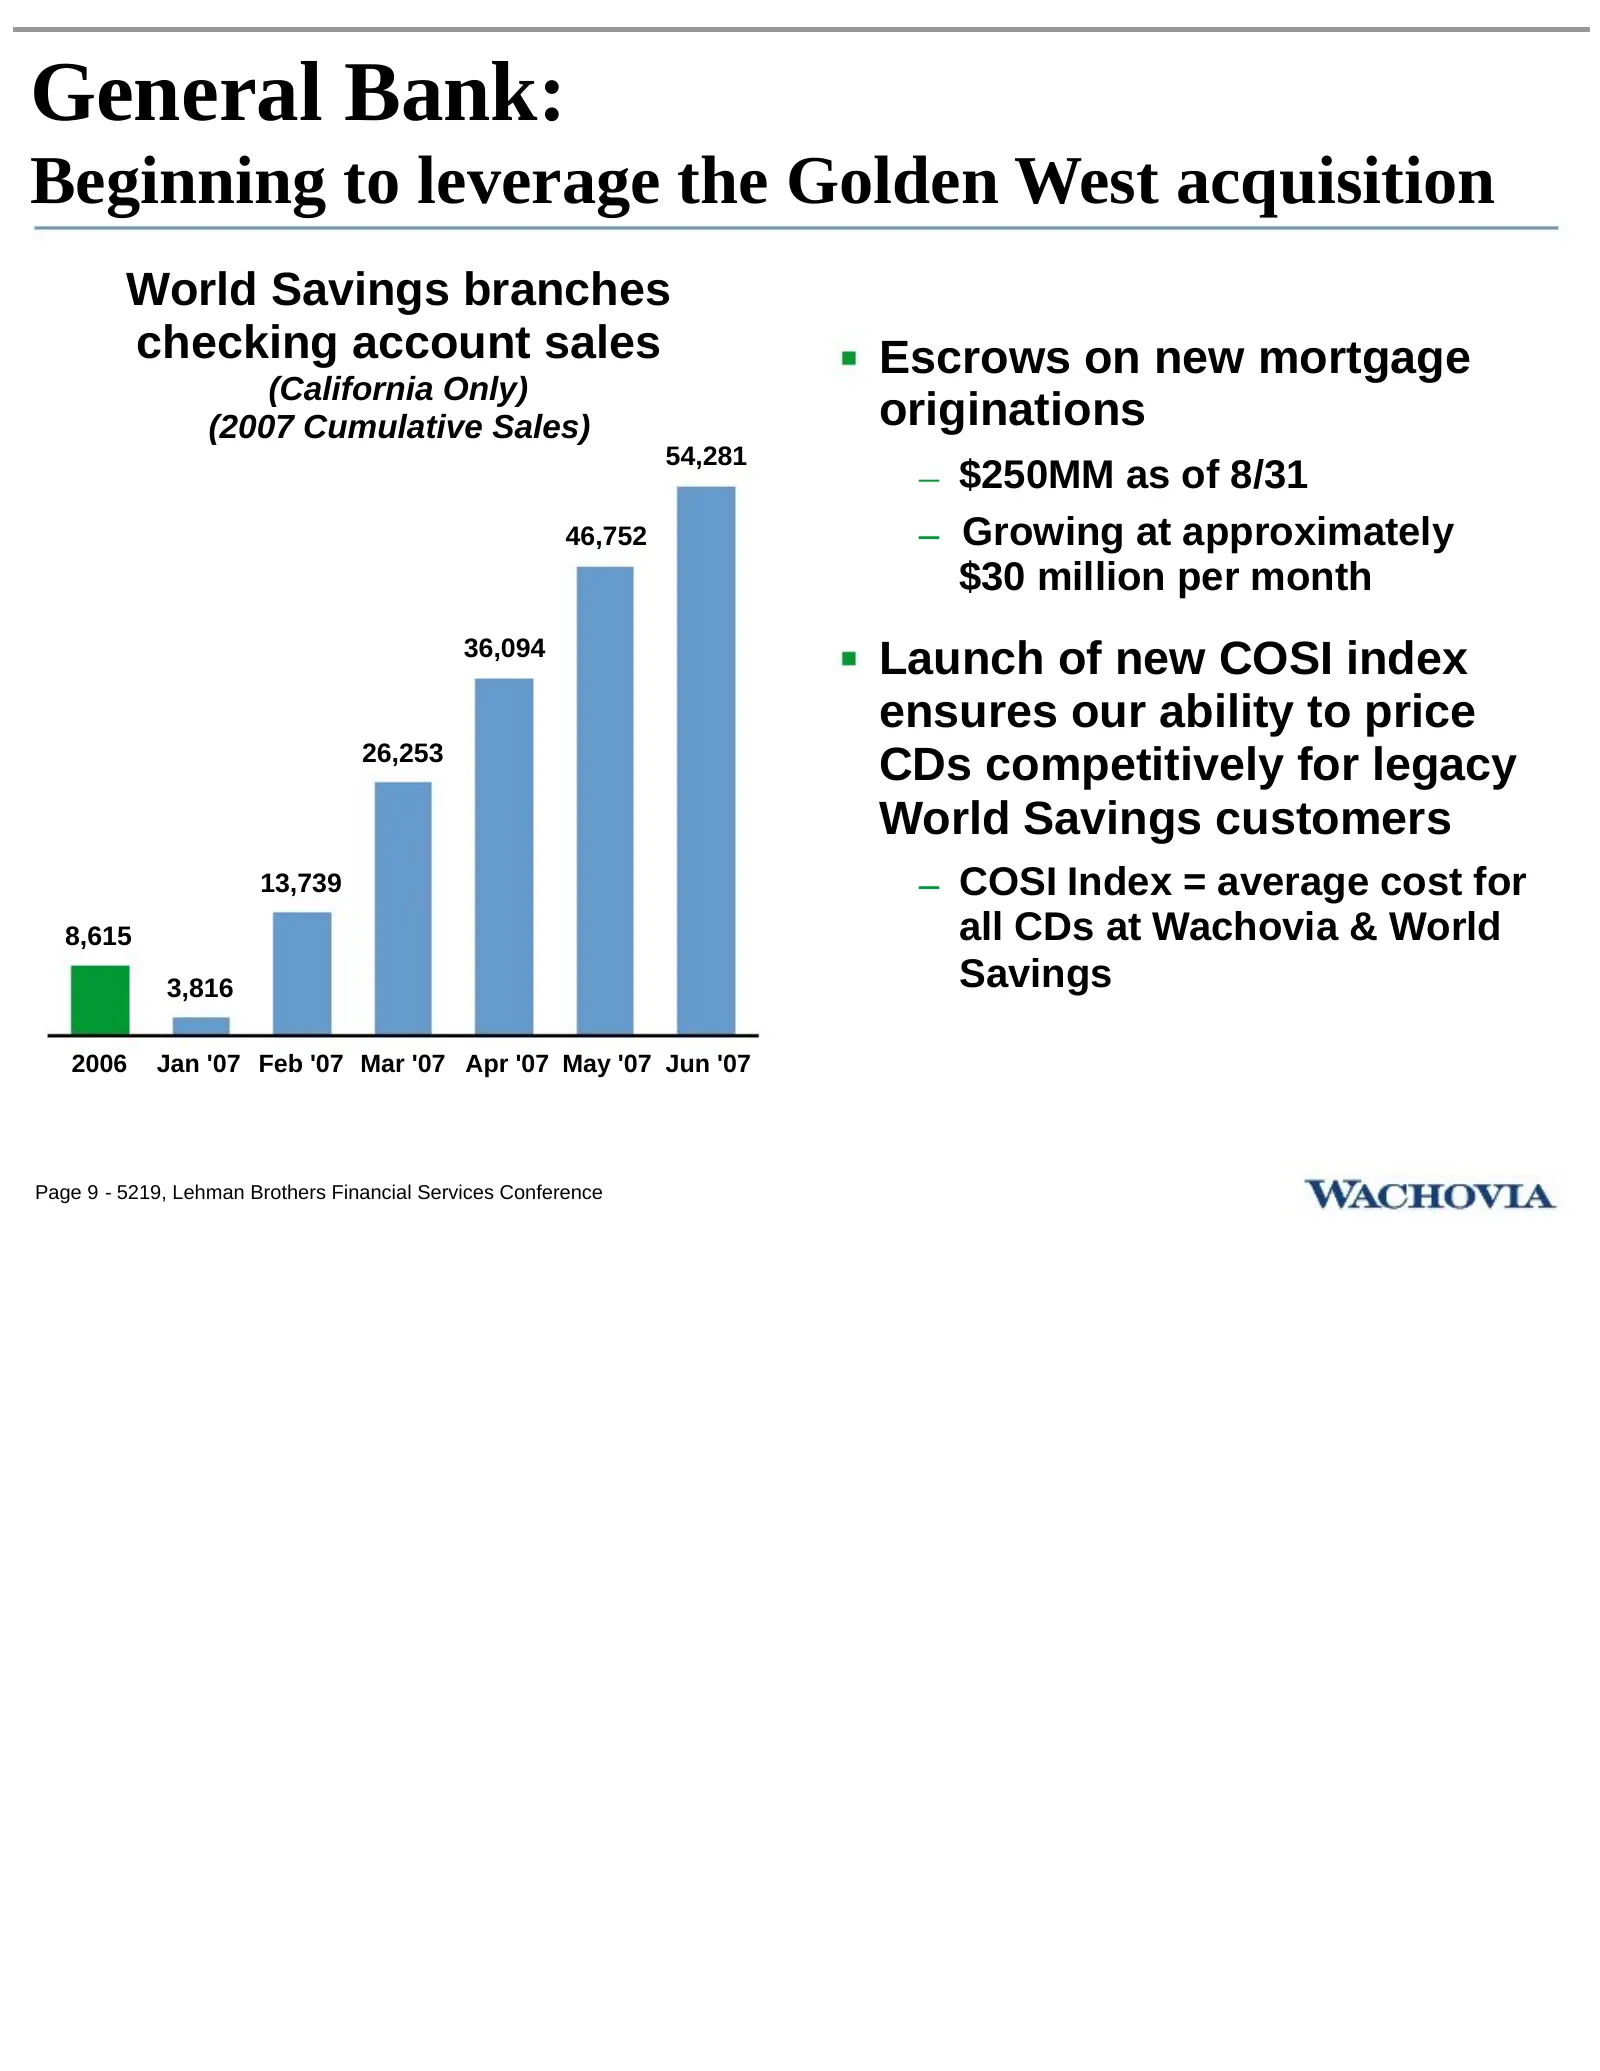
General Bank: Beginning to leverage the Golden West acquisition World Savings branches checking account sales Escrows on new mortgage (California Only) (2007 Cumulative Sales) originations 54,281 – $250MM as of 8/31 46,752 – Growing at approximately $30 million per month 36,094 Launch of new COSI in
Slide 13: General Bank: Disciplined expense control
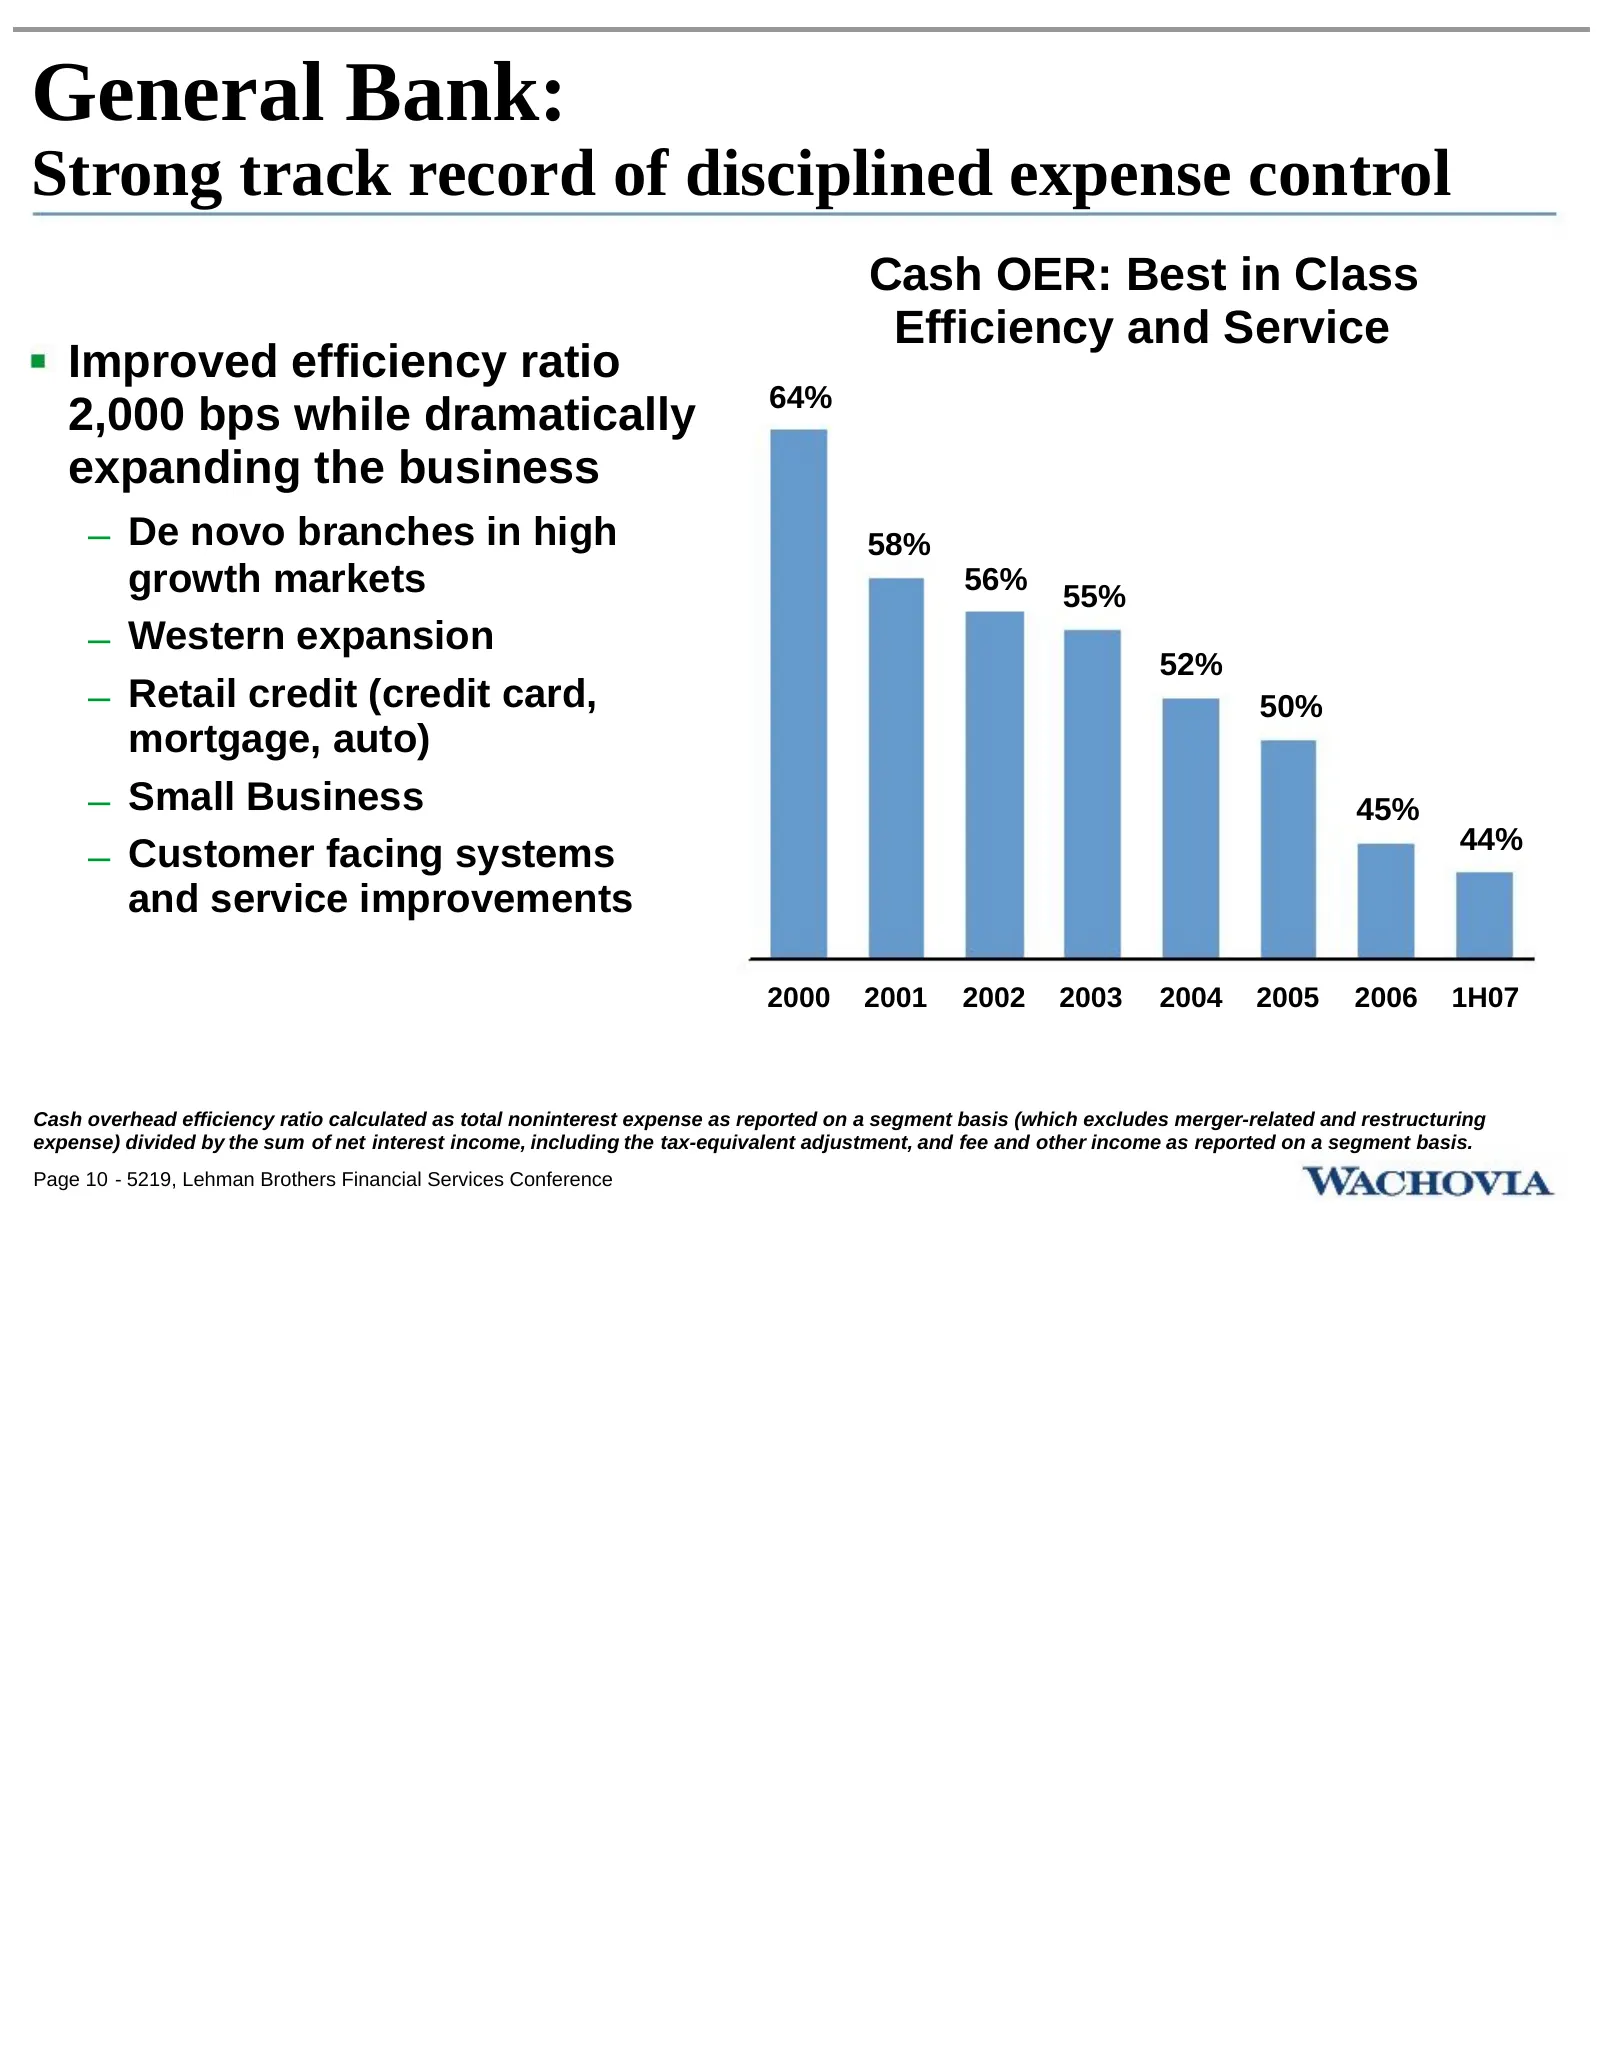
General Bank: Strong track record of disciplined expense control Cash OER: Best in Class Efficiency and Service Improved efficiency ratio 64% 2,000 bps while dramatically expanding the business – De novo branches in high 58% growth markets 56% 55% – Western expansion 52% – Retail credit (credit card
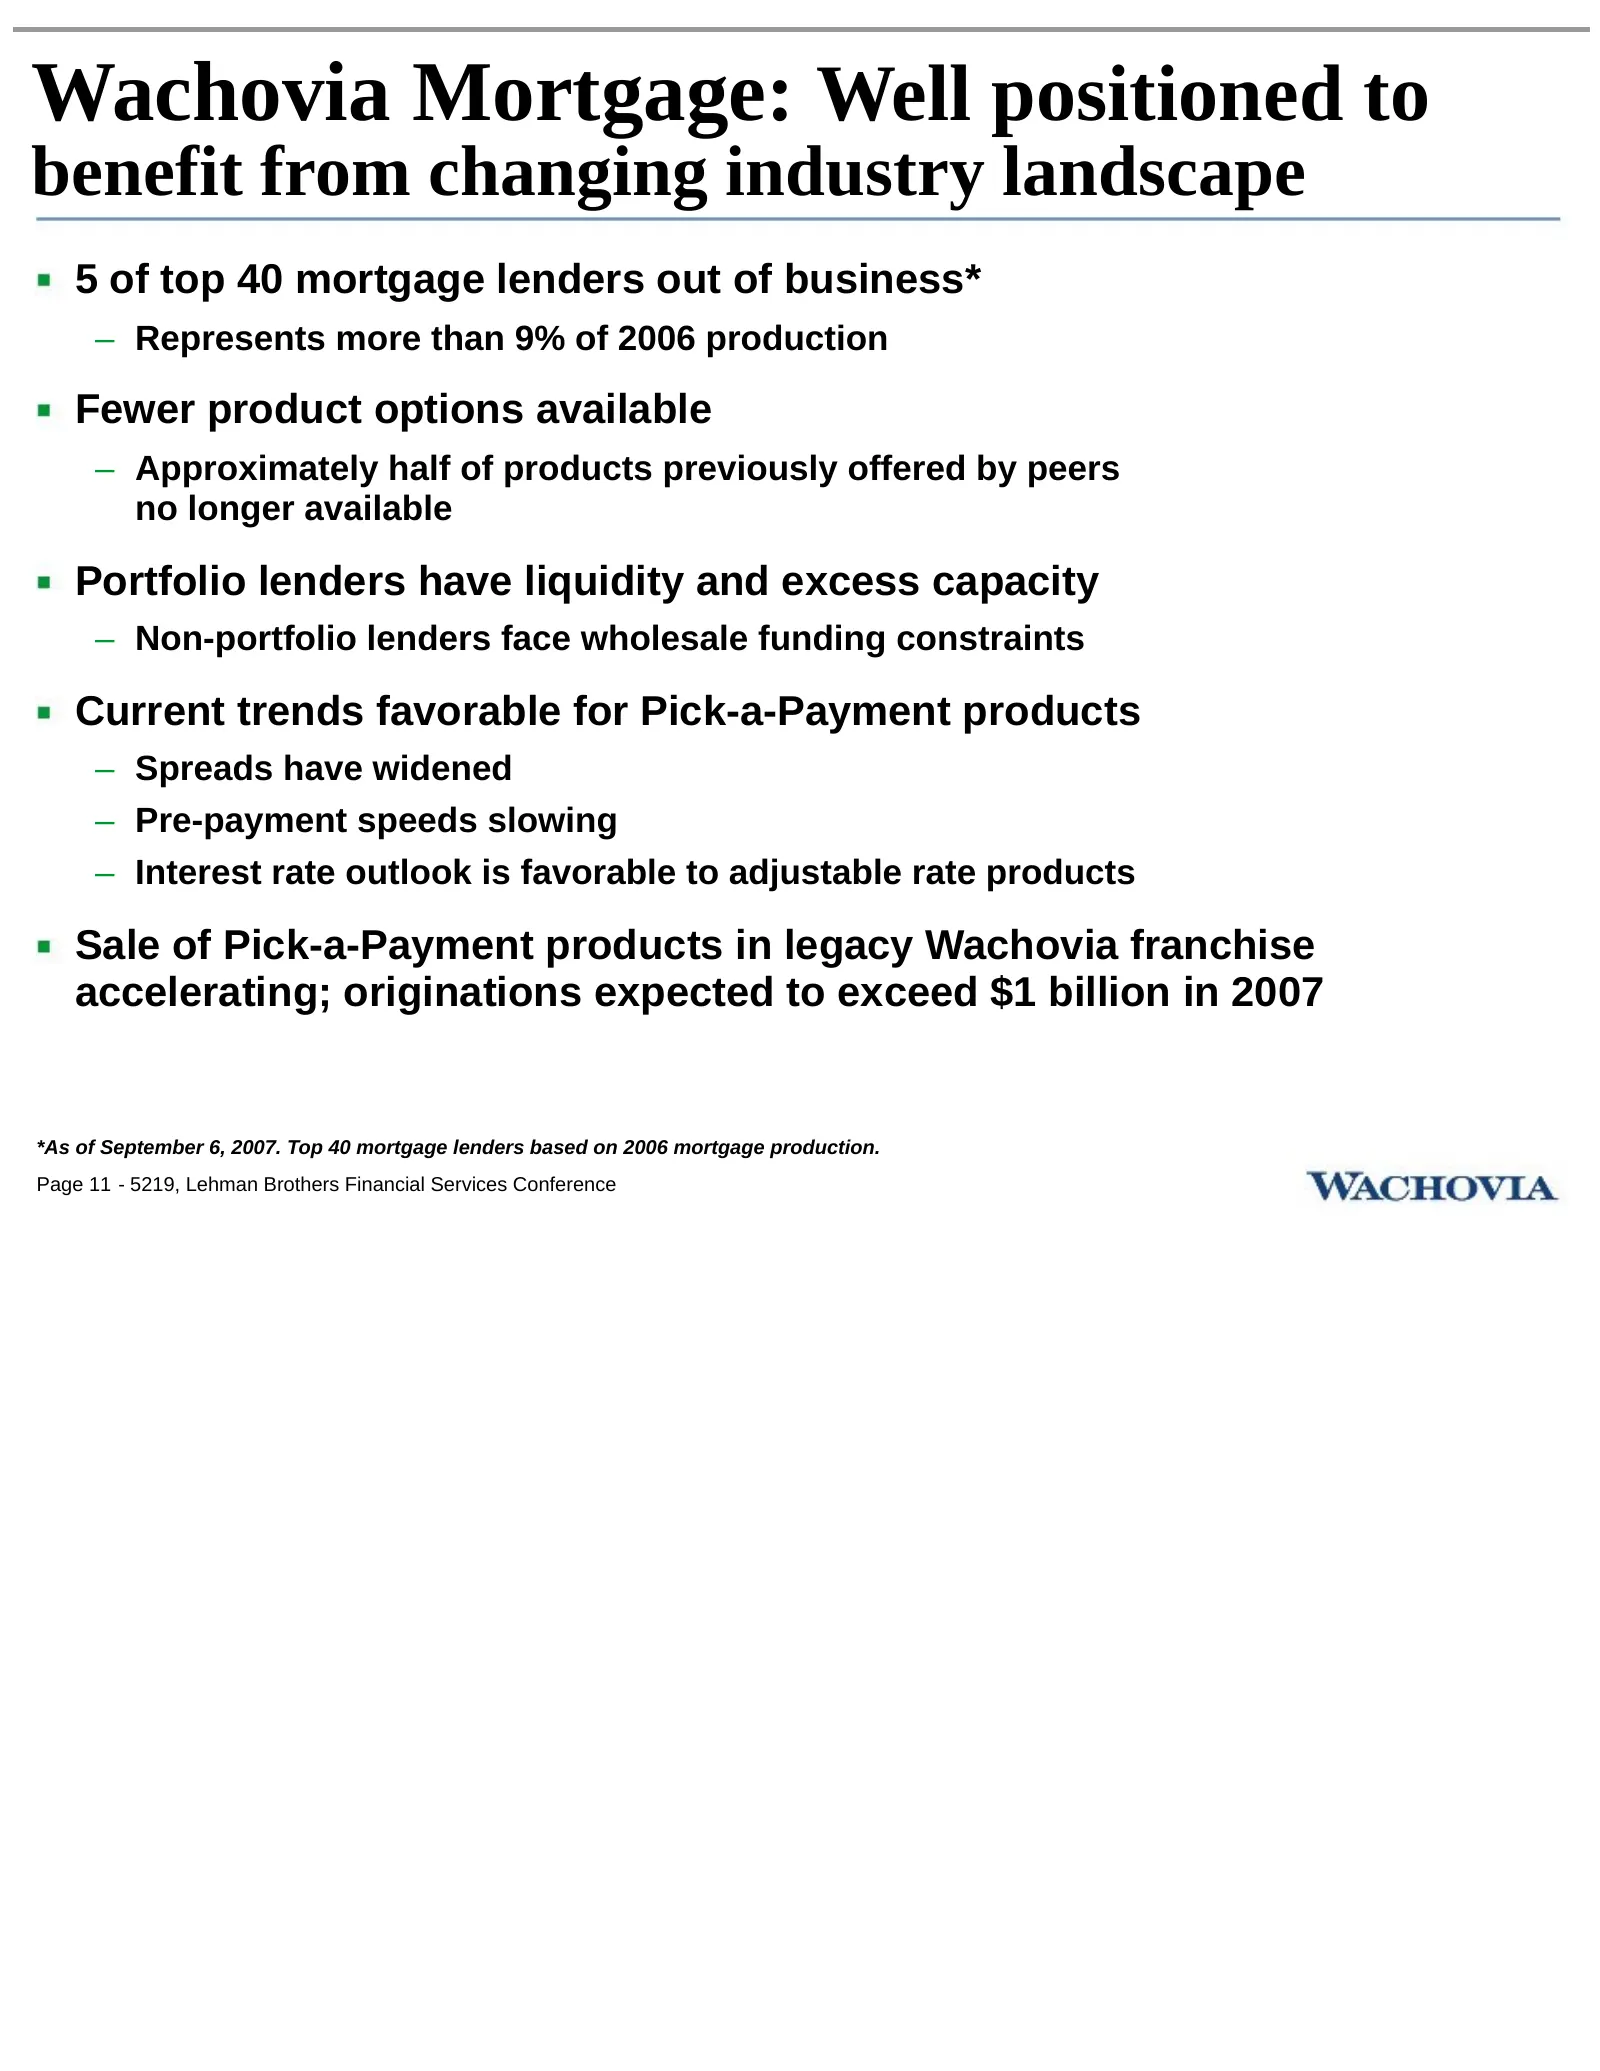
Slide 14: Wachovia Mortgage: Positioned to benefit from changing industry landscape
Wachovia Mortgage: Well positioned to benefit from changing industry landscape 5 of top 40 mortgage lenders out of business* – Represents more than 9% of 2006 production Fewer product options available – Approximately half of products previously offered by peers no longer available Portfolio lenders
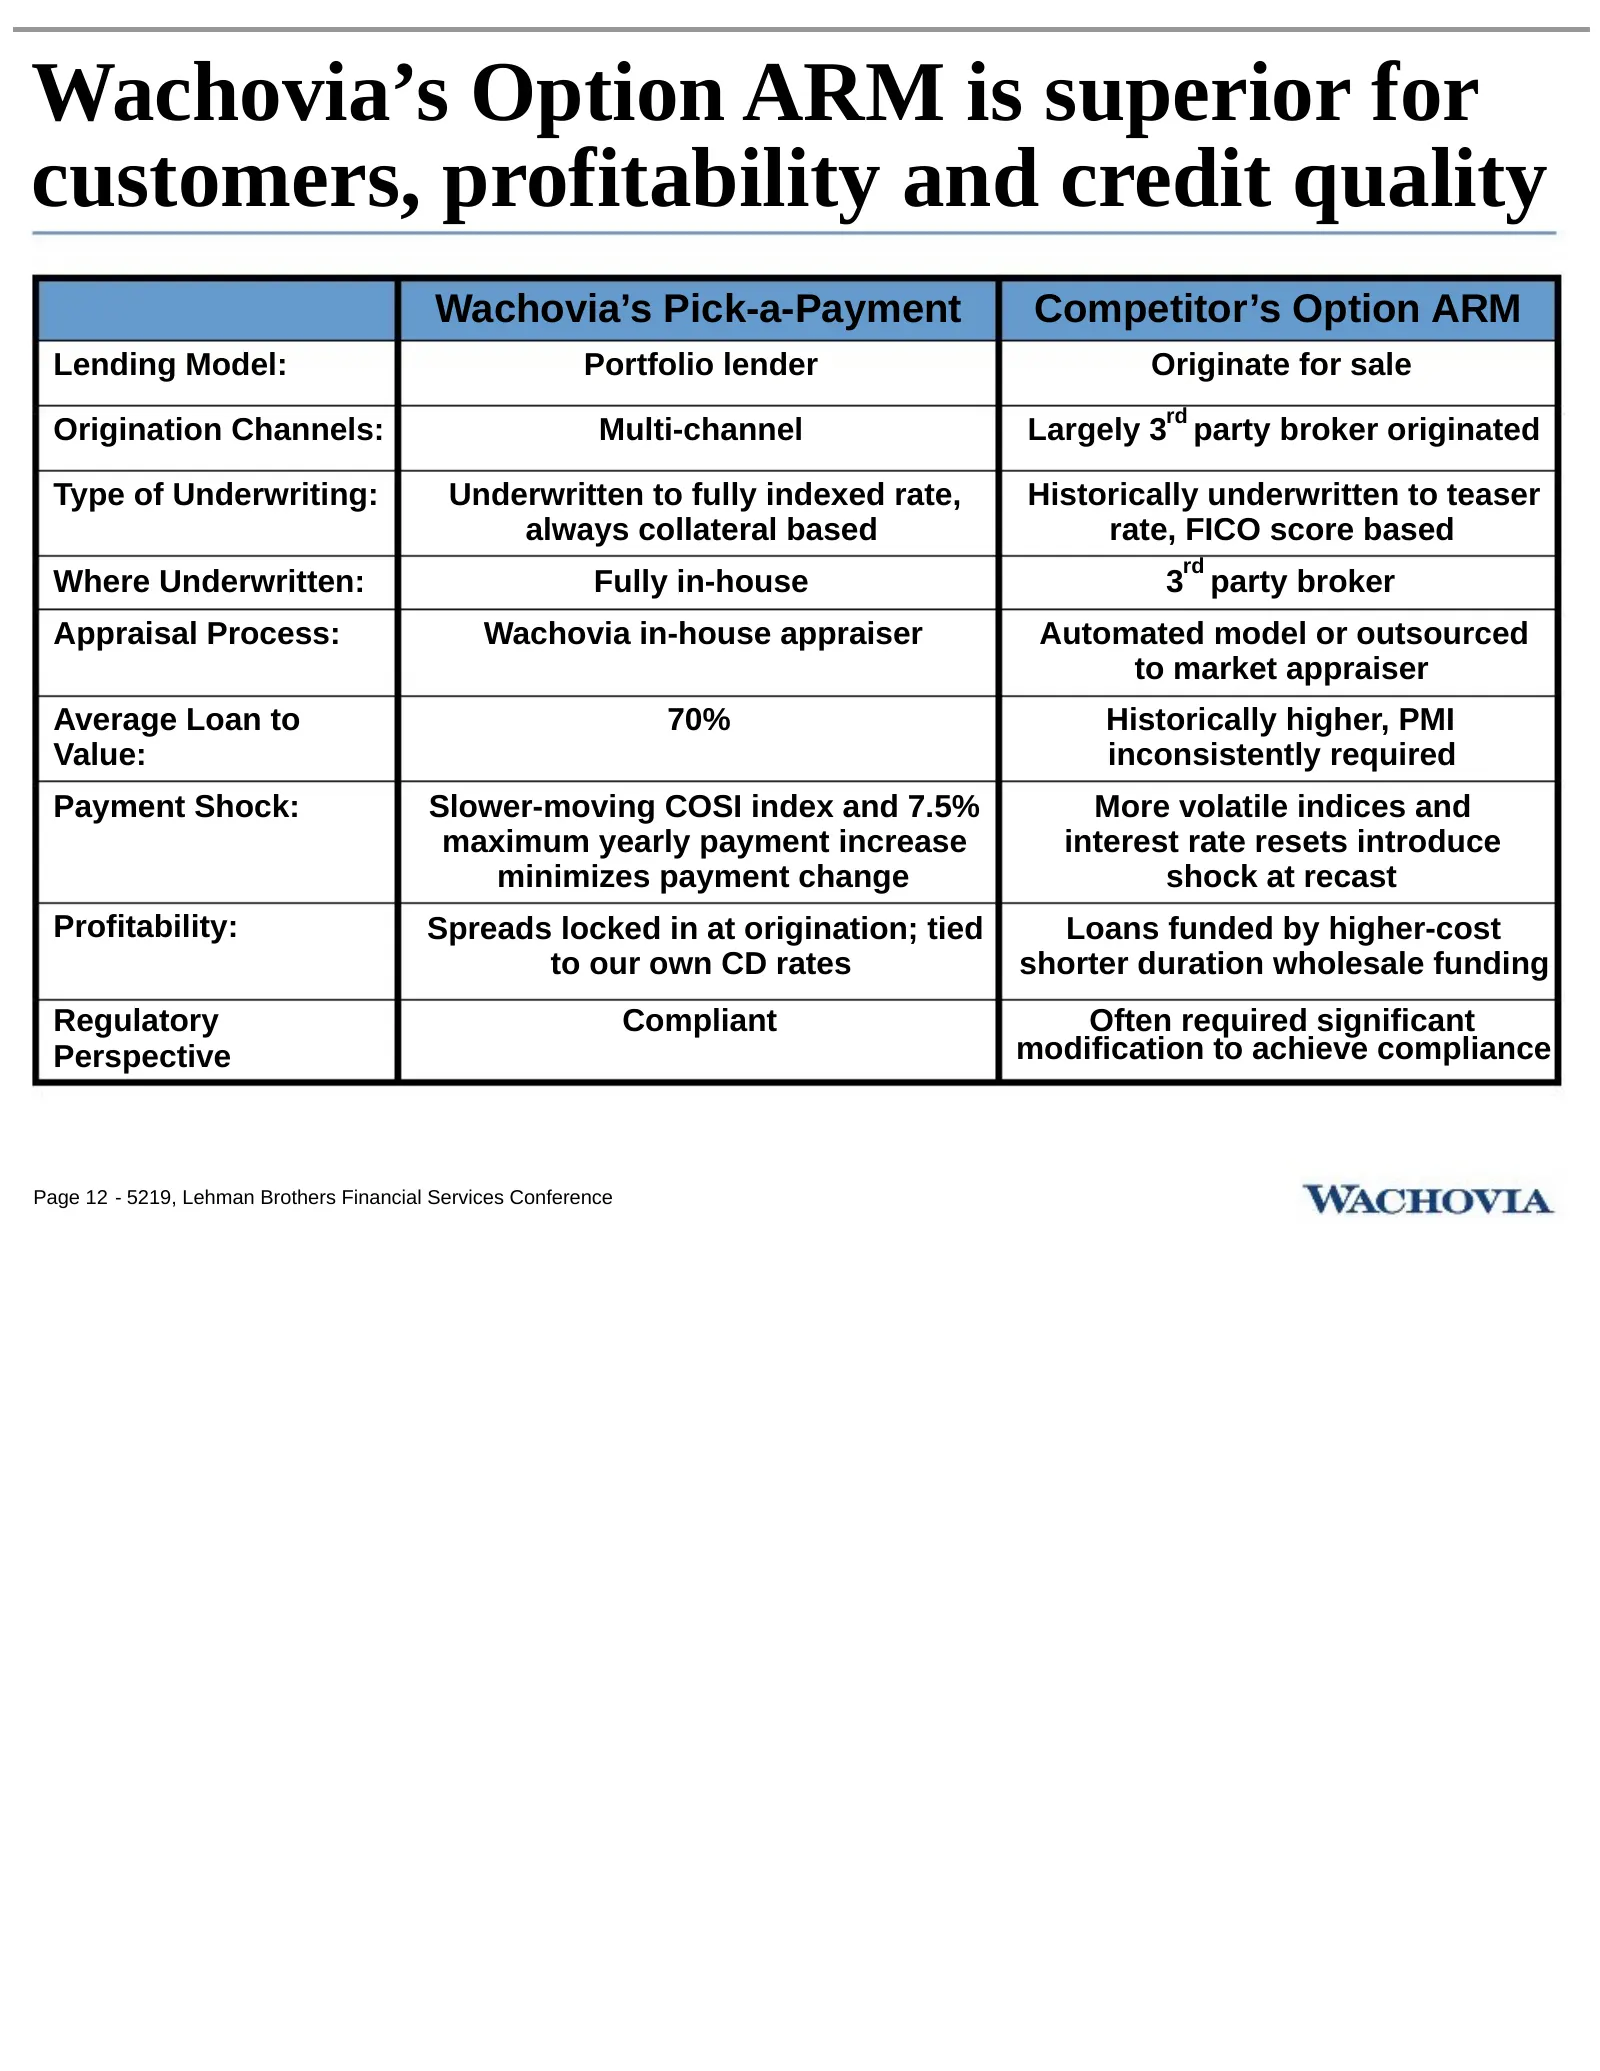
Slide 15: Wachovia's Option ARM is superior for customers, profitability and credit quality
Wachovia’s Option ARM is superior for customers, profitability and credit quality Wachovia’s Pick-a-Payment Competitor’s Option ARM Lending Model: Portfolio lender Originate for sale rd Origination Channels: Multi-channel Largely 3 party broker originated Type of Underwriting: Underwritten to fully
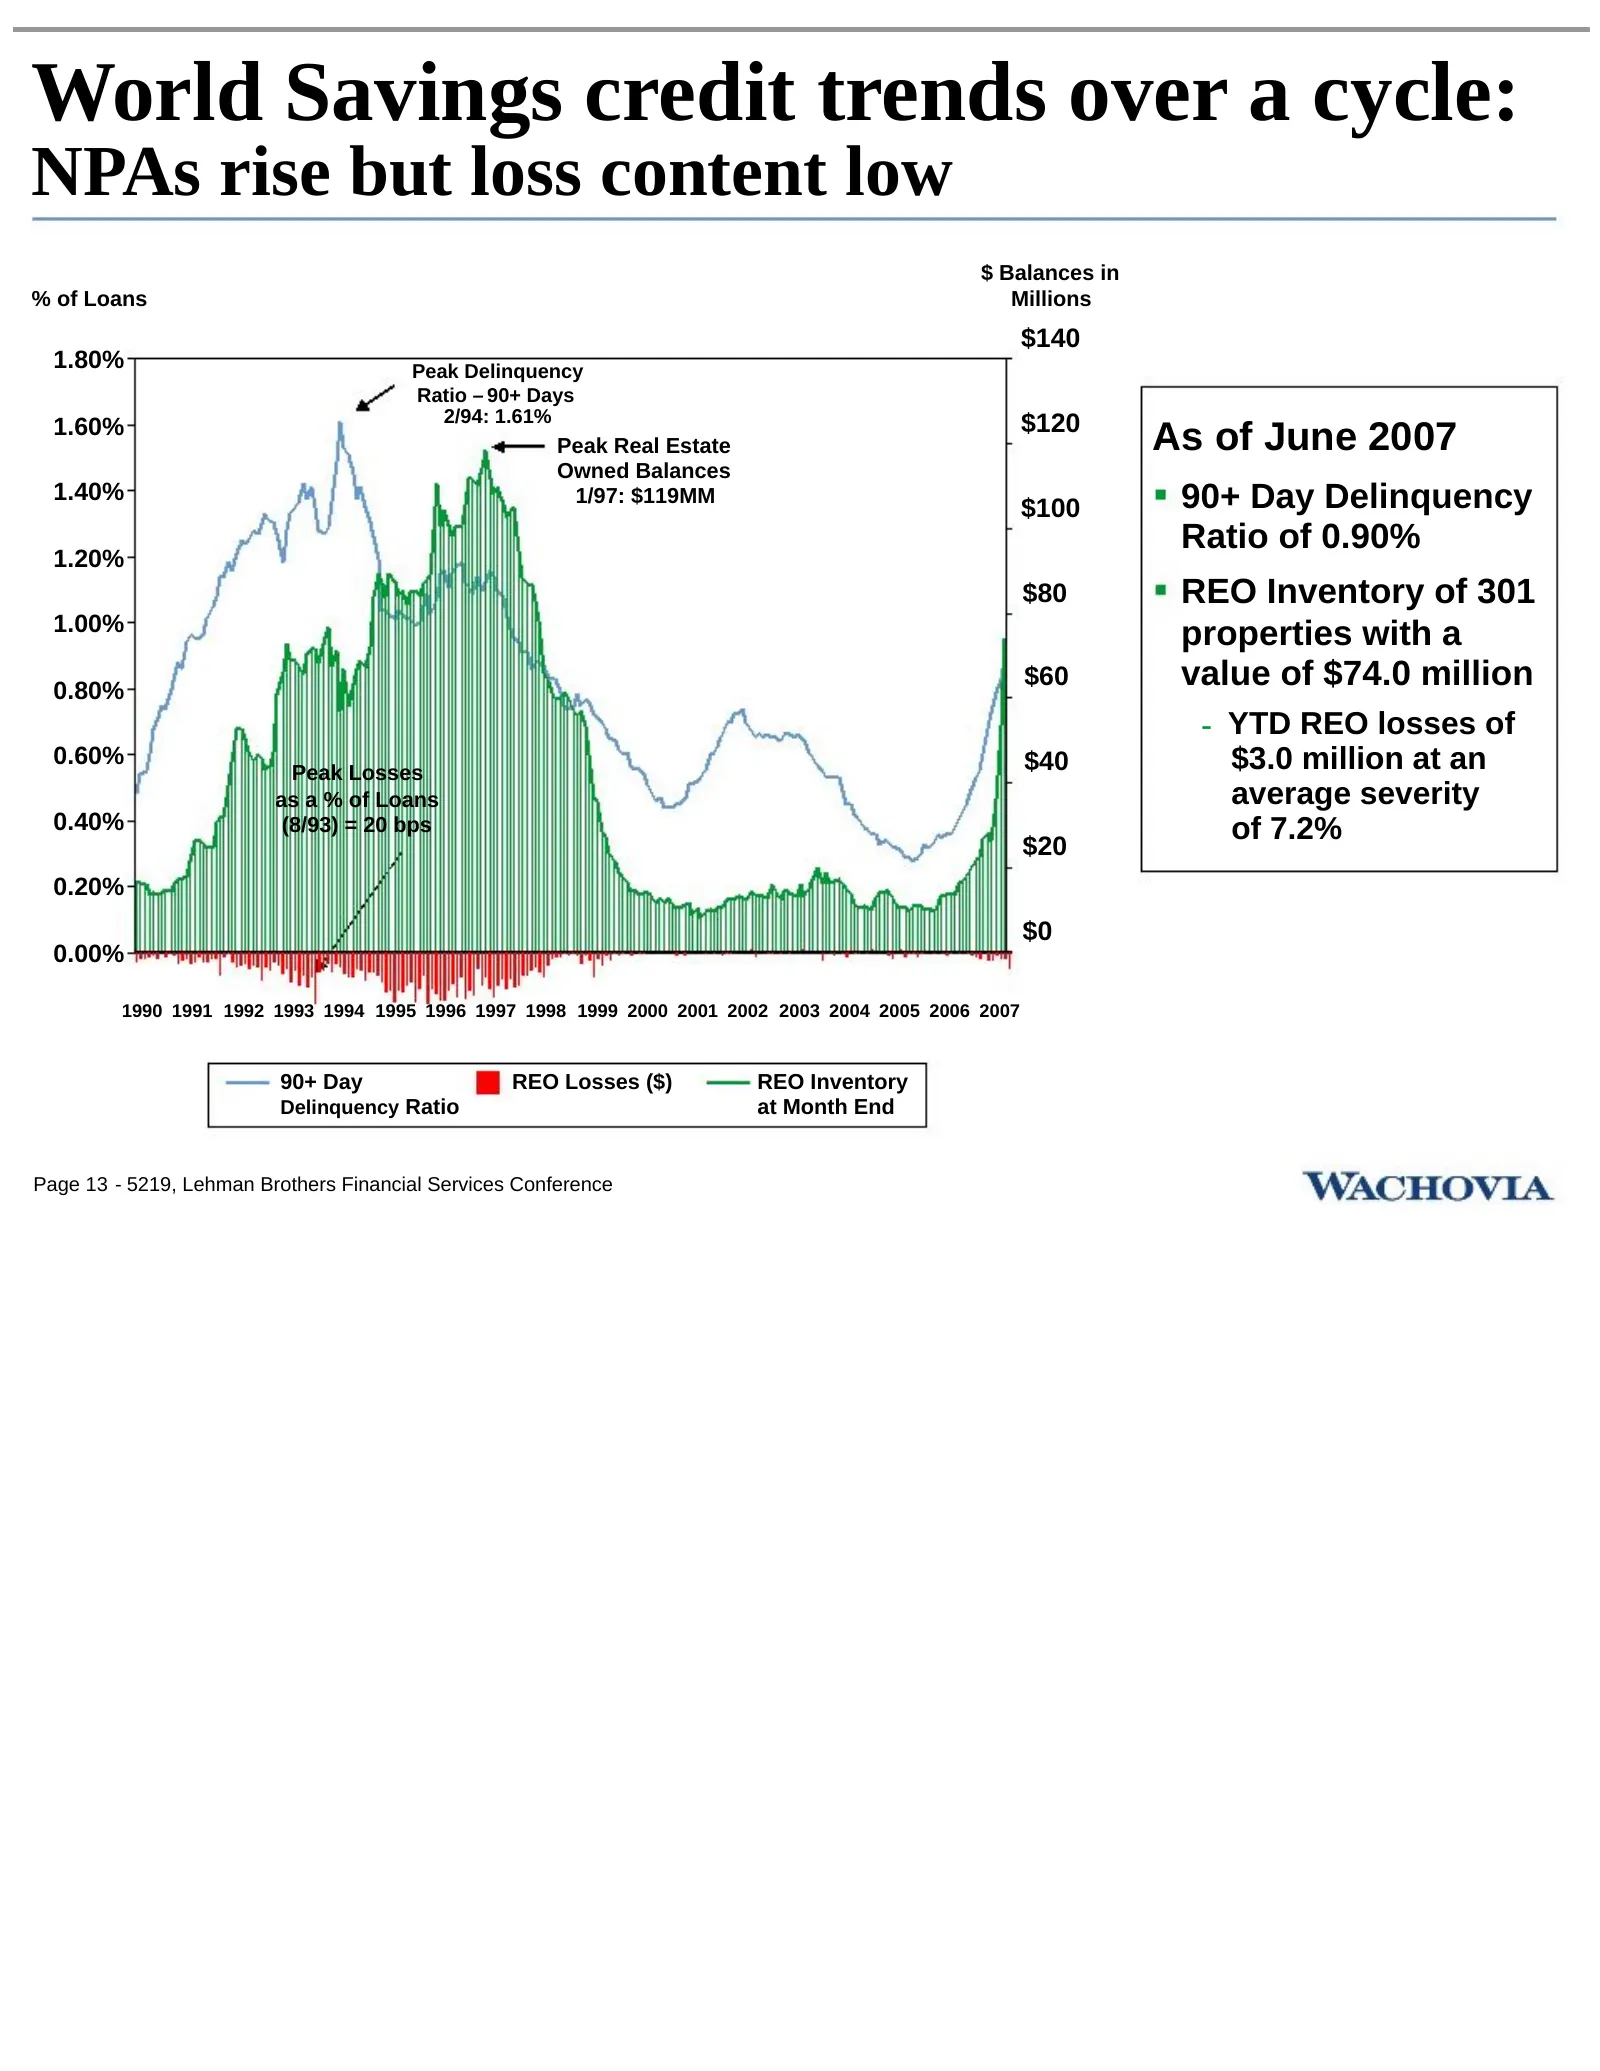
Slide 16: World Savings credit trends over a cycle
World Savings credit trends over a cycle: NPAs rise but loss content low $ Balances in % of Loans Millions $140 1.80% Peak Delinquency Ratio – 90+ Days 2/94: 1.61% $120 1.60% Peak Real Estate As of June 2007 Owned Balances 1.40% 1/97: $119MM $100 90+ Day Delinquency Ratio of 0.90% 1.20% $80 REO Inve
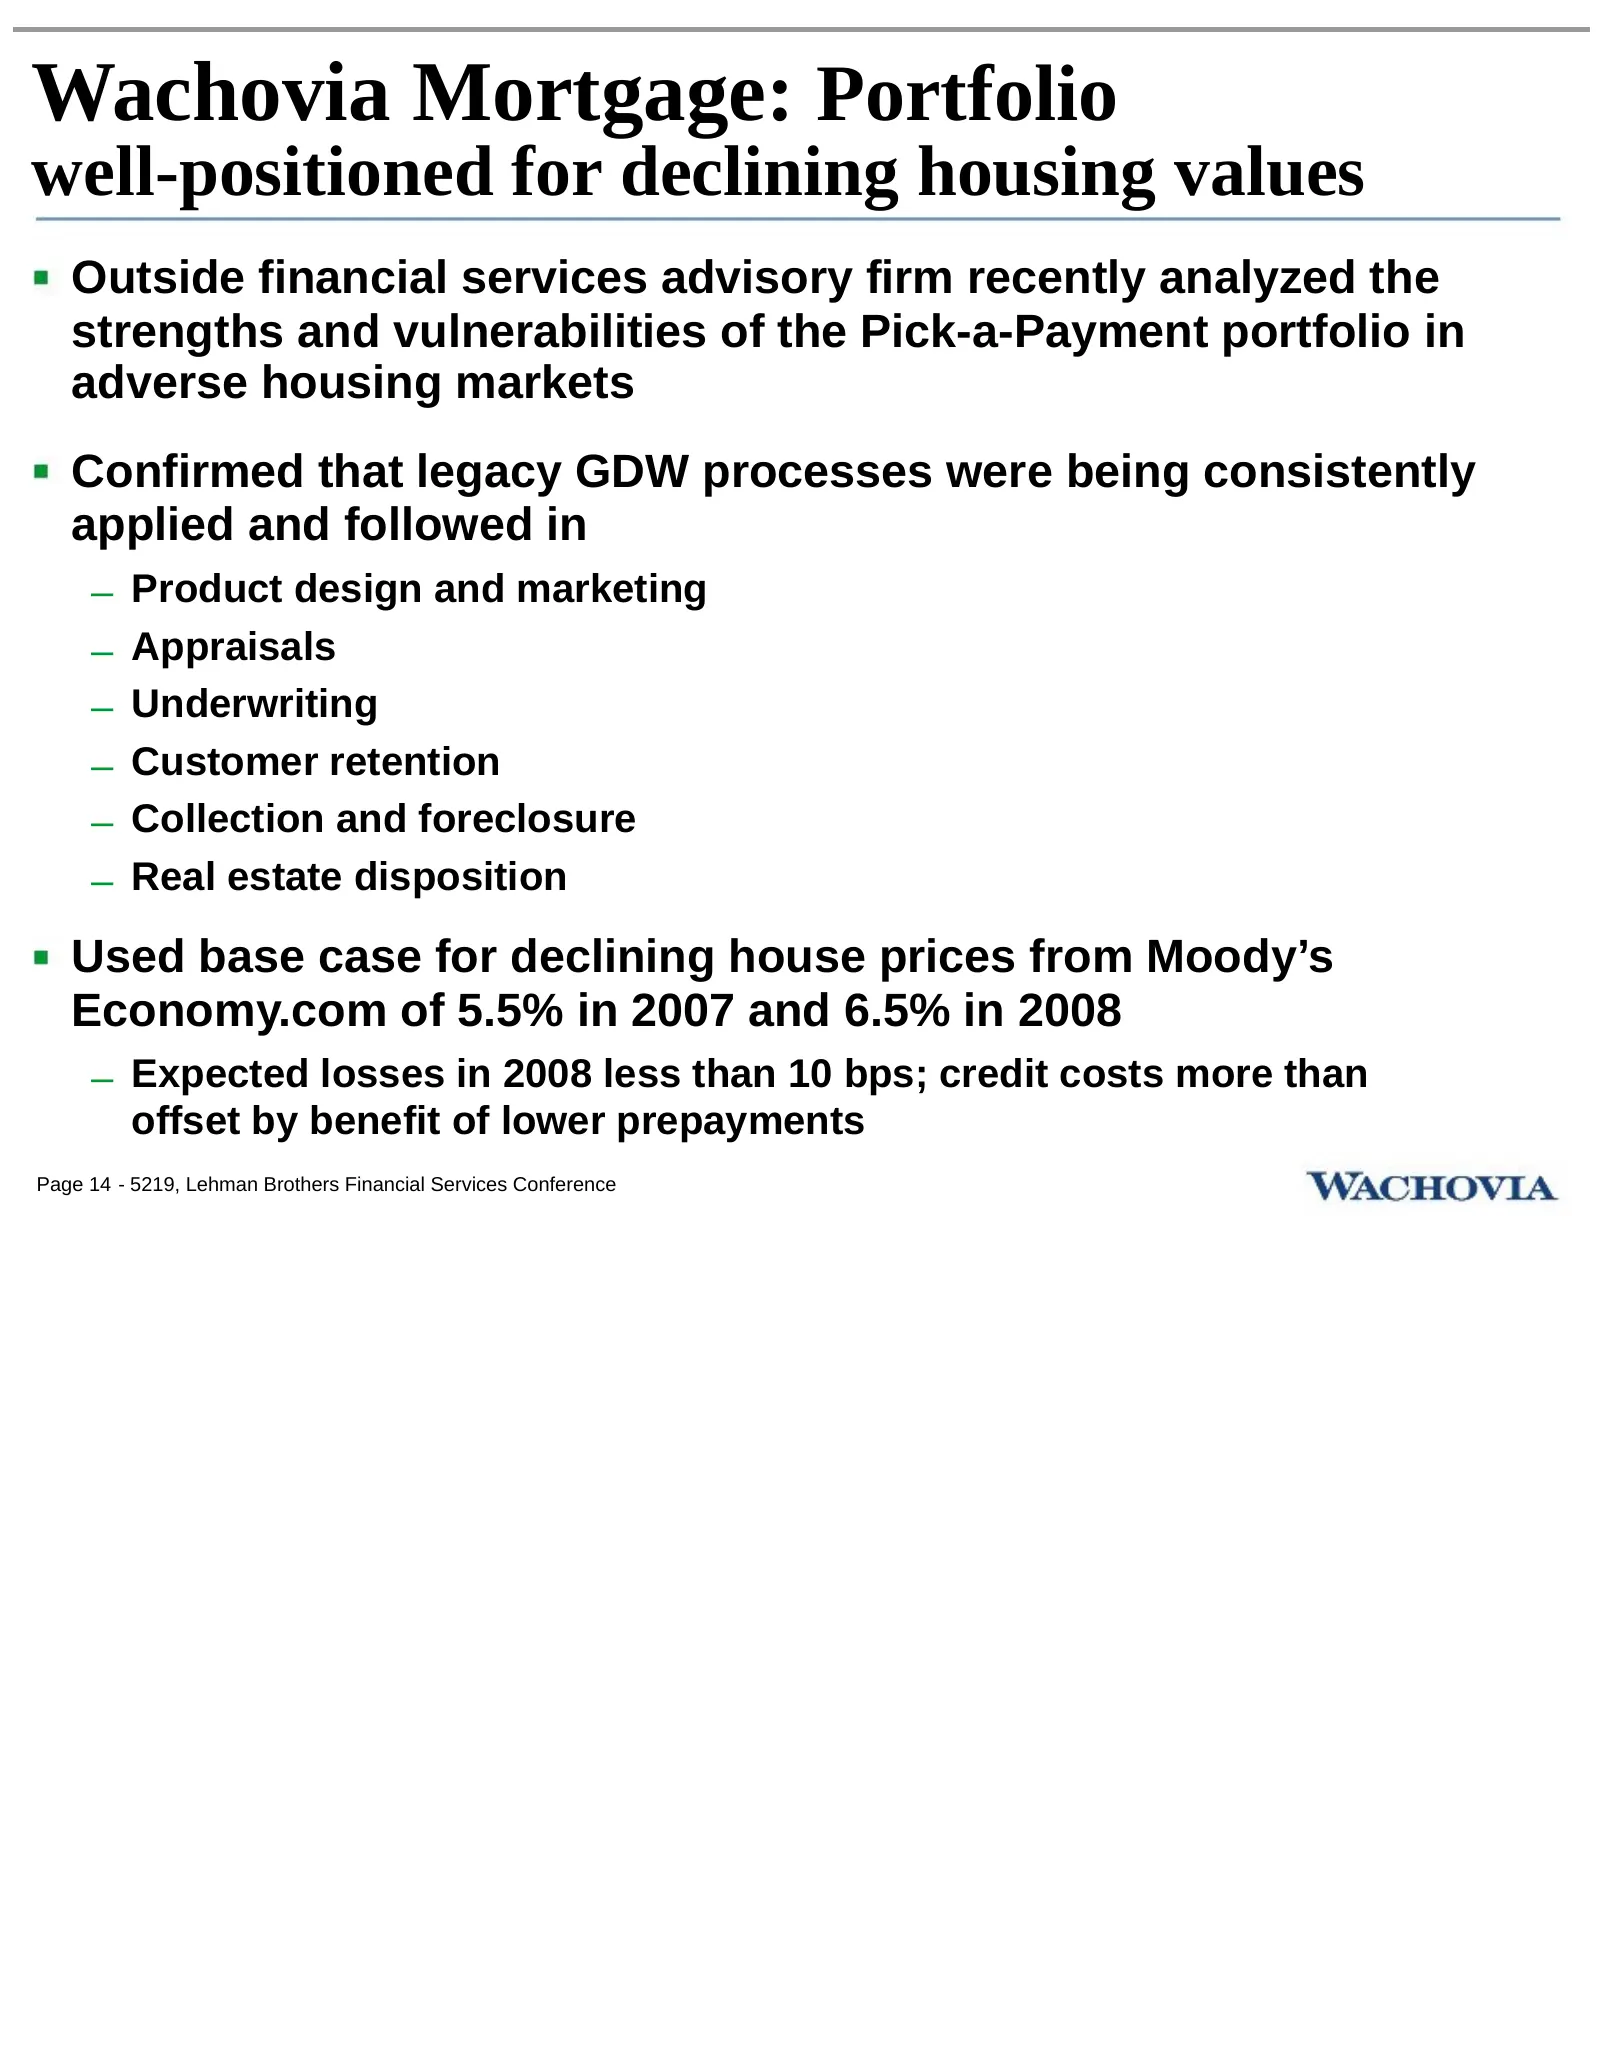
Slide 17: Wachovia Mortgage: Portfolio well-positioned for declining housing values
Wachovia Mortgage: Portfolio well-positioned for declining housing values Outside financial services advisory firm recently analyzed the strengths and vulnerabilities of the Pick-a-Payment portfolio in adverse housing markets Confirmed that legacy GDW processes were being consistently applied and fo
Slide 18: Wachovia Securities: Retail Brokerage
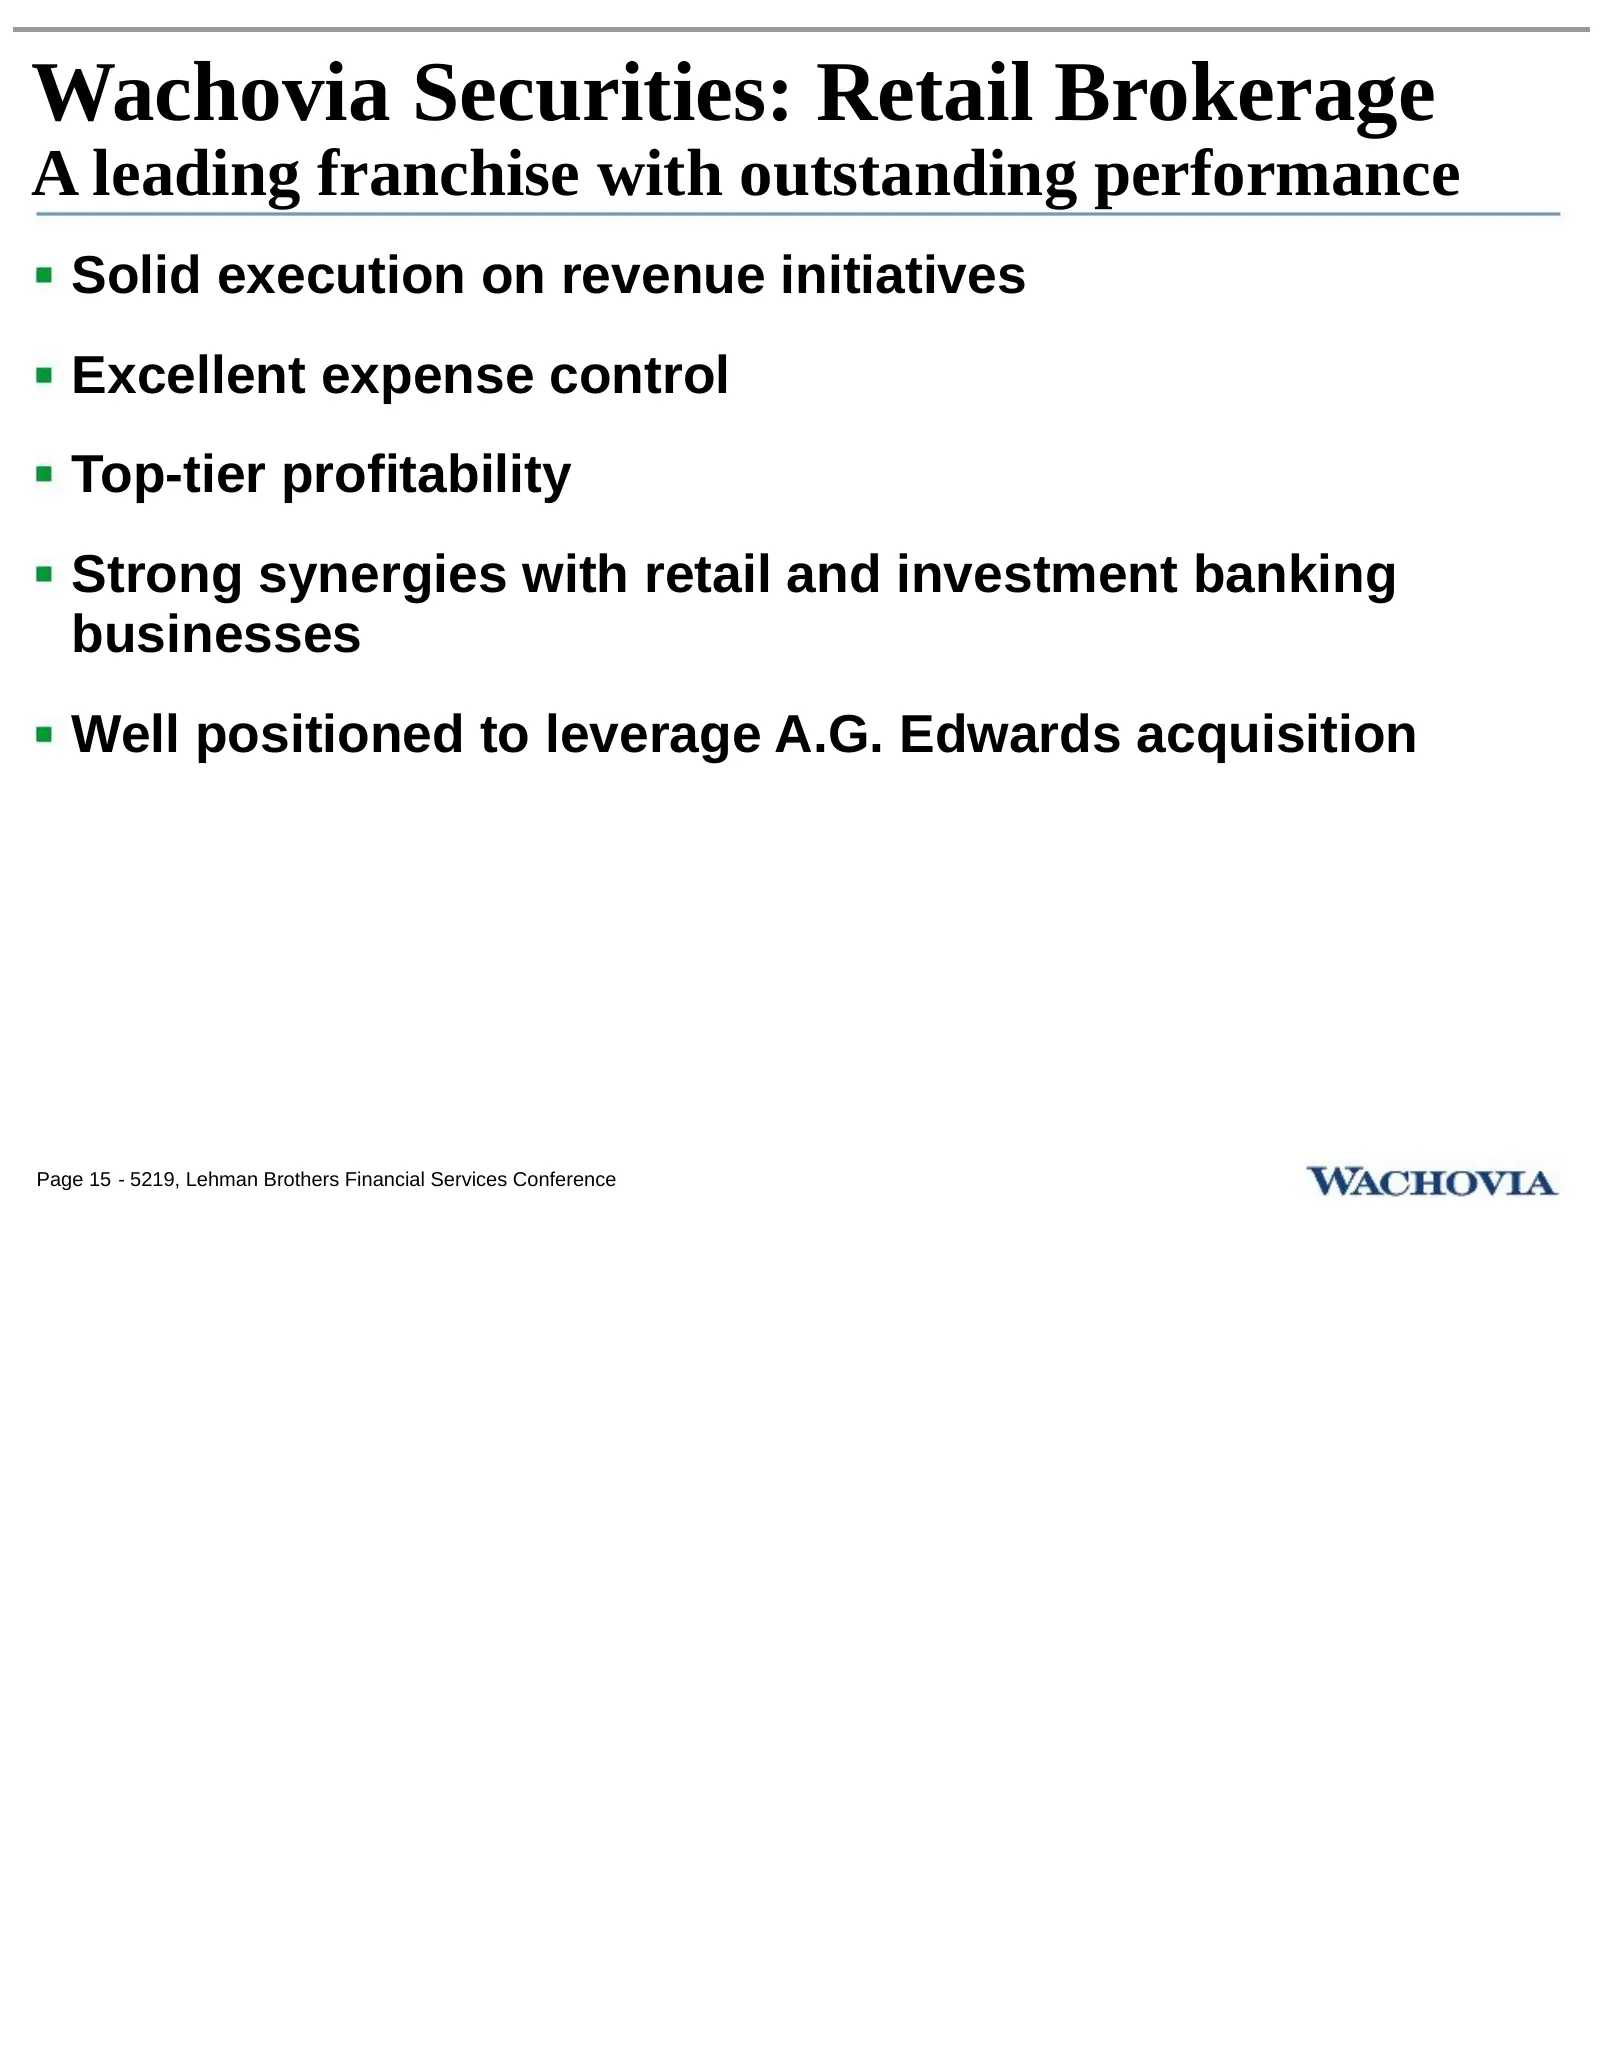
Wachovia Securities: Retail Brokerage A leading franchise with outstanding performance Solid execution on revenue initiatives Excellent expense control Top-tier profitability Strong synergies with retail and investment banking businesses Well positioned to leverage A.G. Edwards acquisition Page 15 -
Slide 19: Wachovia Securities: Consistent focus on key strategies
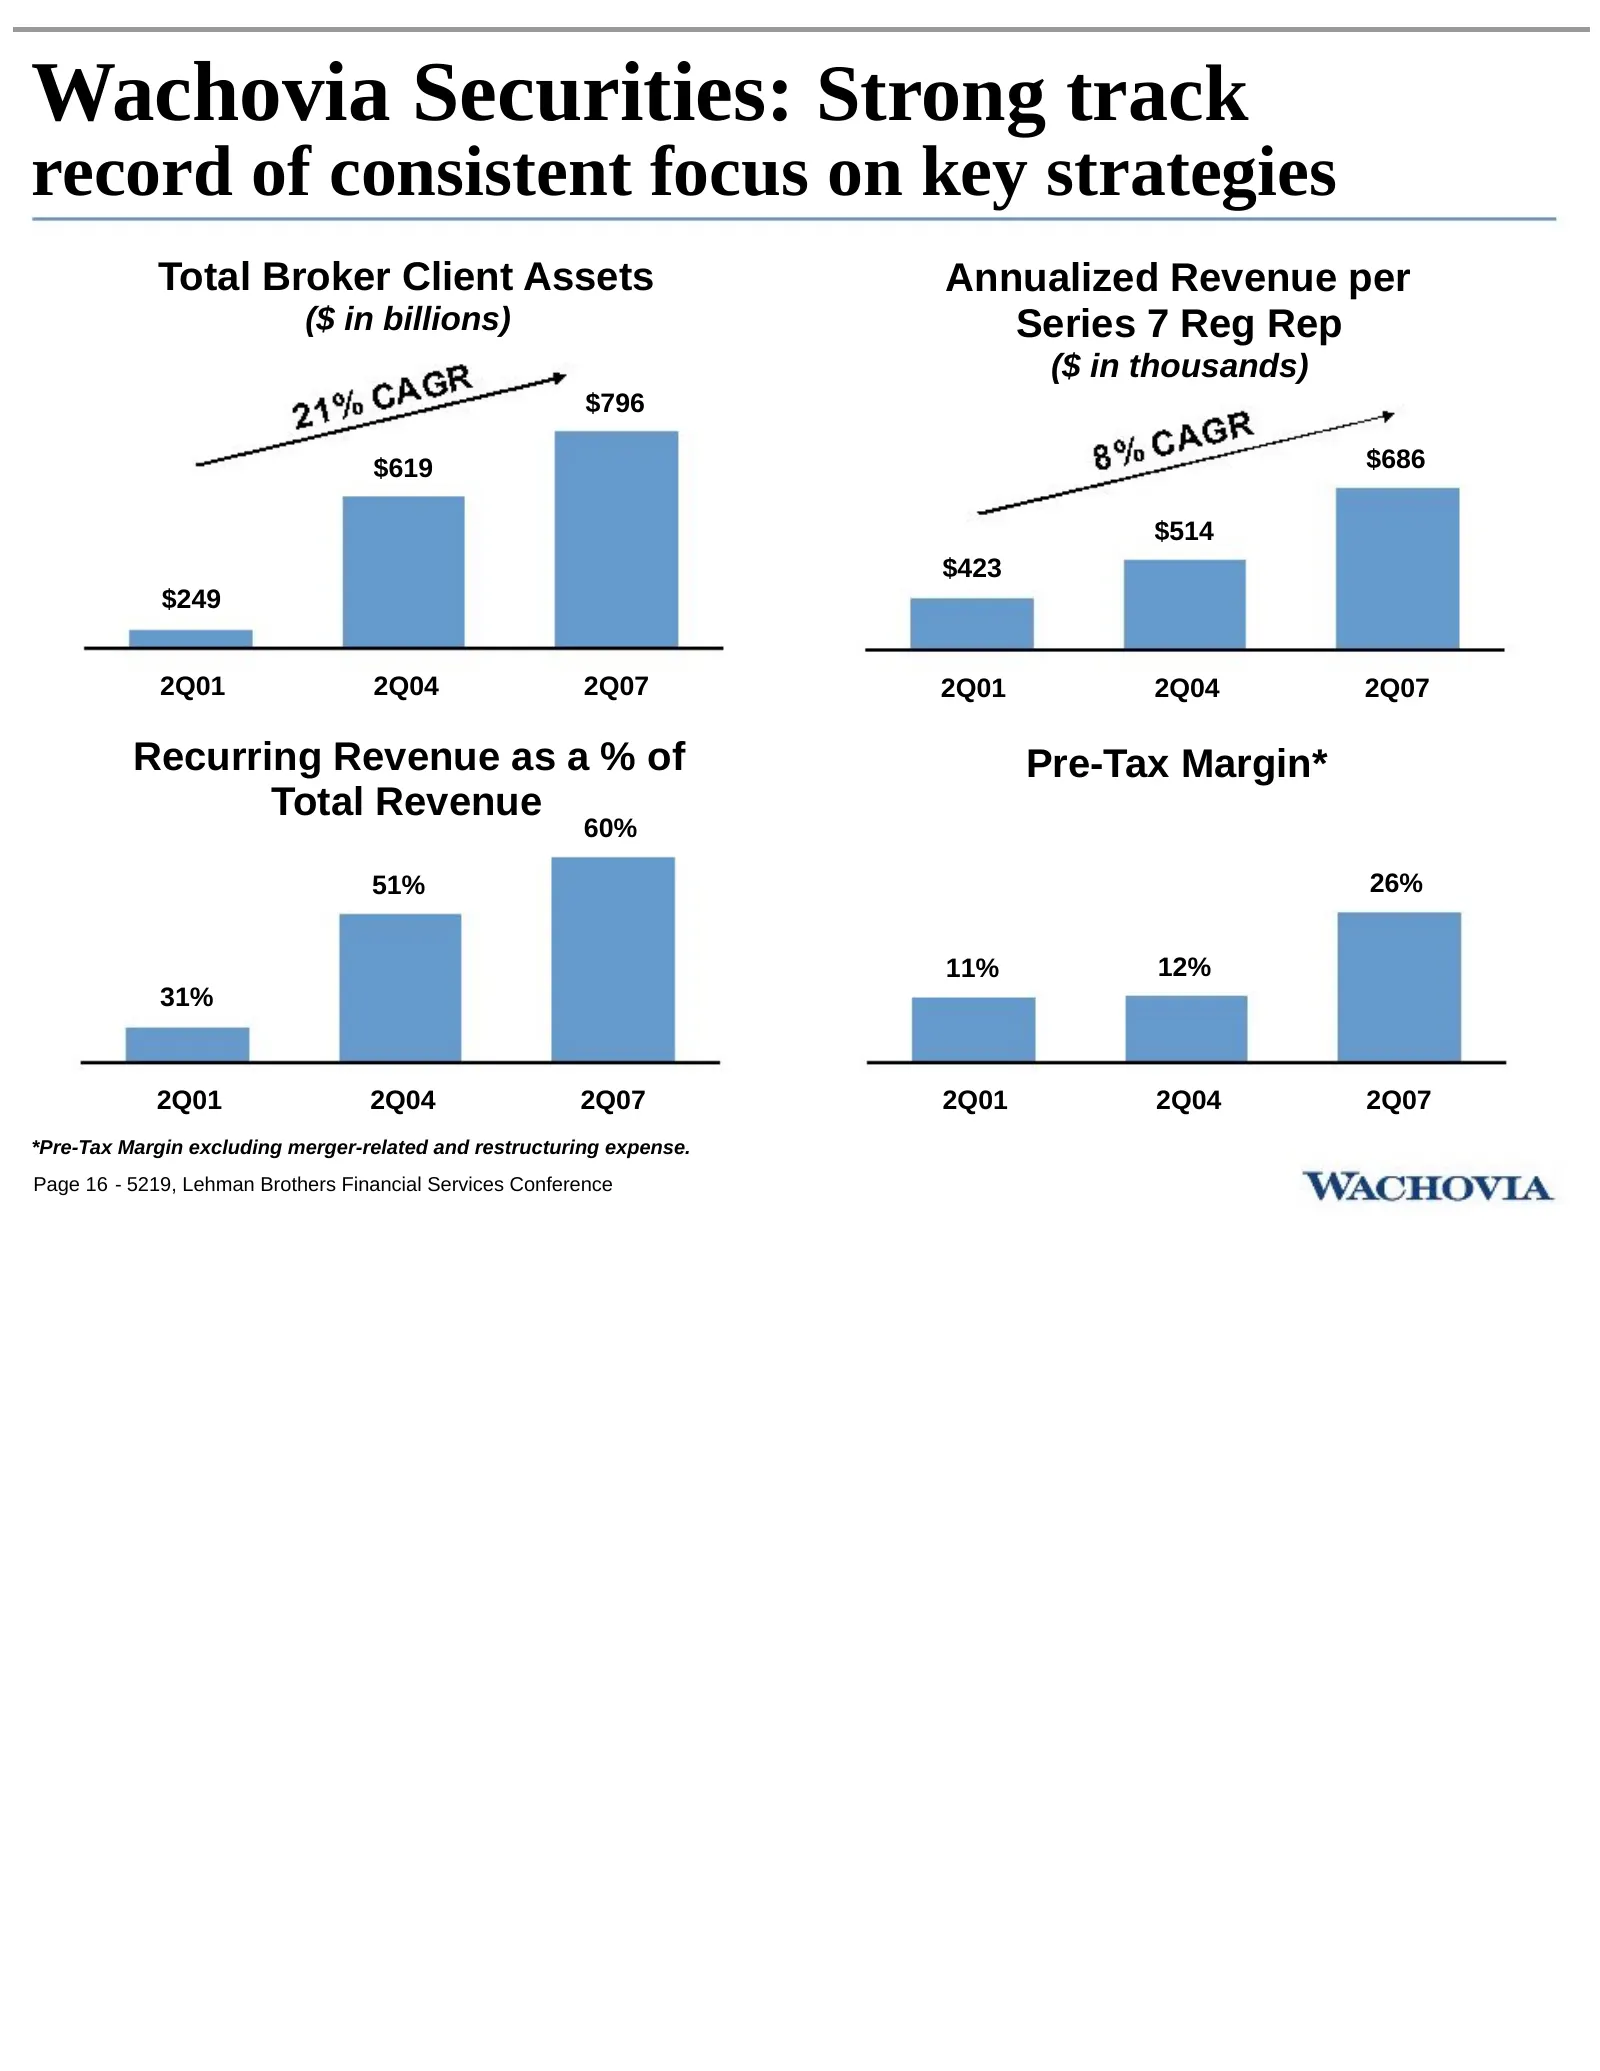
Wachovia Securities: Strong track record of consistent focus on key strategies Total Broker Client Assets Annualized Revenue per ($ in billions) Series 7 Reg Rep ($ in thousands) $796 $619 $686 $514 $423 $249 2Q01 2Q04 2Q07 2Q01 2Q04 2Q07 Recurring Revenue as a % of Pre-Tax Margin* Total Revenue 60%
Slide 20: Wachovia Securities: Leveraging cross-enterprise opportunities
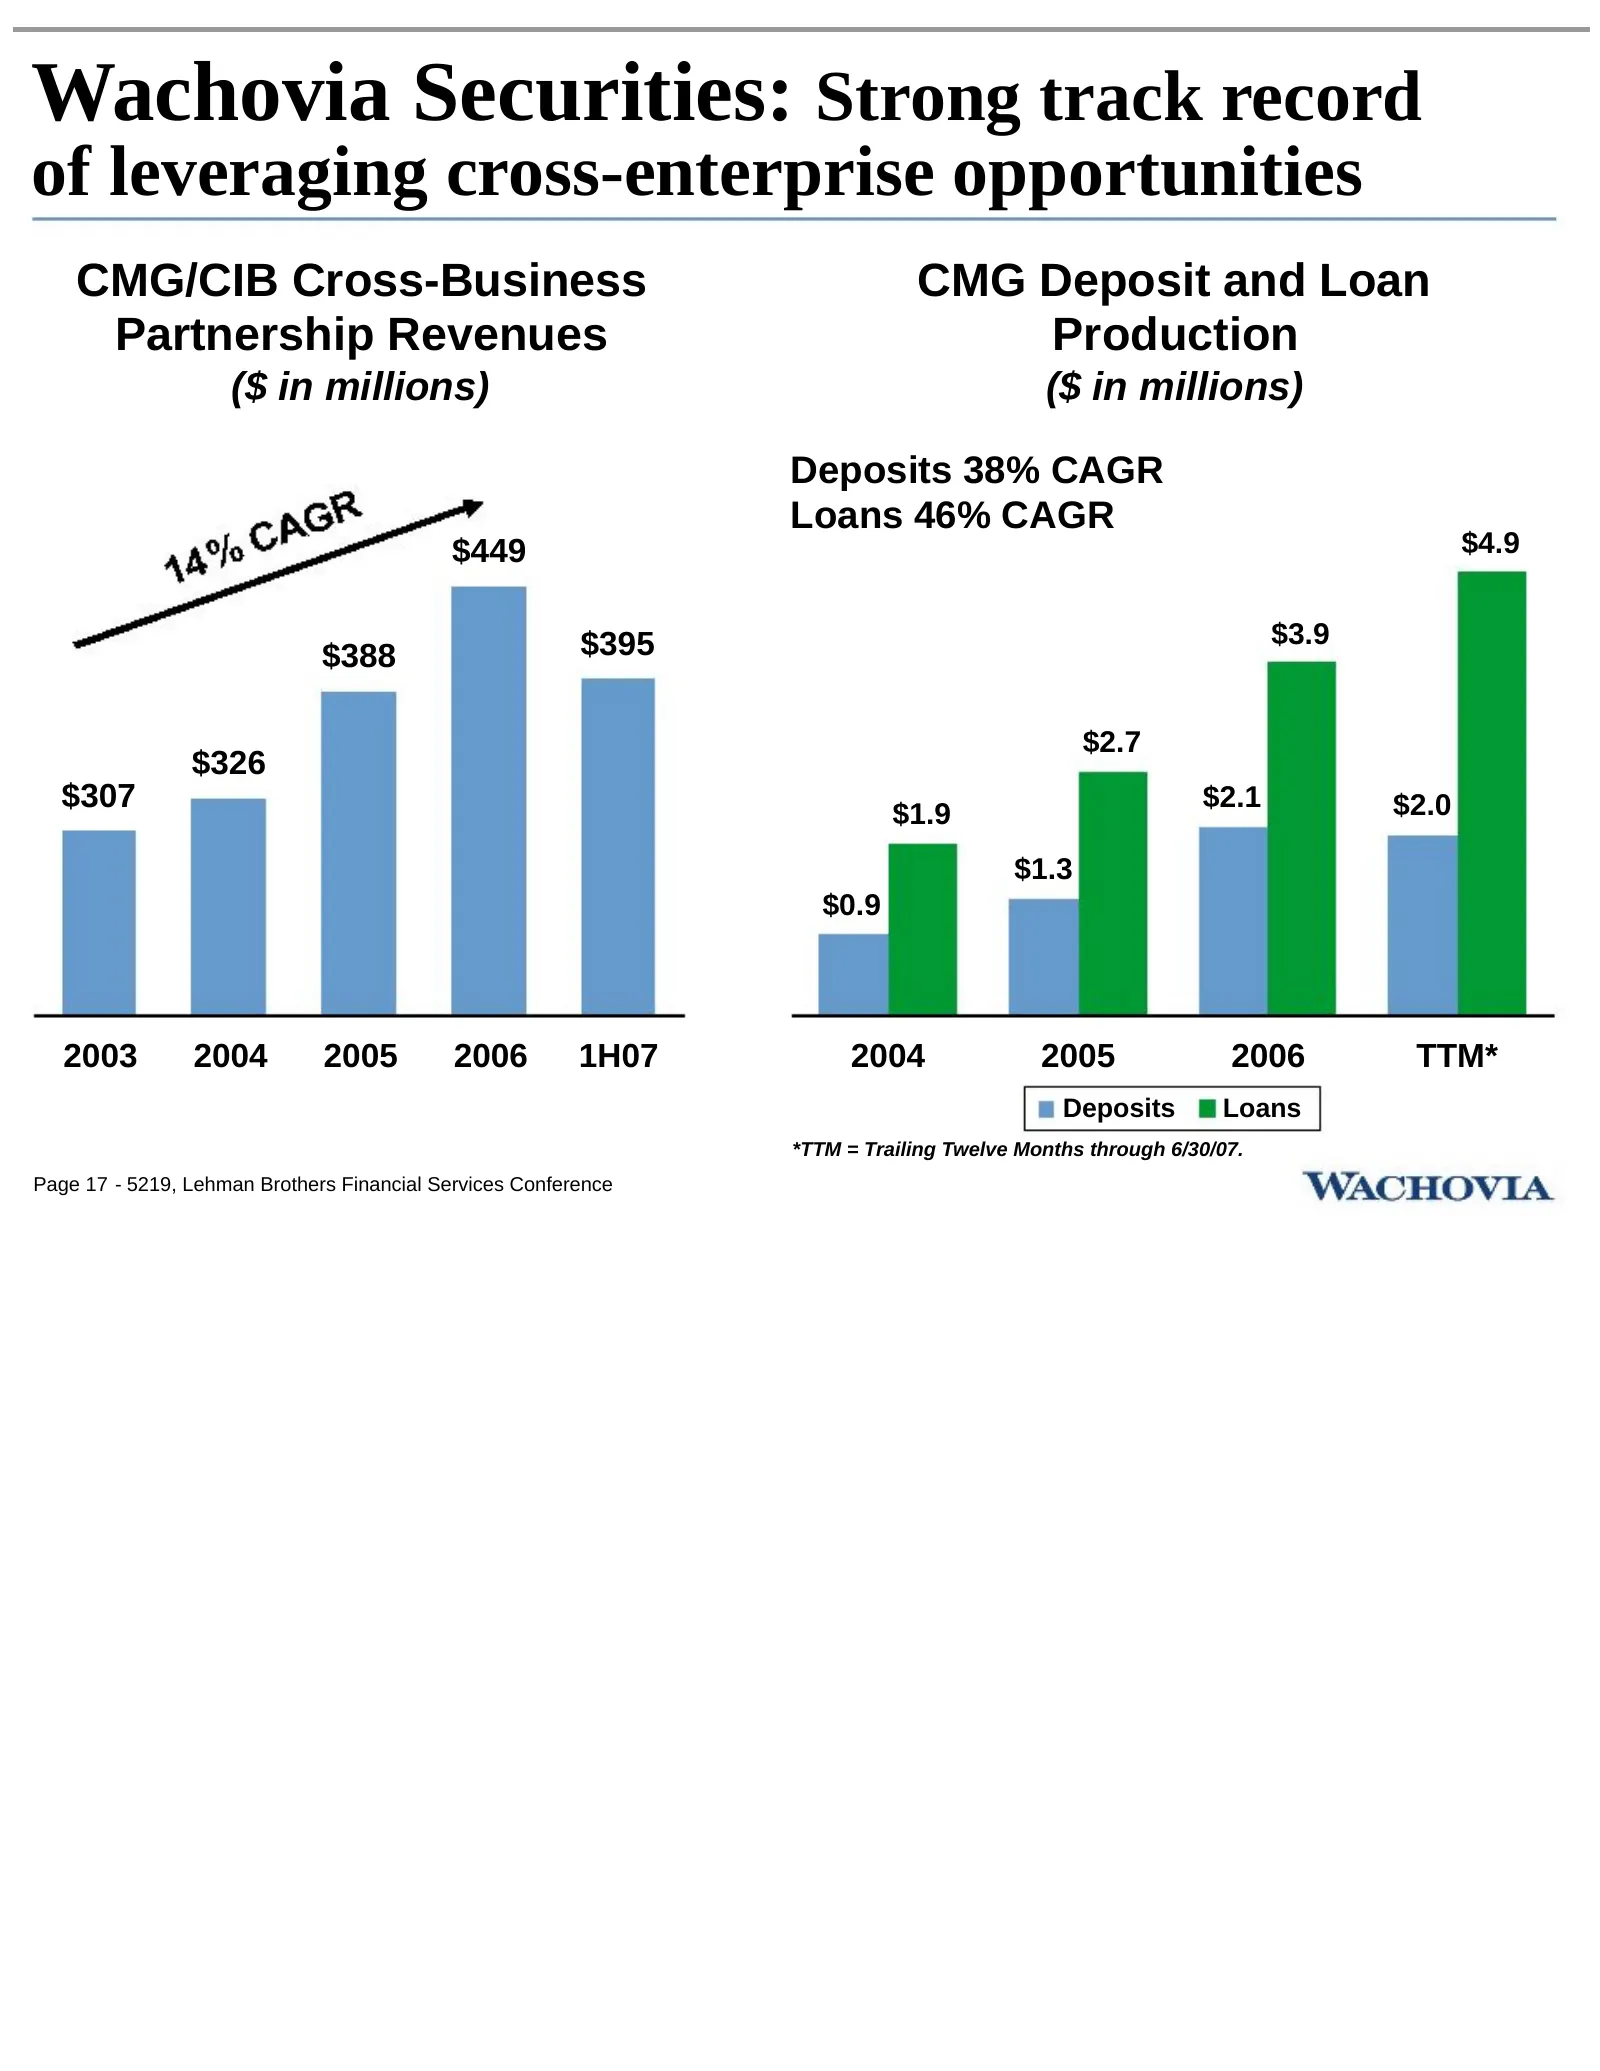
Wachovia Securities: Strong track record of leveraging cross-enterprise opportunities CMG/CIB Cross-Business CMG Deposit and Loan Partnership Revenues Production ($ in millions) ($ in millions) Deposits 38% CAGR Loans 46% CAGR $449 $4.9 $395 $3.9 $388 $2.7 $326 $307 $1.9 $2.1 $2.0 $1.3 $0.9 2003 200
Slide 21: Opportunity to leverage AGE acquisition
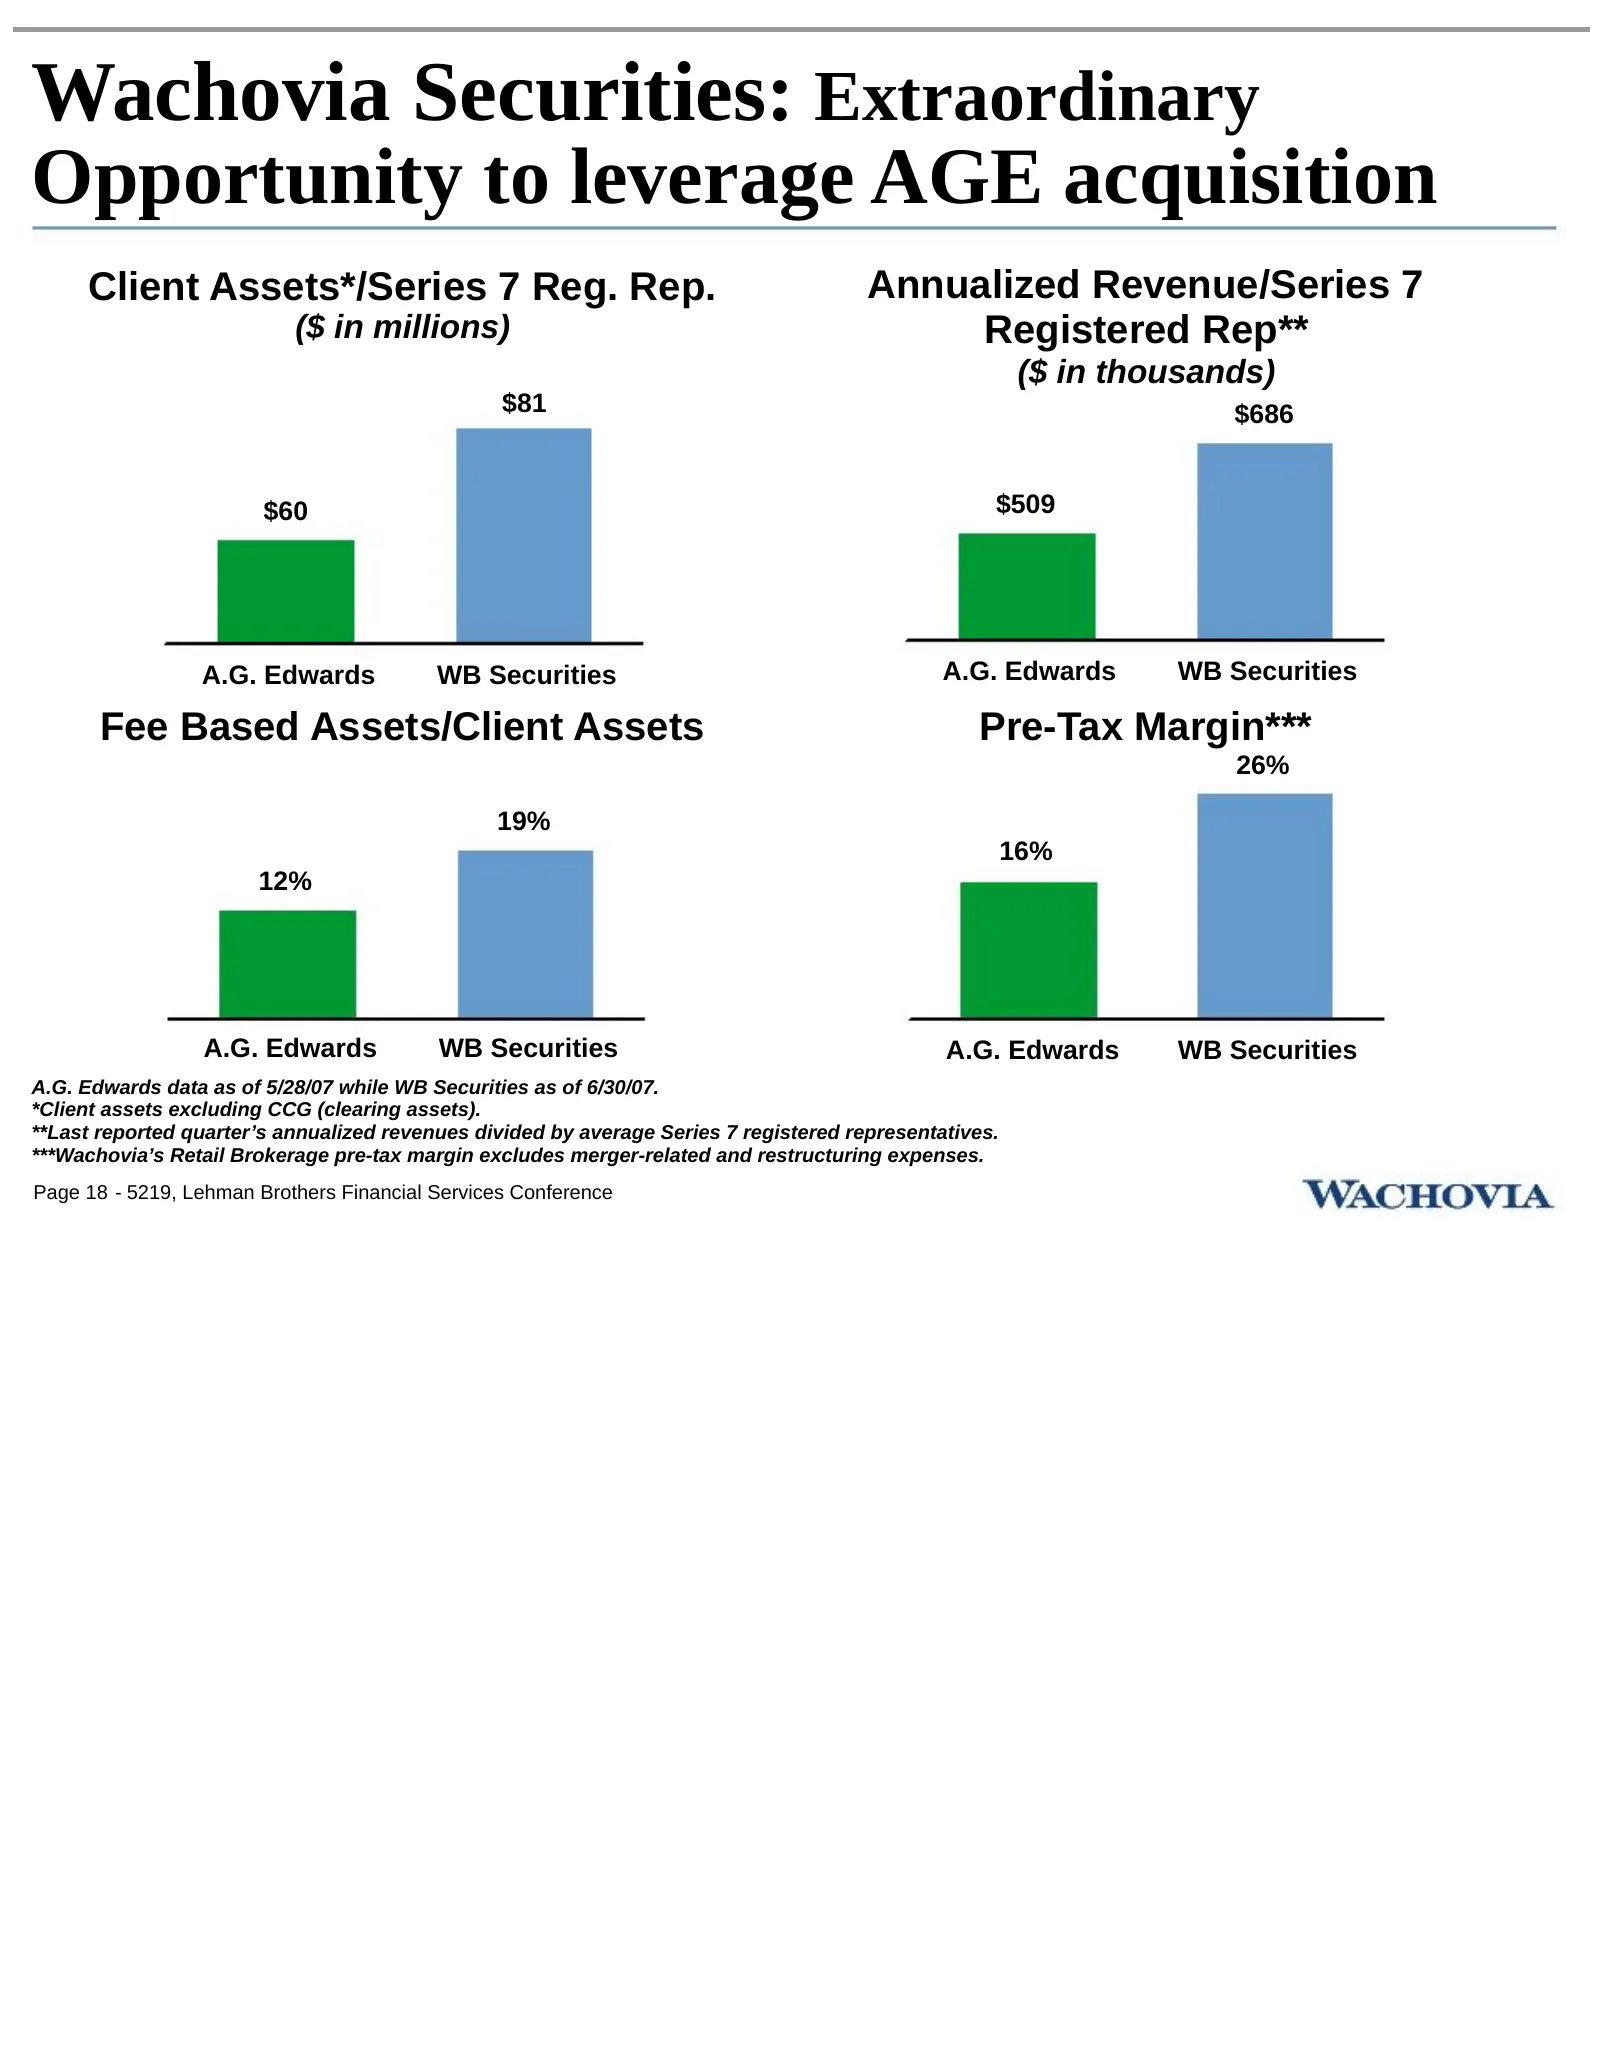
Wachovia Securities: Extraordinary Opportunity to leverage AGE acquisition Client Assets*/Series 7 Reg. Rep. Annualized Revenue/Series 7 ($ in millions) Registered Rep** ($ in thousands) $81 $686 $60 $509 A.G. Edwards WB Securities A.G. Edwards WB Securities Fee Based Assets/Client Assets Pre-Tax Ma
Slide 22: Corporate and Investment Bank
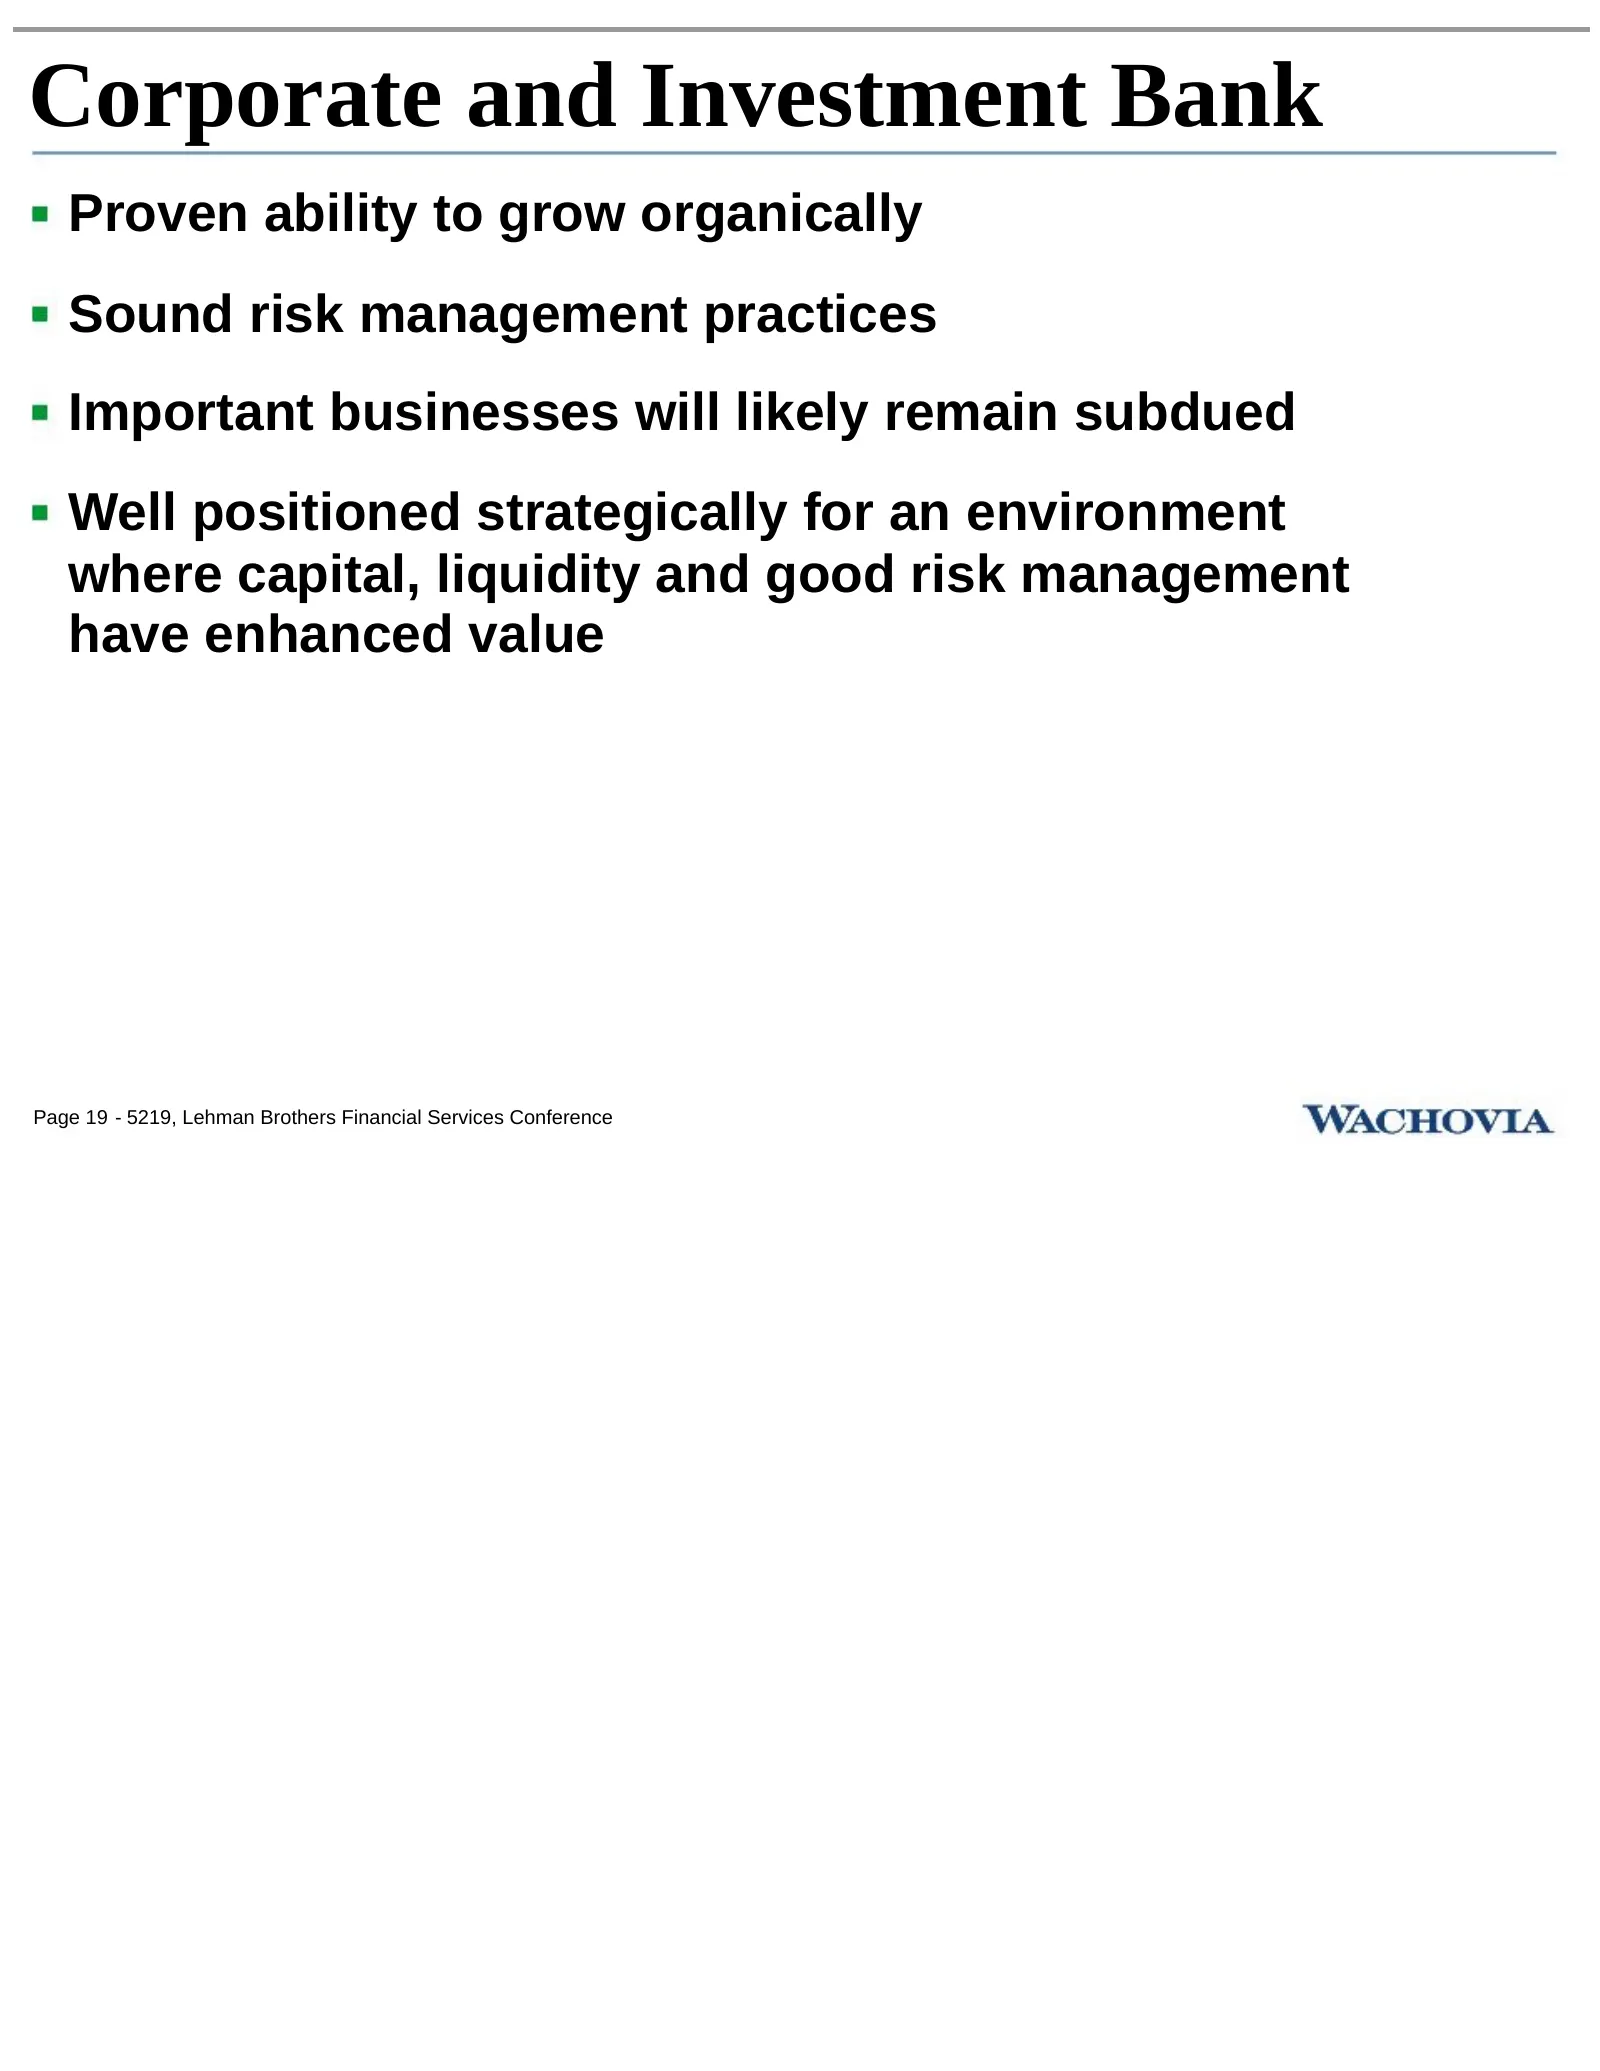
Corporate and Investment Bank Proven ability to grow organically Sound risk management practices Important businesses will likely remain subdued Well positioned strategically for an environment where capital, liquidity and good risk management have enhanced value Page 19 - 5219, Lehman Brothers Fina
Slide 23: Corporate and Investment Bank: Ongoing, disciplined growth
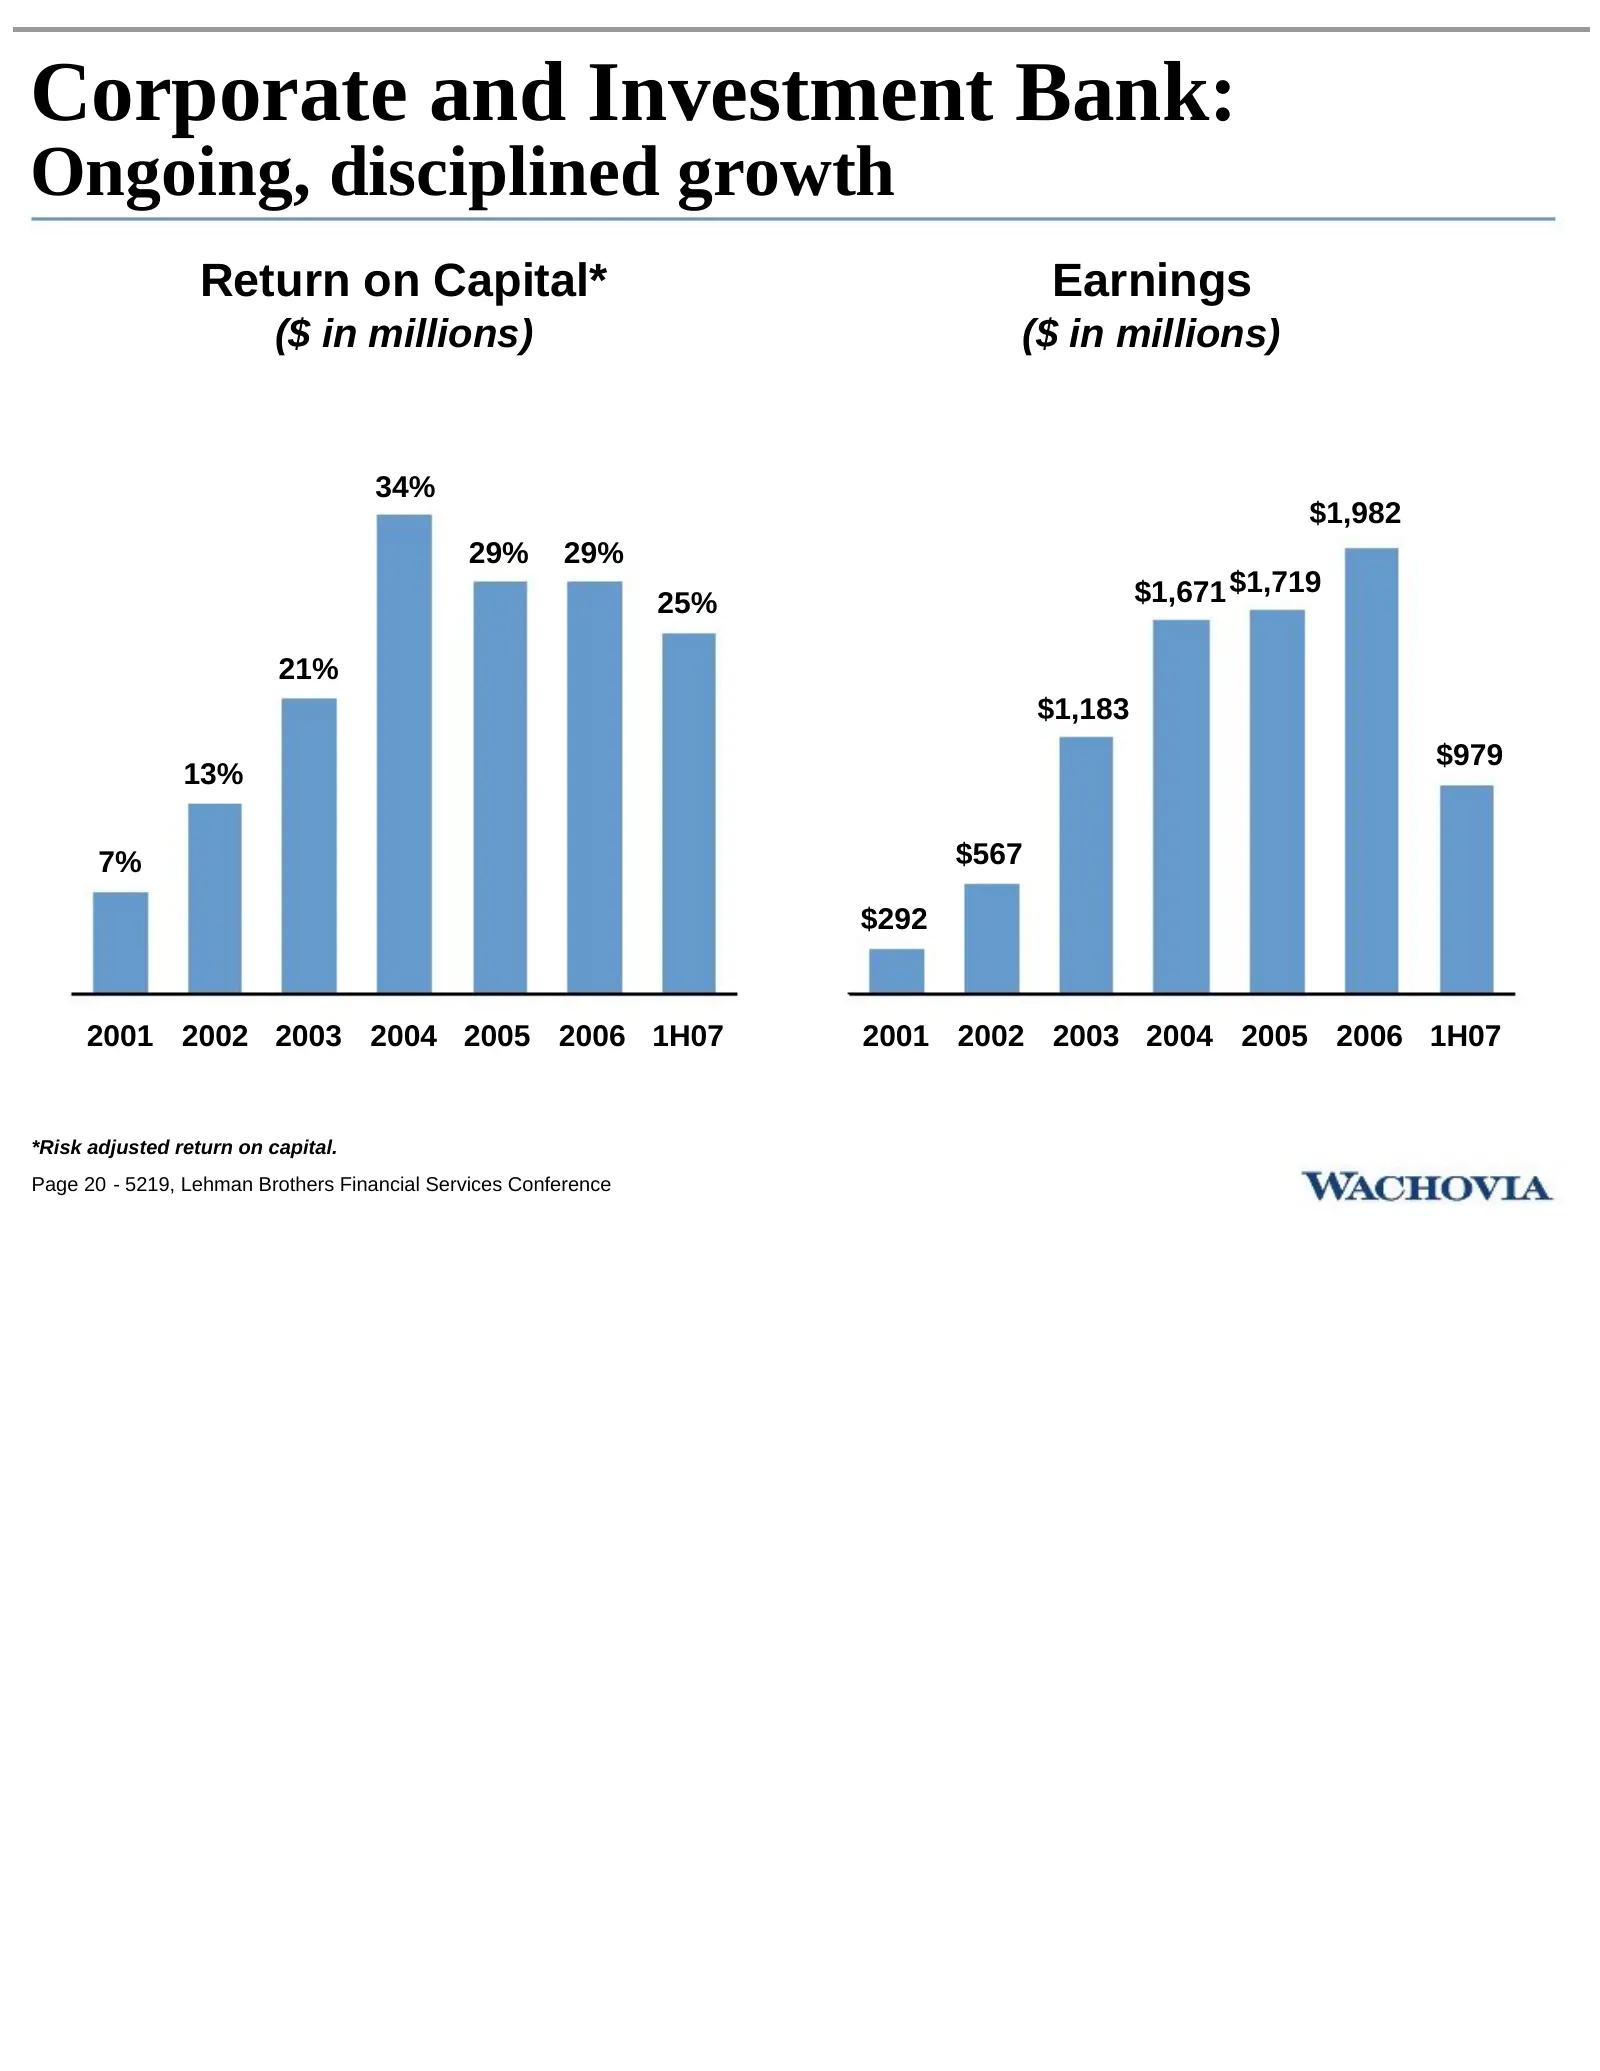
Corporate and Investment Bank: Ongoing, disciplined growth Return on Capital* Earnings ($ in millions) ($ in millions) 34% $1,982 29% 29% 25% $1,671 $1,719 21% $1,183 $979 13% 7% $567 $292 2001 2002 2003 2004 2005 2006 1H07 2001 2002 2003 2004 2005 2006 1H07 *Risk adjusted return on capital. Page 20
Slide 24: Corporate and Investment Bank: Gaining market share
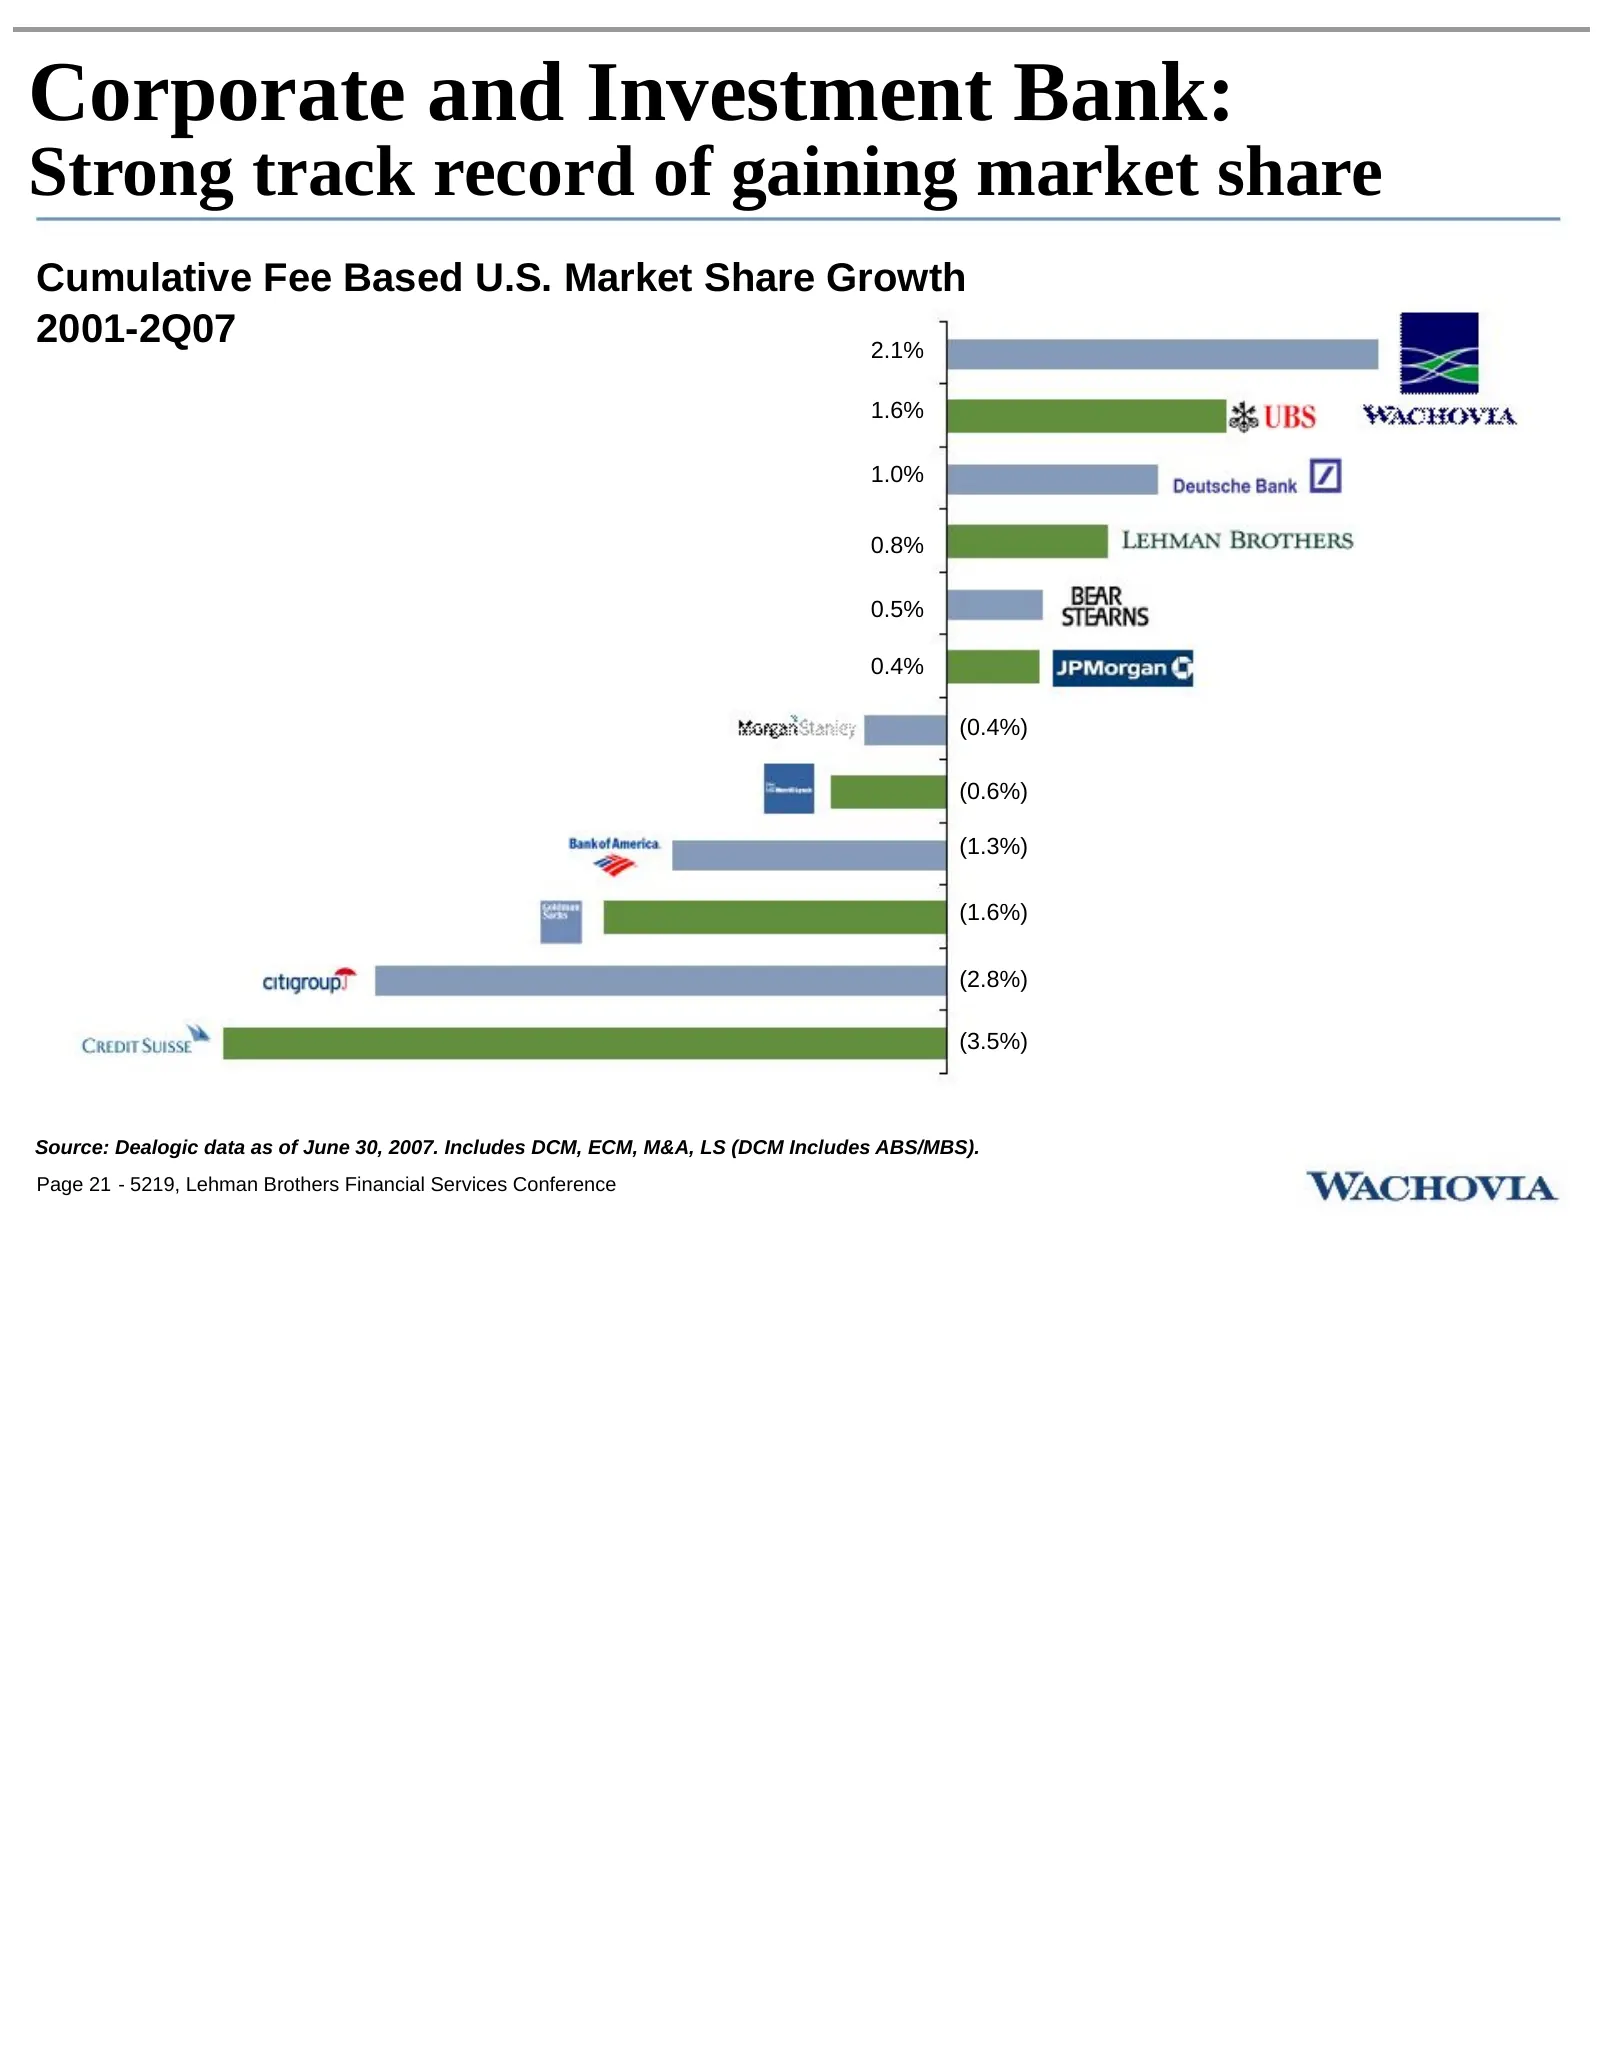
Corporate and Investment Bank: Strong track record of gaining market share Cumulative Fee Based U.S. Market Share Growth 2001-2Q07 2.1% 1.6% 1.0% 0.8% 0.5% 0.4% (0.4%) (0.6%) (1.3%) (1.6%) (2.8%) (3.5%) Source: Dealogic data as of June 30, 2007. Includes DCM, ECM, M&A, LS (DCM Includes ABS/MBS). Pag
Slide 25: Corporate and Investment Bank: Proactively managing risk
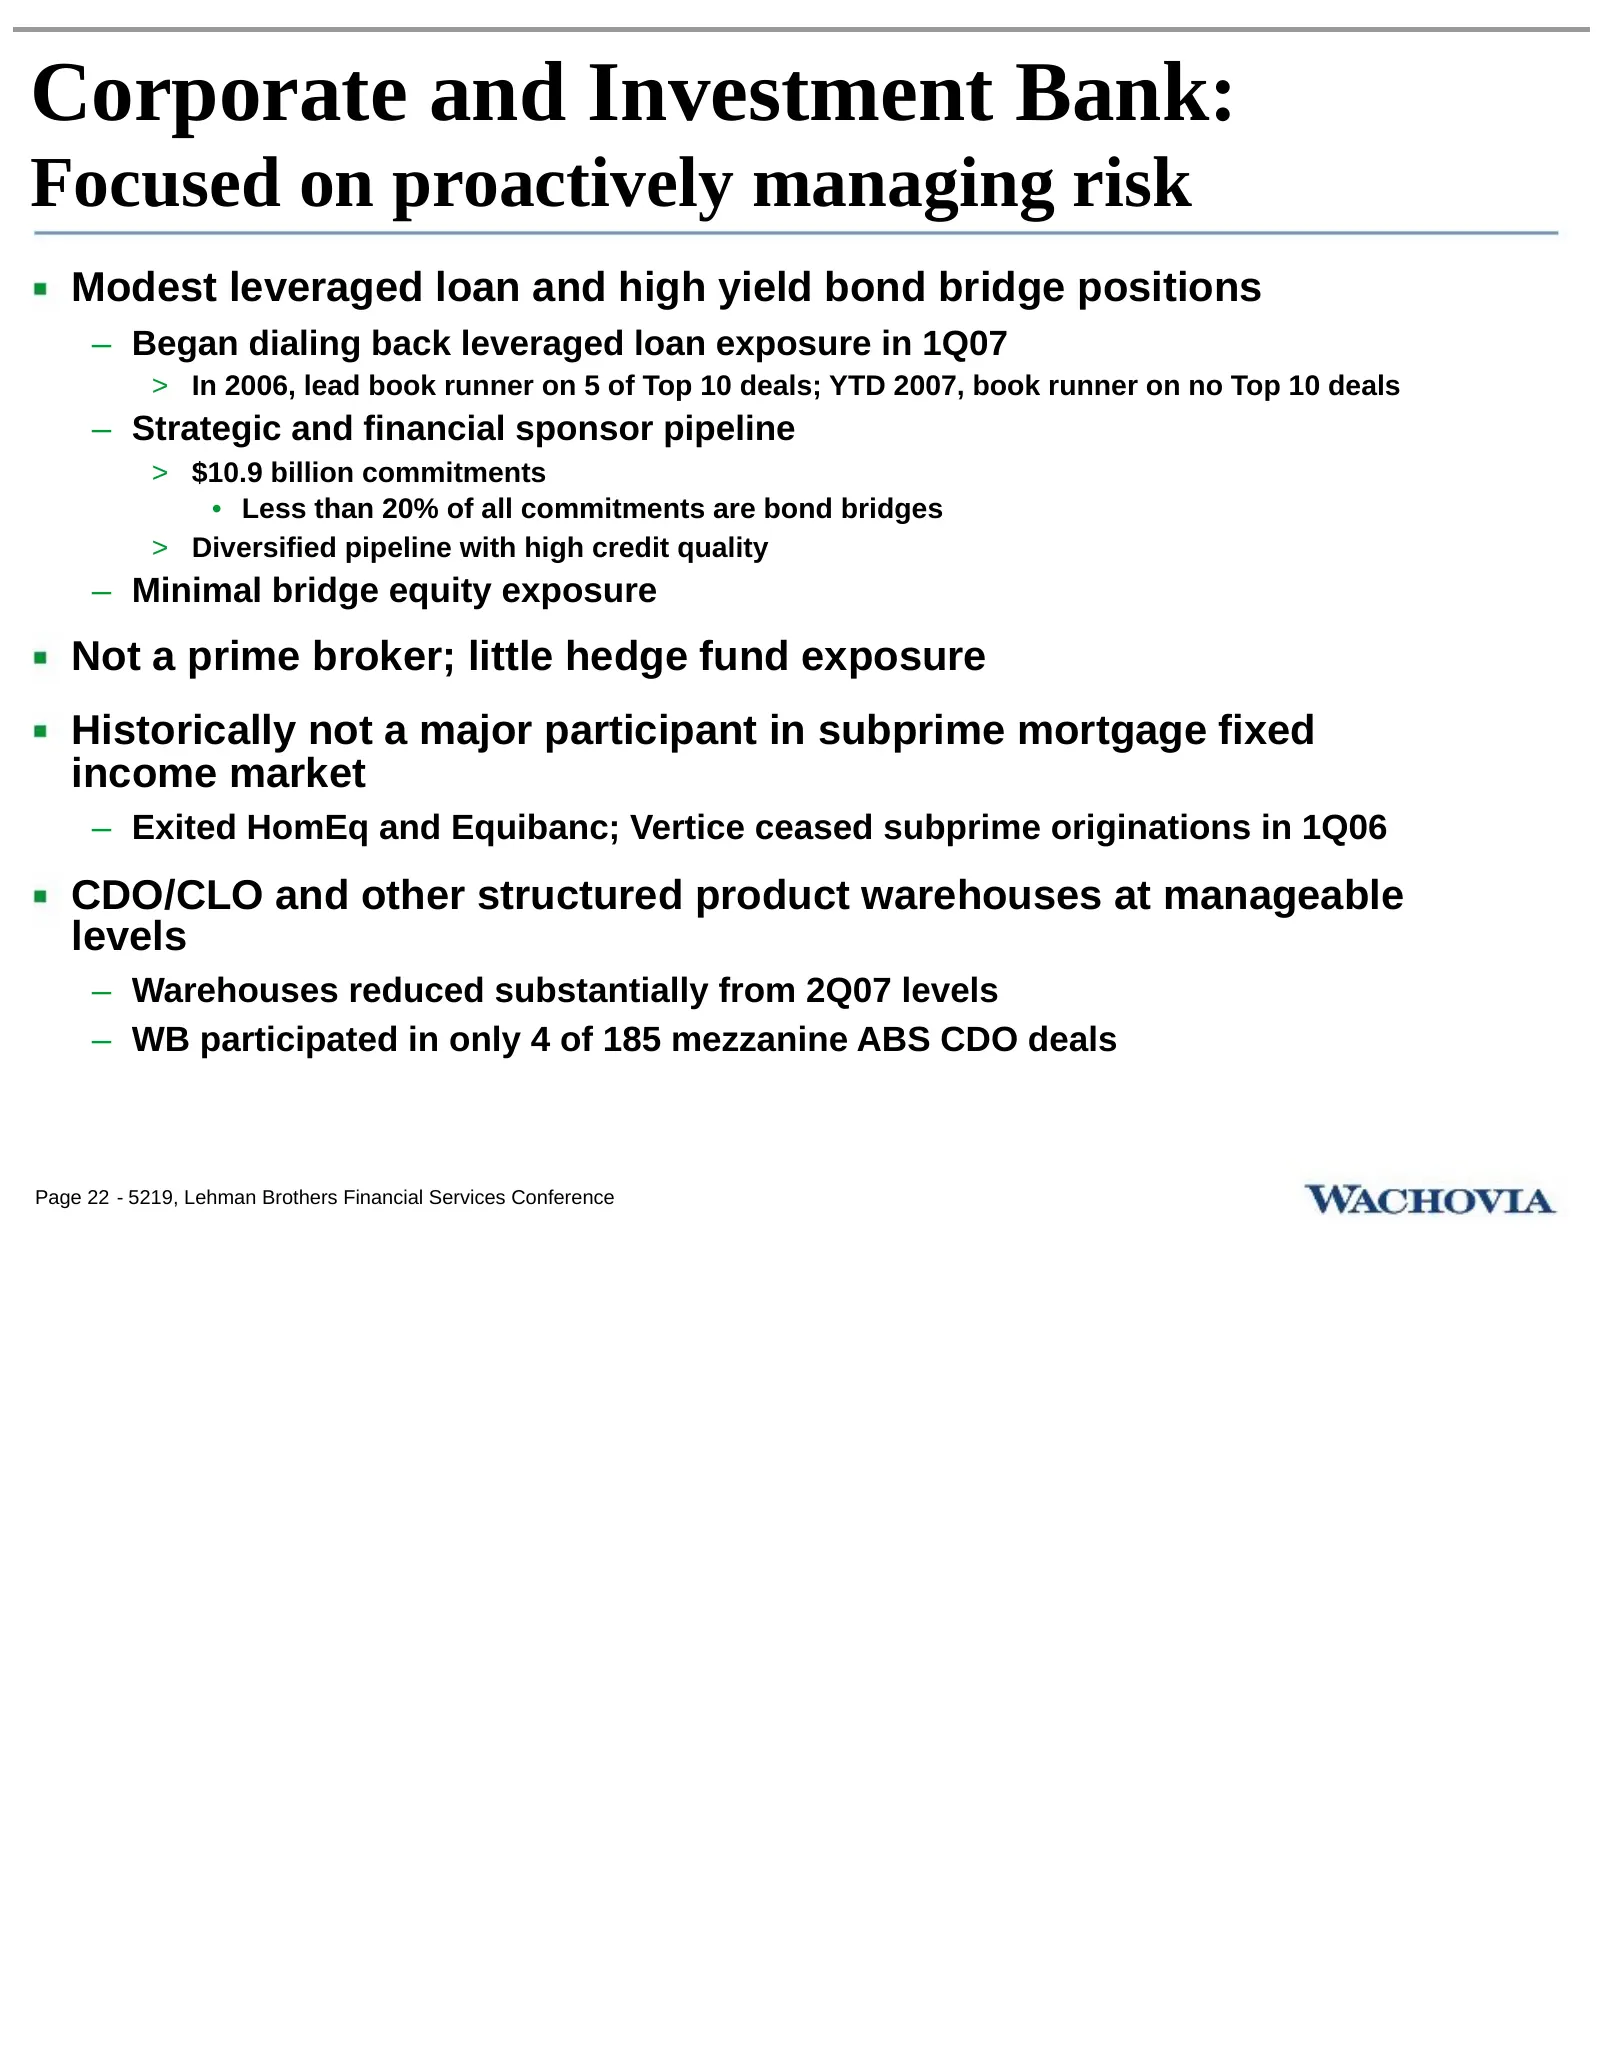
Corporate and Investment Bank: Focused on proactively managing risk Modest leveraged loan and high yield bond bridge positions – Began dialing back leveraged loan exposure in 1Q07 > In 2006, lead book runner on 5 of Top 10 deals; YTD 2007, book runner on no Top 10 deals – Strategic and financial spo
Slide 26: Strong risk culture, expense control and capital management discipline
Strong risk culture, expense control and capital management discipline Superior credit performance resulting from low risk business model Solid efficiency improvements despite ongoing investments for growth Well positioned with excess capital Page 23 - 5219, Lehman Brothers Financial Services Confer
Slide 27: Low risk business model drives low loss-content loan portfolio
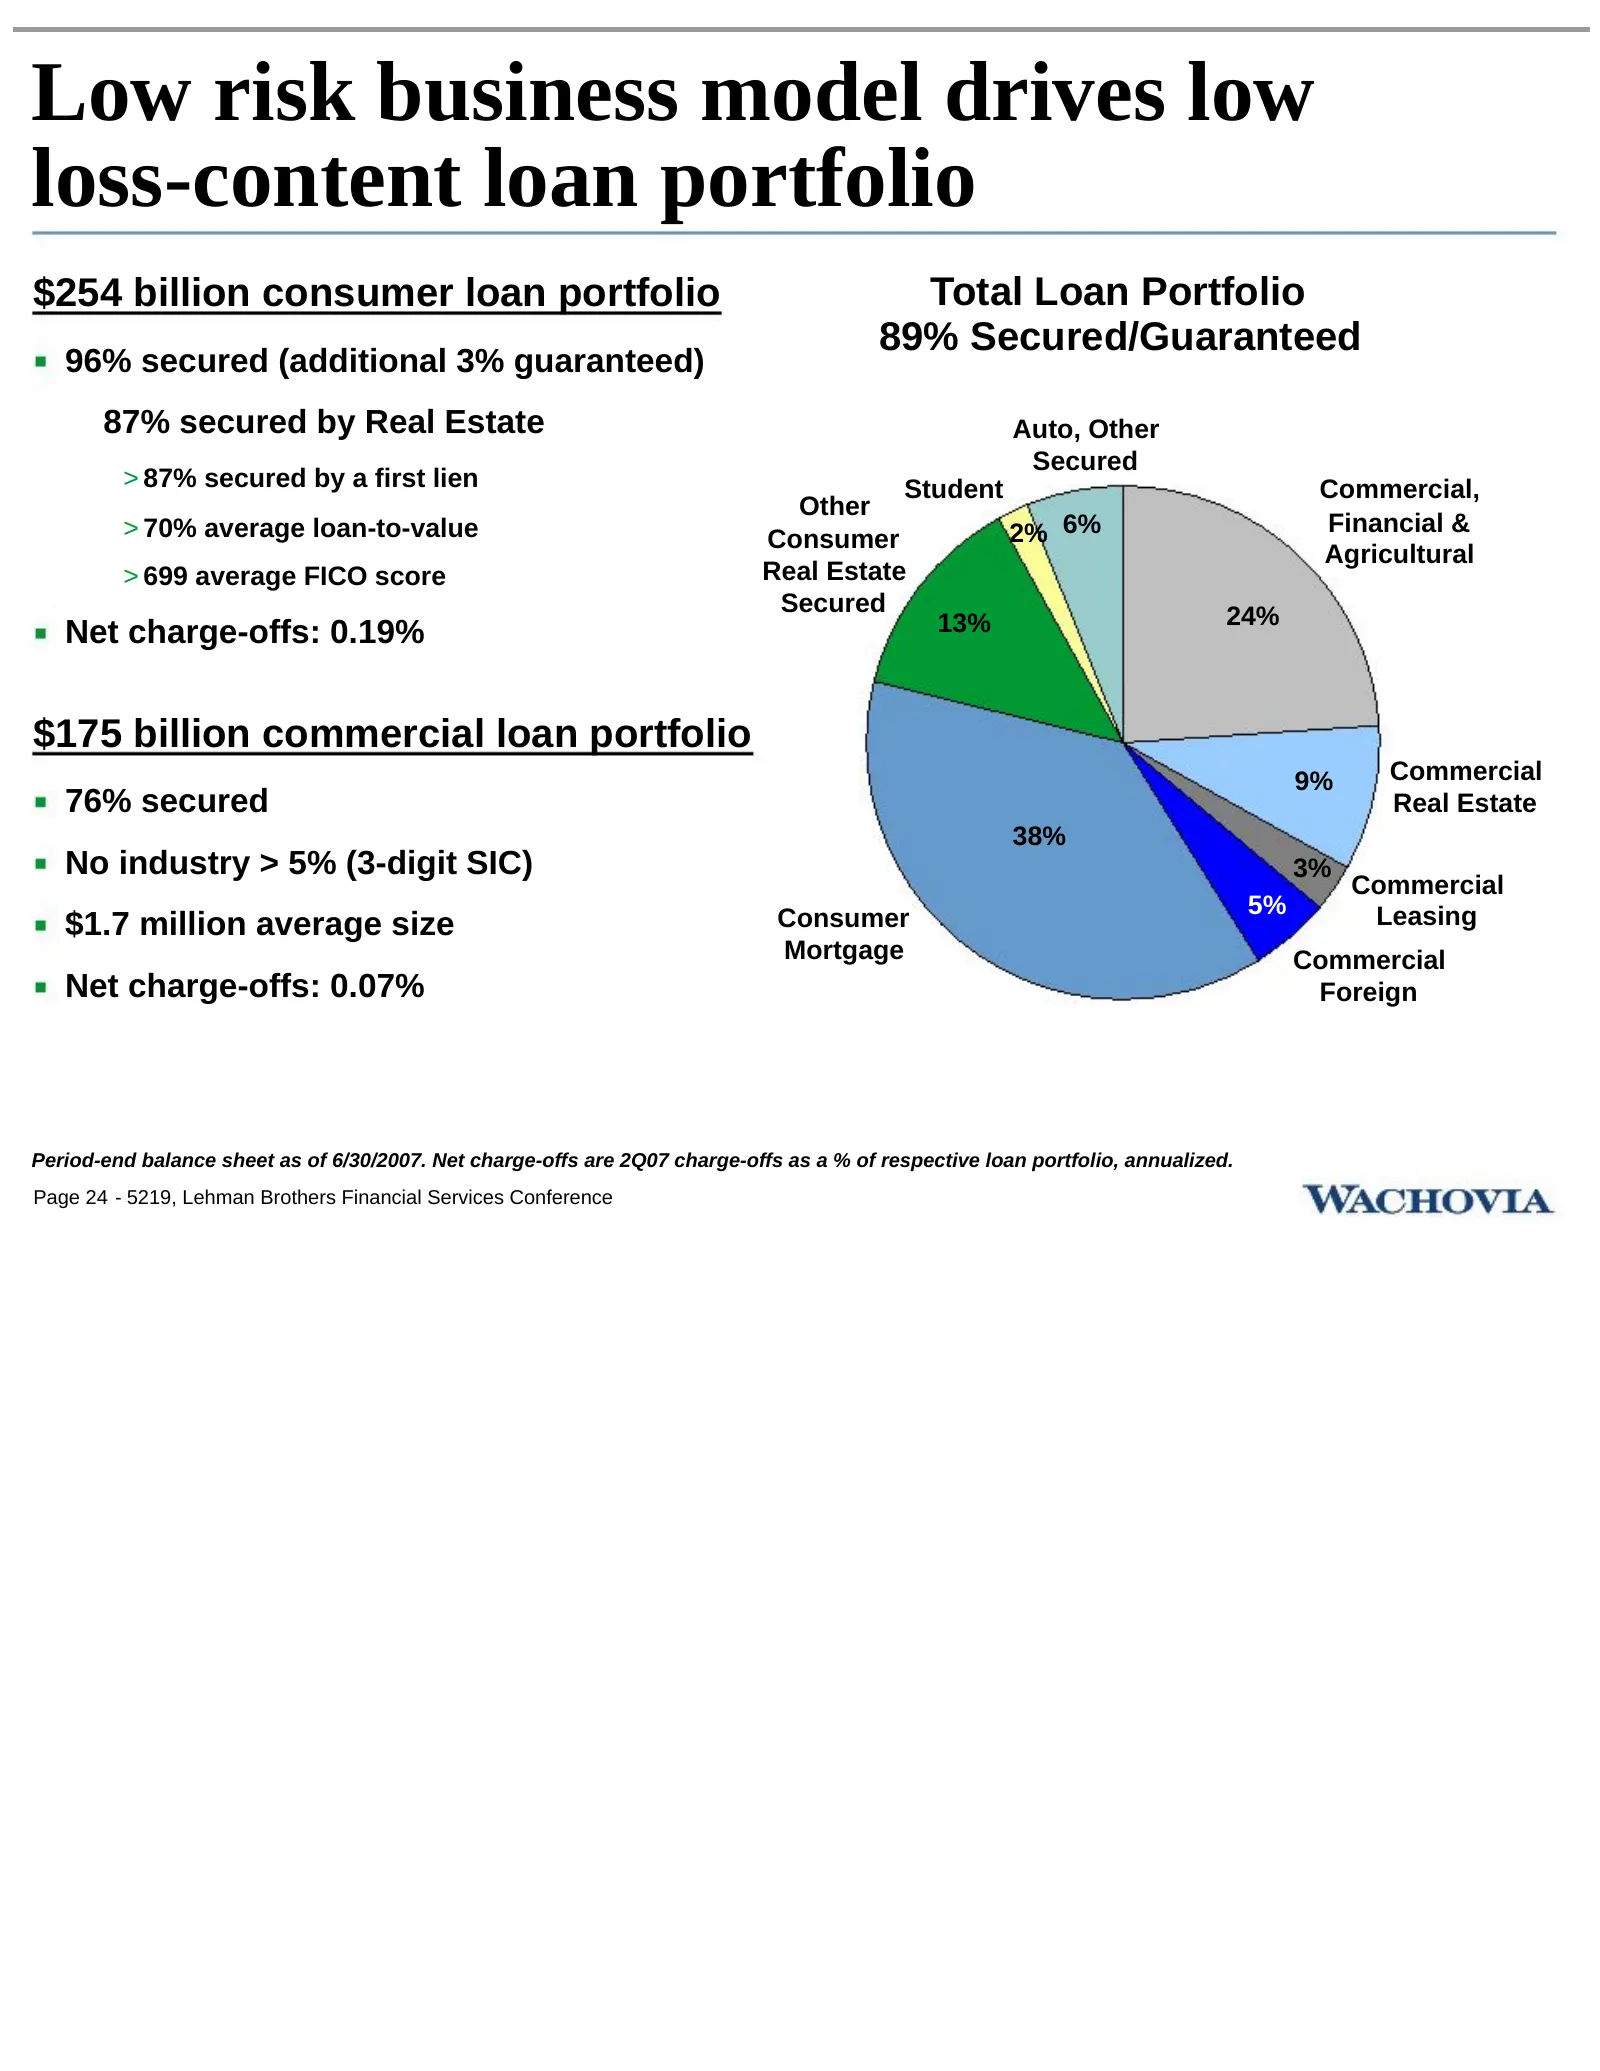
Low risk business model drives low loss-content loan portfolio $254 billion consumer loan portfolio Total Loan Portfolio 89% Secured/Guaranteed 96% secured (additional 3% guaranteed) 87% secured by Real Estate Auto, Other Secured > 87% secured by a first lien Student Commercial, Other > 70% average
Slide 28: Growth in reserves driven by low risk portfolio growth
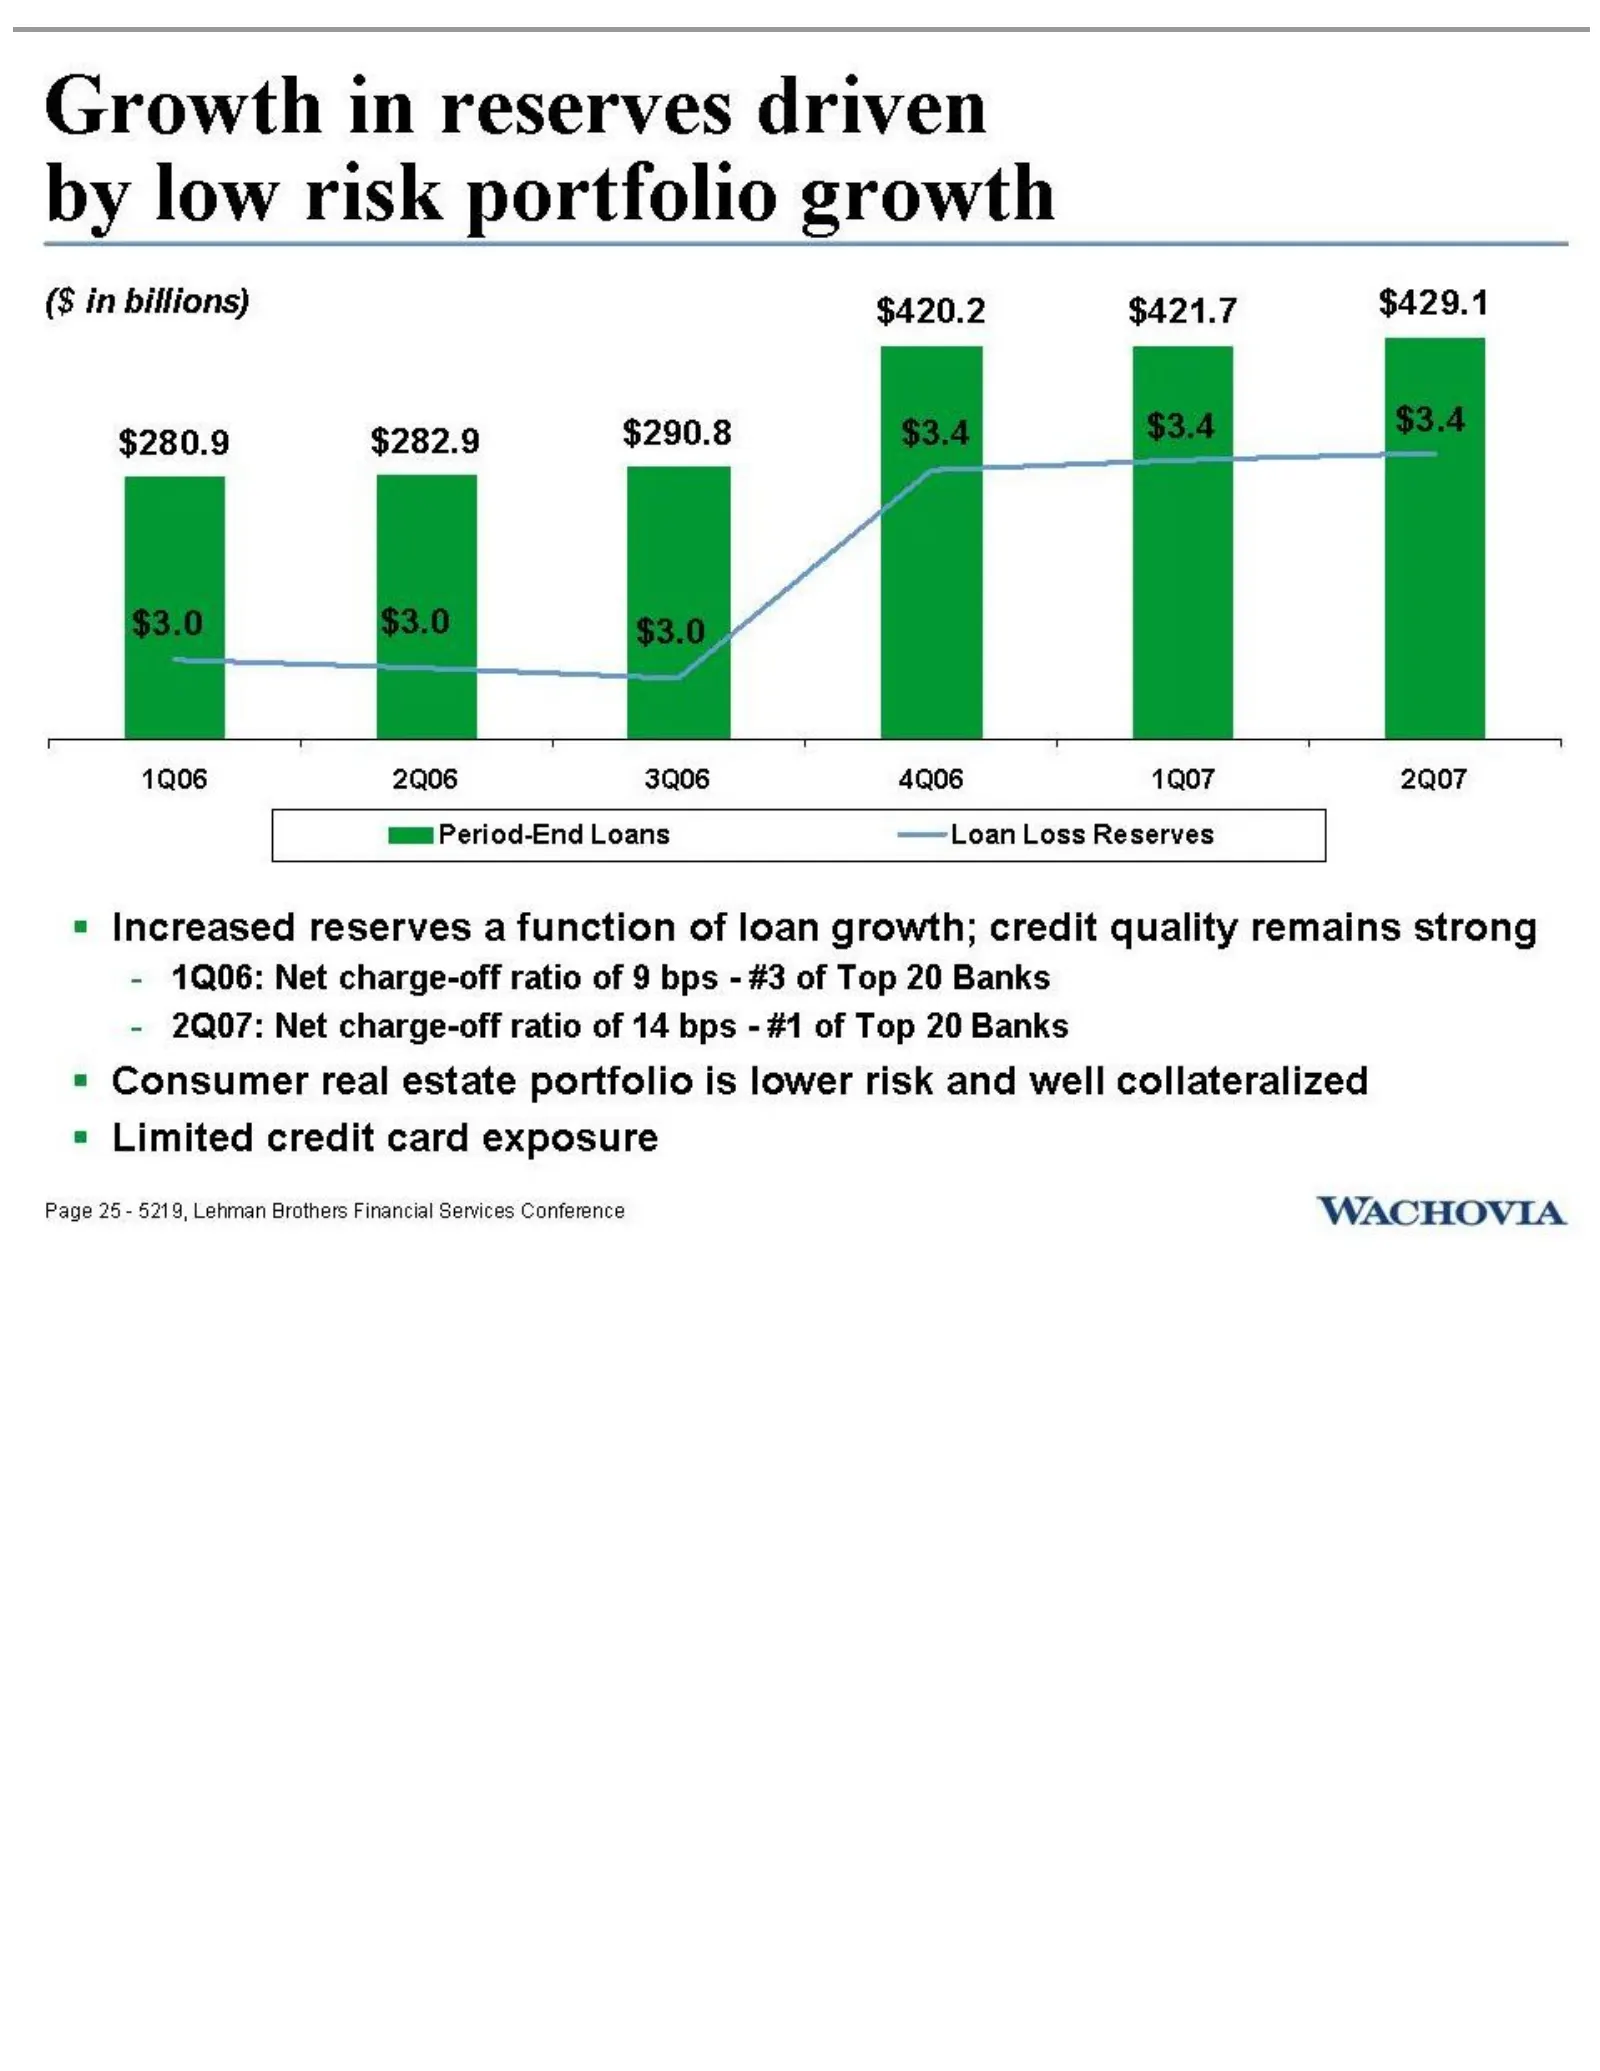
Growth in reserves driven by low risk portfolio growth (§ in billions) $420.2 $421.7 $429.1 $280.9 $282.9 $290.8 1Q06 2Q06 3Q06 4Q06 1Q07 2Q07 mam Period-End Loans —— Loan Loss Reserves « Increased reserves a function of loan growth; credit quality remains strong - 1Q06: Net charge-off ratio of 9 bp
Slide 29: Low risk business model provides flexibility
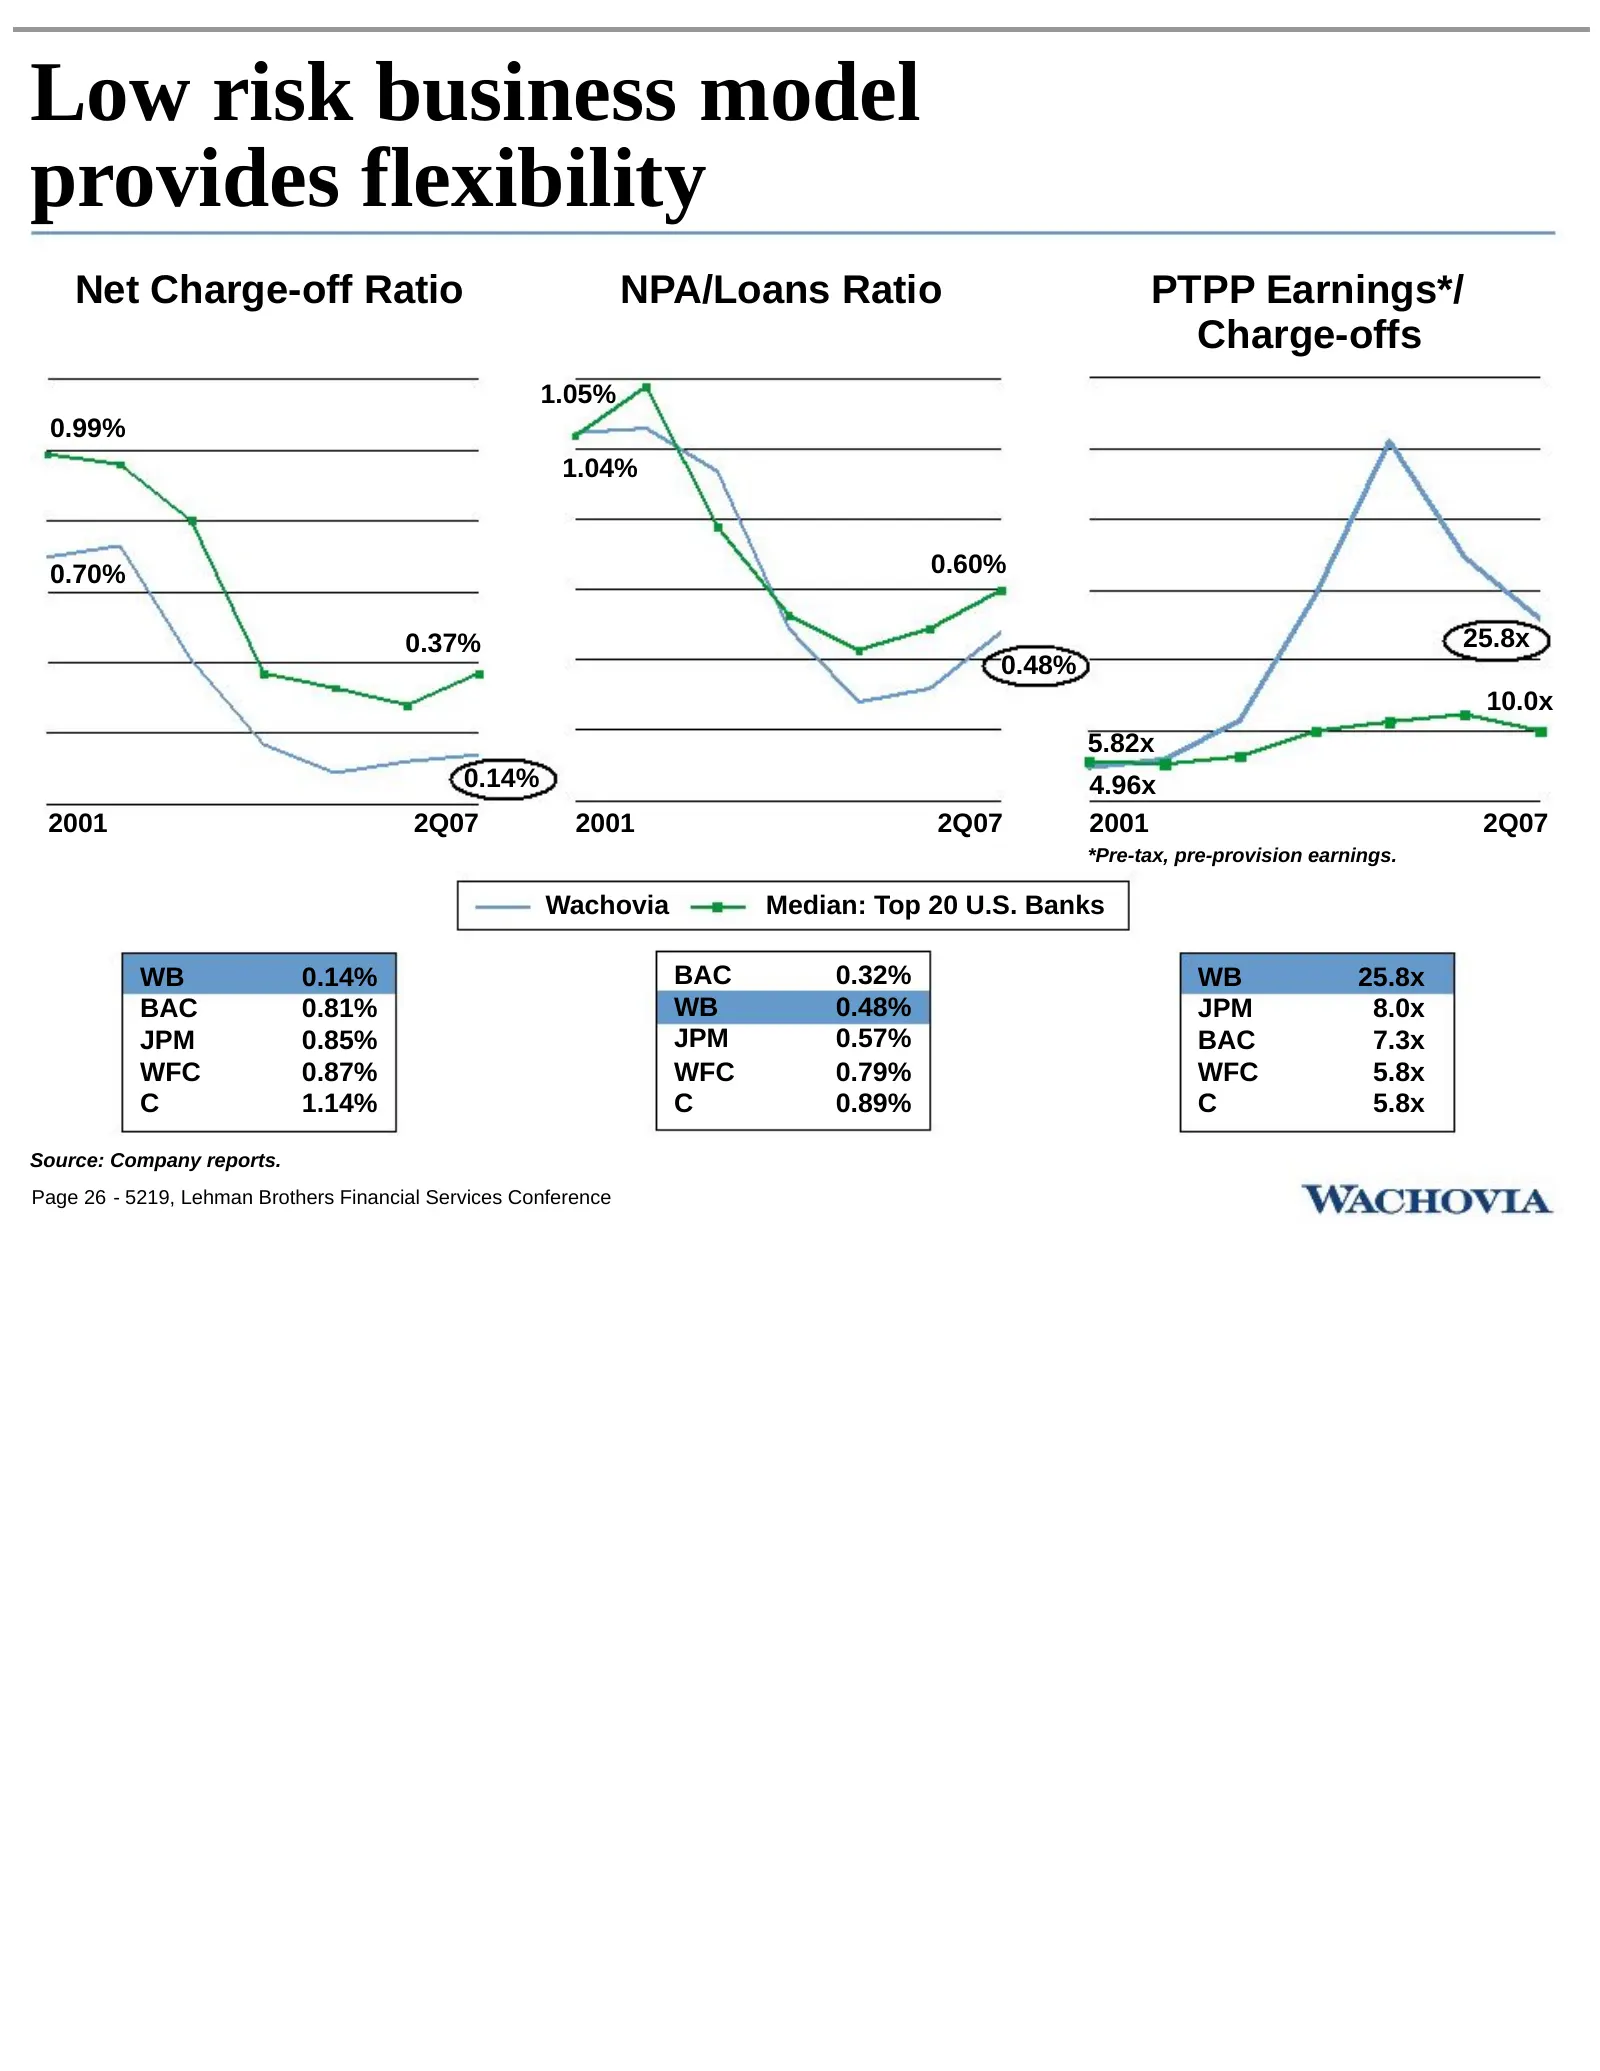
Low risk business model provides flexibility Net Charge-off Ratio NPA/Loans Ratio PTPP Earnings*/ Charge-offs 1.05% 0.99% 1.04% 0.70% 0.60% 0.37% 25.8x 0.48% 10.0x 5.82x 0.14% 4.96x 2001 2Q07 2001 2Q07 2001 2Q07 *Pre-tax, pre-provision earnings. Wachovia Median: Top 20 U.S. Banks WB 0.14% BAC 0.32%
Slide 30: Low risk business model produces significant capital cushion
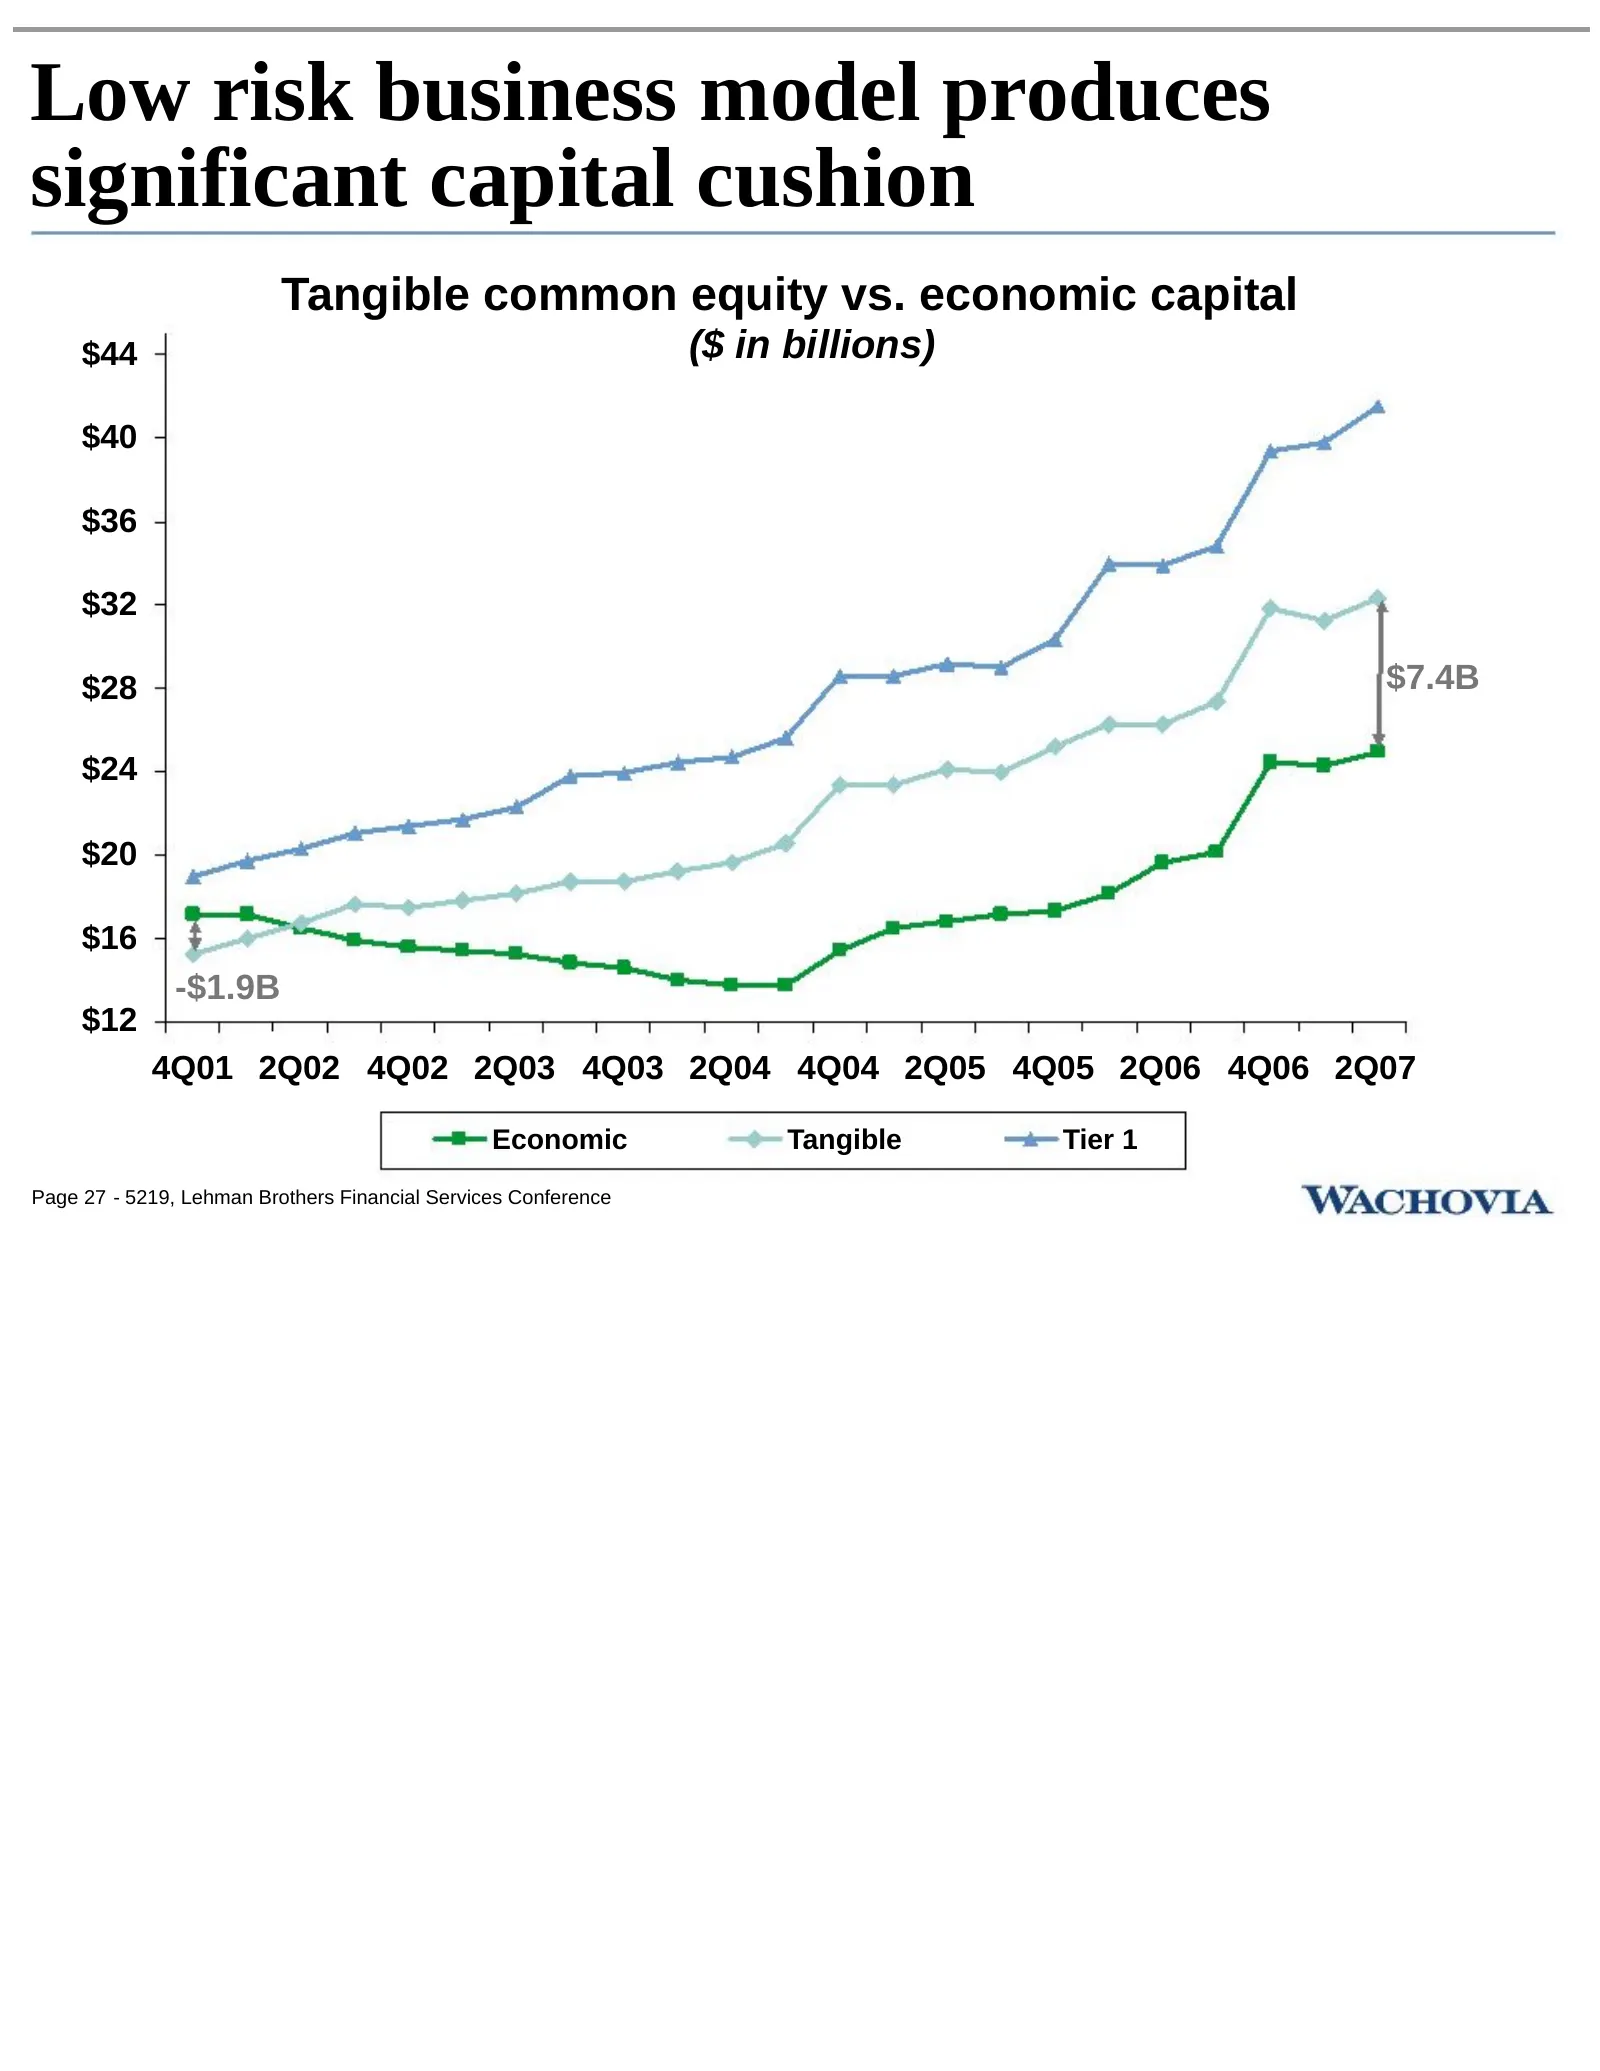
Low risk business model produces significant capital cushion Tangible common equity vs. economic capital $44 ($ in billions) $40 $36 $32 $28 $7.4B $24 $20 $16 -$1.9B $12 4Q01 2Q02 4Q02 2Q03 4Q03 2Q04 4Q04 2Q05 4Q05 2Q06 4Q06 2Q07 Economic Tangible Tier 1 Page 27 - 5219, Lehman Brothers Financial Ser
Slide 31: Strong EPS growth and low risk model permit strong dividend growth
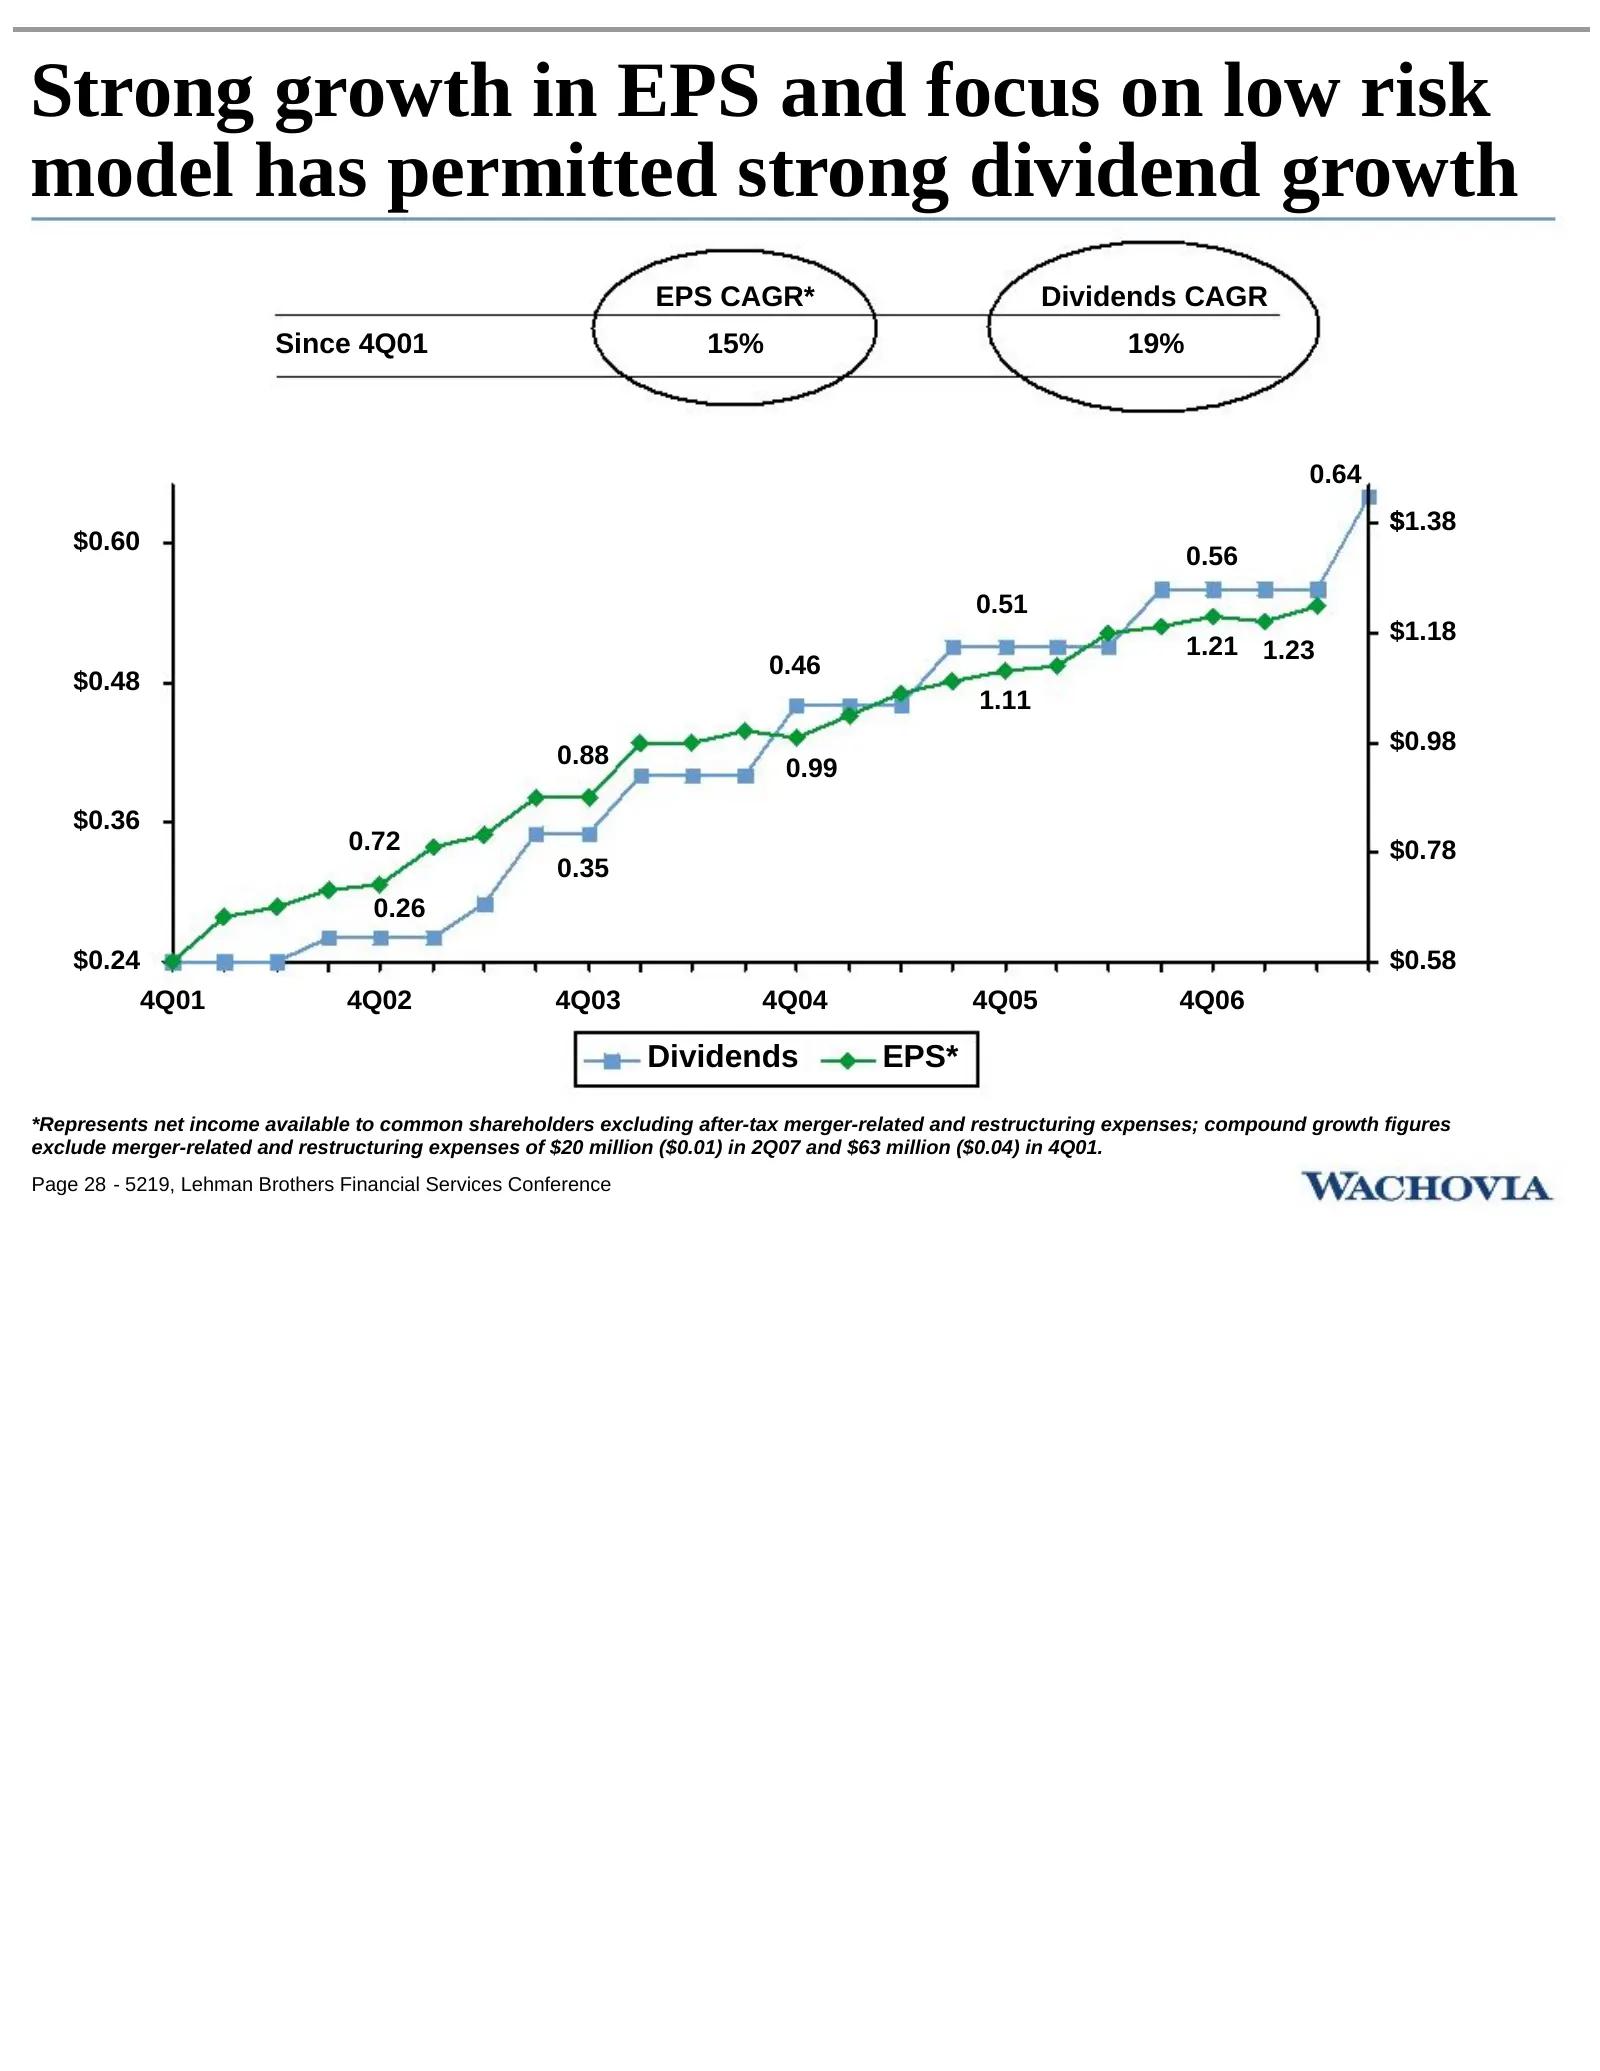
Strong growth in EPS and focus on low risk model has permitted strong dividend growth EPS CAGR* Dividends CAGR Since 4Q01 15% 19% 0.64 $1.38 $ $0.60 0.56 0.51 $1.18 1.21 1.23 0.46 $0.48 1.11 0.88 $0.98 0.99 $0.36 0.72 $0.78 0.35 0.26 $0.24 $0.58 4Q01 4Q02 4Q03 4Q04 4Q05 4Q06 Dividends EPS* *Represen
Slide 32: Priorities for excess capital usage
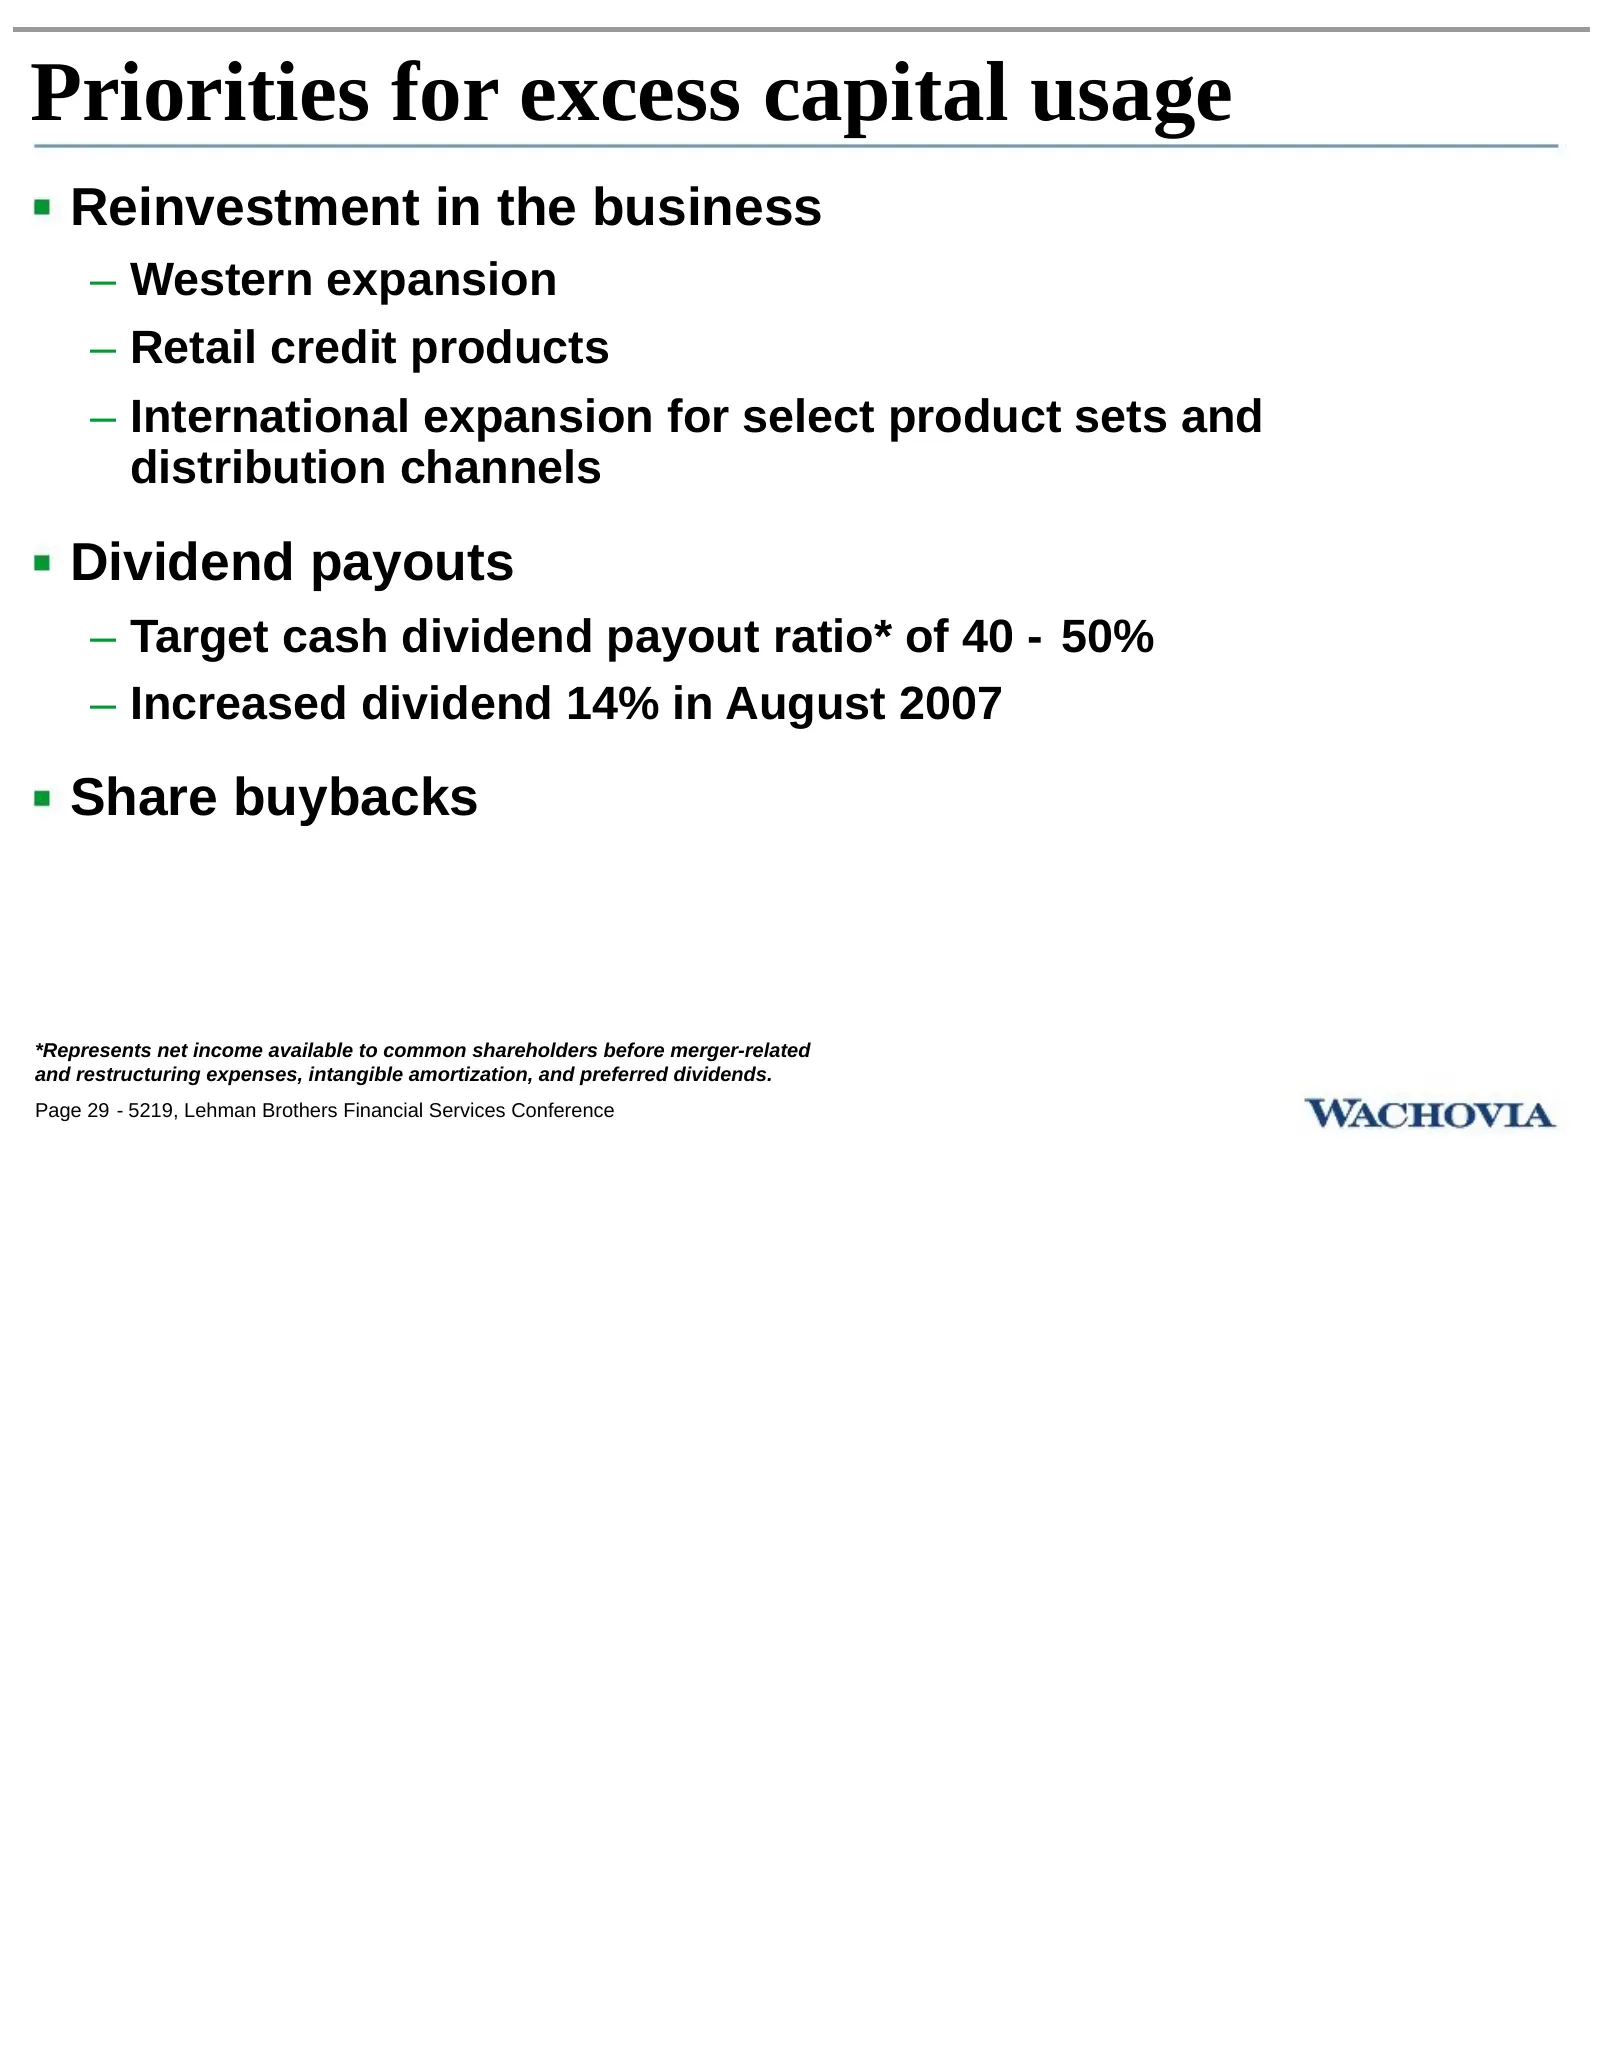
Priorities for excess capital usage Reinvestment in the business – Western expansion – Retail credit products – International expansion for select product sets and distribution channels Dividend payouts – Target cash dividend payout ratio* of 40 - 50% – Increased dividend 14% in August 2007 Share bu

Slide 33: Appendix
Appendix Page 30 - 5219, Lehman Brothers Financial Services Conference
Slide 34: General Bank: Strong track record of sales growth
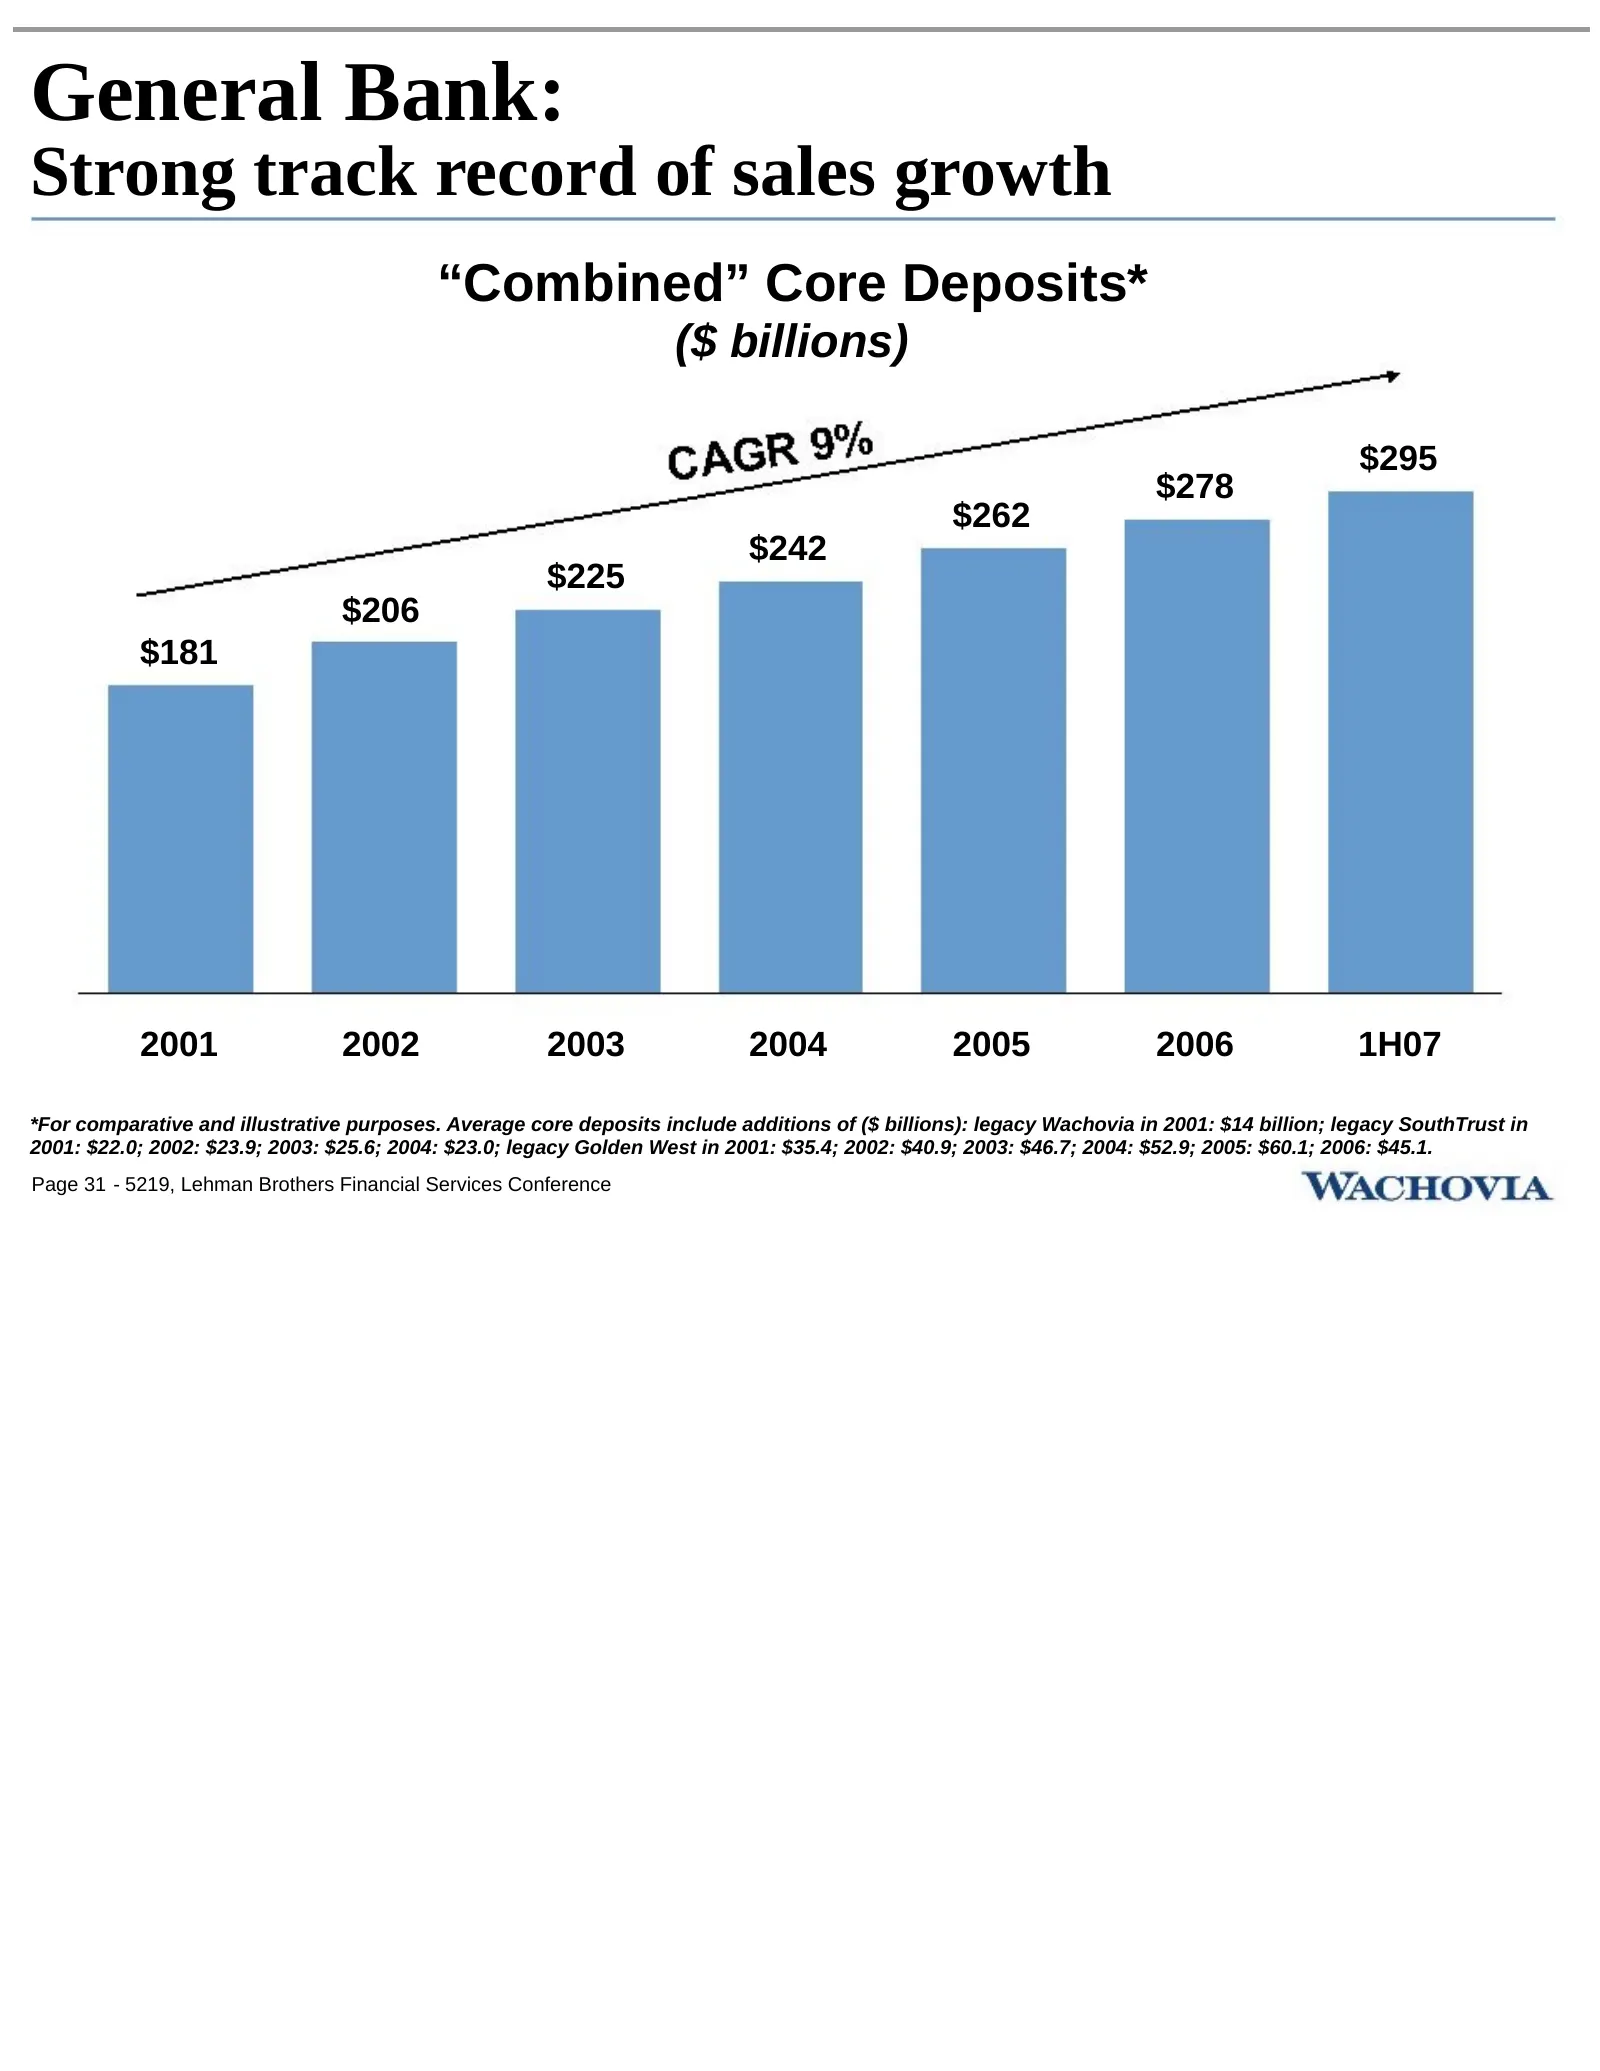
General Bank: Strong track record of sales growth “Combined” Core Deposits* ($ billions) $295 $278 $262 $242 $225 $206 $181 2001 2002 2003 2004 2005 2006 1H07 *For comparative and illustrative purposes. Average core deposits include additions of ($ billions): legacy Wachovia in 2001: $14 billion; le
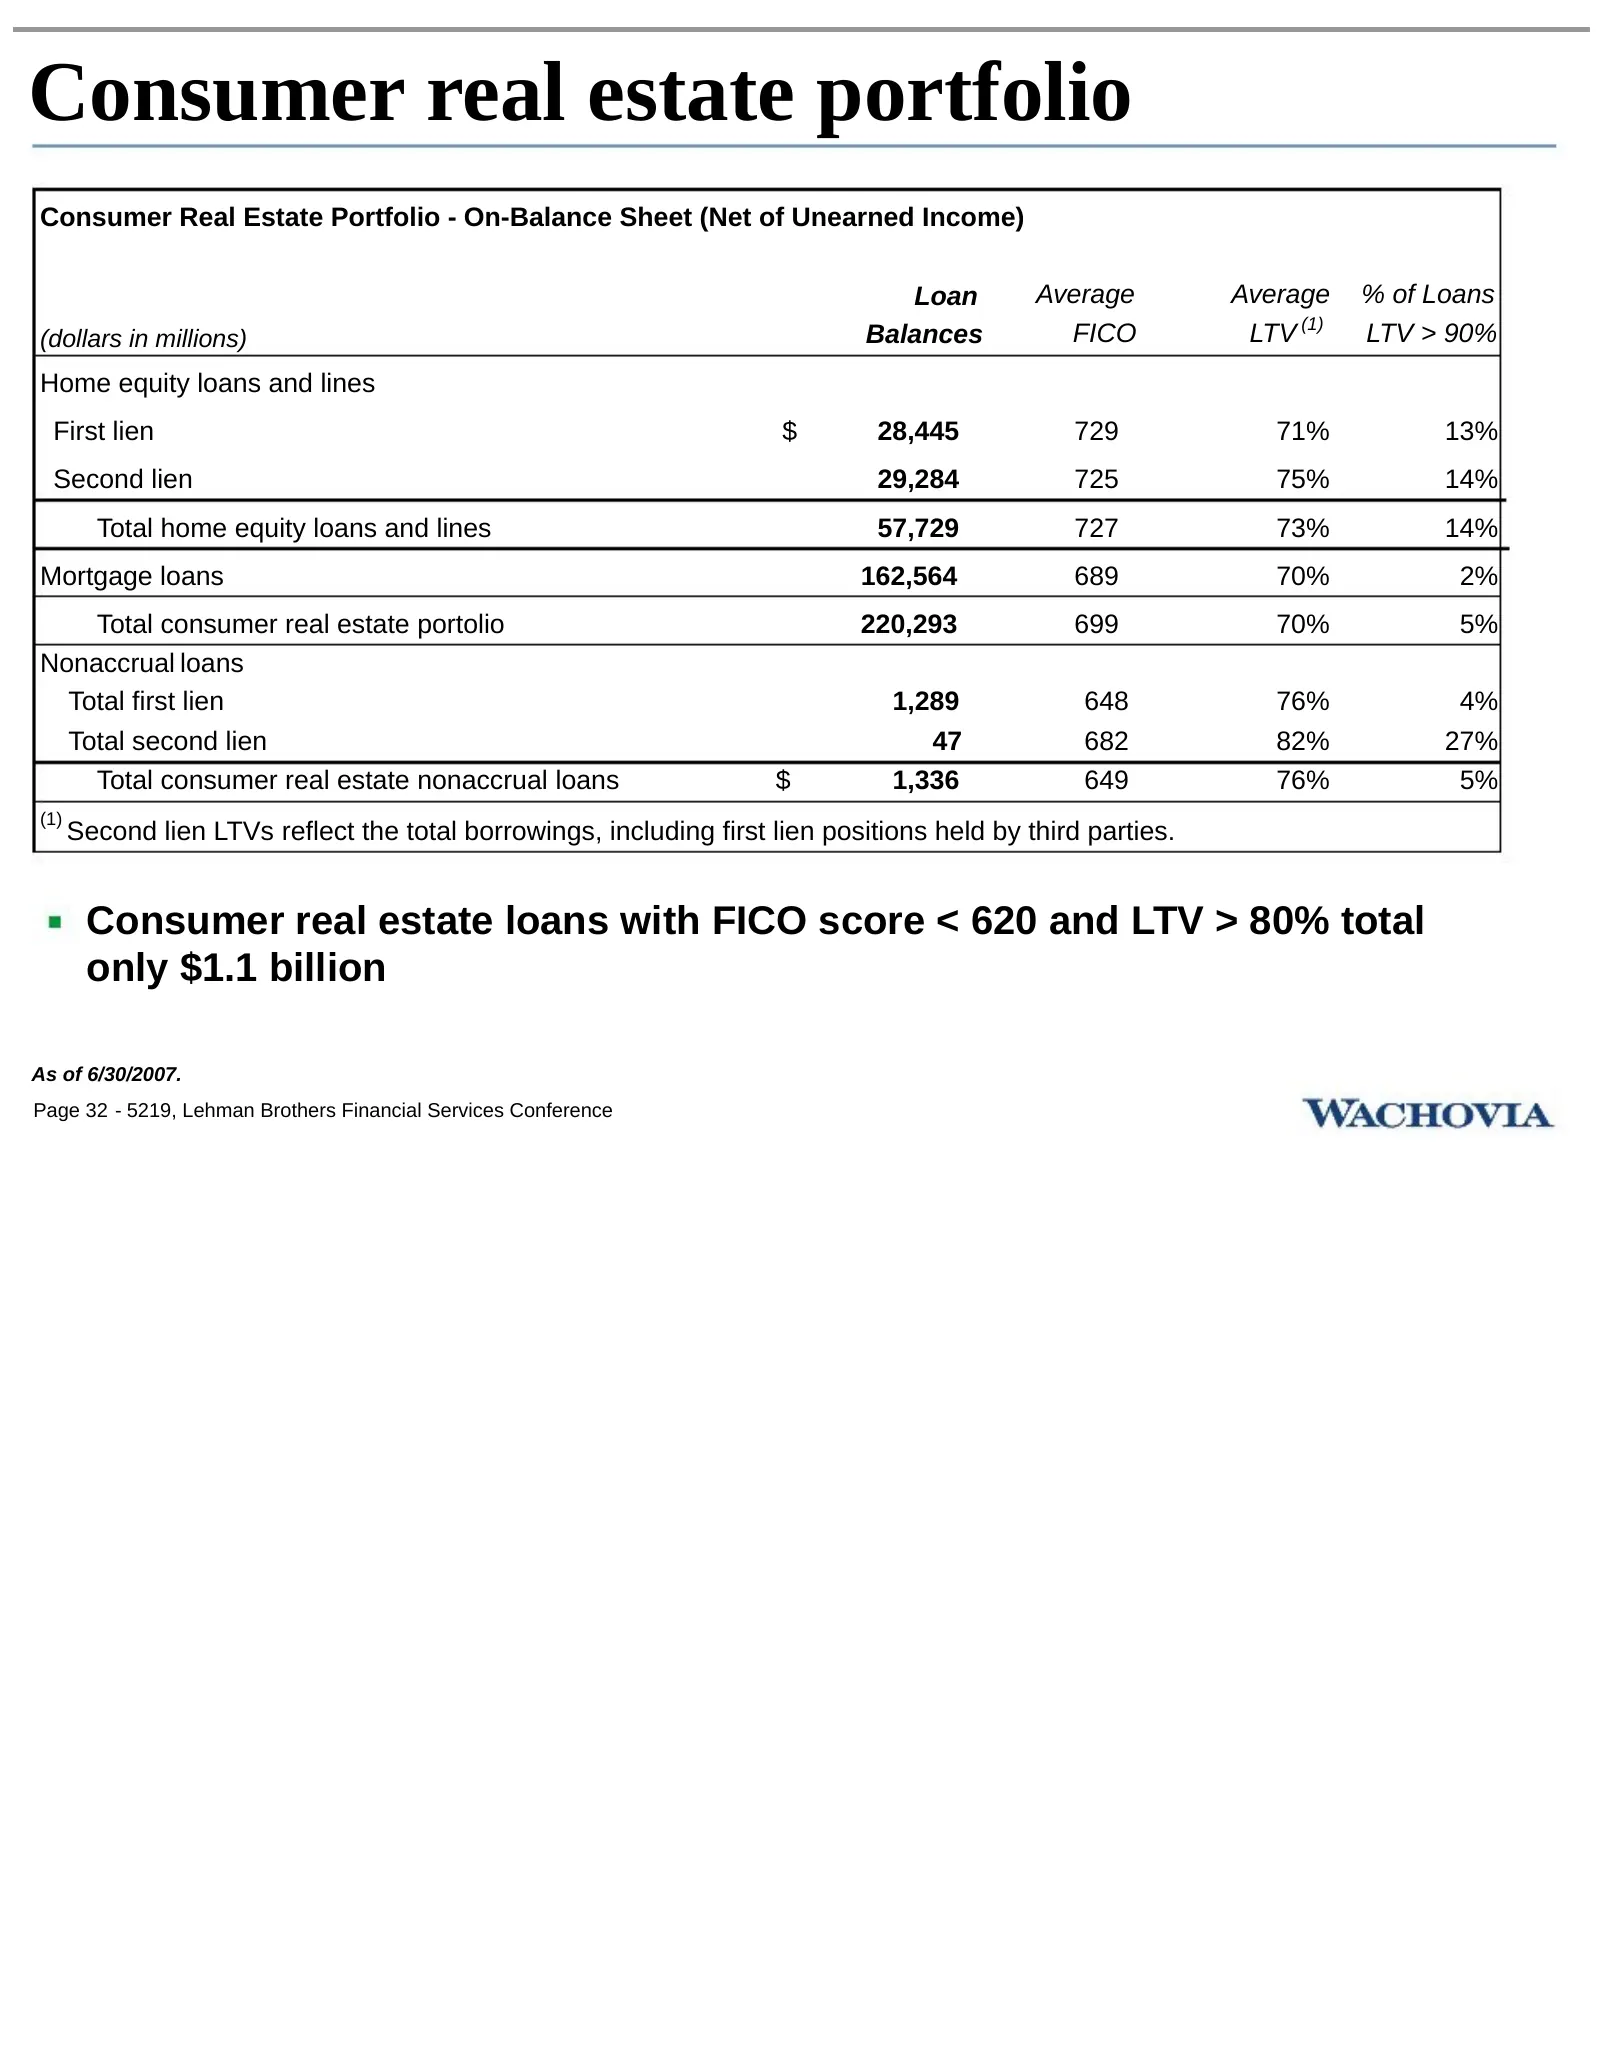
Slide 35: Consumer real estate portfolio
Consumer real estate portfolio Consumer Real Estate Portfolio - On-Balance Sheet (Net of Unearned Income) Loan Average Average % of Loans (dollars in millions) Balances FICO LTV (1) LTV > 90% Home equity loans and lines First lien $ 28,445 729 71% 13% Second lien 29,284 725 75% 14% Total home equity
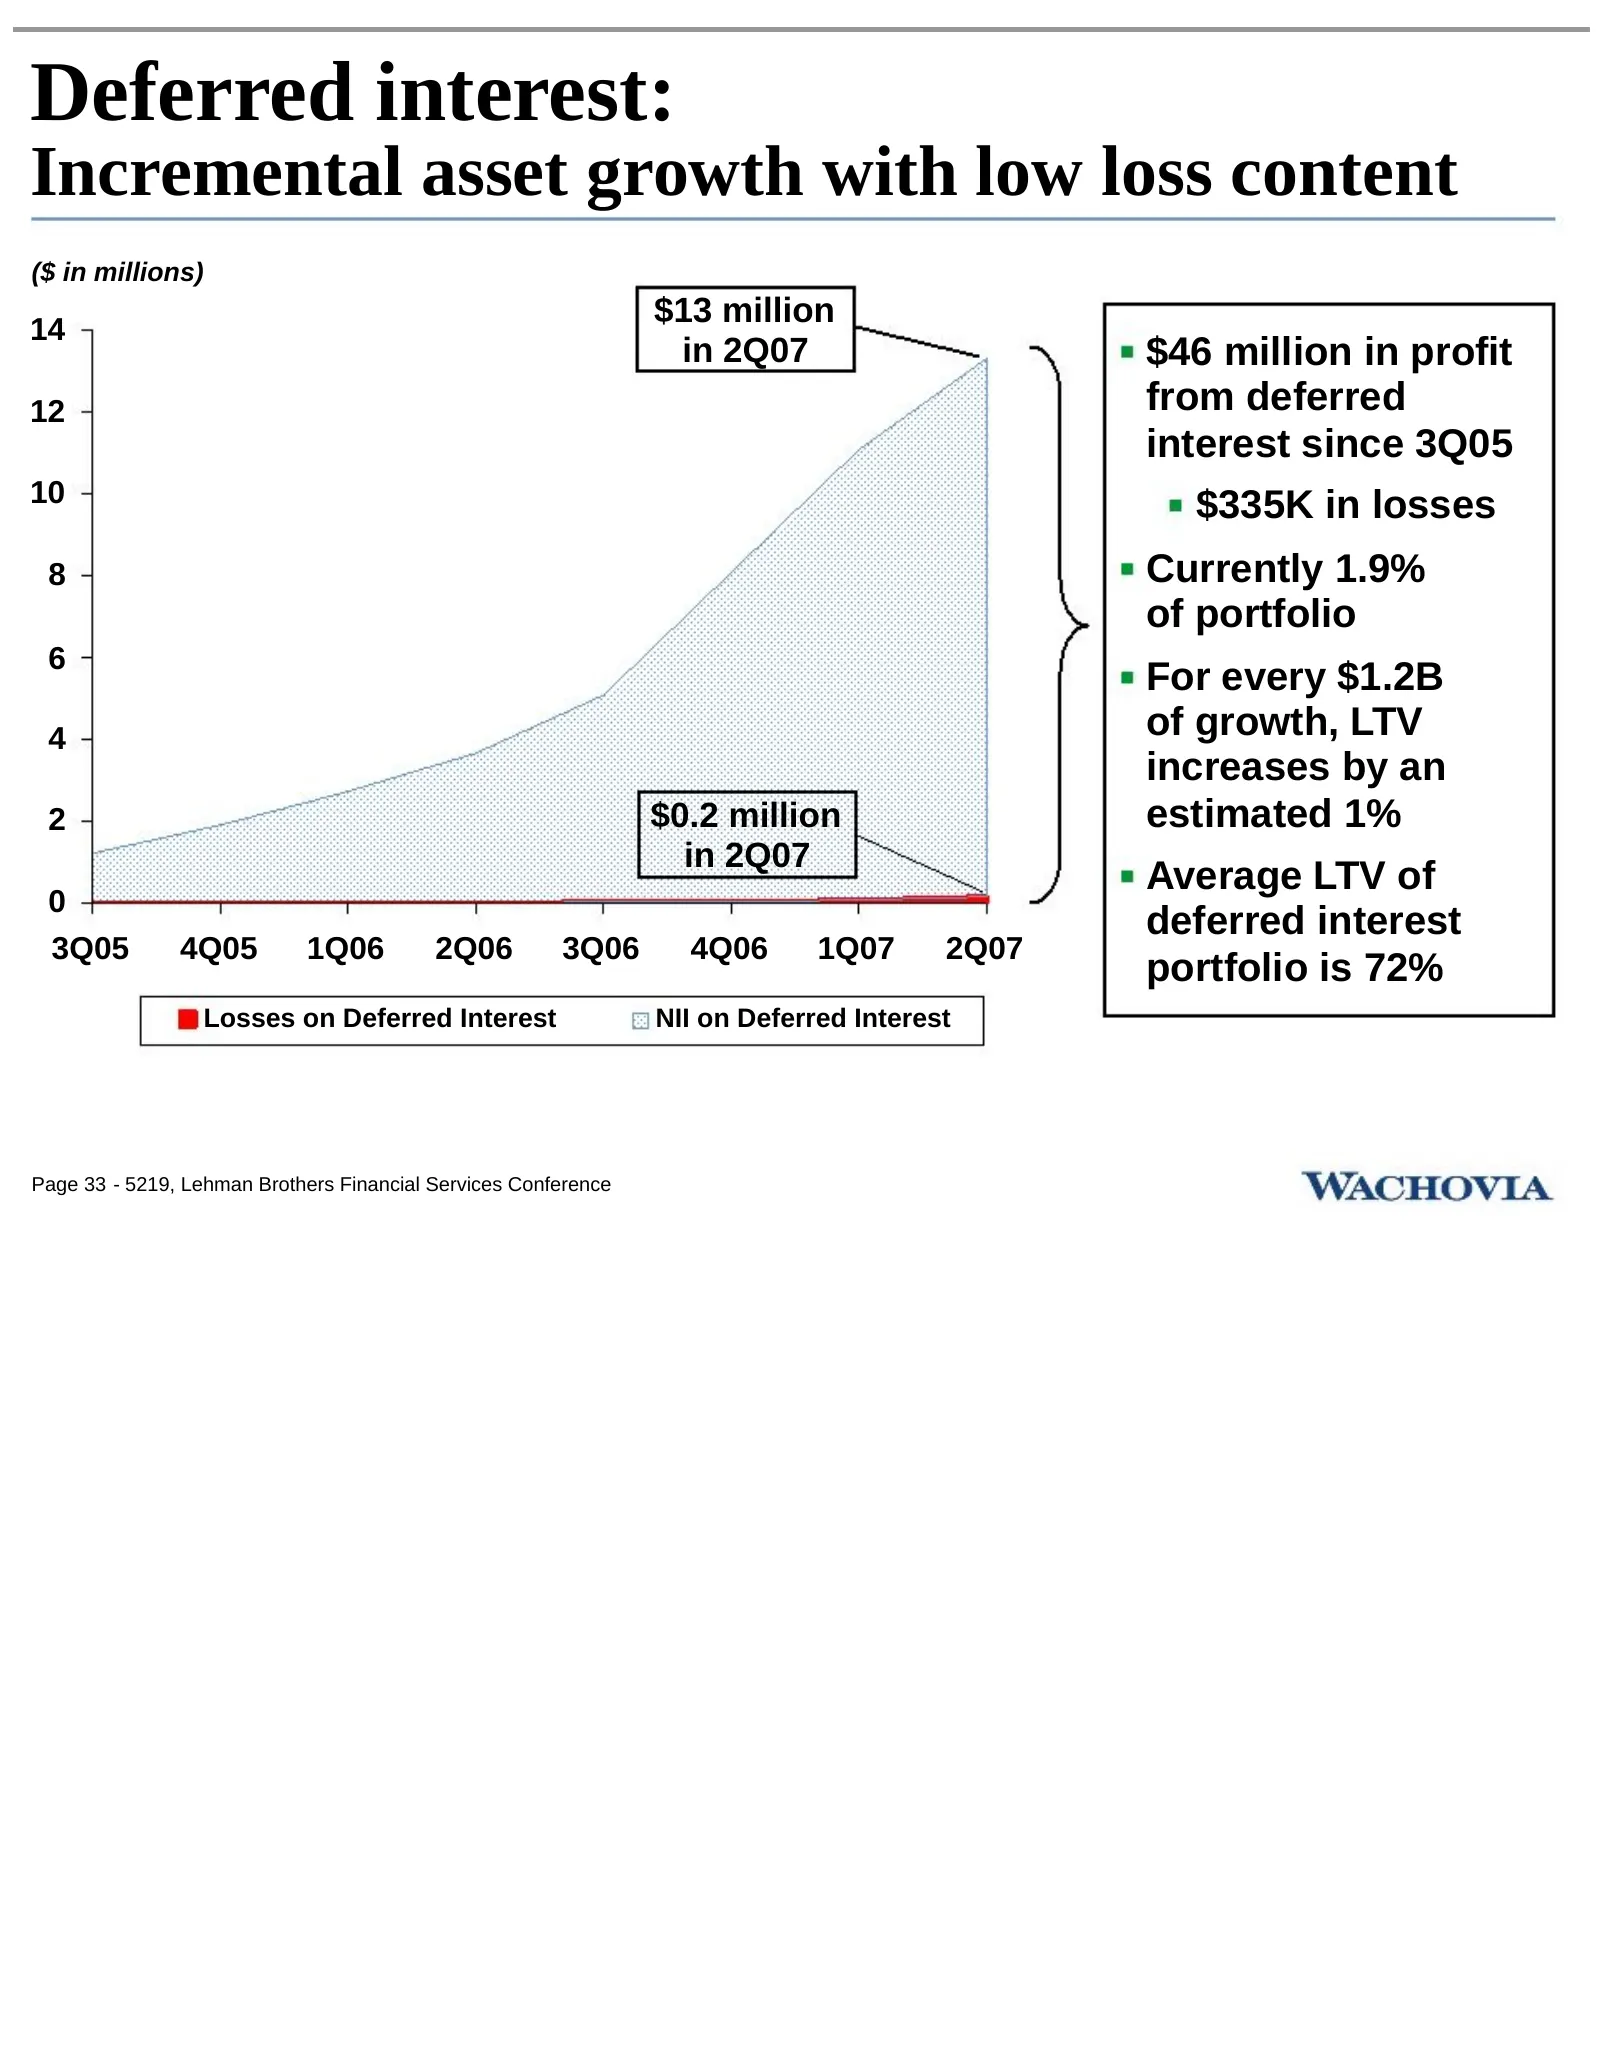
Slide 36: Deferred interest: Incremental asset growth with low loss content
Deferred interest: Incremental asset growth with low loss content ($ in millions) $13 million 14 in 2Q07 $46 million in profit 12 from deferred interest since 3Q05 10 $335K in losses 8 Currently 1.9% of portfolio 6 For every $1.2B 4 of growth, LTV increases by an 2 $0.2 million estimated 1% in 2Q07
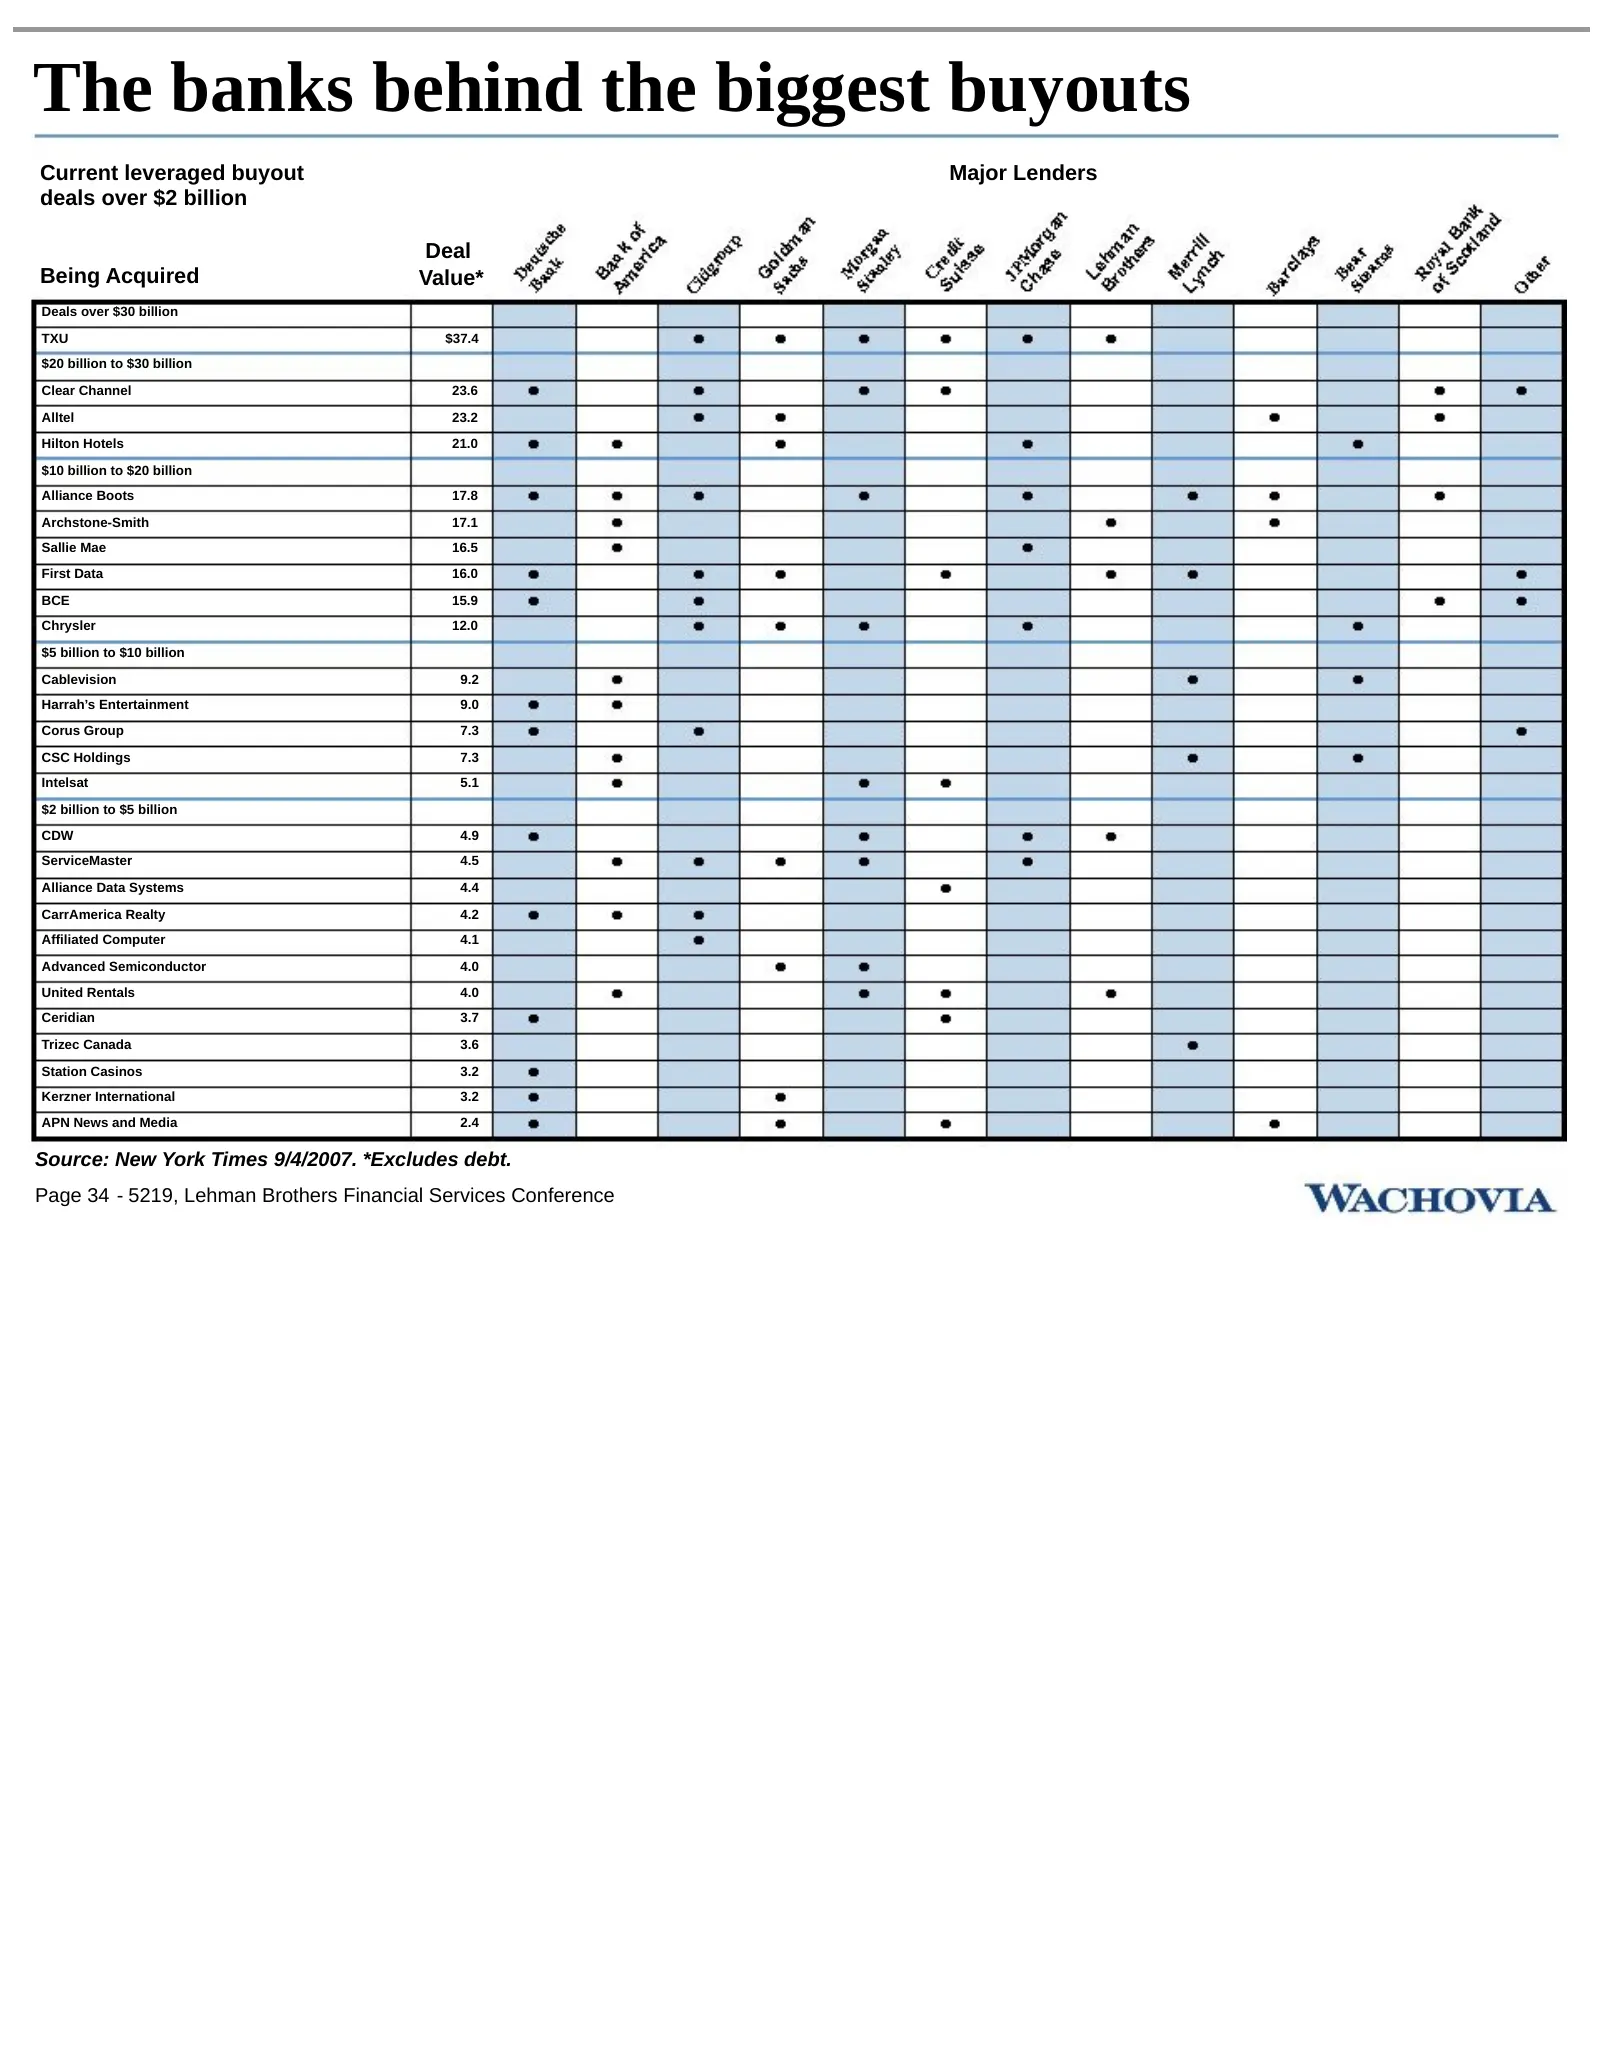
Slide 37: The banks behind the biggest buyouts
The banks behind the biggest buyouts Current leveraged buyout Major Lenders deals over $2 billion Deal Being Acquired Value* Deals over $30 billion TXU $37.4 $20 billion to $30 billion Clear Channel 23.6 Alltel 23.2 Hilton Hotels 21.0 $10 billion to $20 billion Alliance Boots 17.8 Archstone-Smith 17

Slide 38: Cautionary statement
Cautionary statement This investor presentation may contain, among other things, certain forward-looking statements with respect to Wachovia, as well as the goals, plans, objectives, intentions, expectations, financial condition, results of operations, future performance and business of Wachovia, in

Slide 39: Additional information
Additional information The proposed A.G. Edwards Merger will be submitted to A.G. Edwards’ shareholders for their consideration. A.G. Edwards’ shareholders are urged to read the definitive proxy statement/prospectus regarding the proposed A.G. Edwards Merger, as well as any other relevant documents
Source: SEC EDGAR · 425 filed Sep 10, 2007