Endurance Specialty Holdings Ltd
Endurance Specialty — Investor Presentation (November 2008)
9 slides from Endurance Specialty's investor presentation, Nov 25, 2008
Slide 1: Balance Sheet Quality and Financial Strength
Endurance Specialty Holdings Ltd. Balance Sheet Quality and Financial Strength
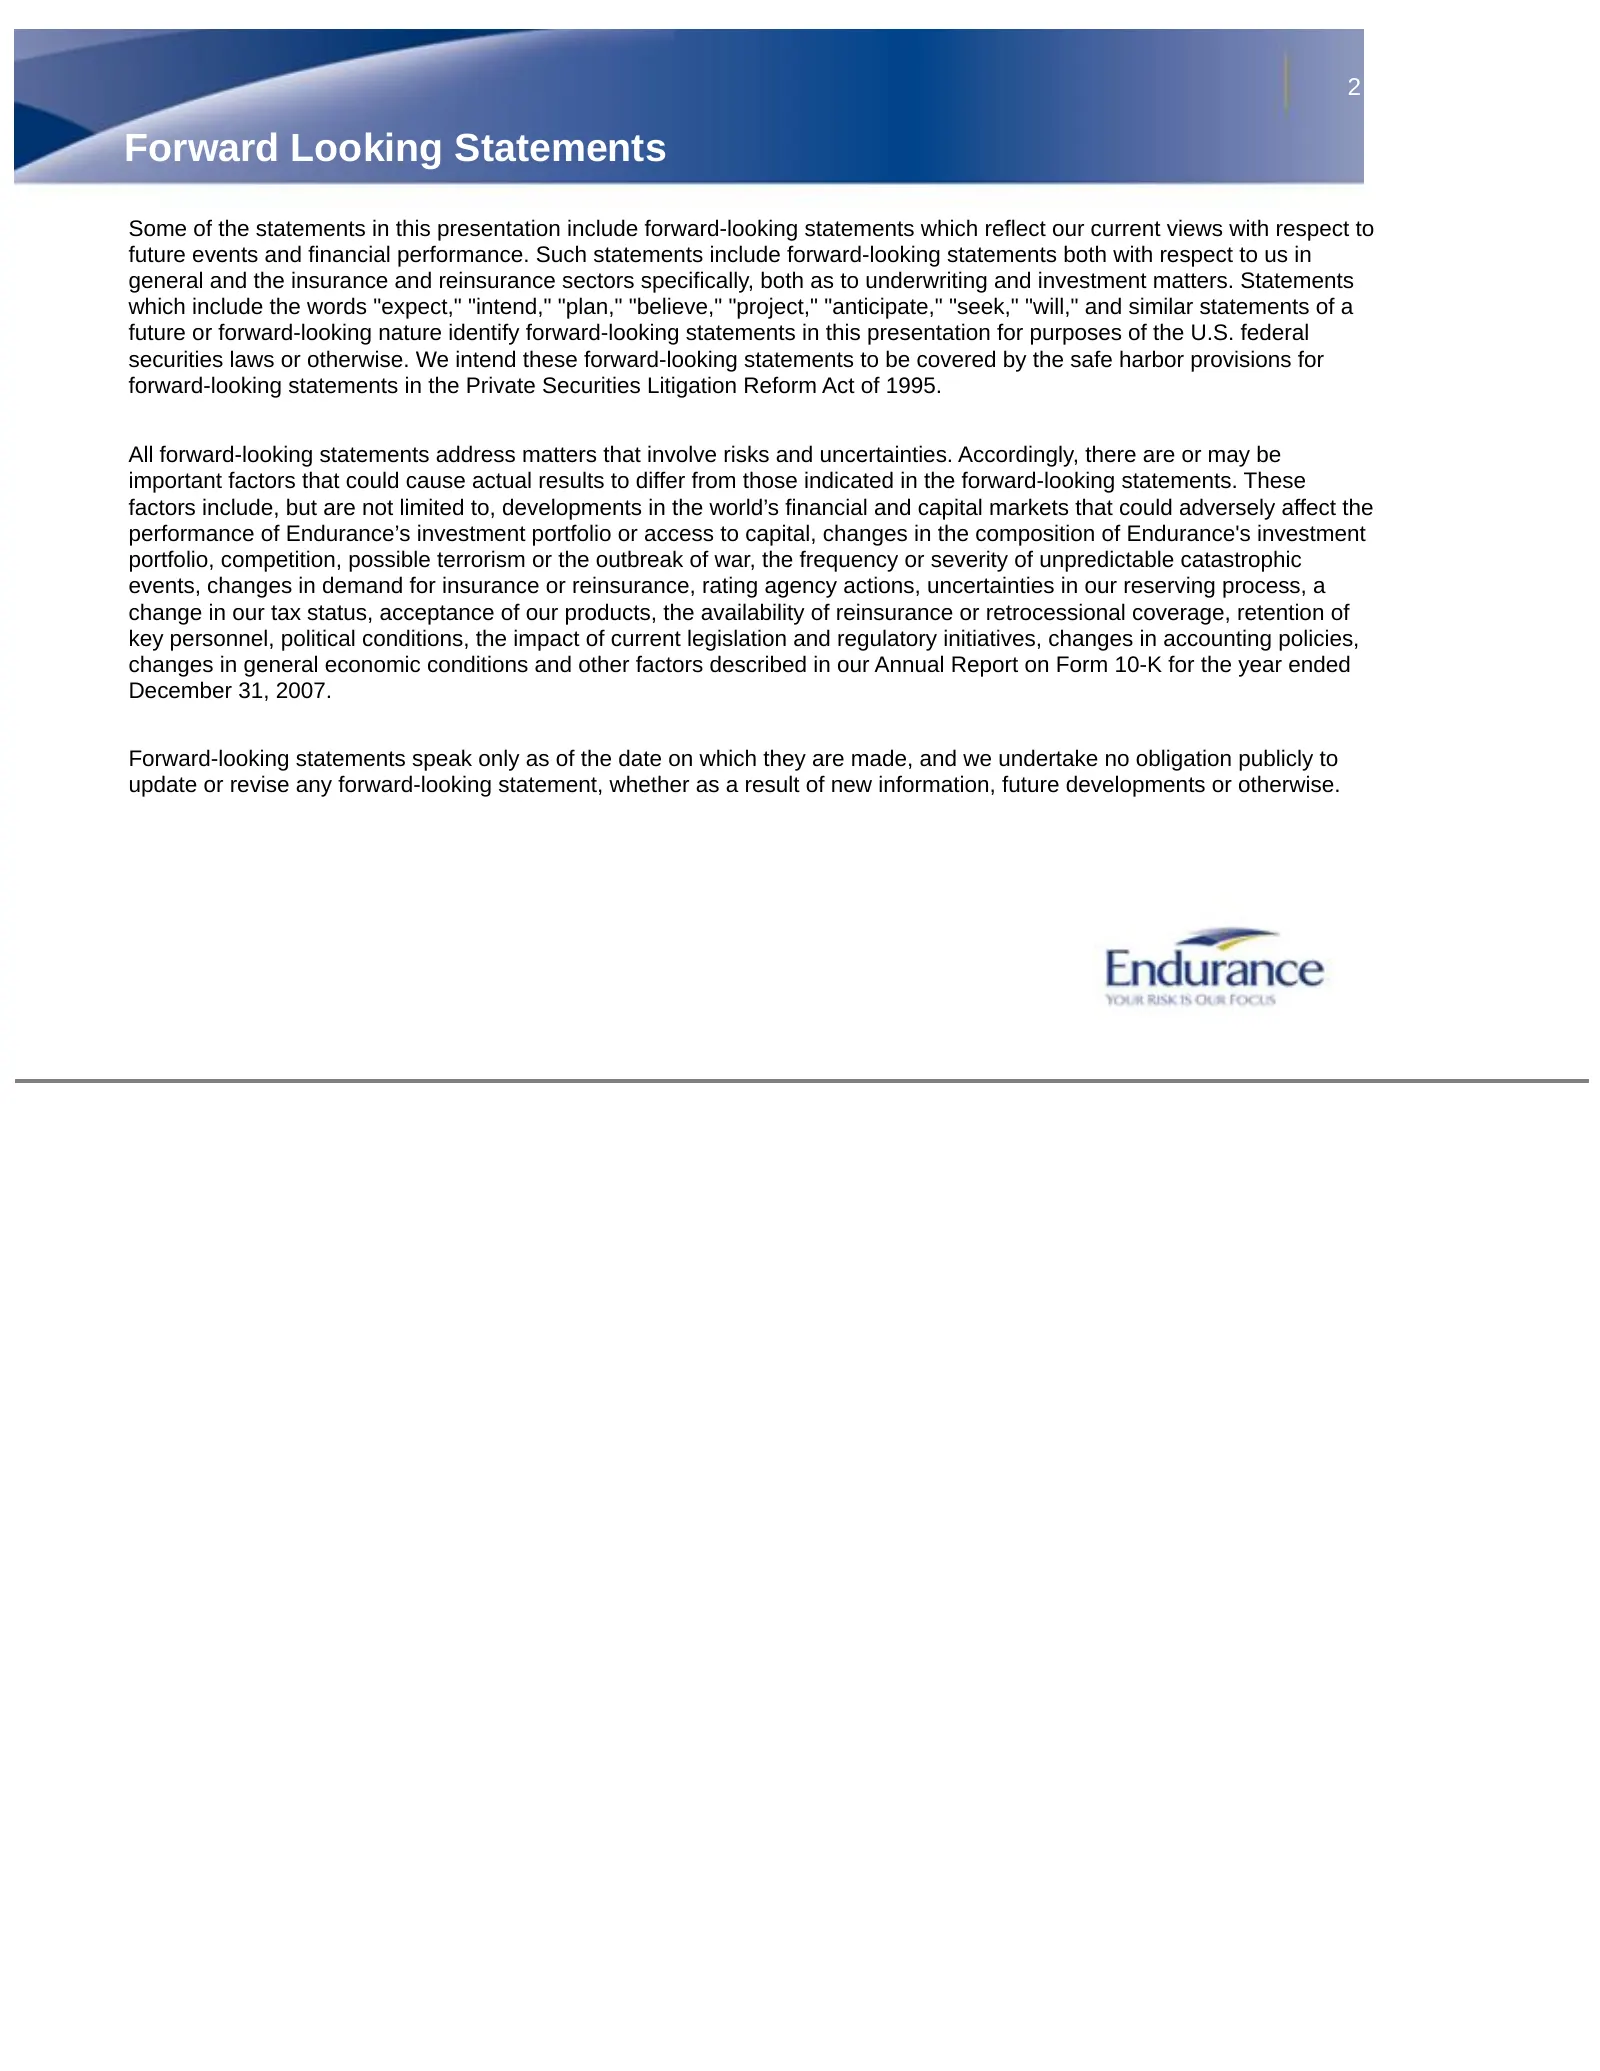
Slide 2: Forward Looking Statements
2 Forward Looking Statements Some of the statements in this presentation include forward-looking statements which reflect our current views with respect to future events and financial performance. Such statements include forward-looking statements both with respect to us in general and the insurance
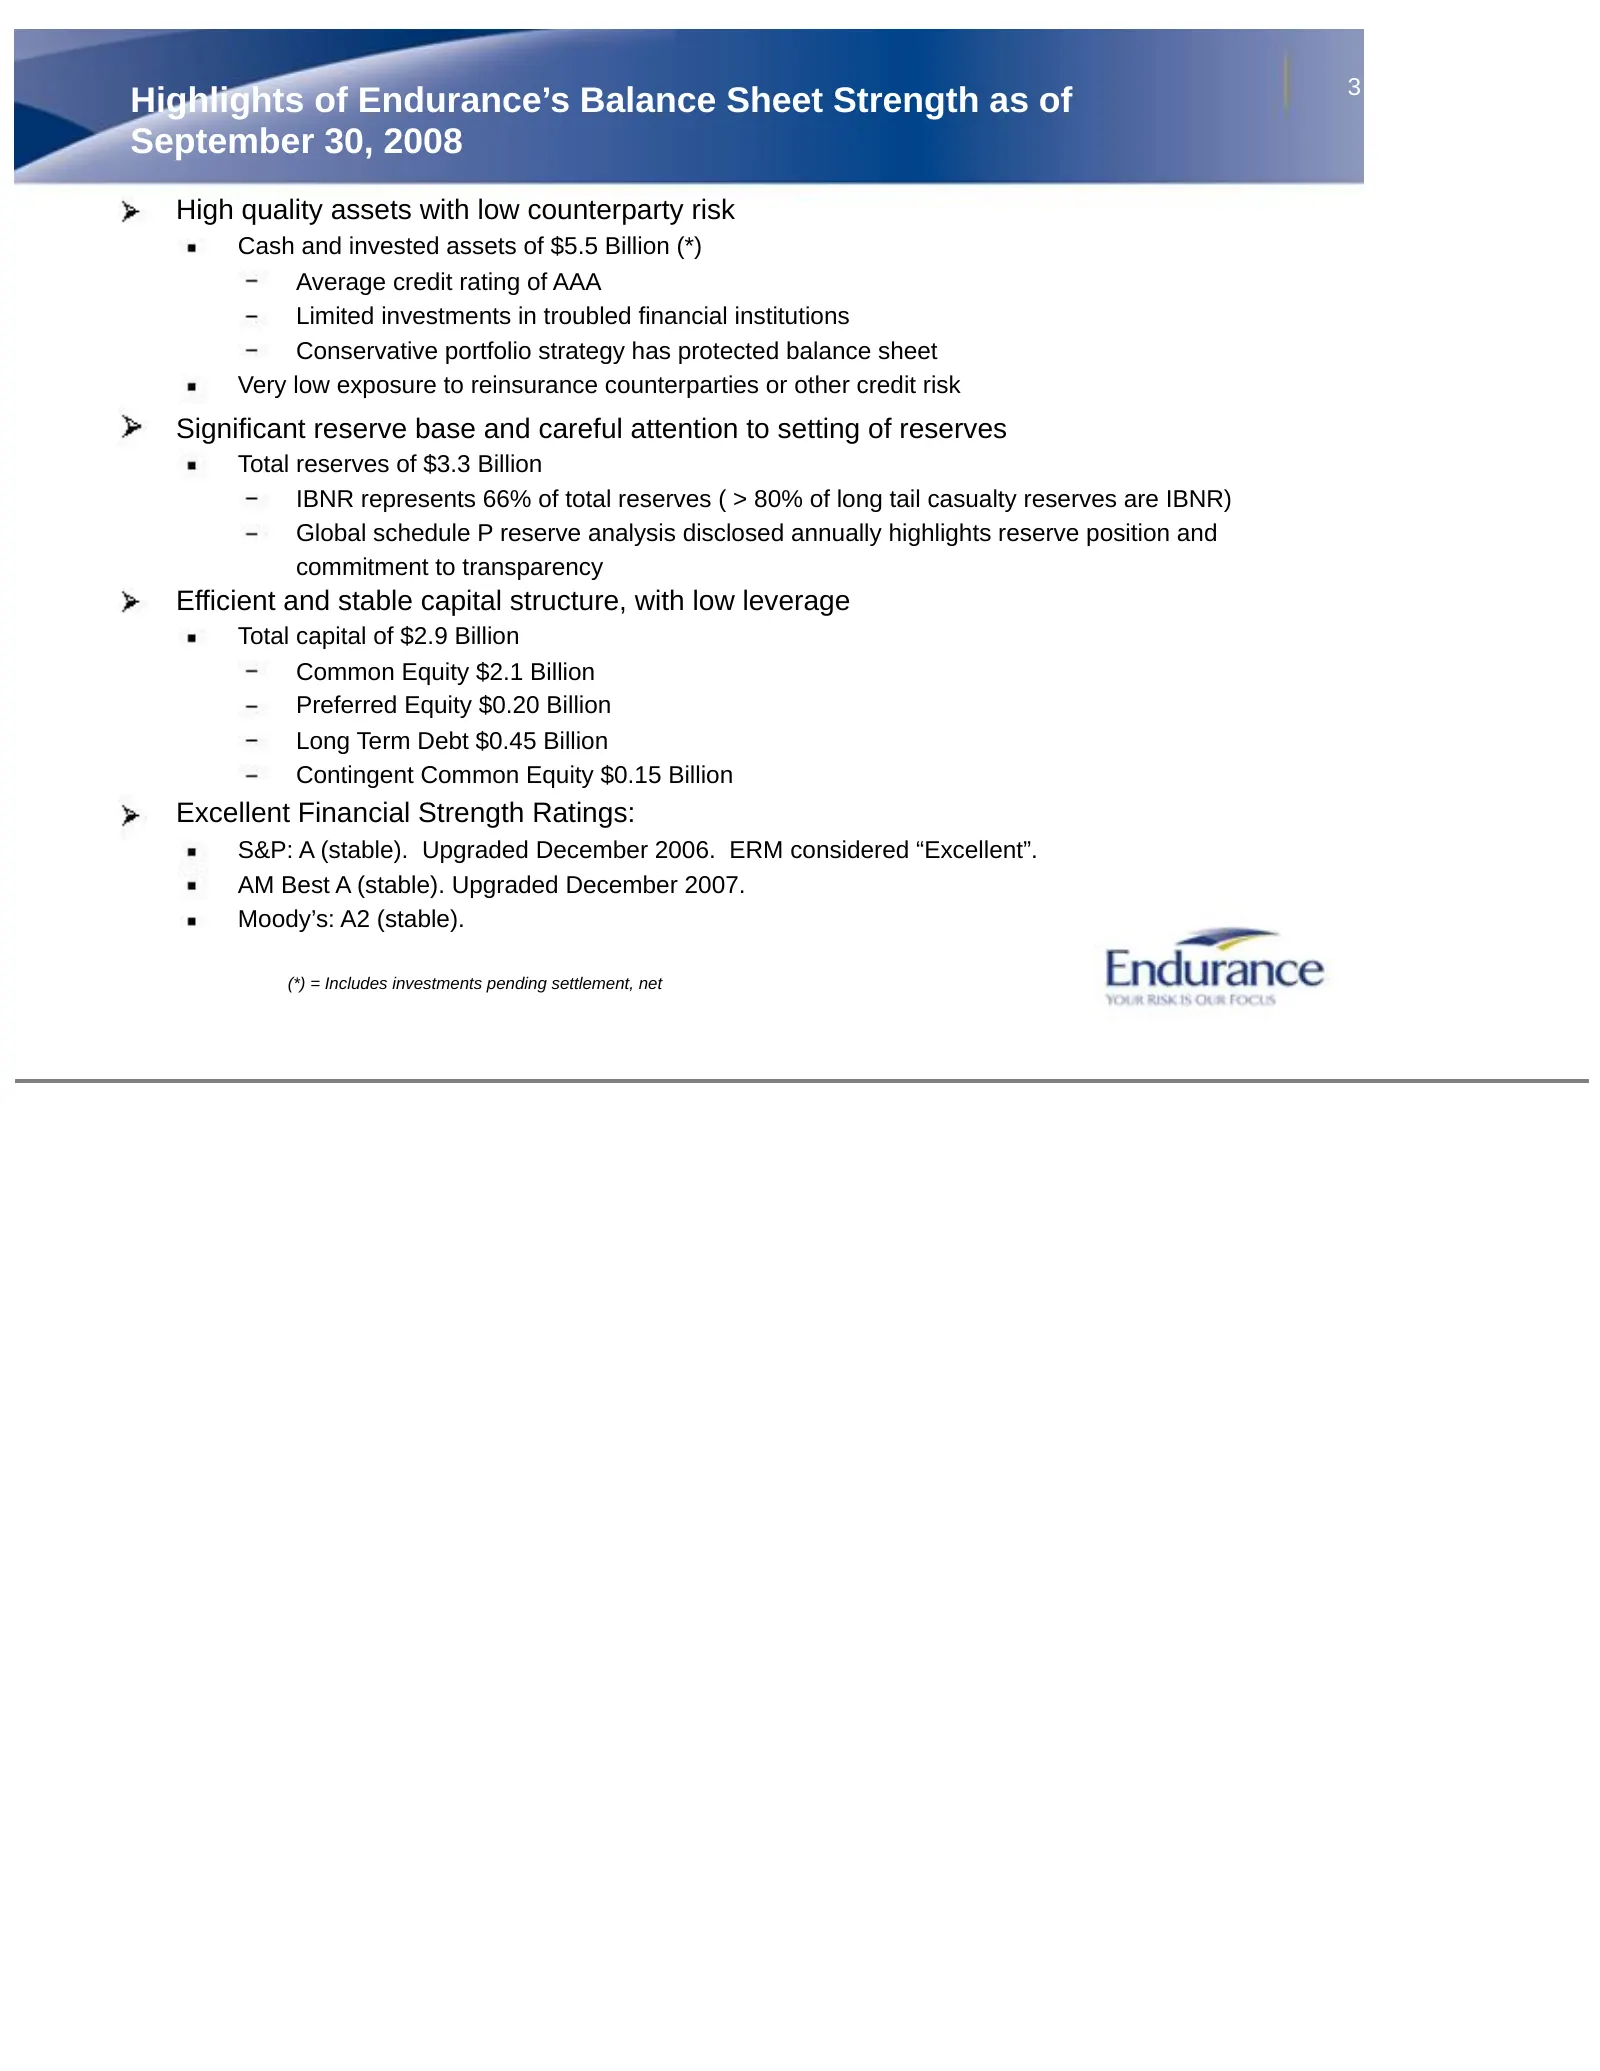
Slide 3: Highlights of Endurance's Balance Sheet Strength as of September 30, 2008
3 Highlights of Endurance’s Balance Sheet Strength as of September 30, 2008 High quality assets with low counterparty risk Cash and invested assets of $5.5 Billion (*) Average credit rating of AAA Limited investments in troubled financial institutions Conservative portfolio strategy has protected ba
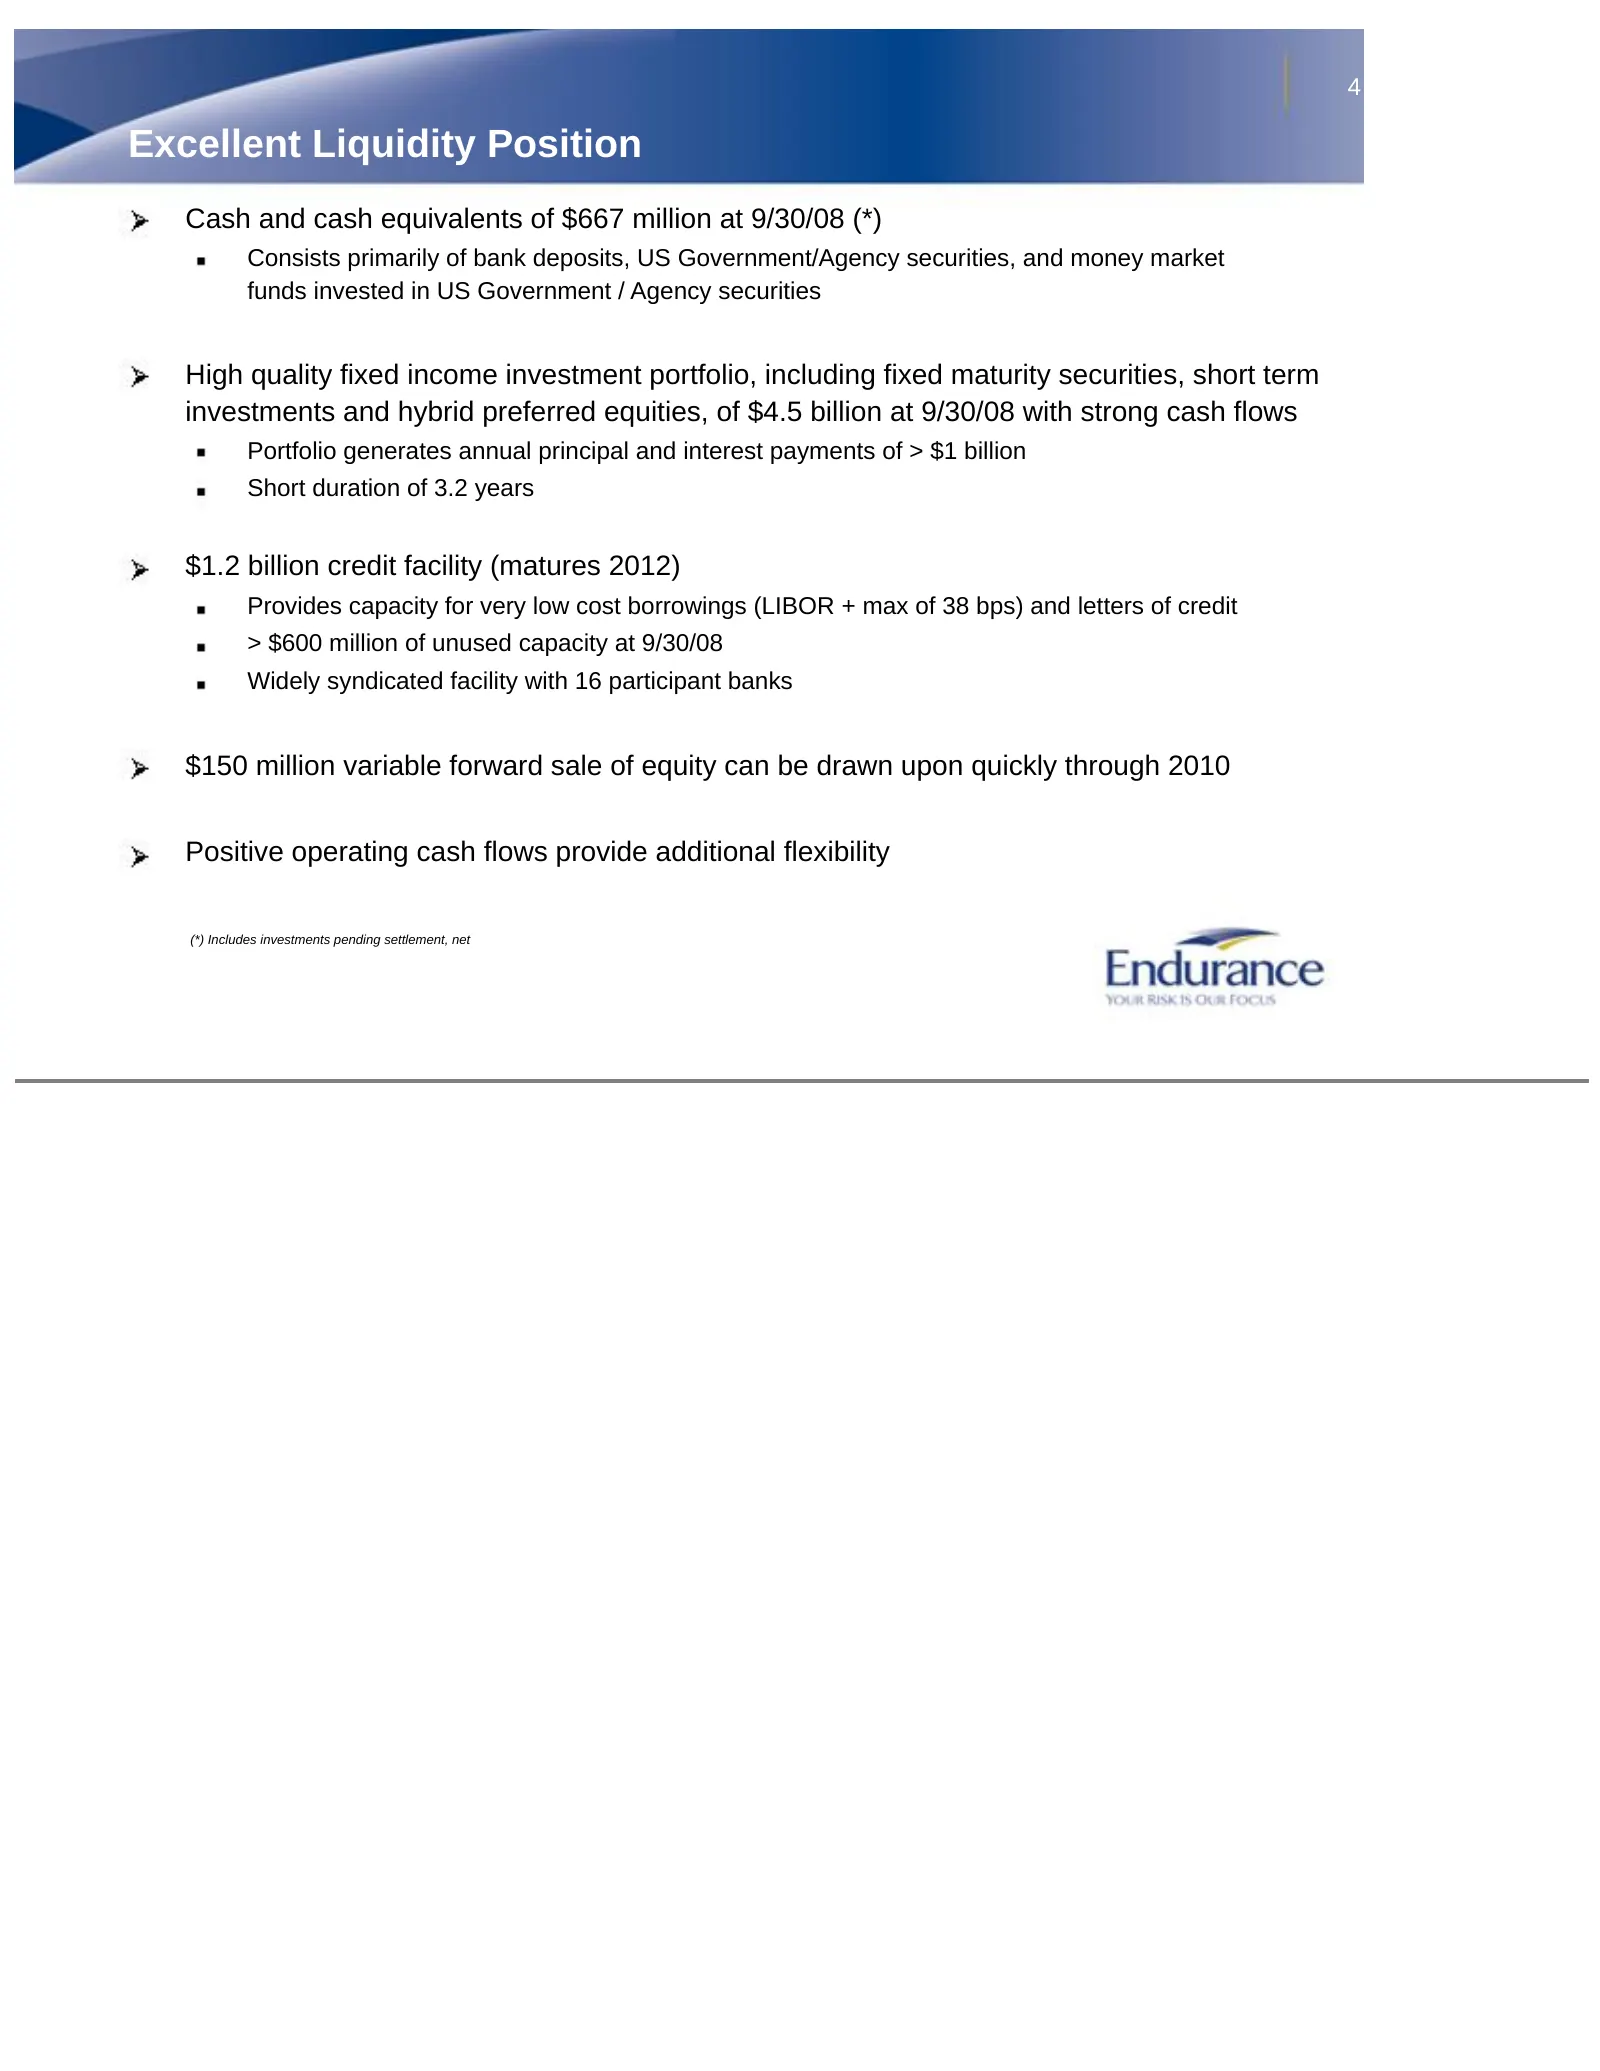
Slide 4: Excellent Liquidity Position
4 Excellent Liquidity Position Cash and cash equivalents of $667 million at 9/30/08 (*) Consists primarily of bank deposits, US Government/Agency securities, and money market funds invested in US Government / Agency securities High quality fixed income investment portfolio, including fixed maturity
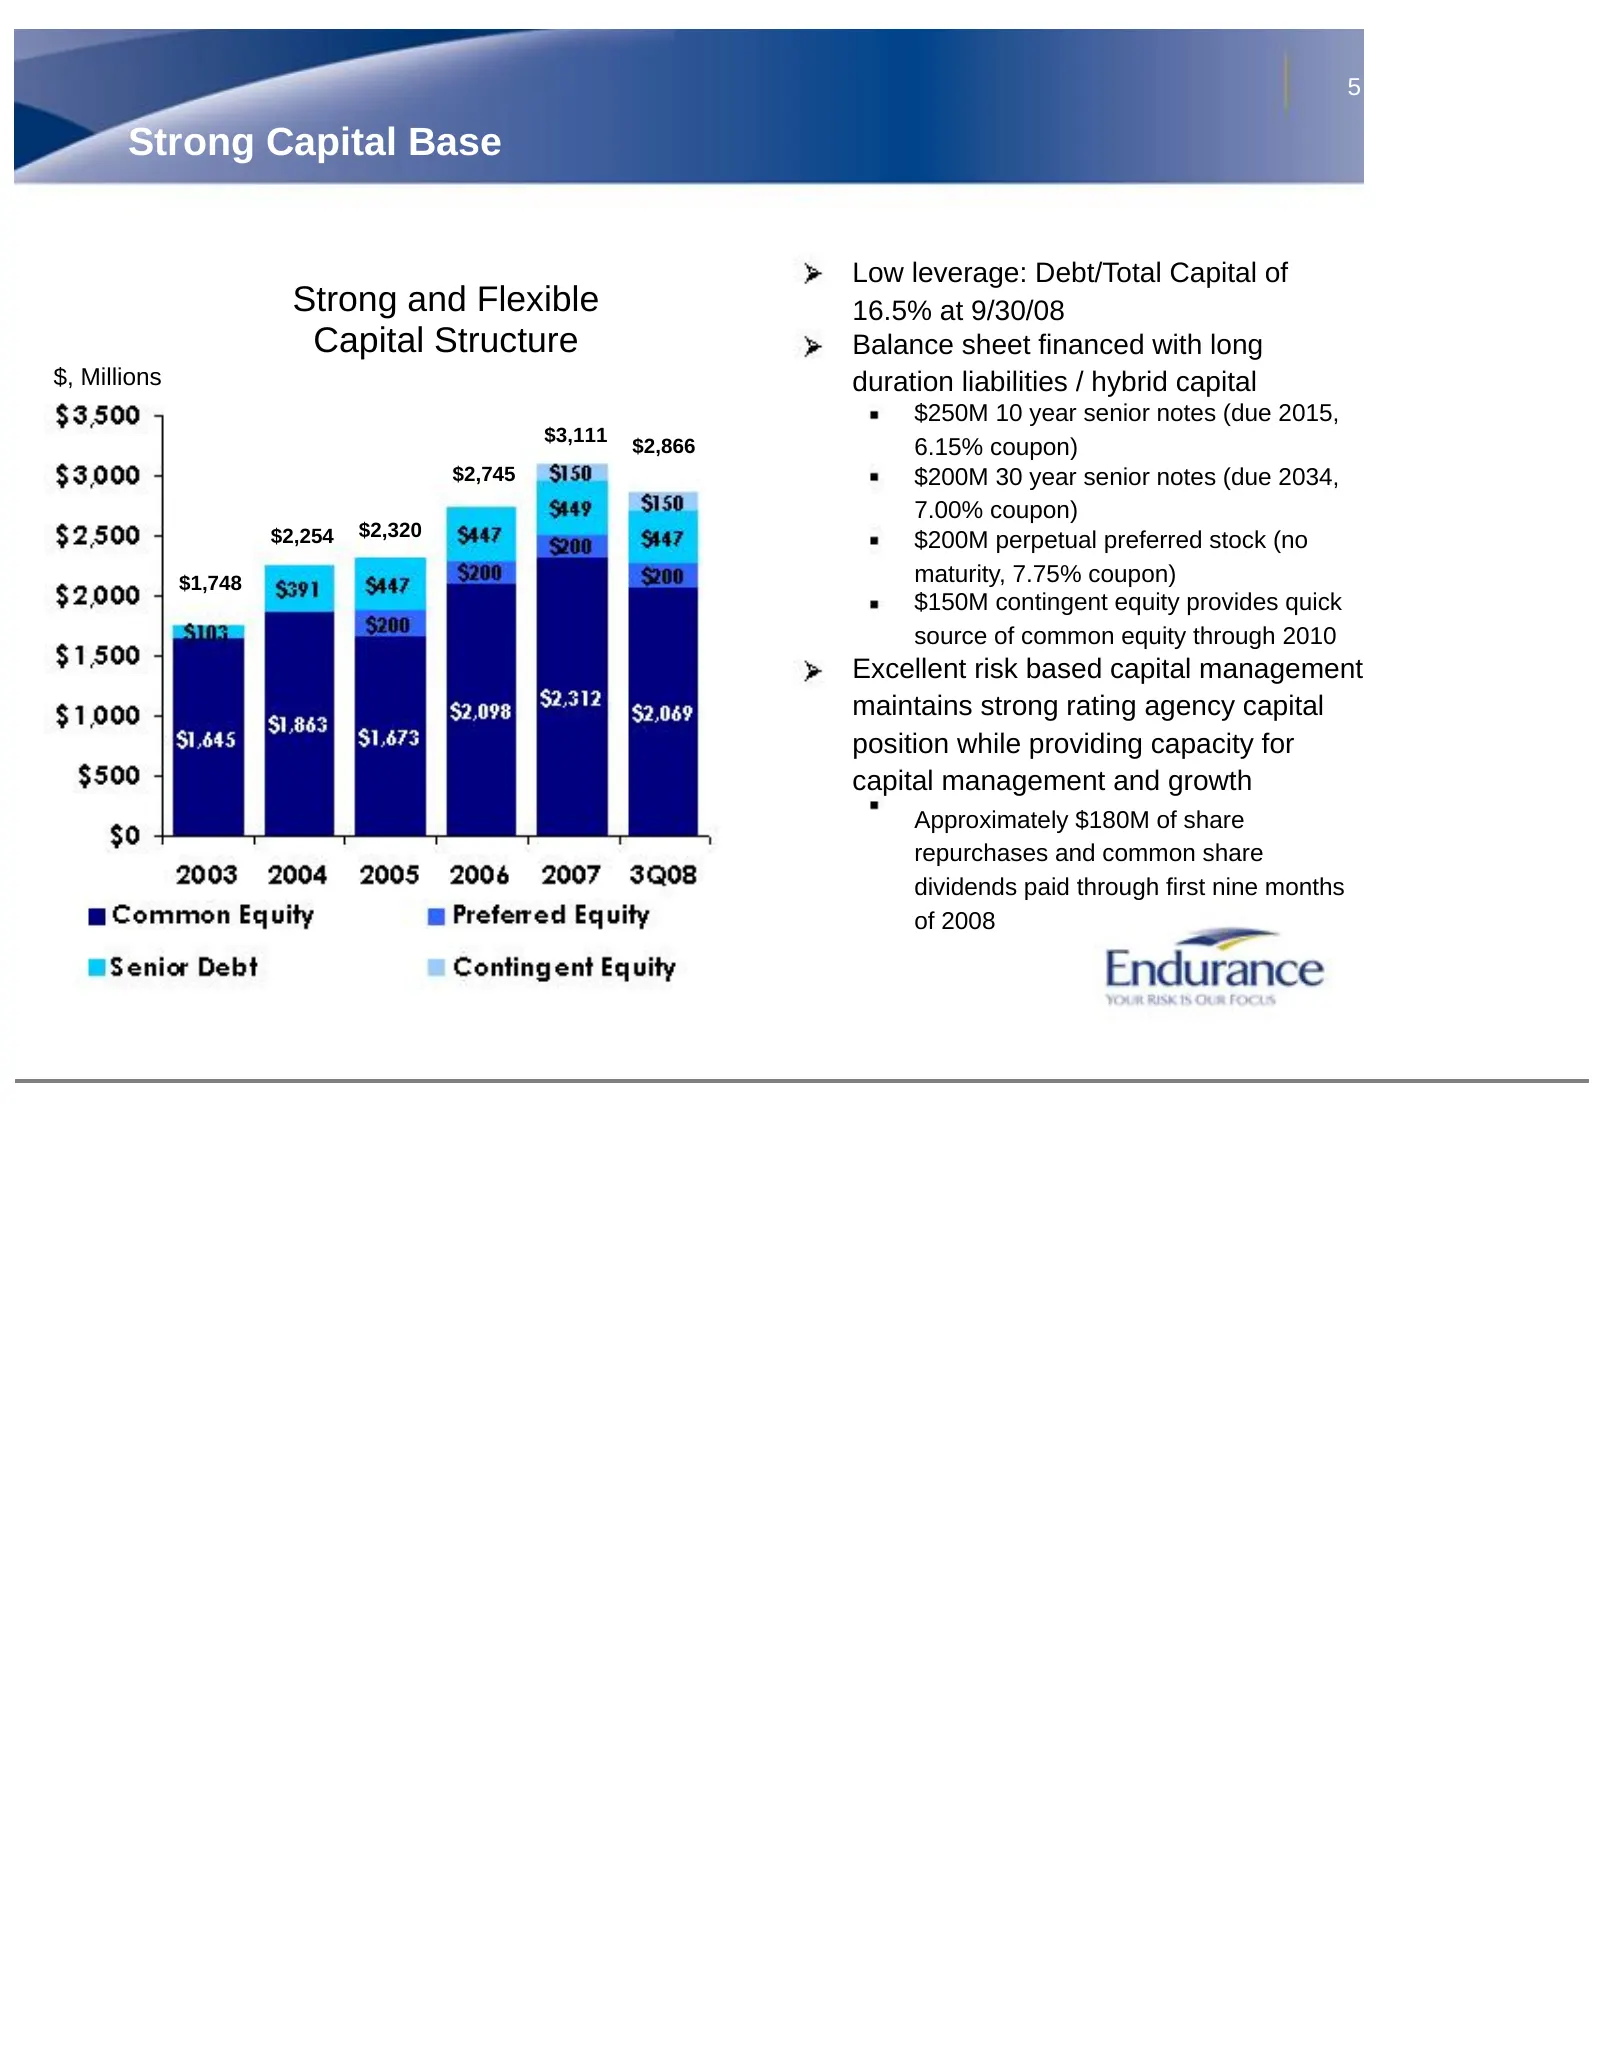
Slide 5: Strong and Flexible Capital Structure
5 Strong Capital Base Low leverage: Debt/Total Capital of Strong and Flexible 16.5% at 9/30/08 Capital Structure Balance sheet financed with long $, Millions duration liabilities / hybrid capital $250M 10 year senior notes (due 2015, $3,111 $2,866 6.15% coupon) $2,745 $200M 30 year senior notes (due
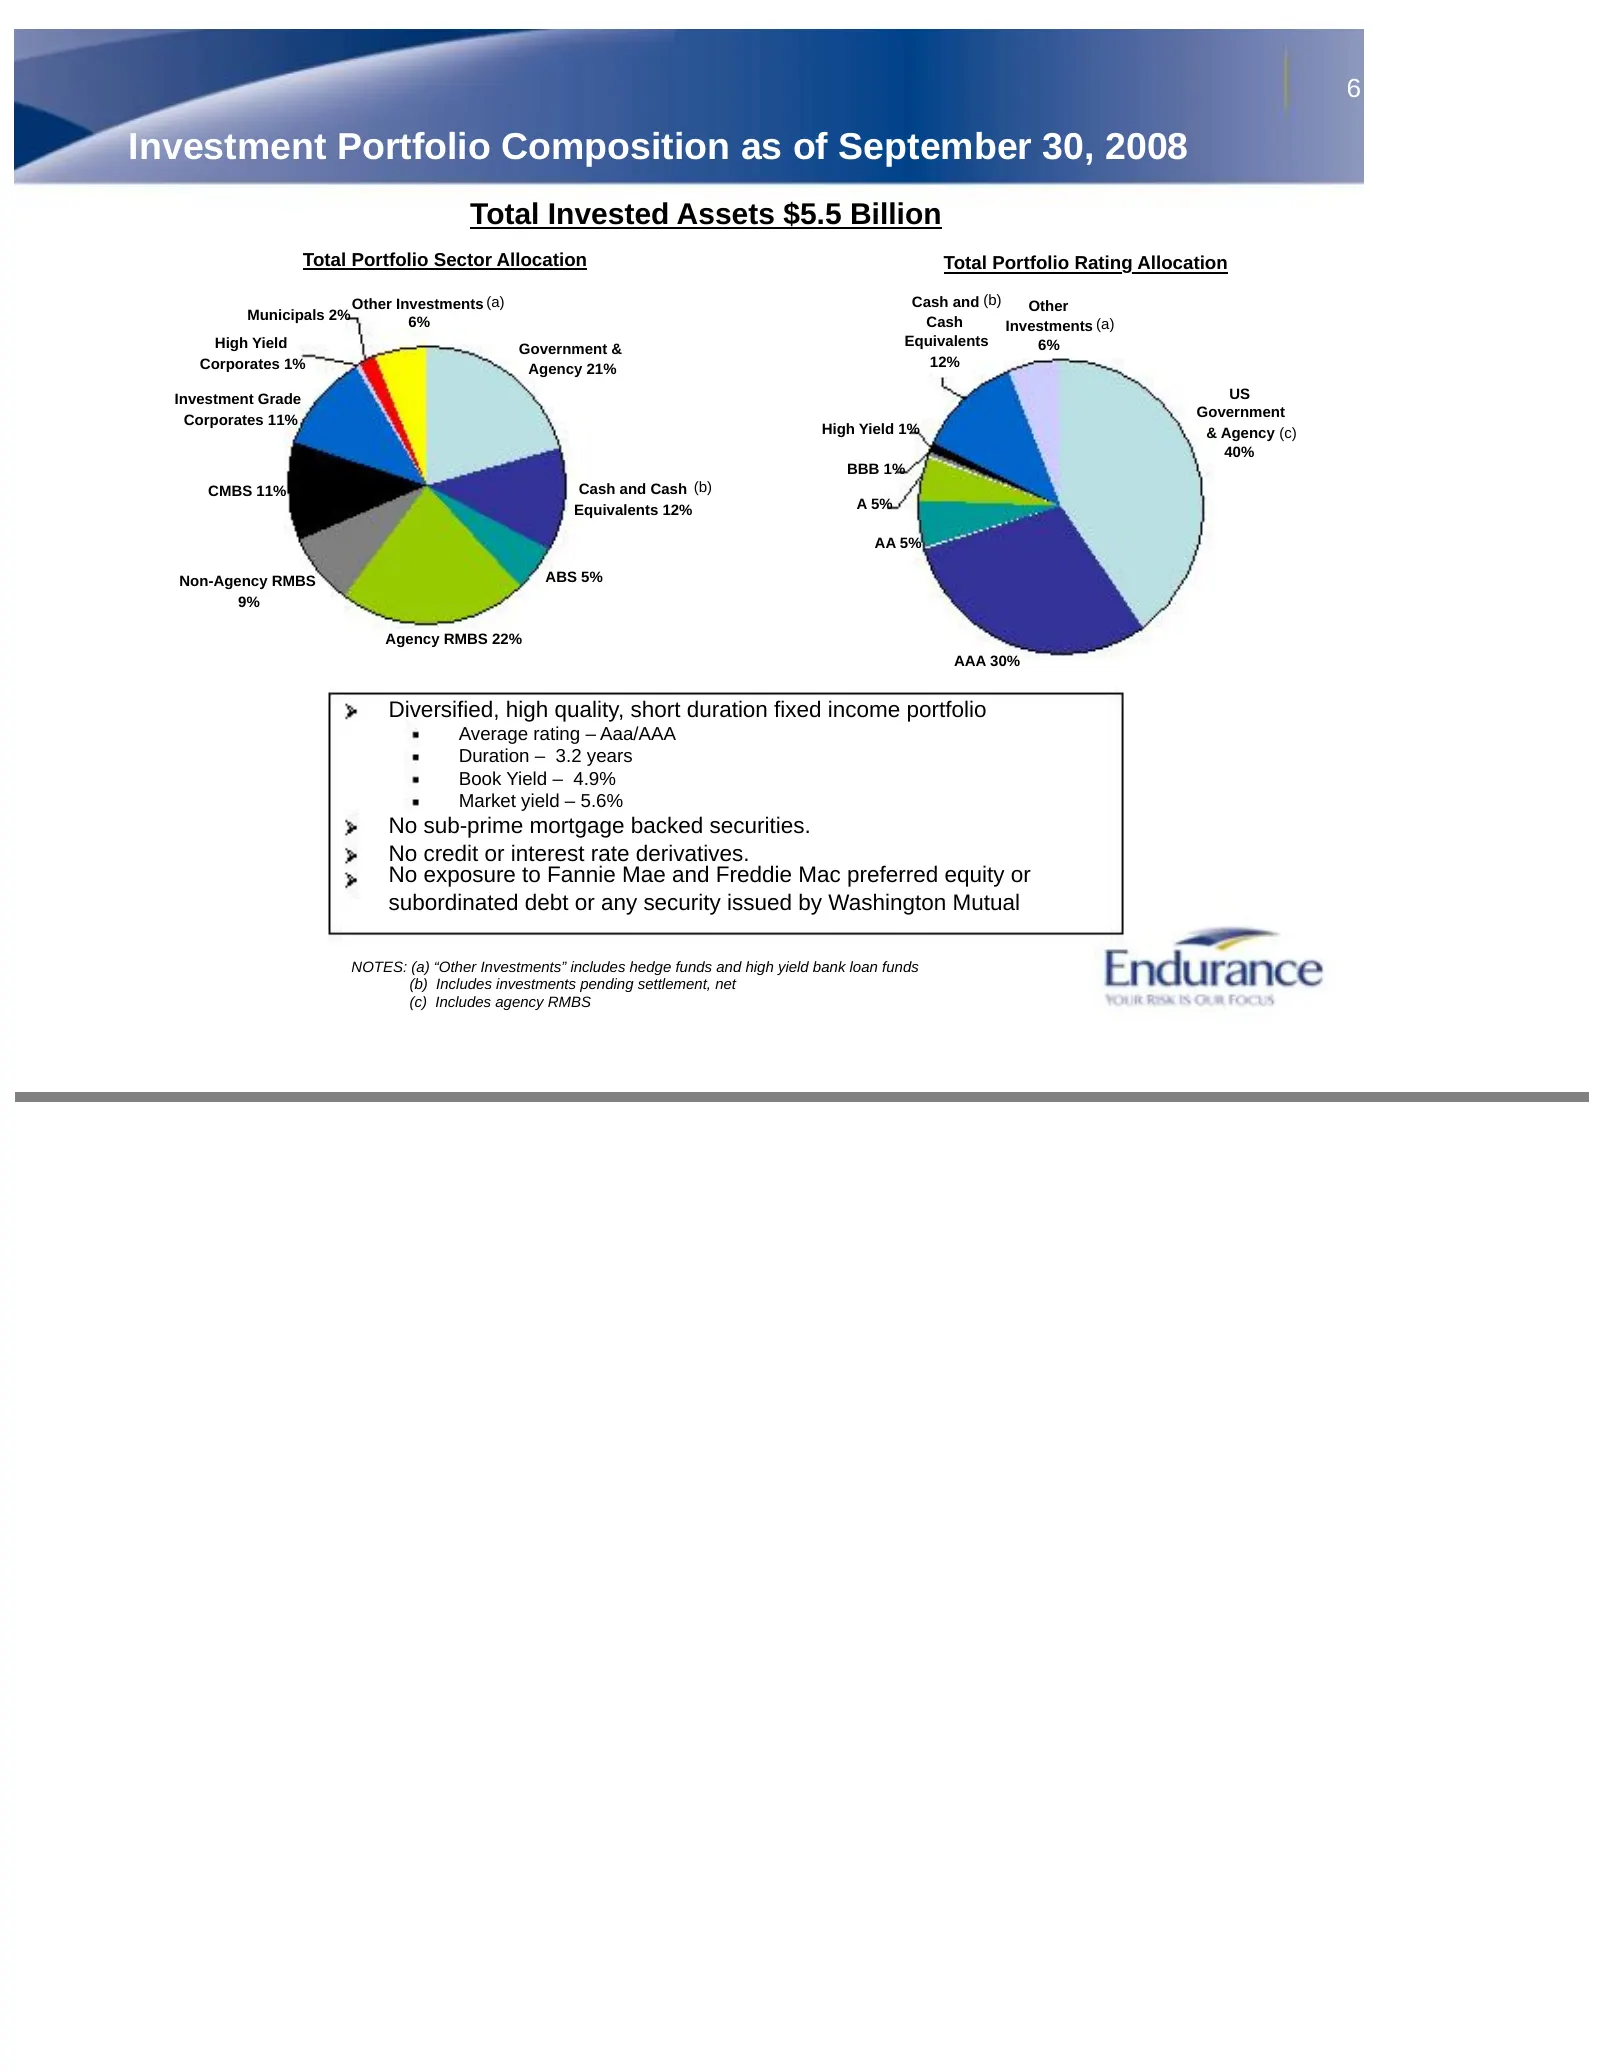
Slide 6: Investment Portfolio Composition as of September 30, 2008
6 Investment Portfolio Composition as of September 30, 2008 Total Invested Assets $5.5 Billion Total Portfolio Sector Allocation Total Portfolio Rating Allocation Other Investments (a) Cash and (b) Other Municipals 2% 6% Cash Investments (a) High Yield Equivalents 6% Government & Corporates 1% Agenc
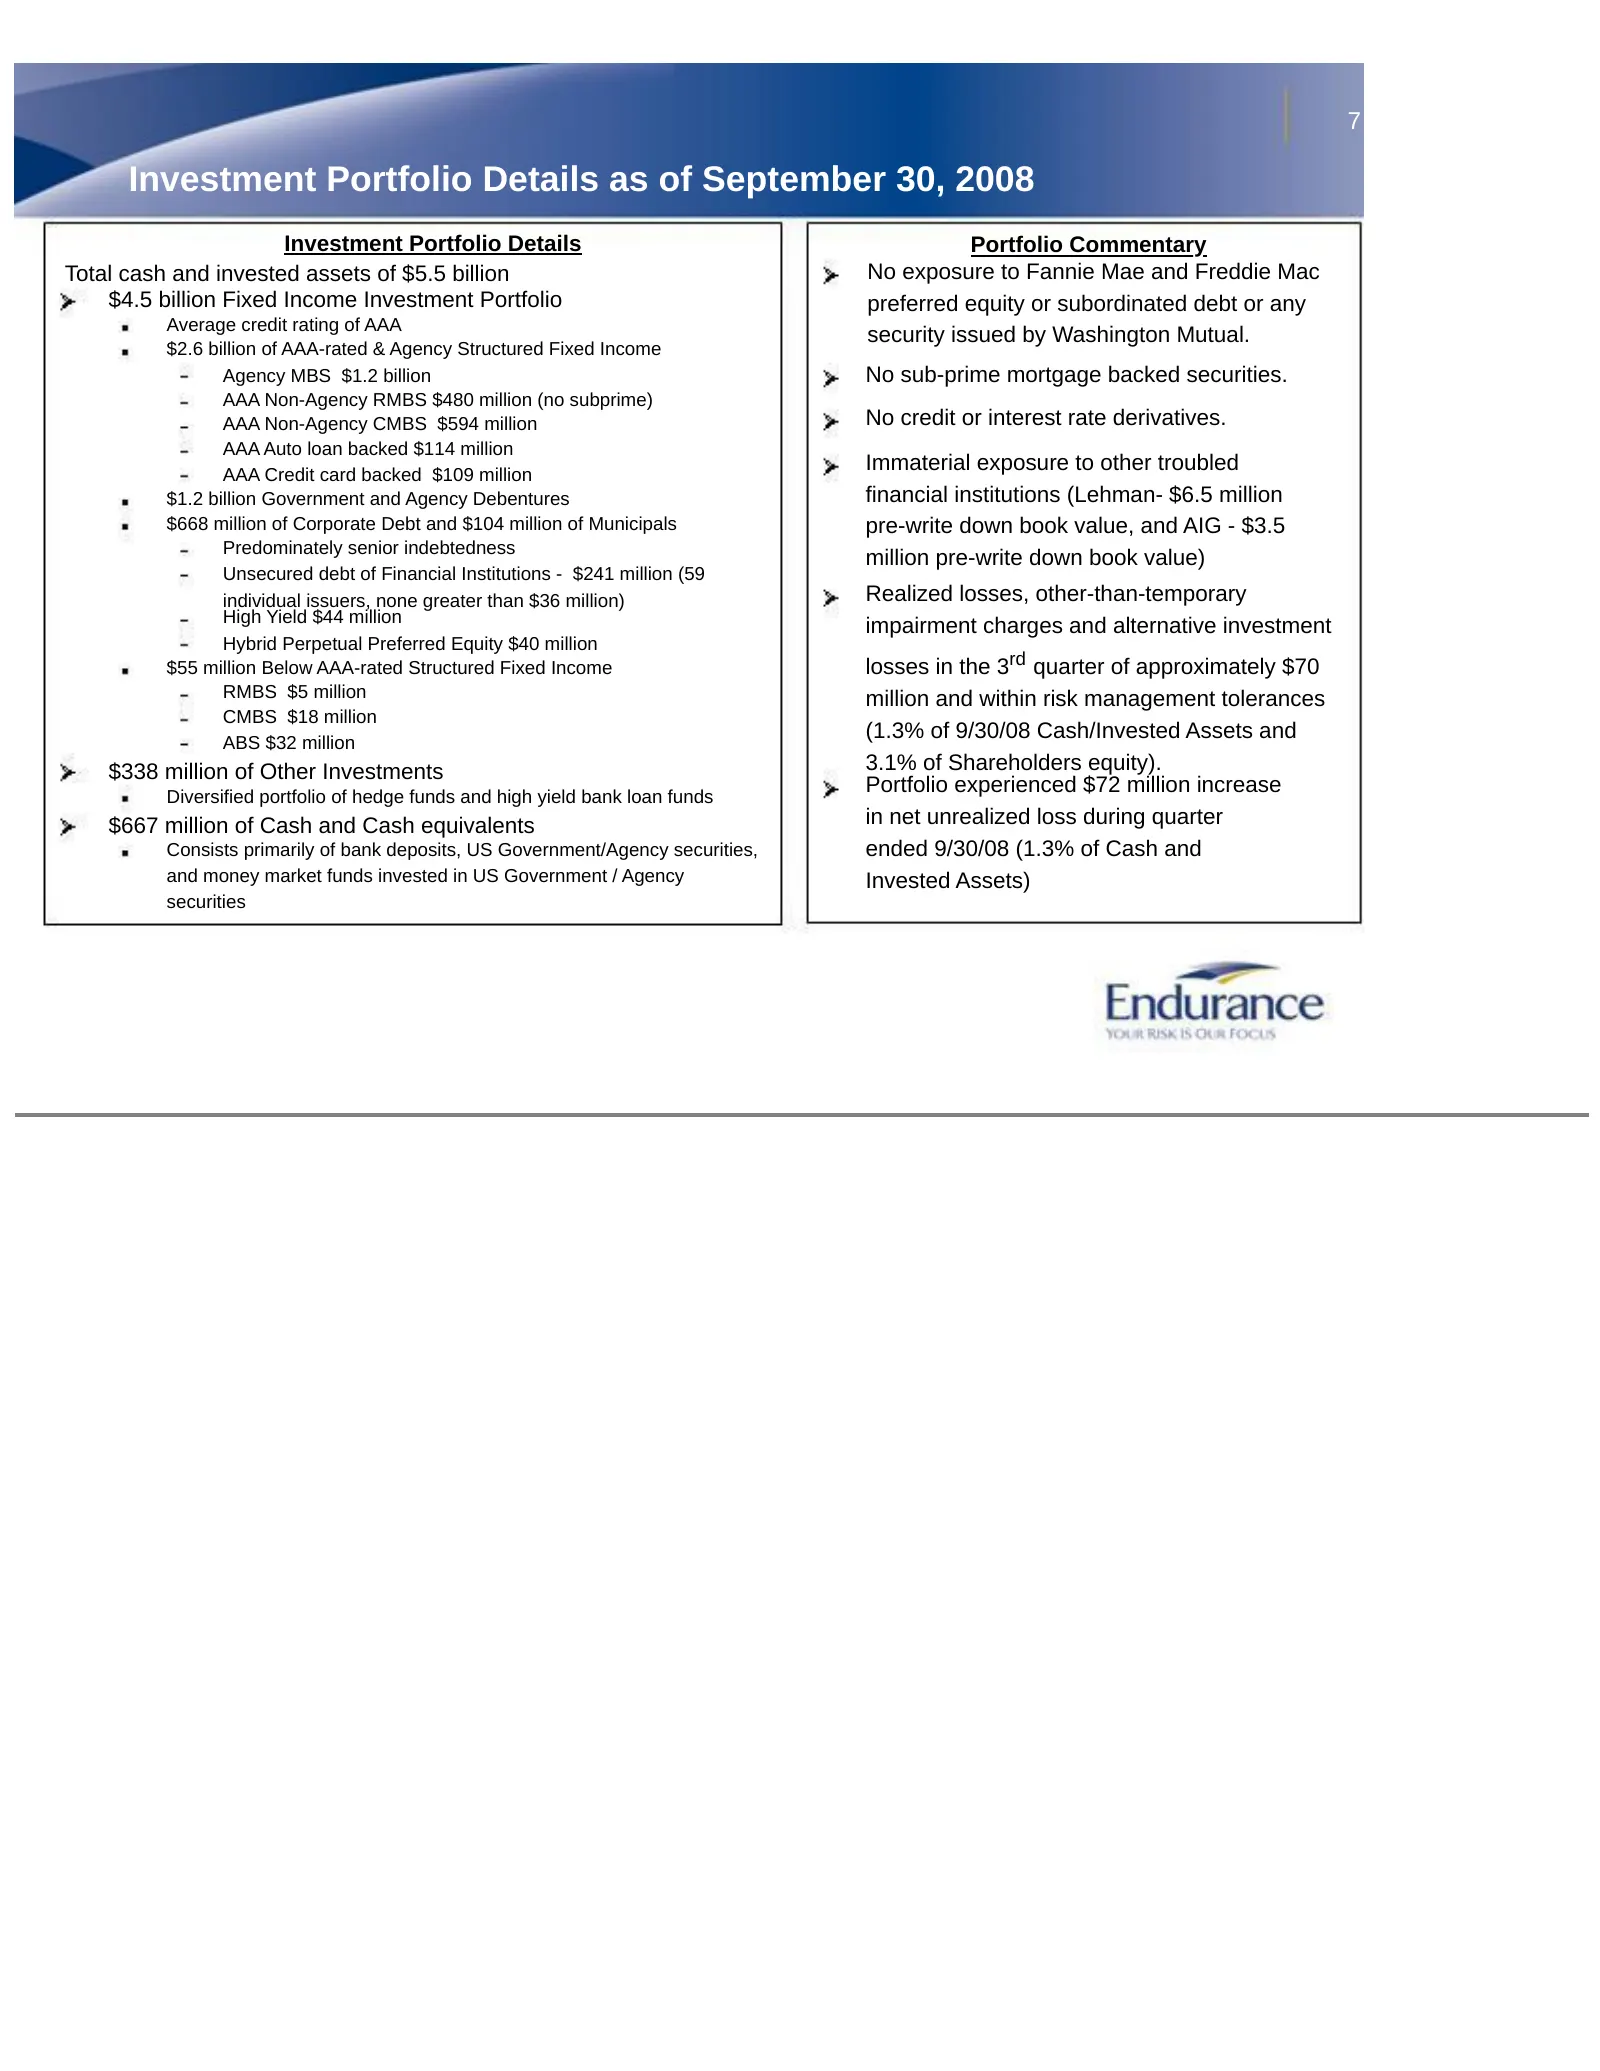
Slide 7: Investment Portfolio Details as of September 30, 2008
7 Investment Portfolio Details as of September 30, 2008 Investment Portfolio Details Portfolio Commentary Total cash and invested assets of $5.5 billion No exposure to Fannie Mae and Freddie Mac $4.5 billion Fixed Income Investment Portfolio preferred equity or subordinated debt or any Average credi
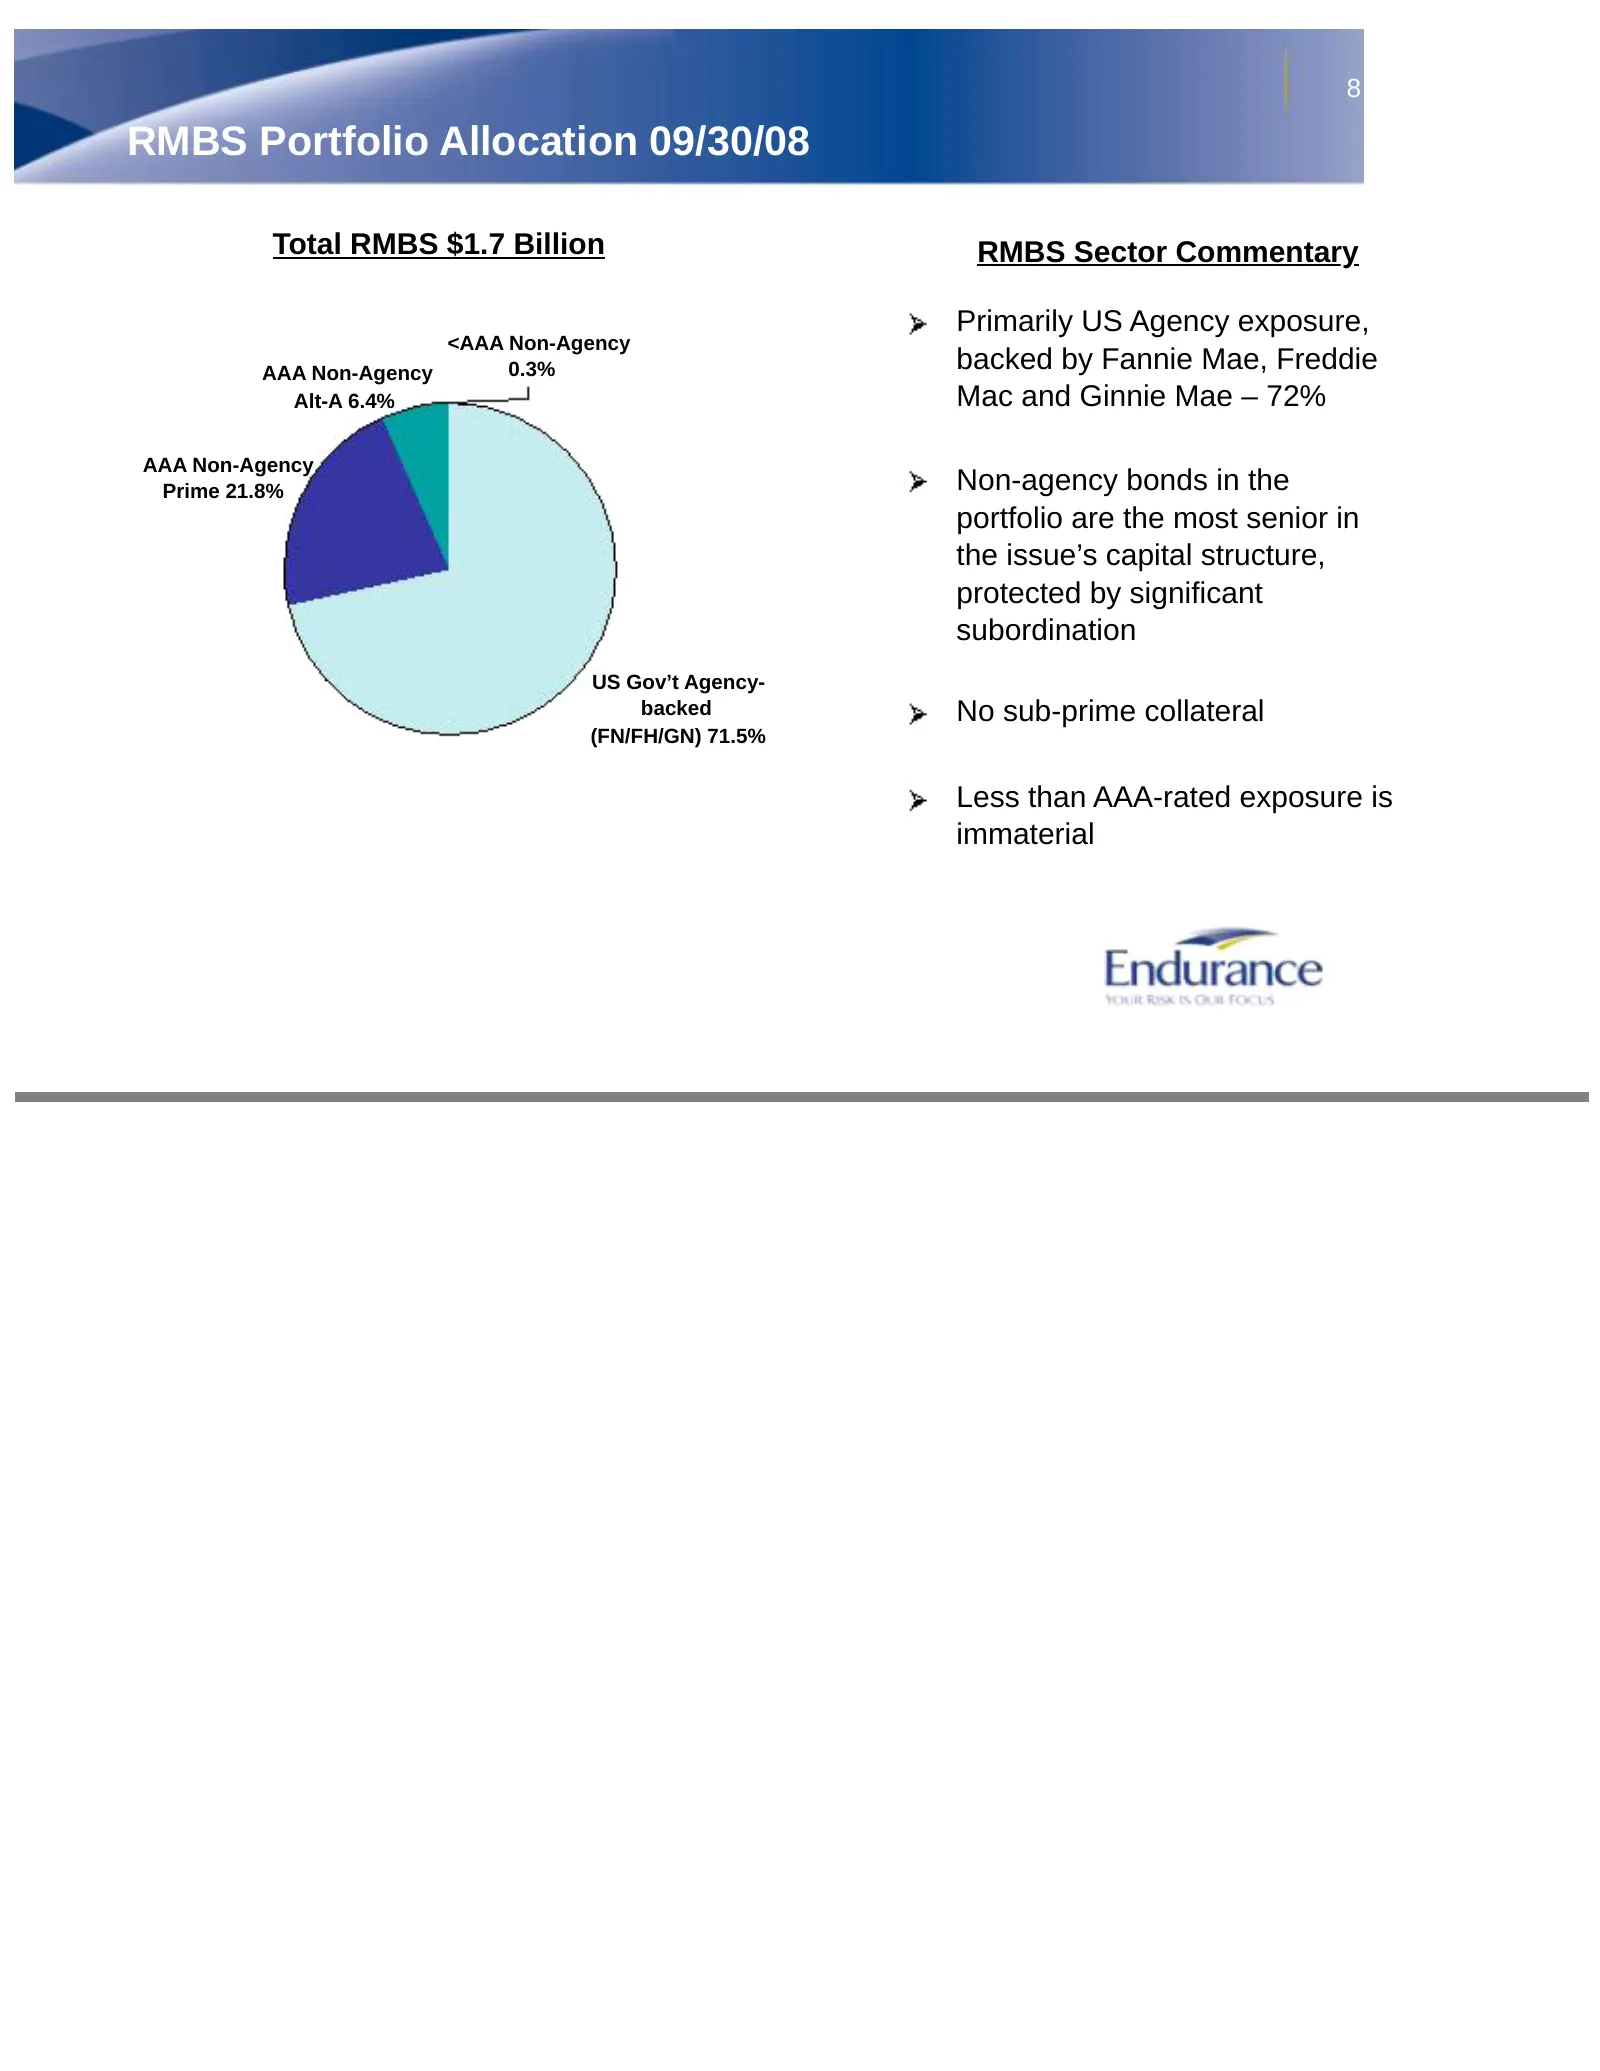
Slide 8: RMBS Portfolio Allocation 09/30/08
8 RMBS Portfolio Allocation 09/30/08 Total RMBS $1.7 Billion RMBS Sector Commentary Primarily US Agency exposure, <AAA Non-Agency AAA Non-Agency 0.3% backed by Fannie Mae, Freddie Alt-A 6.4% Mac and Ginnie Mae – 72% AAA Non-Agency Prime 21.8% Non-agency bonds in the portfolio are the most senior in
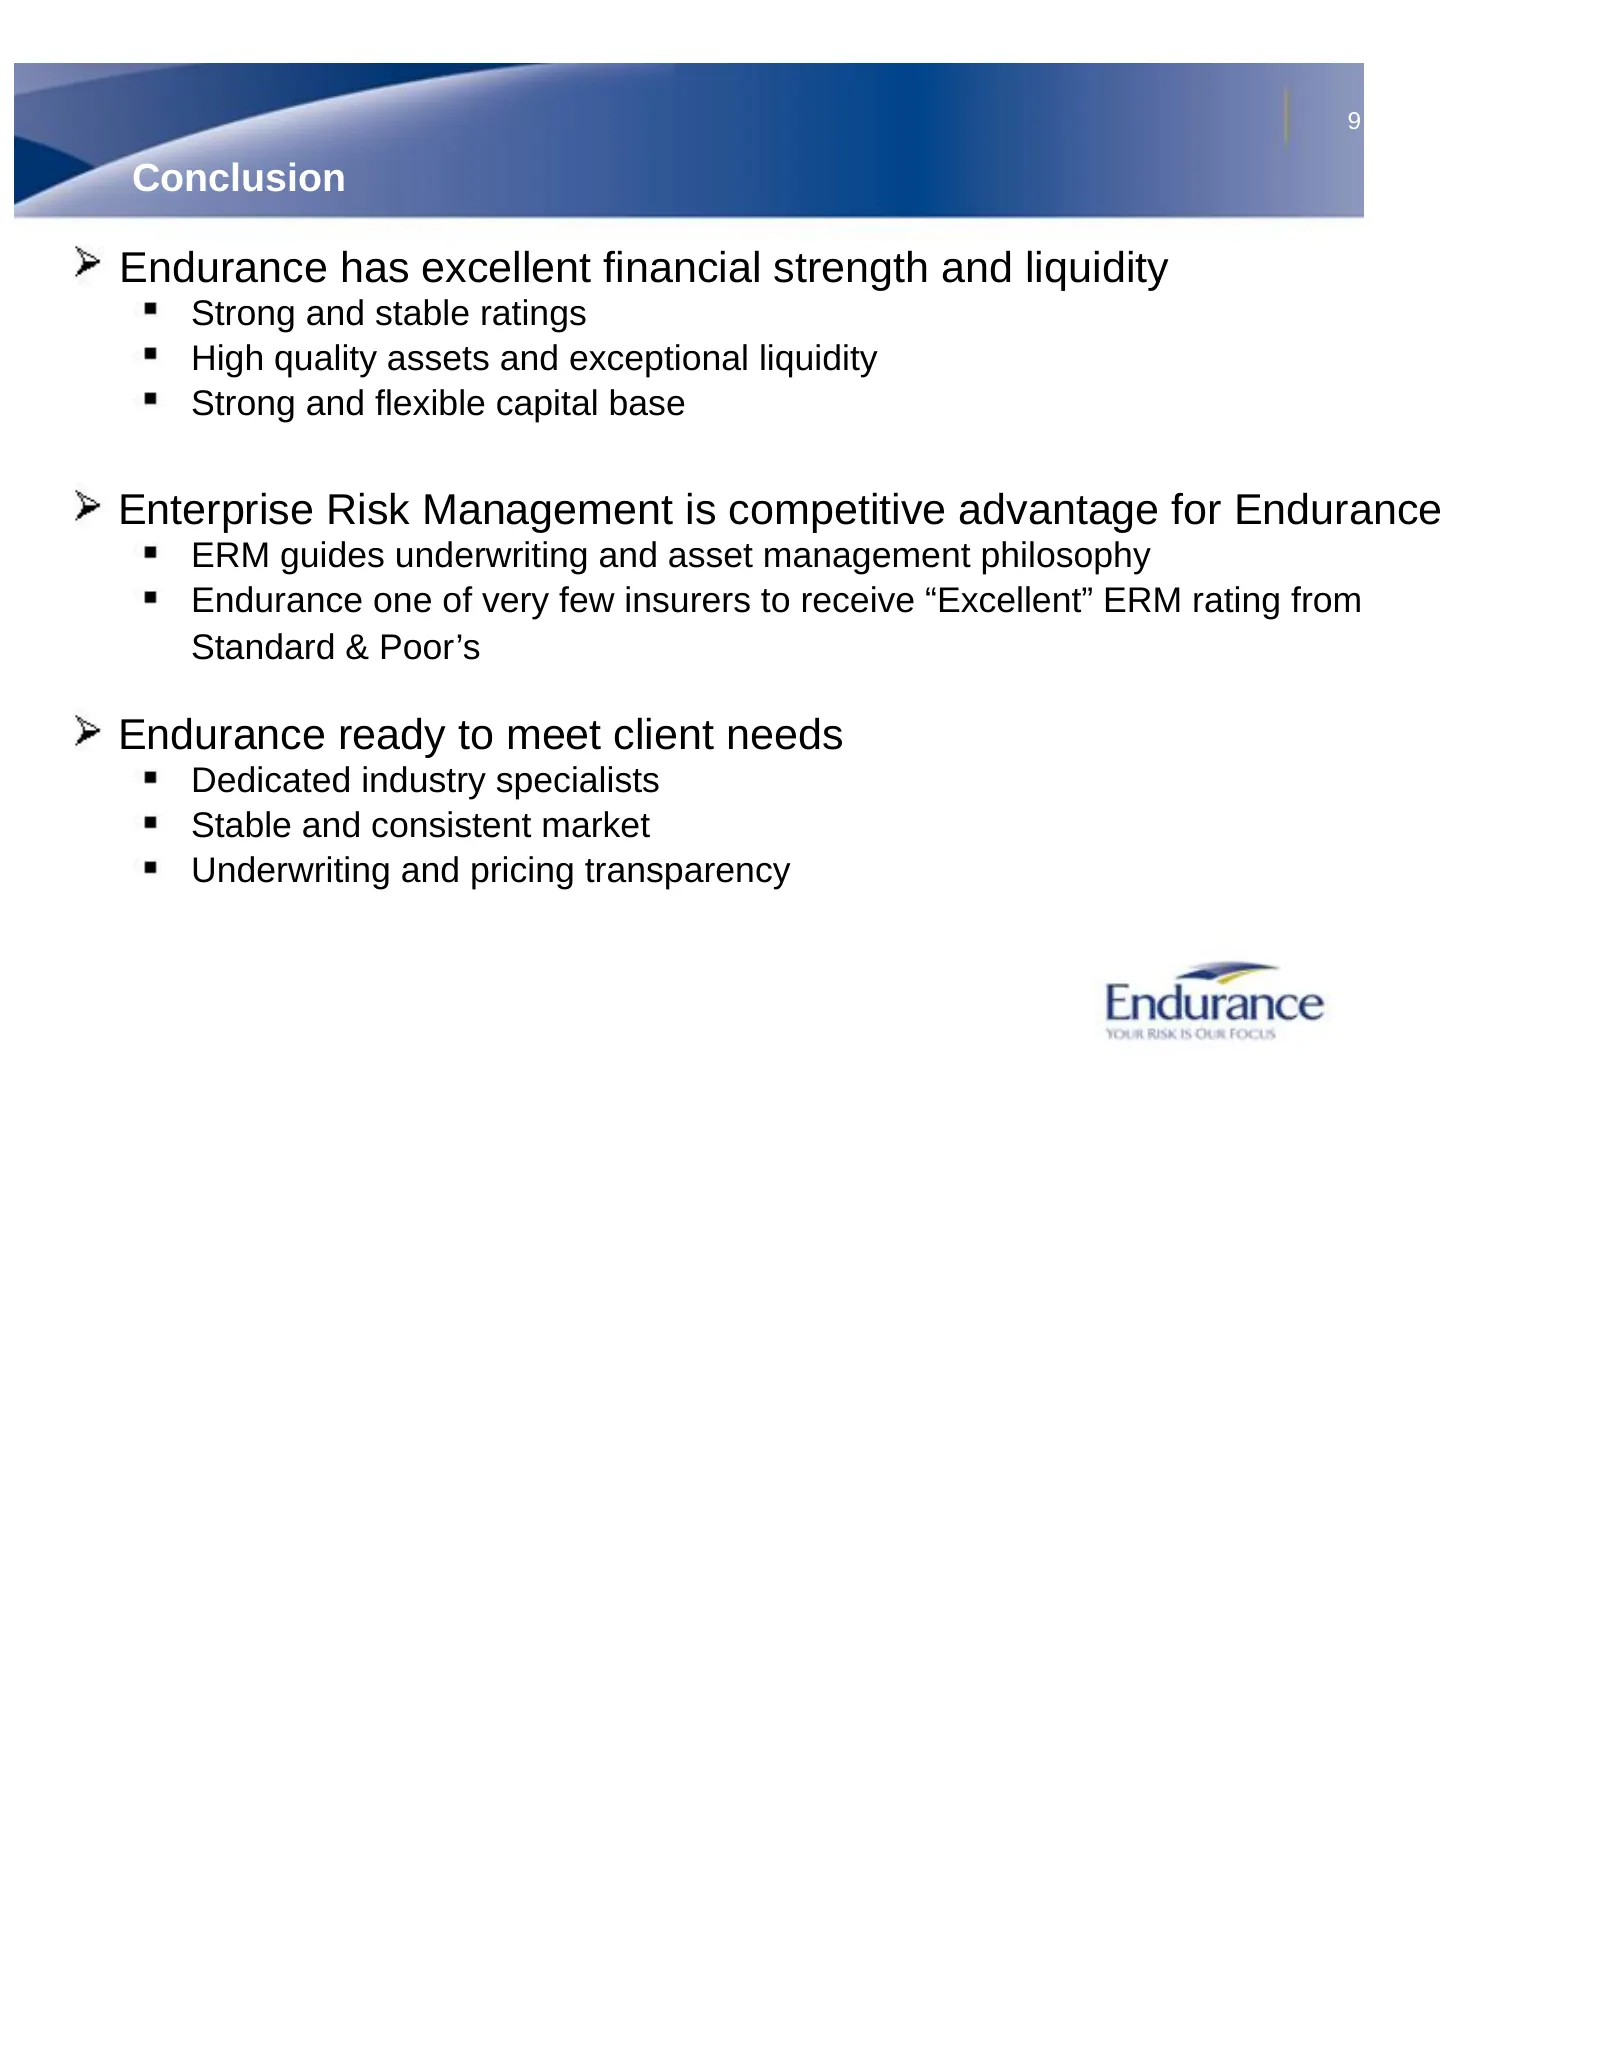
Slide 9: Conclusion
9 Conclusion Endurance has excellent financial strength and liquidity Strong and stable ratings High quality assets and exceptional liquidity Strong and flexible capital base Enterprise Risk Management is competitive advantage for Endurance ERM guides underwriting and asset management philosophy End
Source: SEC EDGAR · 8-K filed Nov 25, 2008
More decks from Endurance Specialty Holdings Ltd
 Merger or Acquisition (October 2016)17 slides · Oct 12, 2016
 Investor Presentation (August 2016)29 slides · Aug 9, 2016
 Investor Presentation (May 2016)28 slides · May 10, 2016
 Investor Presentation (February 2016)29 slides · Feb 9, 2016
 Investor Presentation (February 2015)28 slides · Feb 11, 2015
 Merger or Acquisition (April 2014)22 slides · Apr 14, 2014