Aedifica SA · EURONEXT:AED
Aedifica SA — Q3 2026 Earnings Presentation
77 slides from Aedifica SA's earnings presentation, Nov 18, 2026
Slide 1: Q3 2026 results
Q3 2026 results Brussels, 18 November 2026 -1-

Slide 2: Table of content
Table of content 3 Highlights Q3 2026 7 Strategy 12 Achievements 14 Portfolio analysis 27 Financials 38 Shares & shareholders 40 Outlook 43 Conclusion -2-
Slide 3: Highlights Q3 2026
Highlights Q3 2026 Maison Neo, Rocourt – -3- Belgium
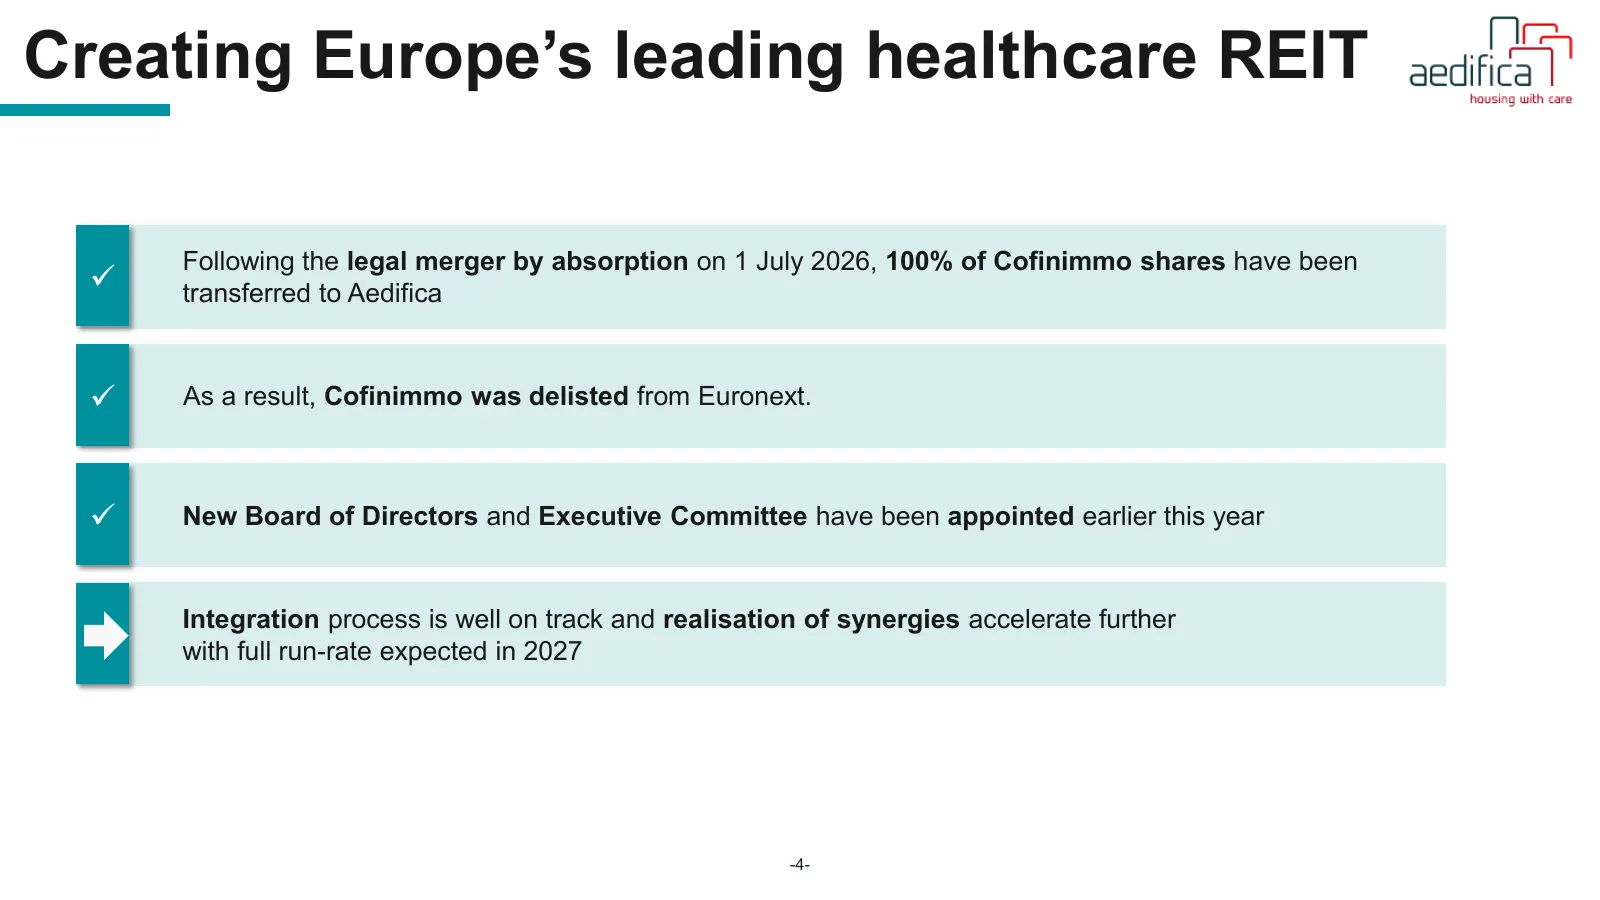
Slide 4: Creating Europe's leading healthcare REIT
Creating Europe’s leading healthcare REIT Following the legal merger by absorption on 1 July 2026, 100% of Cofinimmo shares have been ✓ transferred to Aedifica ✓ As a result, Cofinimmo was delisted from Euronext. ✓ New Board of Directors and Executive Committee have been appointed earlier this year
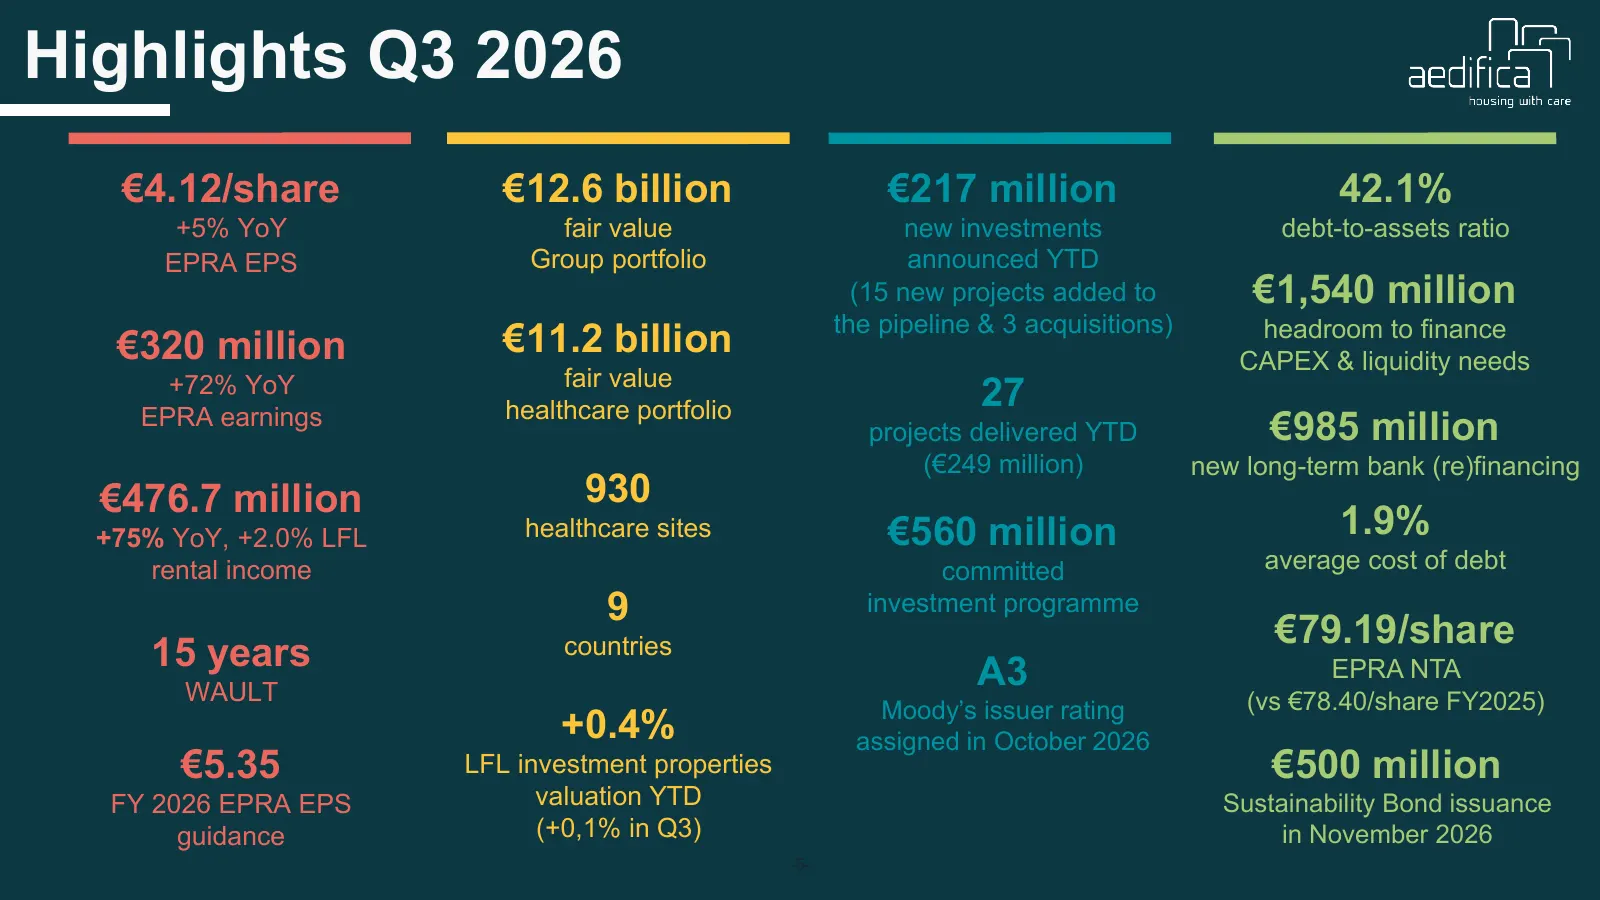
Slide 5: Highlights Q3 2026
Highlights Q3 2026 €4.12/share €12.6 billion €217 million 42.1% +5% YoY fair value new investments debt-to-assets ratio EPRA EPS Group portfolio announced YTD (15 new projects added to €1,540 million the pipeline & 3 acquisitions) headroom to finance €320 million €11.2 billion CAPEX & liquidity need
Slide 6: Investment activity
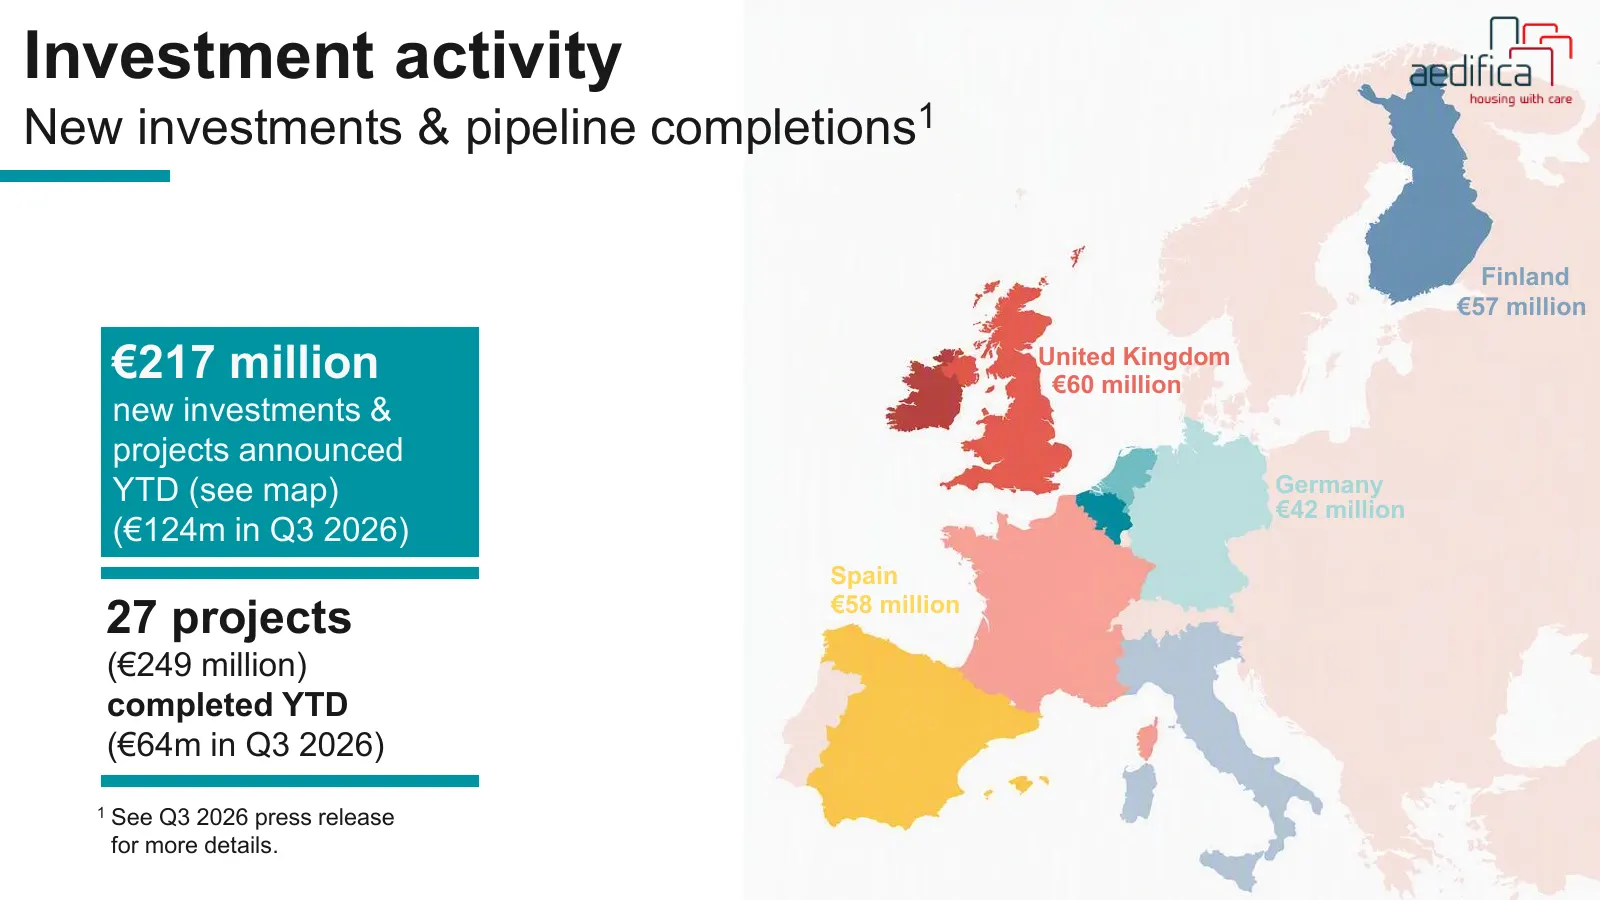
Investment activity New investments & pipeline completions1 Finland €57 million €217 million United Kingdom €60 million new investments & projects announced YTD (see map) Germany €42 million (€124m in Q3 2026) Spain €58 million 27 projects (€249 million) completed YTD (€64m in Q3 2026) 1 See Q3 2026
Slide 7: Strategy
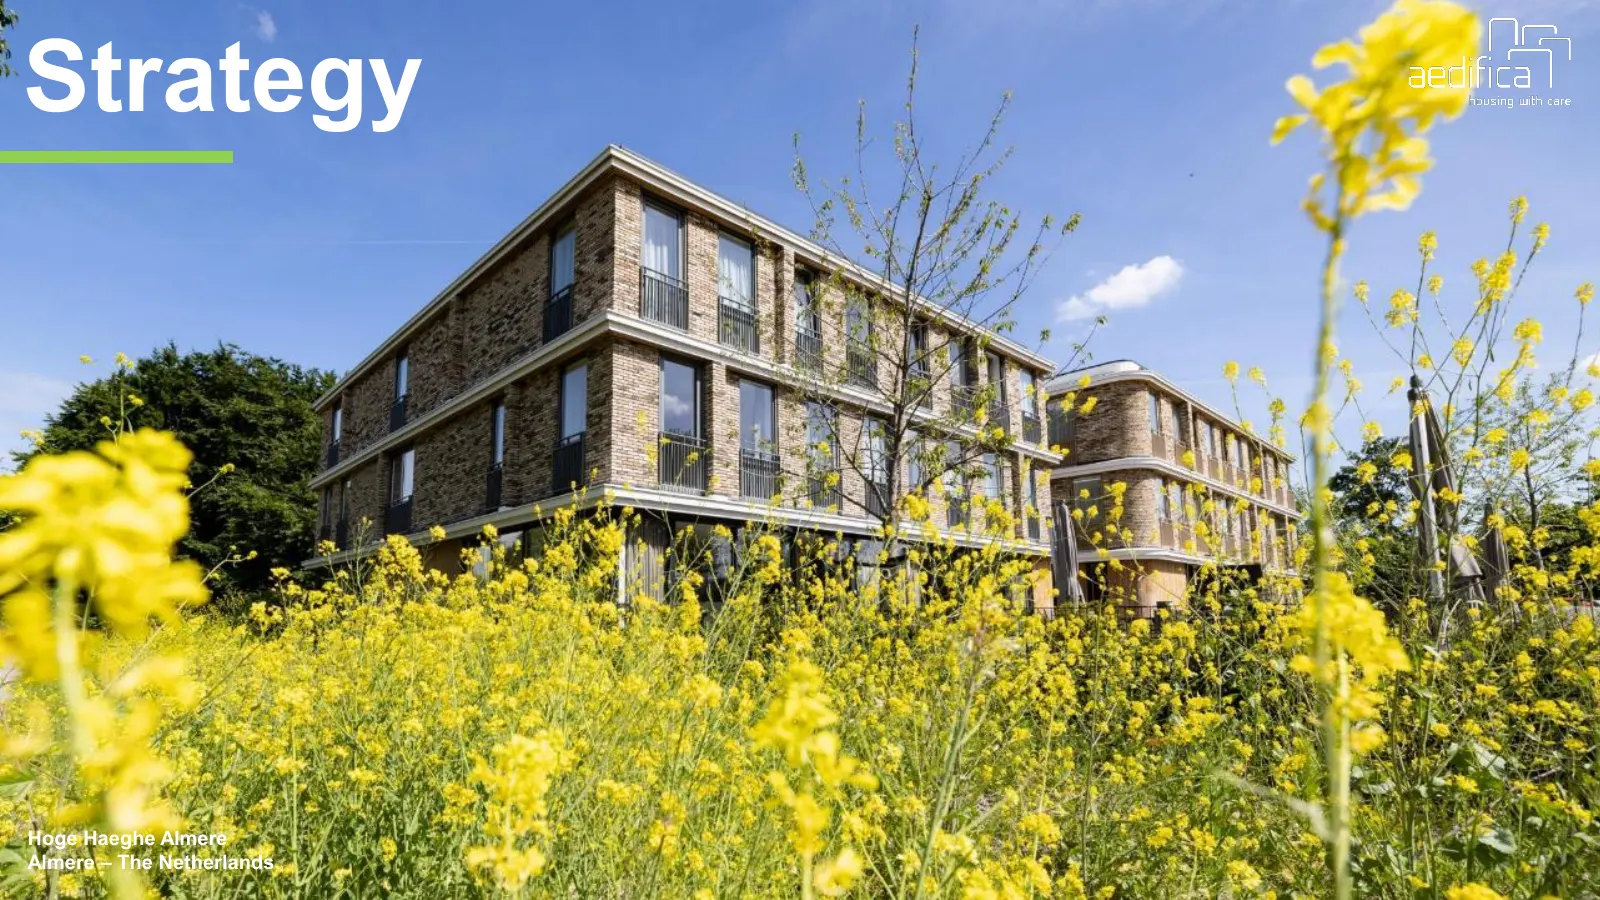
Strategy Hoge Haeghe Almere Almere – The Netherlands -7-
Slide 8: Aedifica at a glance
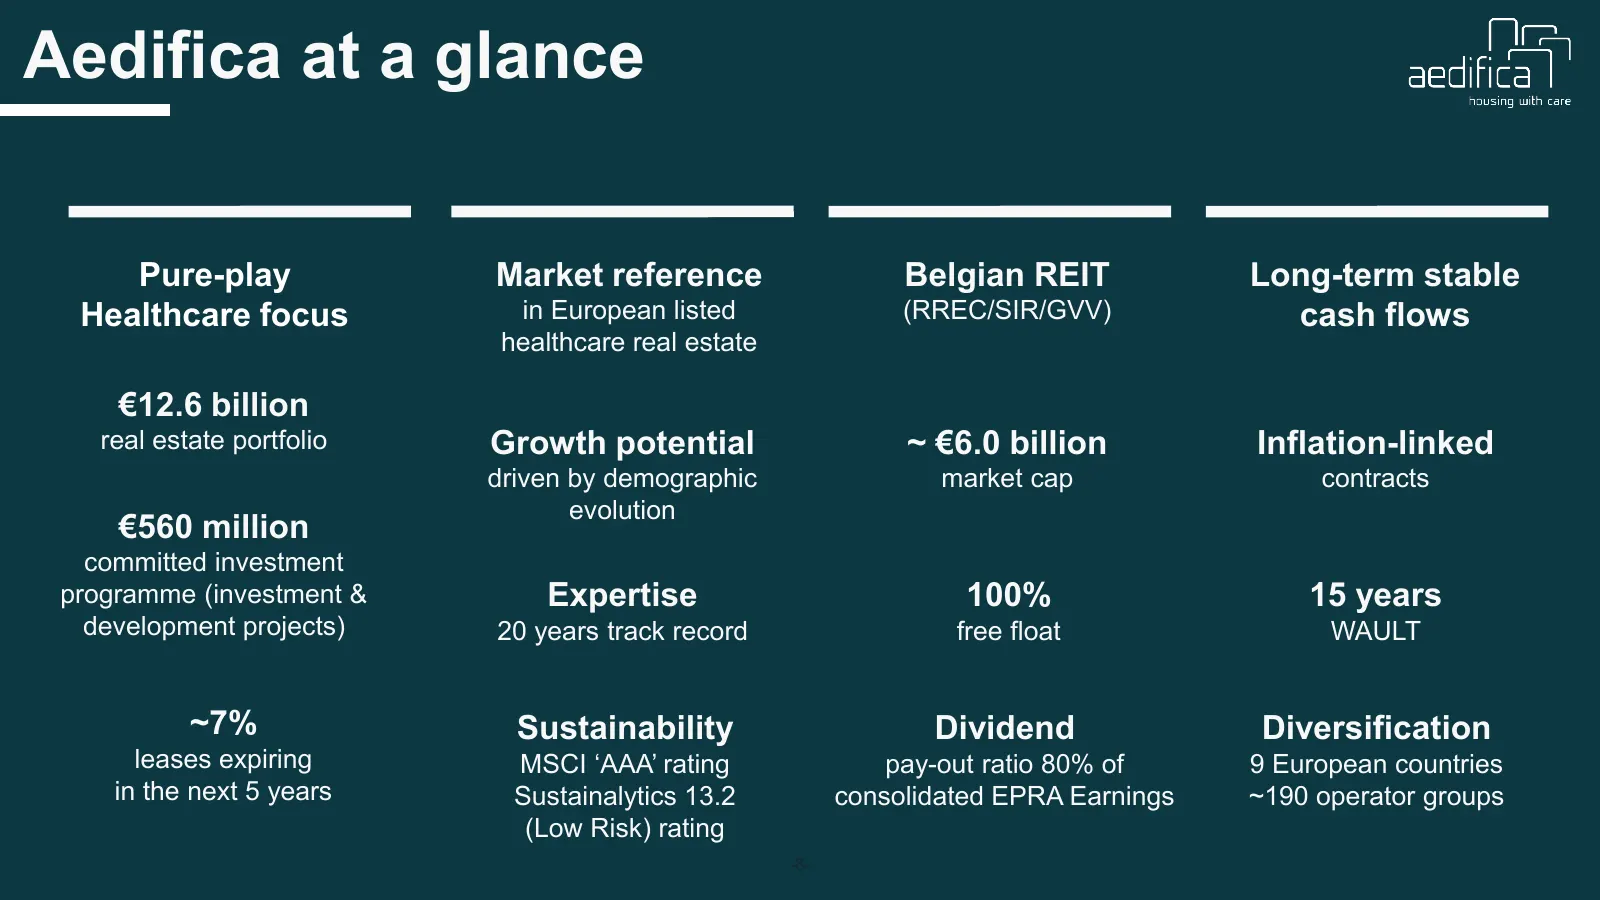
Aedifica at a glance Pure-play Market reference Belgian REIT Long-term stable Healthcare focus in European listed (RREC/SIR/GVV) cash flows healthcare real estate €12.6 billion real estate portfolio Growth potential ~ €6.0 billion Inflation-linked driven by demographic market cap contracts evolution
Slide 9: Exploring European markets
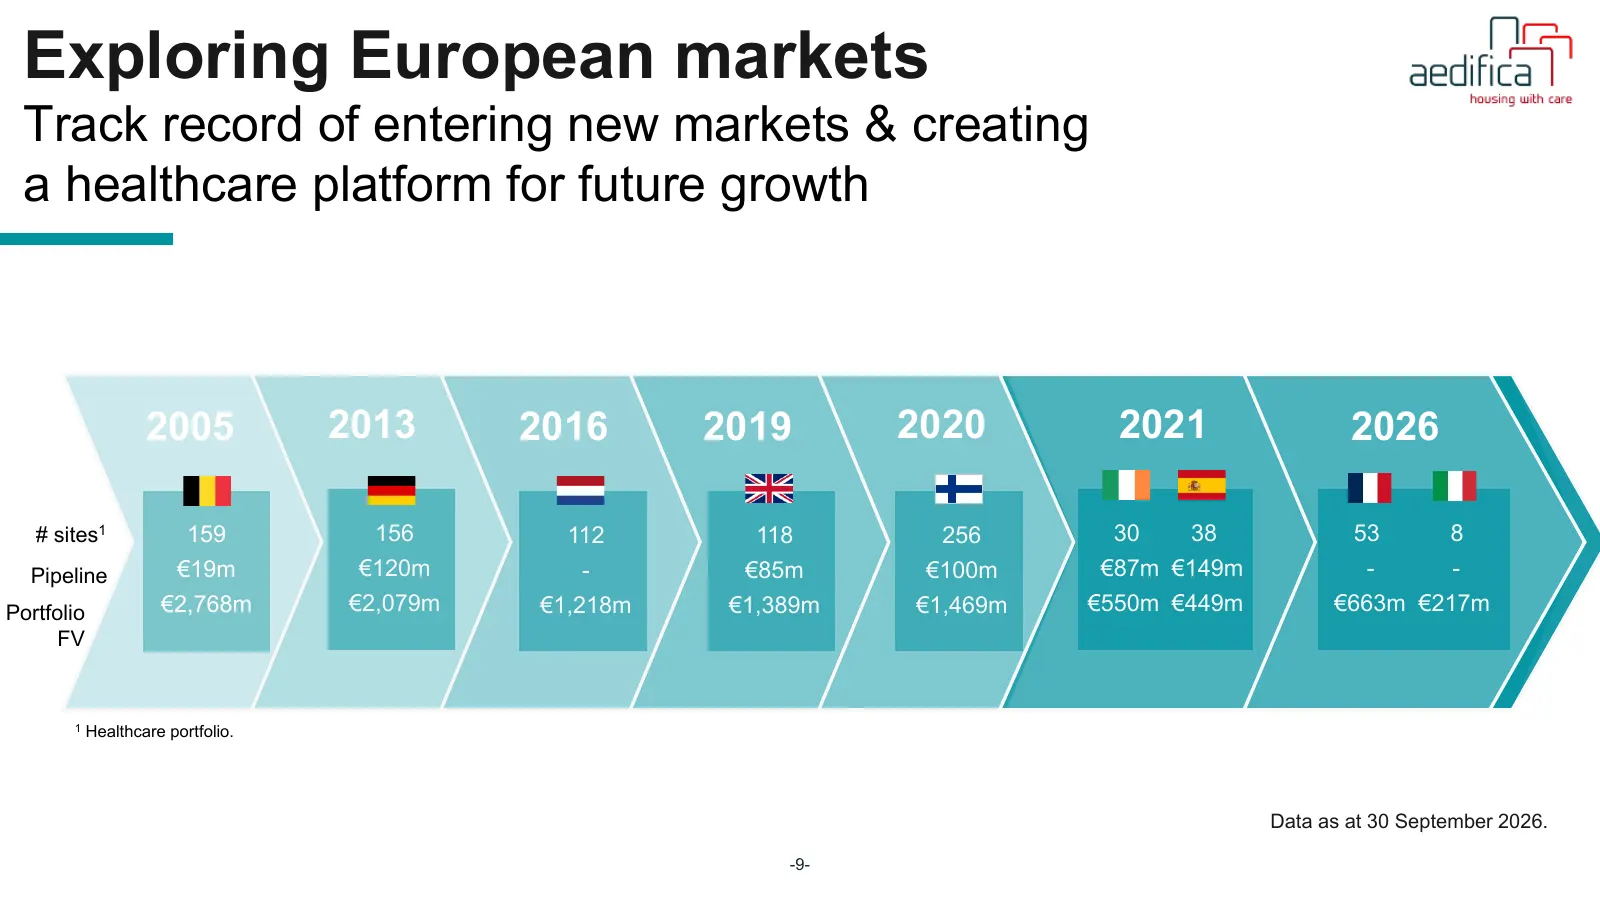
Exploring European markets Track record of entering new markets & creating a healthcare platform for future growth 2005 2013 2016 2019 2020 2021 2026 # sites1 159 156 112 118 256 30 38 53 8 Pipeline €19m €120m - €85m €100m €87m €149m - - Portfolio €2,768m €2,079m €1,218m €1,389m €1,469m €550m €449m
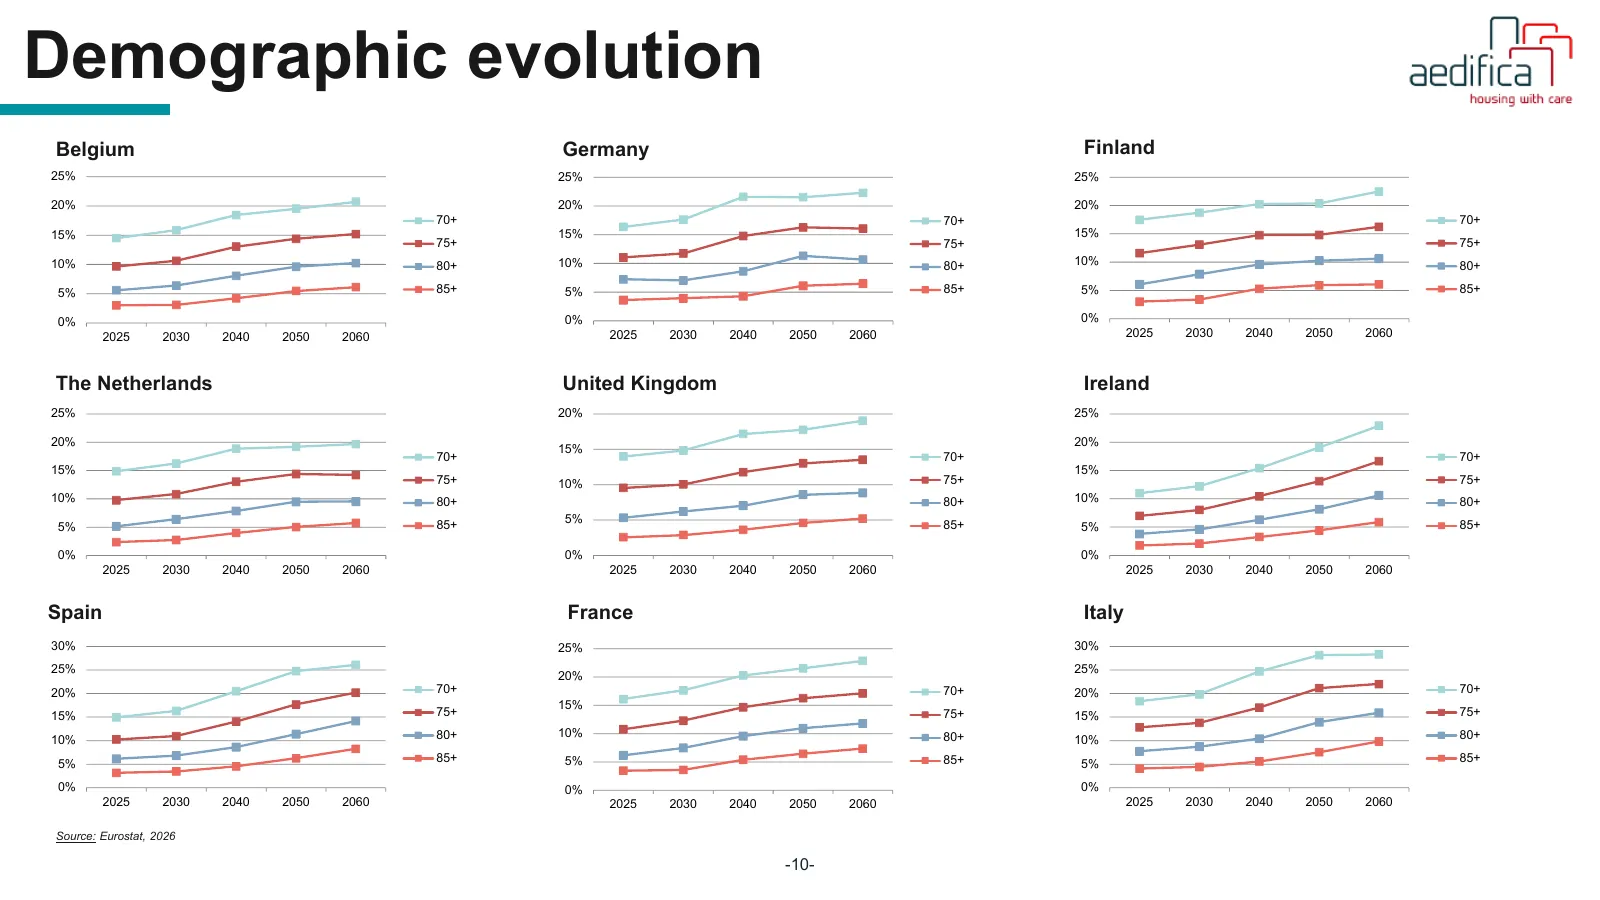
Slide 10: Demographic evolution
Demographic evolution Belgium Germany Finland 25% 25% 25% 20% 20% 20% 70+ 70+ 70+ 15% 15% 15% 75+ 75+ 75+ 10% 80+ 10% 80+ 10% 80+ 5% 85+ 5% 85+ 5% 85+ 0% 0% 0% 2025 2030 2040 2050 2060 2025 2030 2040 2050 2060 2025 2030 2040 2050 2060 The Netherlands United Kingdom Ireland 25% 20% 25% 20% 20% 15% 70
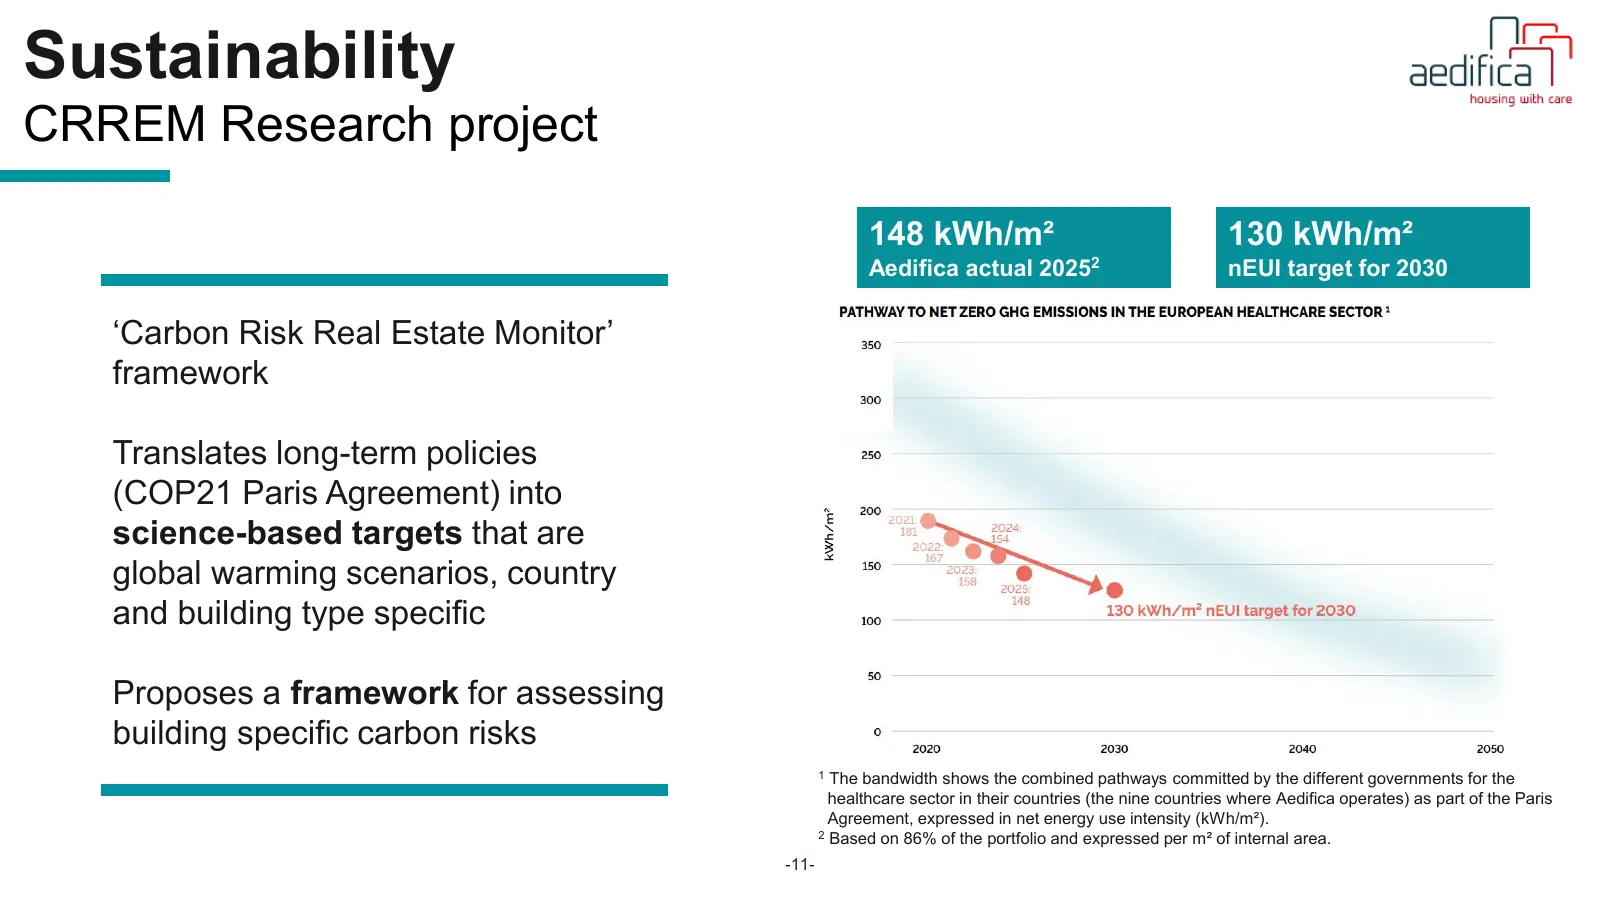
Slide 11: Sustainability
Sustainability CRREM Research project 148 kWh/m² 130 kWh/m² Aedifica actual 20252 nEUI target for 2030 1 ‘Carbon Risk Real Estate Monitor’ framework yoy Translates long-term policies (COP21 Paris Agreement) into science-based targets that are global warming scenarios, country and building type speci
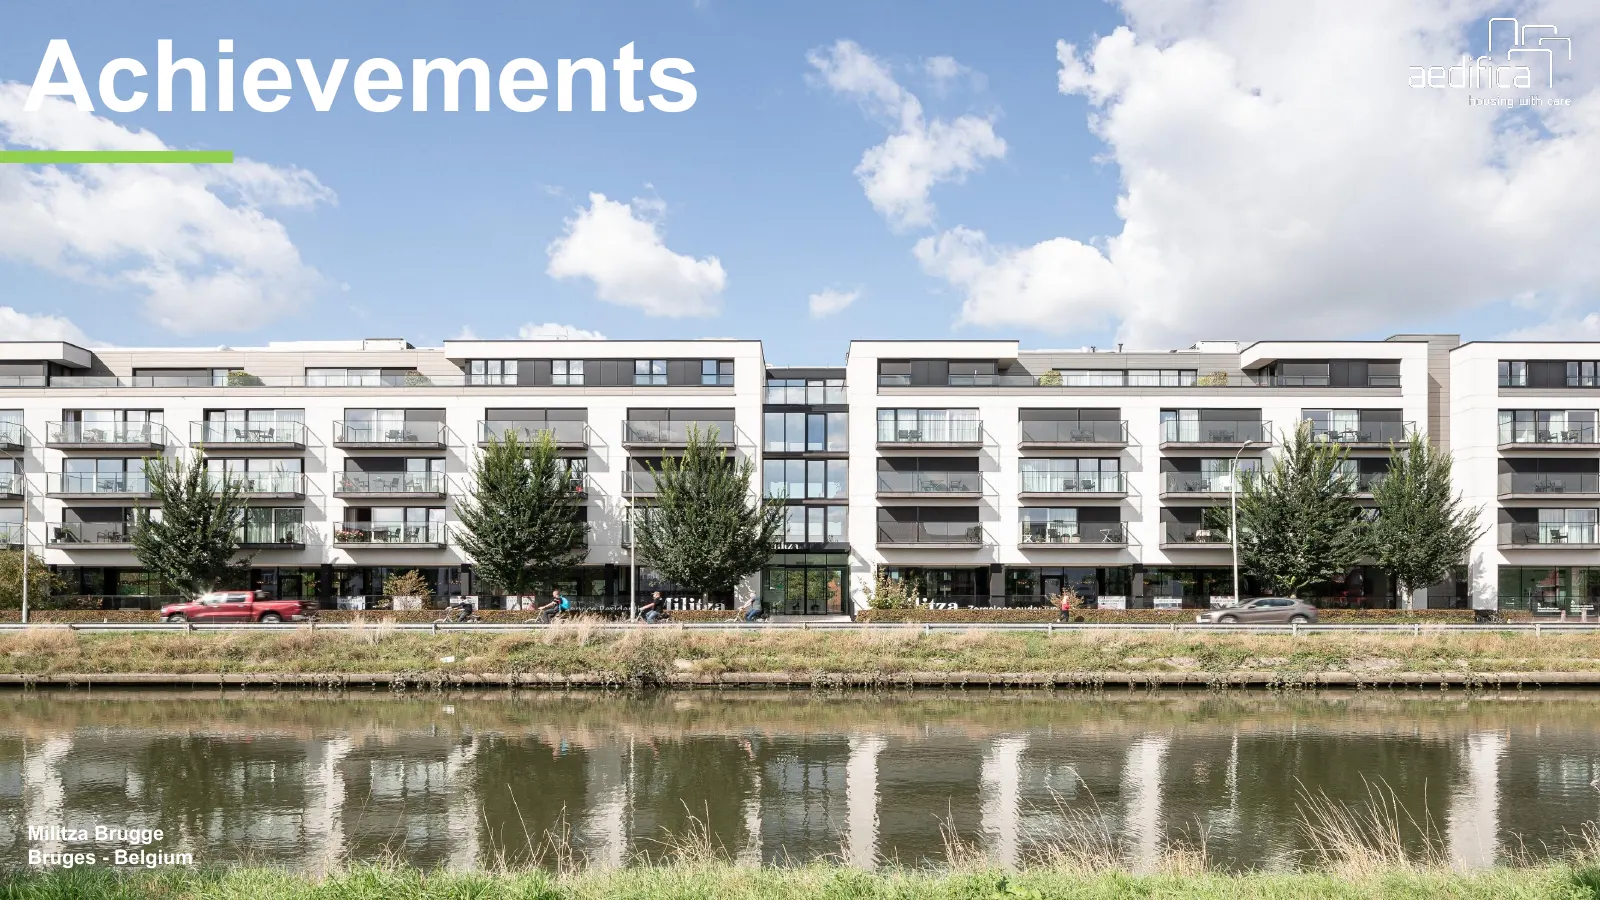
Slide 12: Achievements
Achievements Militza Brugge Bruges - Belgium -12-
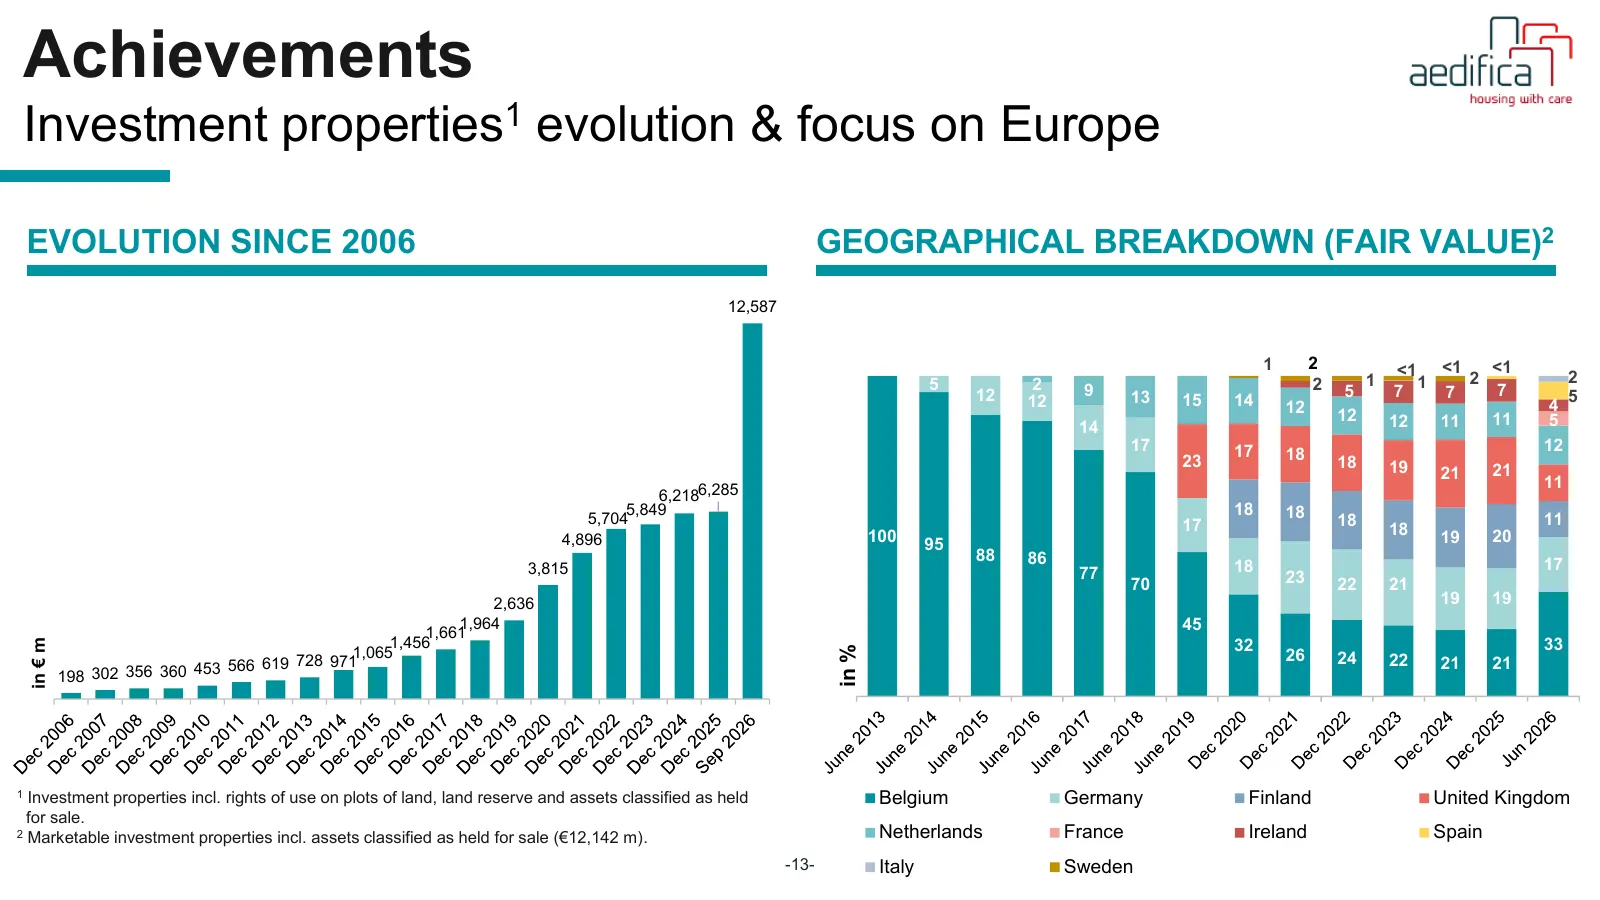
Slide 13: Investment properties evolution & focus on Europe
Achievements Investment properties1 evolution & focus on Europe EVOLUTION SINCE 2006 GEOGRAPHICAL BREAKDOWN (FAIR VALUE)2 12,587 1 2 <1 <1 2 <1 5 2 2 1 1 2 12 9 13 5 7 7 7 5 12 15 14 12 4 12 12 11 11 5 14 17 17 12 23 18 18 19 21 21 11 6,2186,285 5,849 18 18 5,704 17 18 11 100 18 19 20 4,896 95 88 86
Slide 14: Portfolio analysis
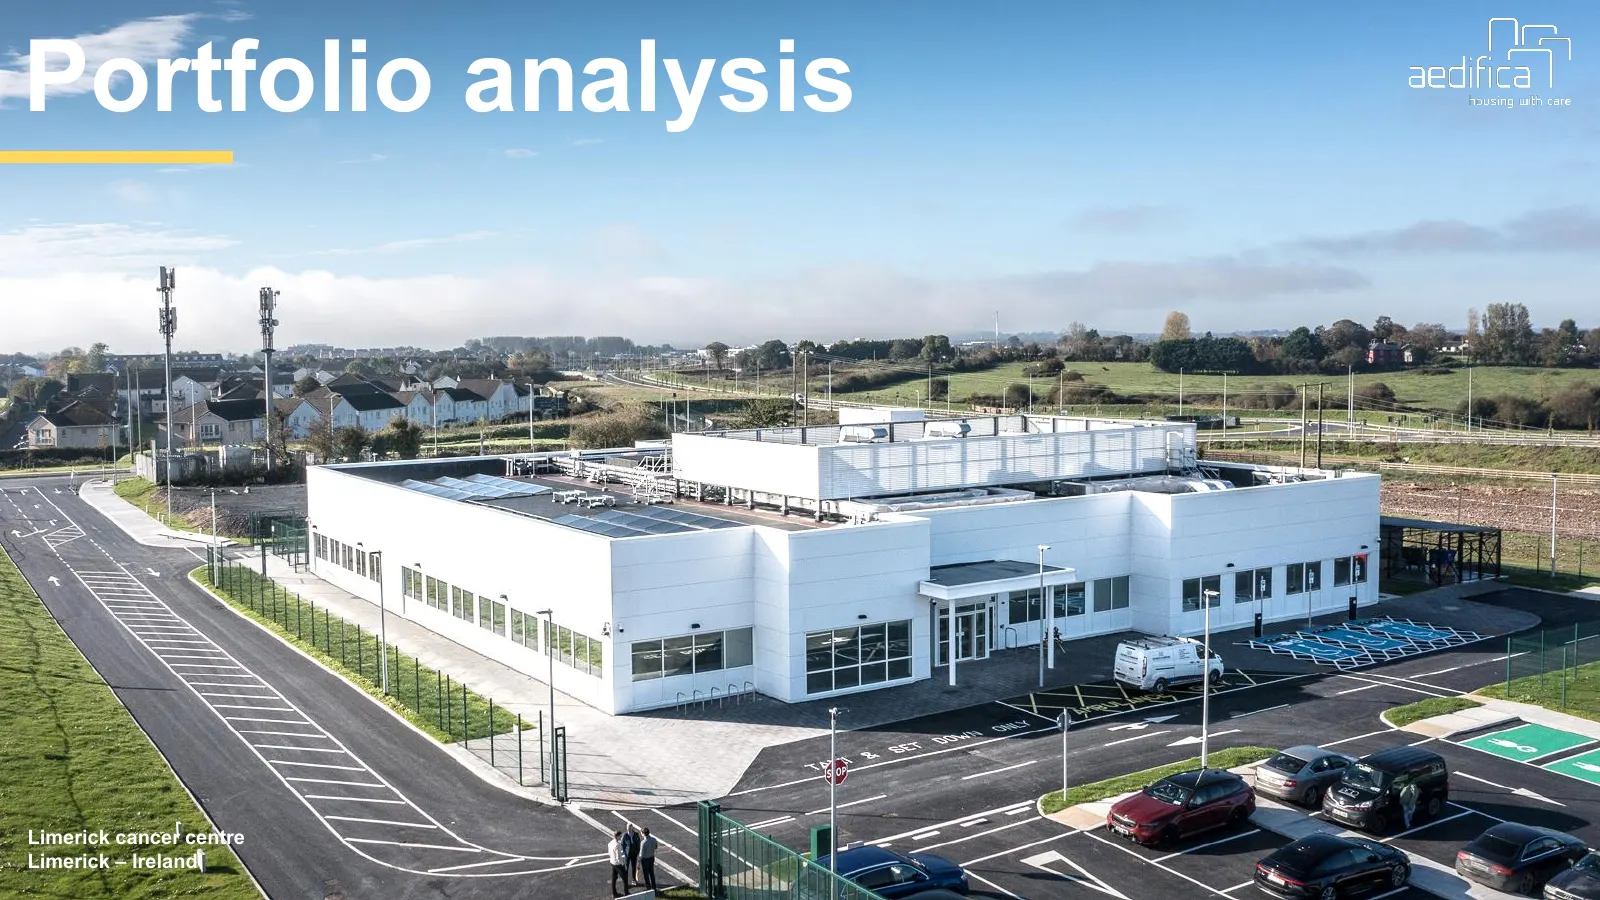
Portfolio analysis Limerick cancer centre Limerick – Ireland -14-
Slide 15: Real estate portfolio: segment breakdown
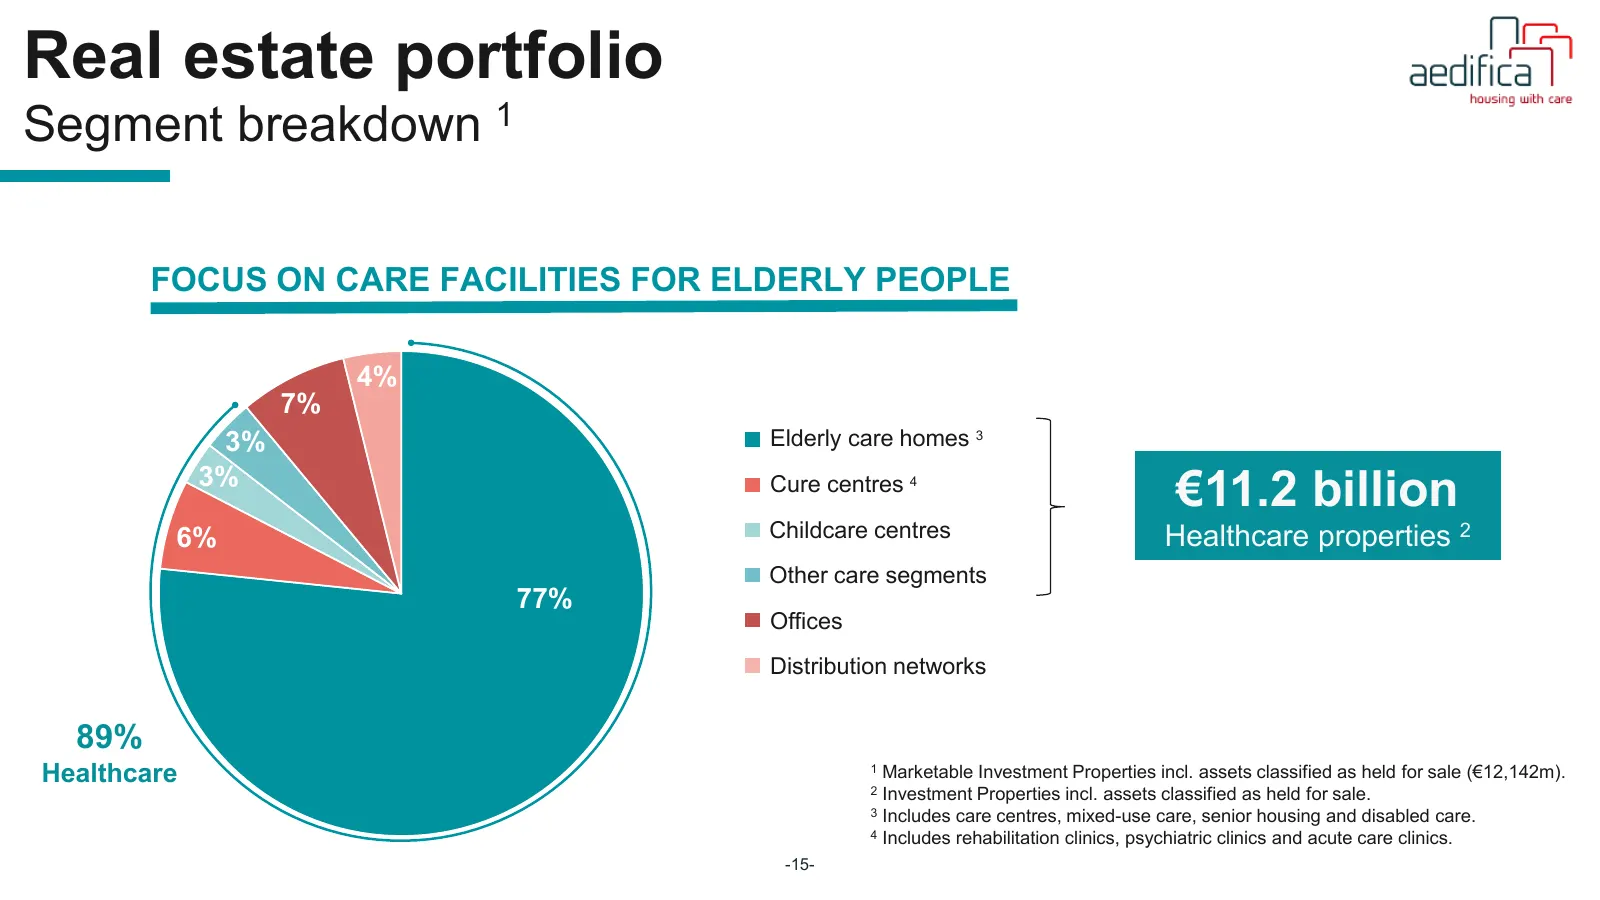
Real estate portfolio Segment breakdown 1 FOCUS ON CARE FACILITIES FOR ELDERLY PEOPLE 4% 7% 3% Elderly care homes 3 3% Cure centres 4 Elderly care centres €11.2 billion 6% Childcare centres Cure centres Healthcare properties 2 Other care segments Childcare centres 77% Other care segments Offices Off
Slide 16: Real estate portfolio: geographical breakdown
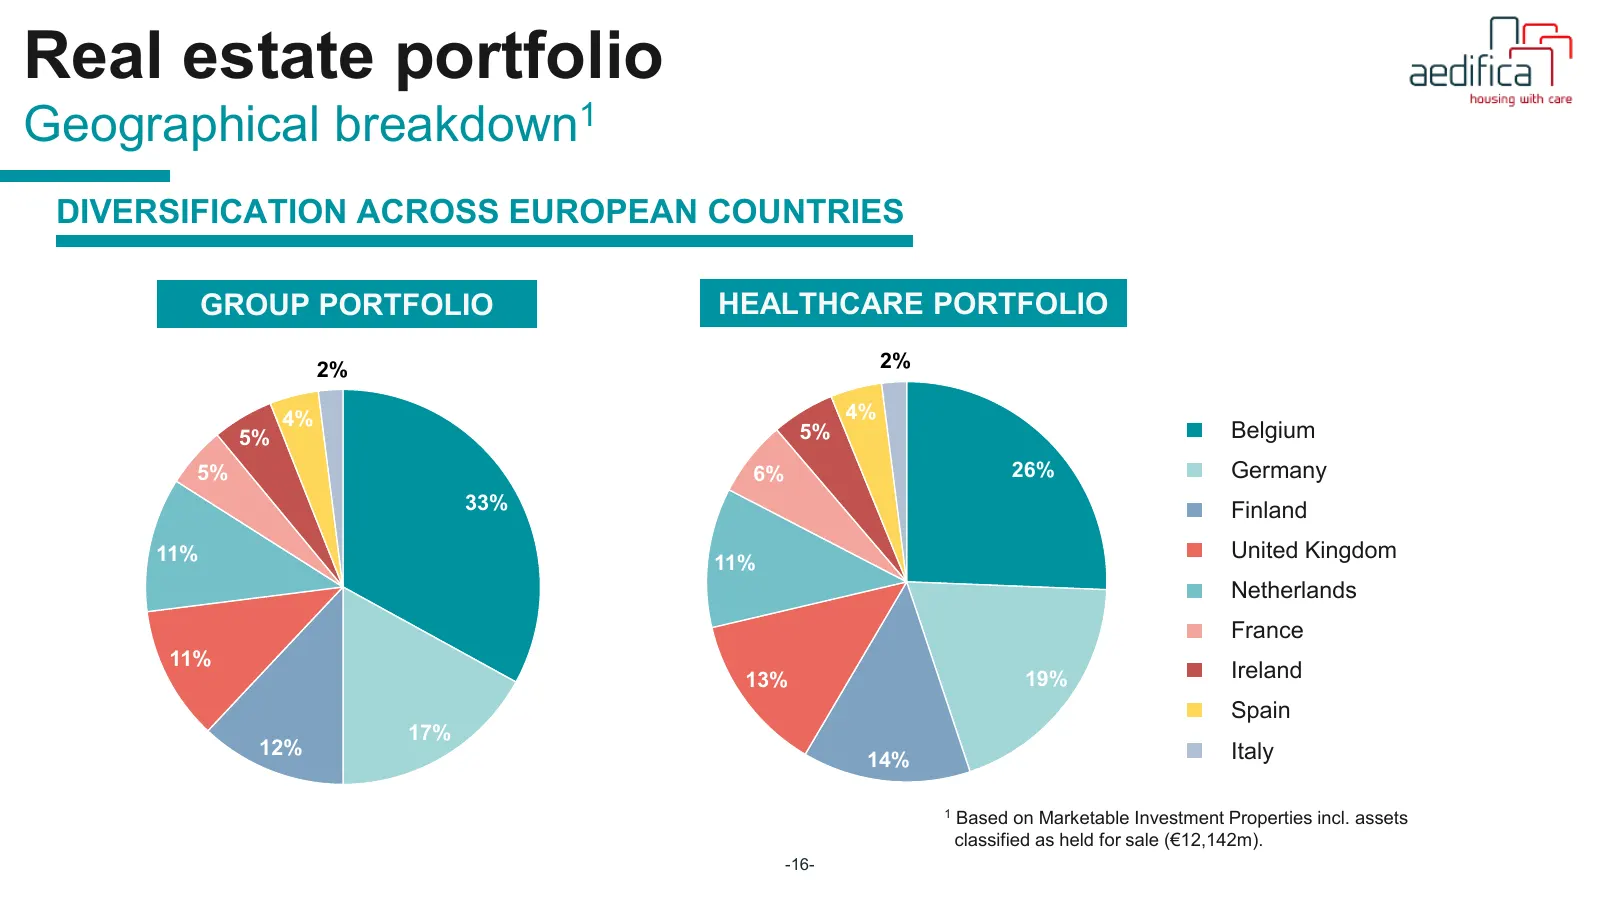
Real estate portfolio Geographical breakdown1 DIVERSIFICATION ACROSS EUROPEAN COUNTRIES GROUP PORTFOLIO HEALTHCARE PORTFOLIO 2% 2% 4% 4% 5% 5% Belgium 5% 6% 26% Germany 33% Finland 11% United Kingdom 11% Netherlands France 11% 13% 19% Ireland Spain 17% 12% Italy 14% 1 Based on Marketable Investment
Slide 17: Real estate tenants
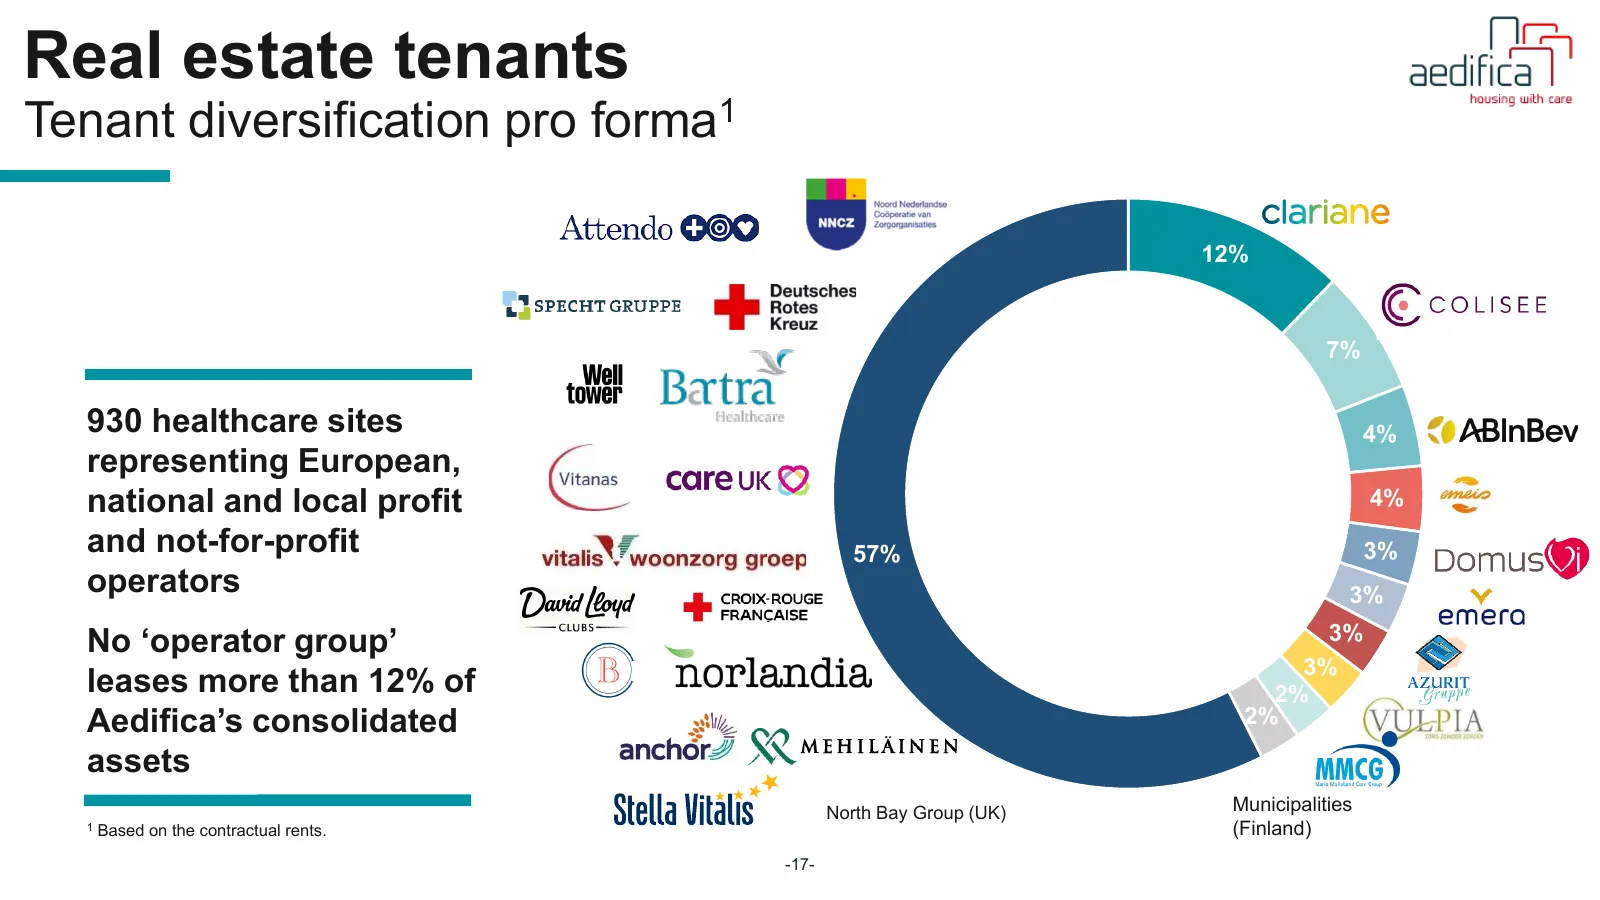
Real estate tenants Tenant diversification pro forma1 12% 7% 930 healthcare sites 4% representing European, national and local profit 4% and not-for-profit 57% 3% operators 3% No ‘operator group’ 3% 3% leases more than 12% of 2% Aedifica’s consolidated 2% assets North Bay Group (UK) Municipalities 1
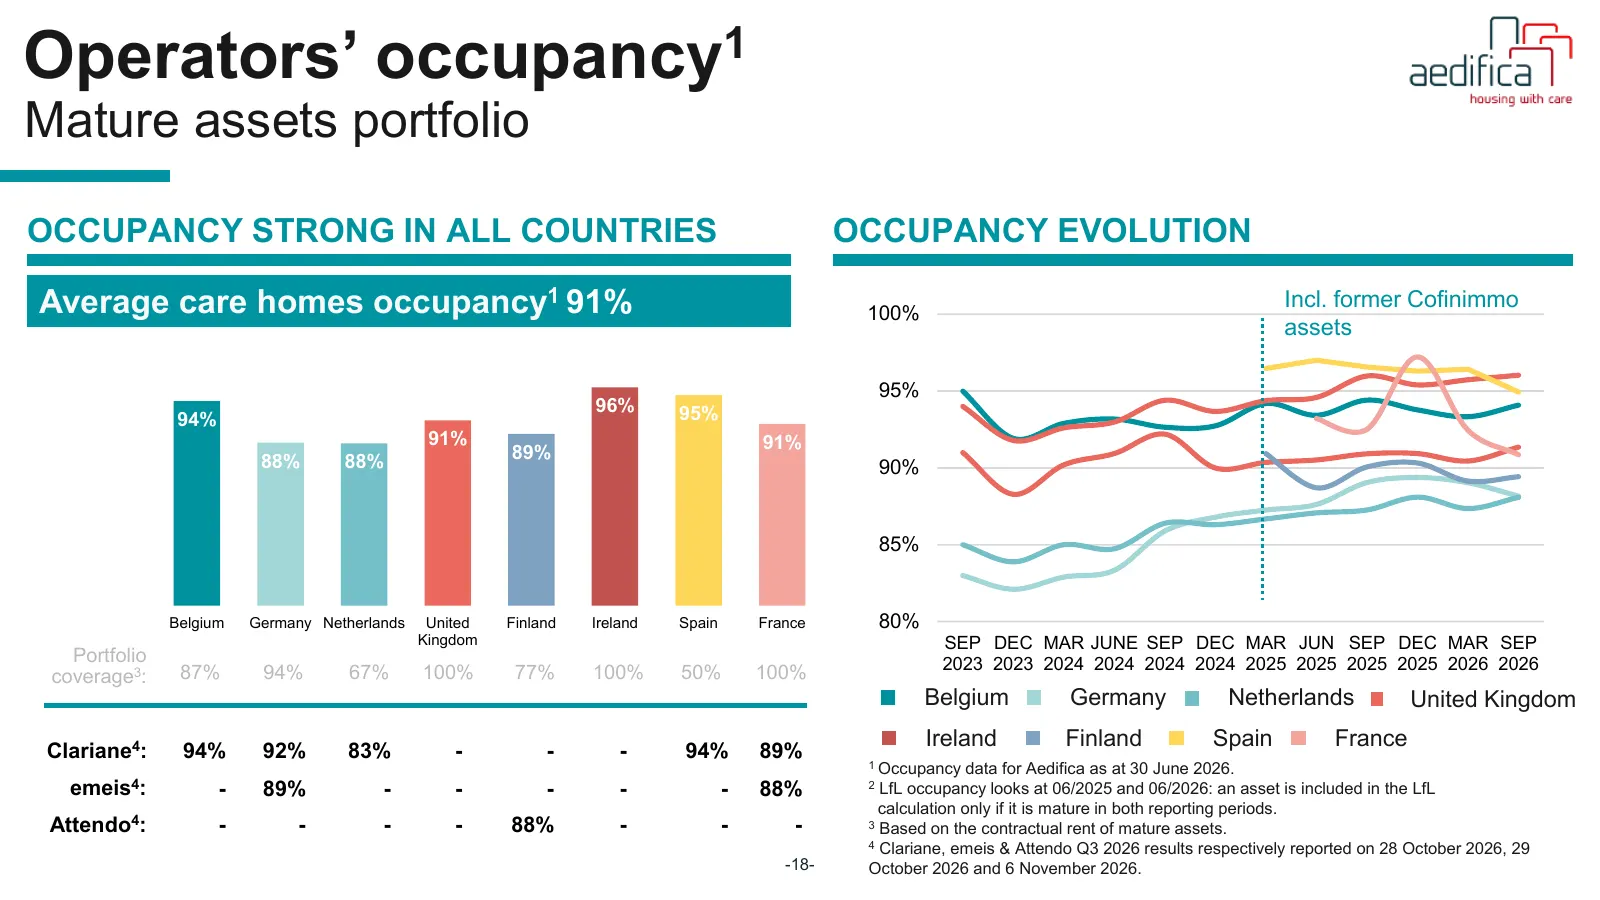
Slide 18: Operators' occupancy
Operators’ occupancy1 Mature assets portfolio OCCUPANCY STRONG IN ALL COUNTRIES OCCUPANCY EVOLUTION Average care homes occupancy1 91% 100% Incl. former Cofinimmo assets 95% 96% 95% 94% 91% 91% 88% 88% 89% 90% 85% Belgium Germany Netherlands United Finland Ireland Spain France 80% Kingdom SEP DEC MAR
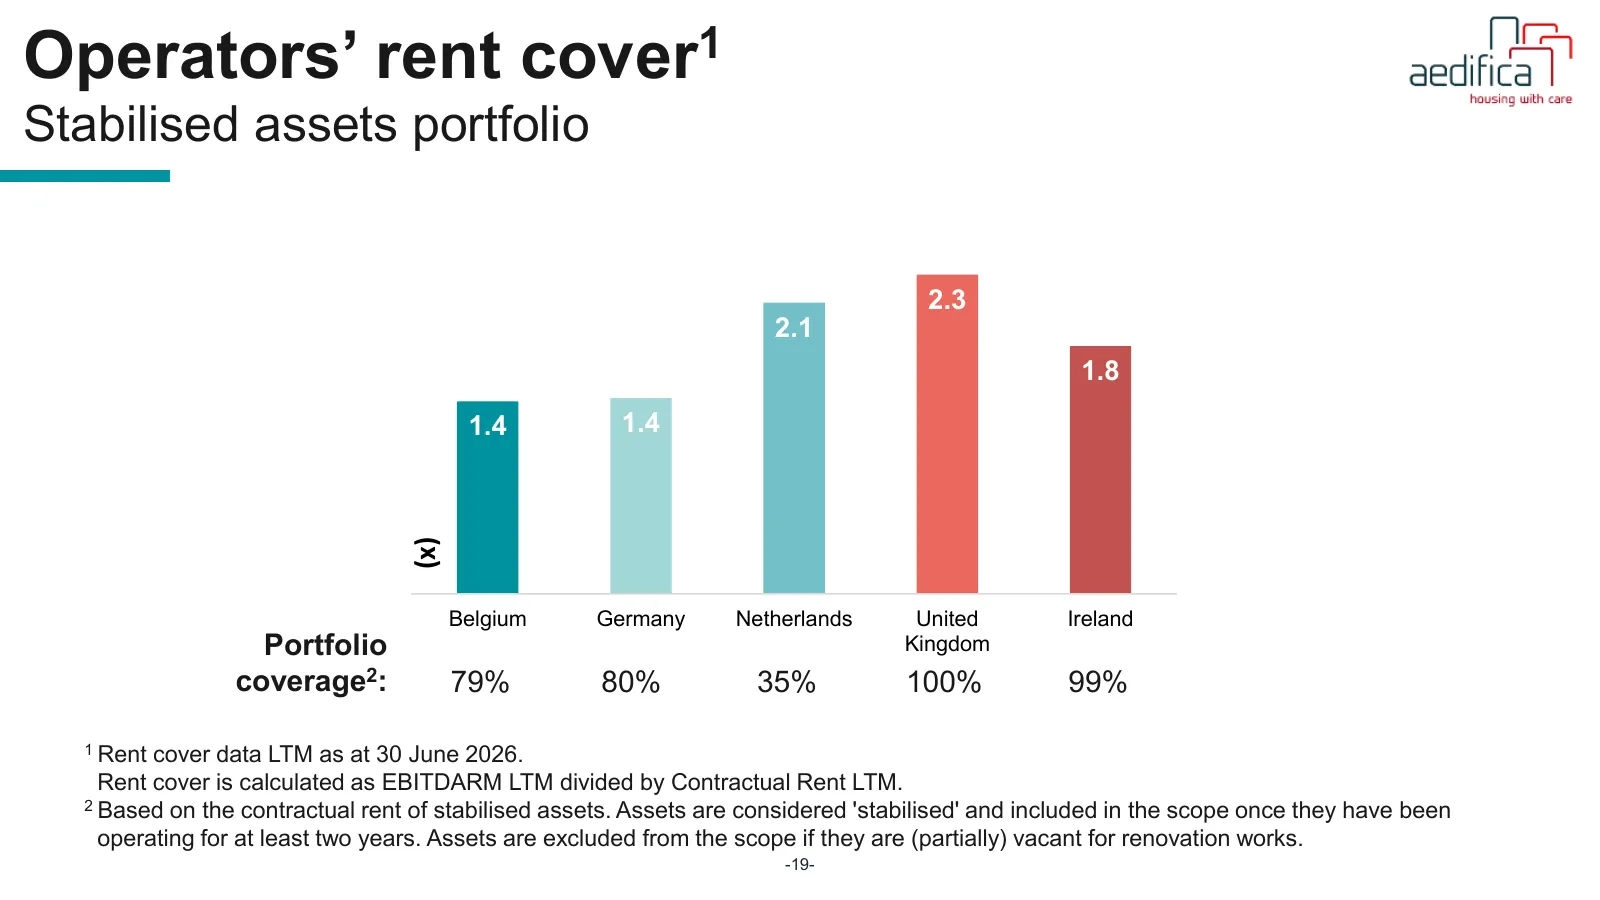
Slide 19: Operators' rent cover
Operators’ rent cover1 Stabilised assets portfolio 2.3 2.1 1.8 (x) 1.4 1.4 (x) Belgium Germany Netherlands United Ireland Portfolio Kingdom coverage2: 79% 80% 35% 100% 99% 1 Rent cover data LTM as at 30 June 2026. Rent cover is calculated as EBITDARM LTM divided by Contractual Rent LTM. 2 Based on t
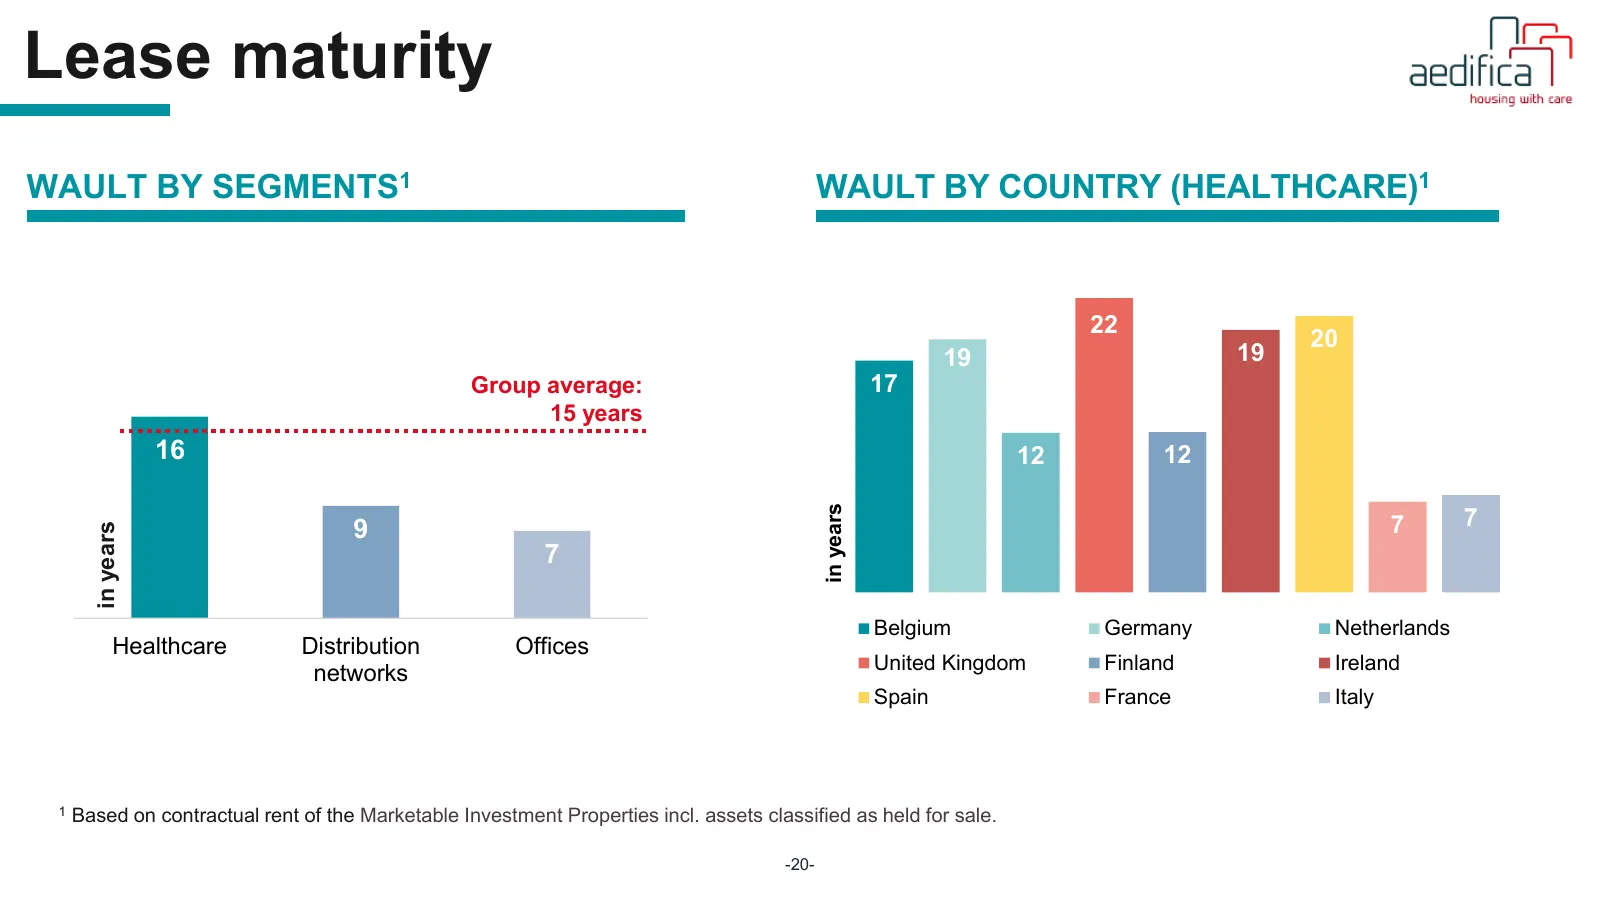
Slide 20: Lease maturity
Lease maturity WAULT BY SEGMENTS1 WAULT BY COUNTRY (HEALTHCARE)1 22 20 19 19 Group average: 17 15 years 16 12 12 in years 9 7 7 in years 7 Belgium Germany Netherlands Healthcare Distribution Offices United Kingdom Finland Ireland networks Spain France Italy 1 Based on contractual rent of the Marketa
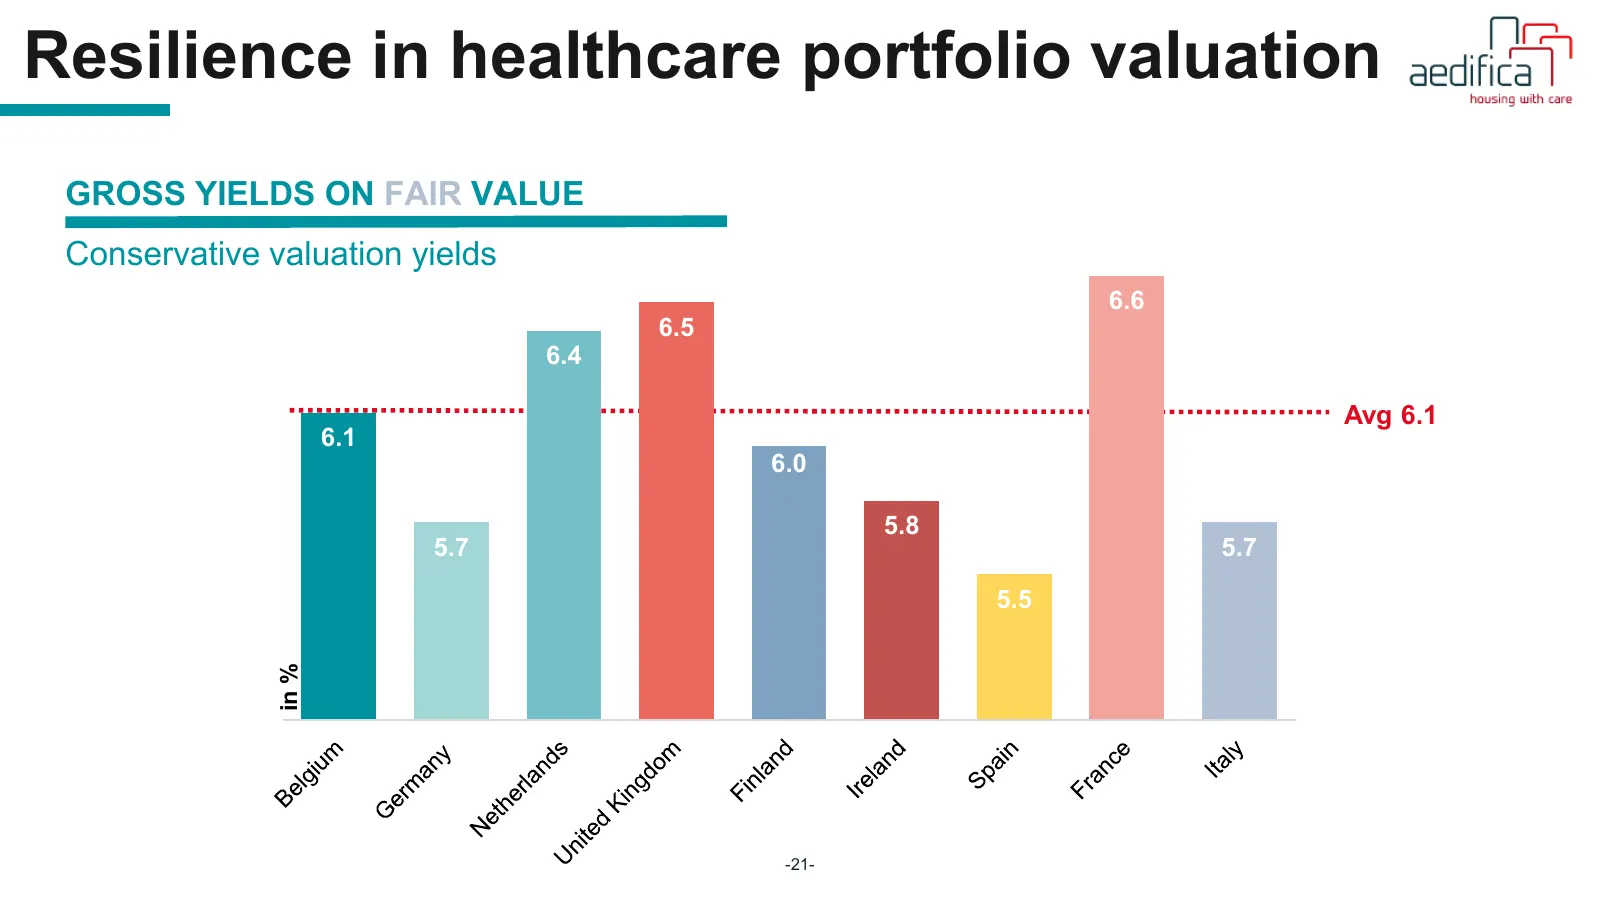
Slide 21: Resilience in healthcare portfolio valuation
Resilience in healthcare portfolio valuation GROSS YIELDS 6.8% ON FAIR VALUE Conservative 6.6% valuation yields 6.6 6.4% 6.5 6.4 6.2% Avg 6.1 6.0% 6.1 6.0 5.8% 5.8 5.6% 5.7 5.7 5.4% 5.5 5.2% in % 5.0% -21-
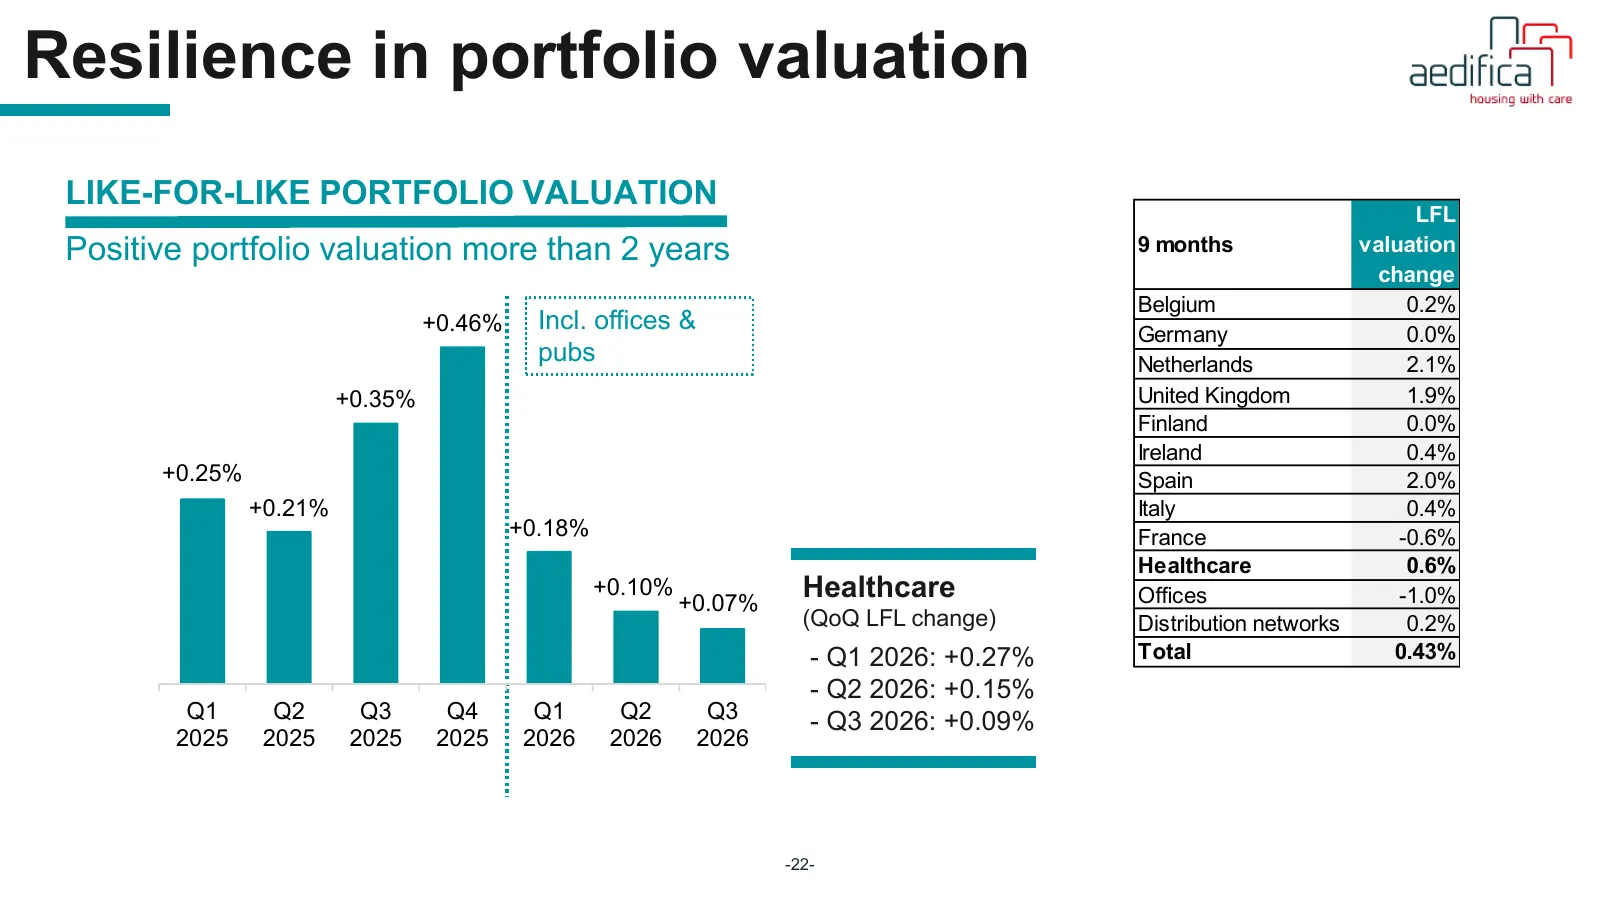
Slide 22: Resilience in portfolio valuation
Resilience in portfolio valuation LIKE-FOR-LIKE PORTFOLIO VALUATION LFL Positive portfolio valuation more than 2 years 9 months valuation change Belgium 0.2% +0.46% Incl. offices & Germany 0.0% pubs Netherlands 2.1% +0.35% United Kingdom 1.9% Finland 0.0% Ireland 0.4% +0.25% Spain 2.0% +0.21% Italy
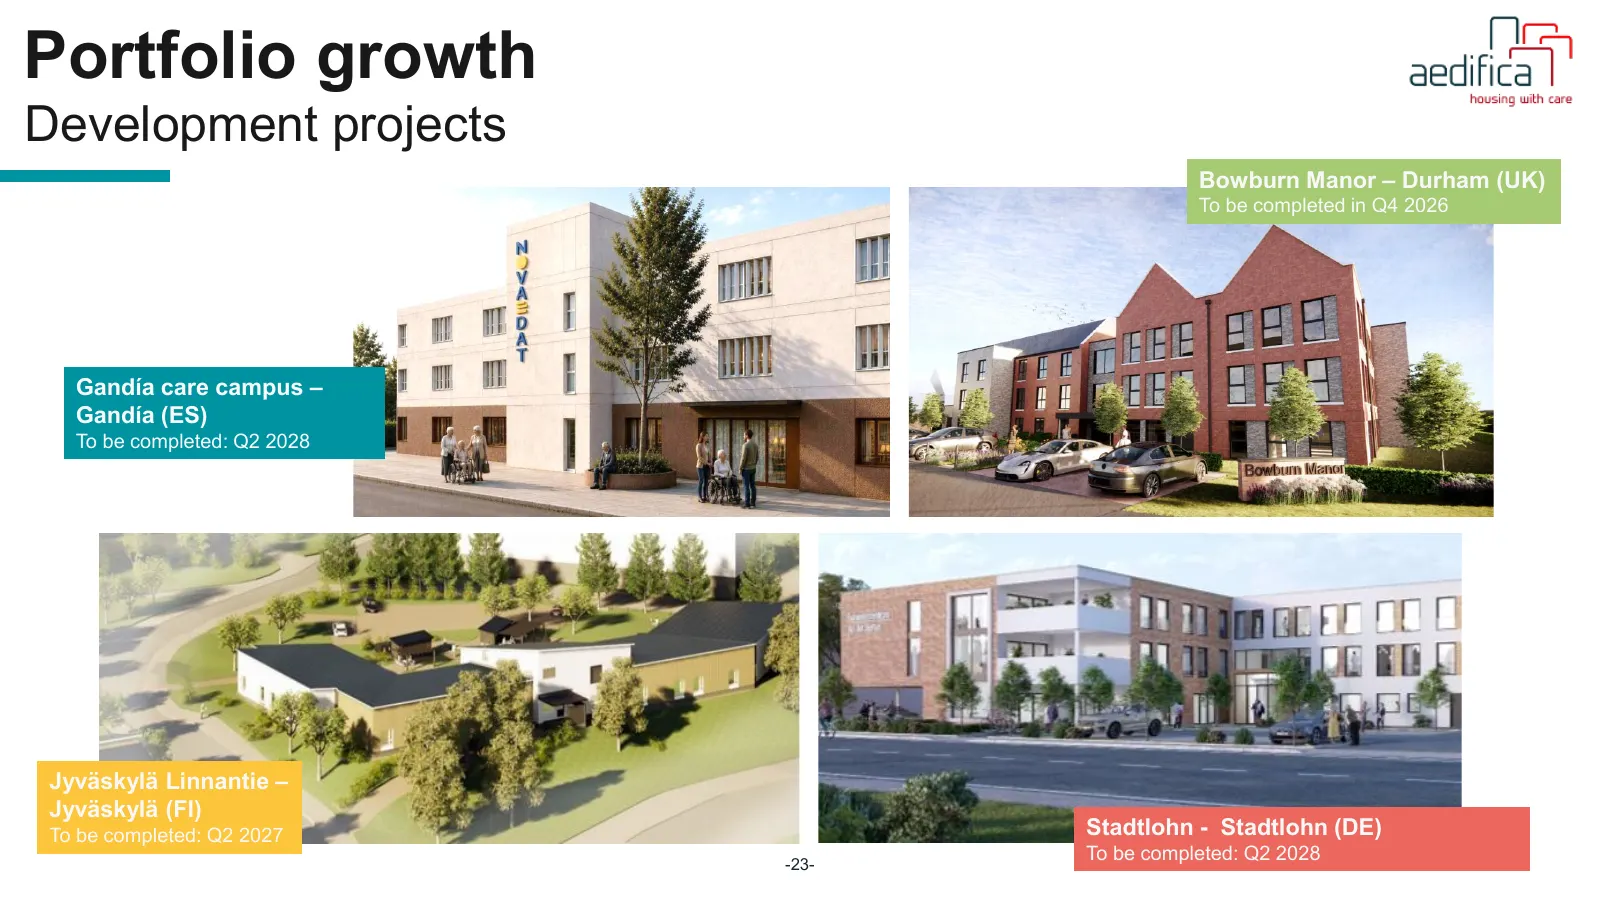
Slide 23: Portfolio growth: development projects
Portfolio growth Development projects Bowburn Manor – Durham (UK) To be completed in Q4 2026 Gandía care campus – Gandía (ES) To be completed: Q2 2028 Jyväskylä Linnantie – Jyväskylä (FI) To be completed: Q2 2027 Stadtlohn - Stadtlohn (DE) To be completed: Q2 2028 -23-
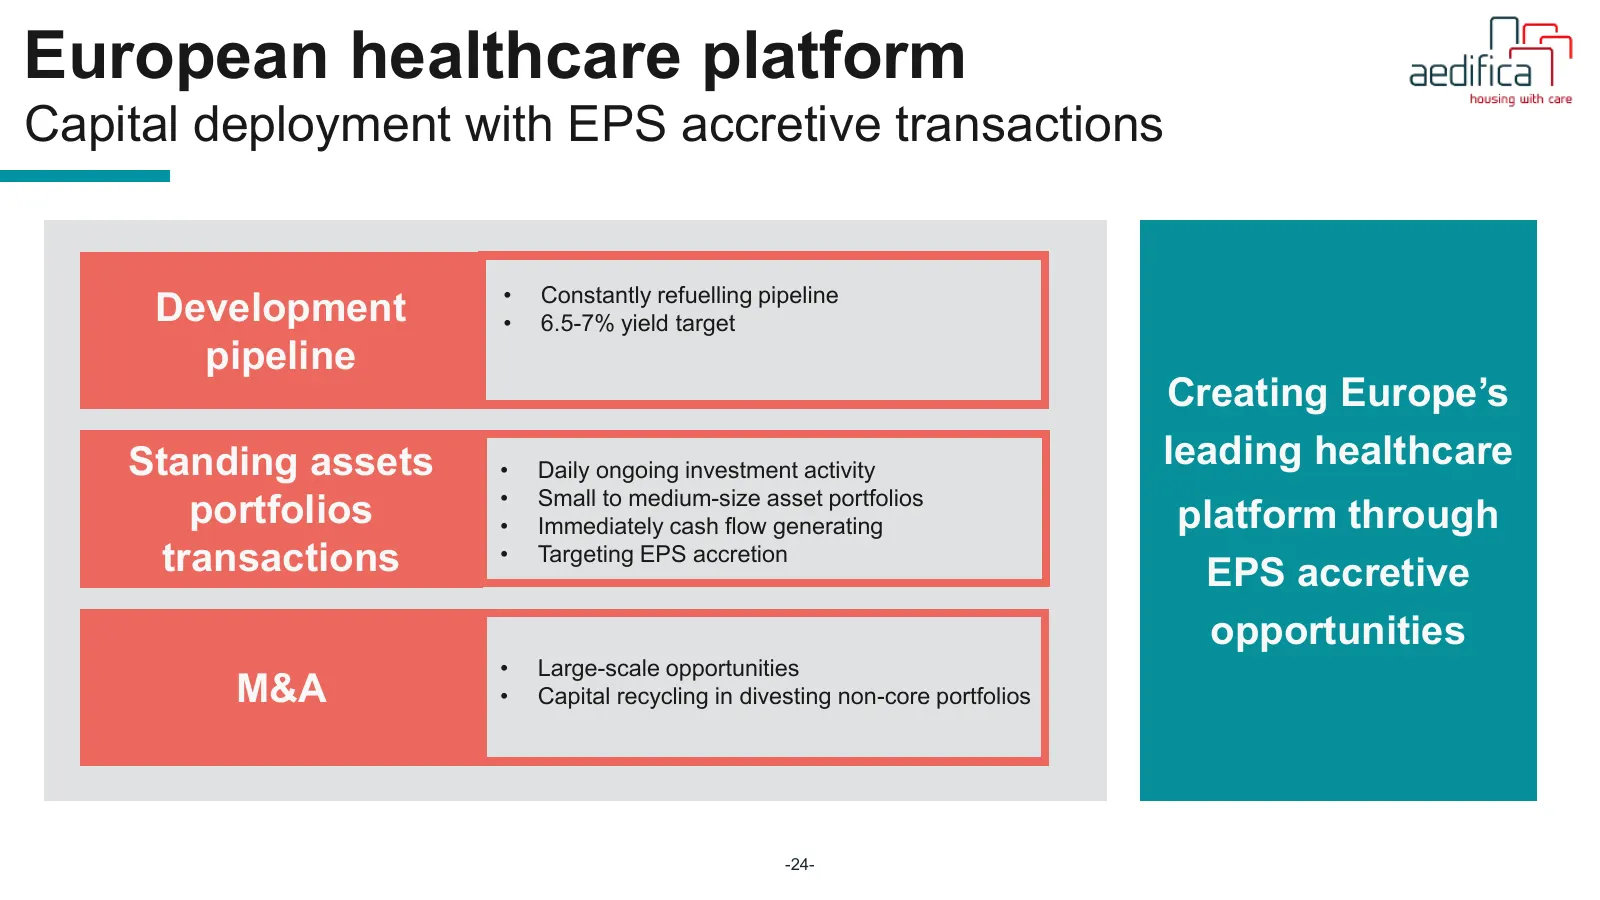
Slide 24: European healthcare platform
European healthcare platform Capital deployment with EPS accretive transactions • Constantly refuelling pipeline Development • 6.5-7% yield target pipeline Creating Europe’s Standing assets • Daily ongoing investment activity leading healthcare • Small to medium-size asset portfolios portfolios • Im
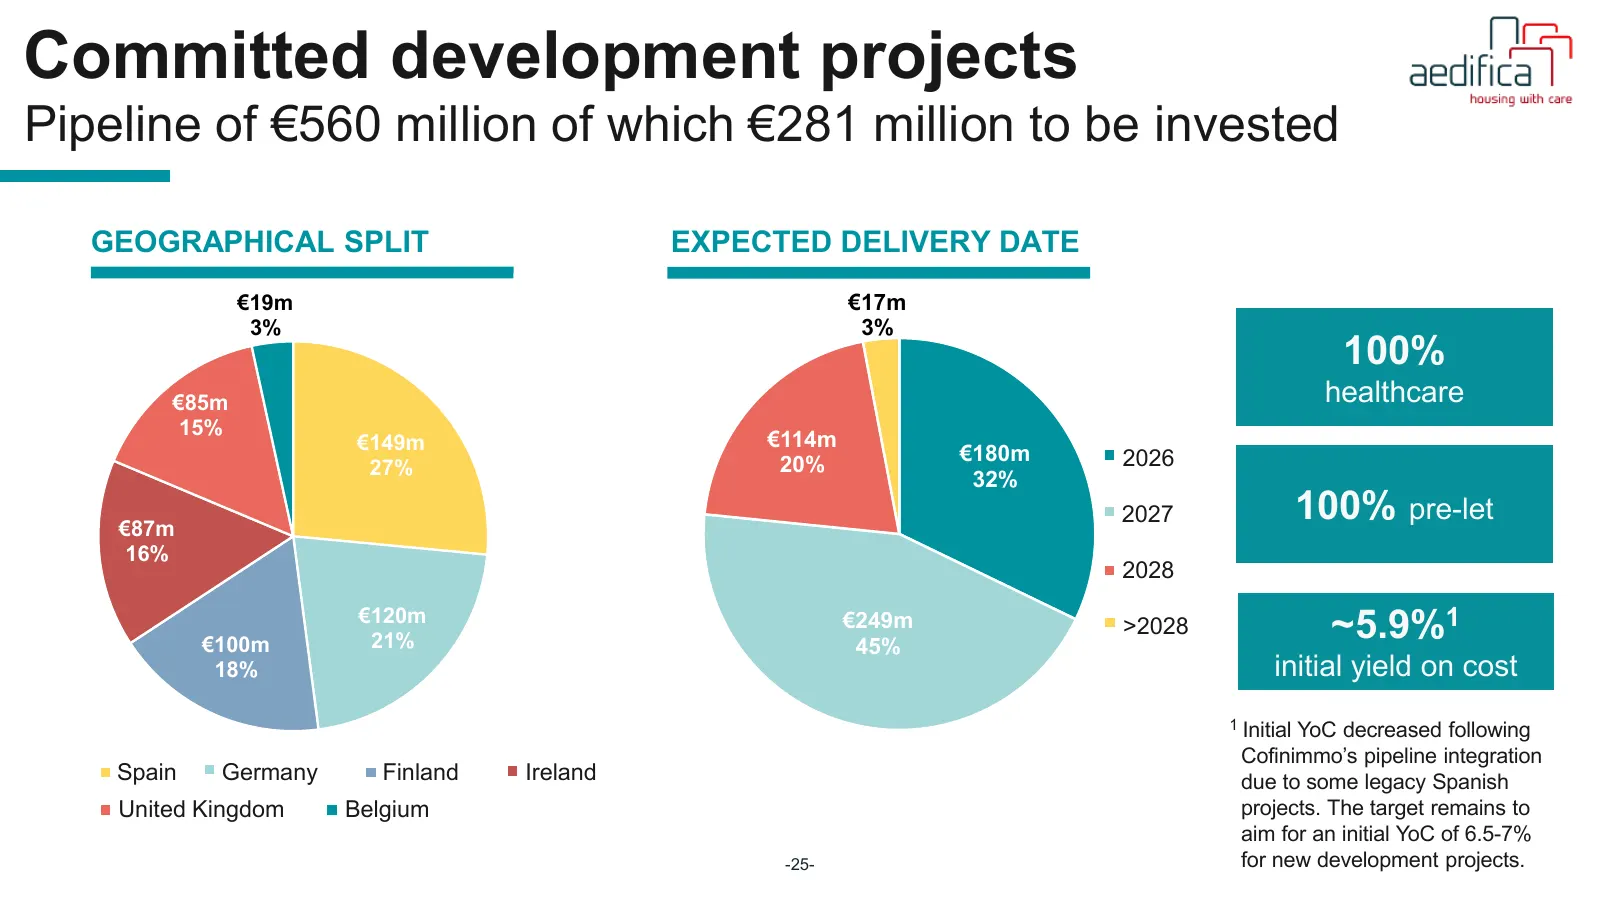
Slide 25: Committed development projects
Committed development projects Pipeline of €560 million of which €281 million to be invested GEOGRAPHICAL SPLIT EXPECTED DELIVERY DATE €19m €17m 3% 3% 100% €85m healthcare 15% €149m €114m 20% €180m 2026 2026 27% 32% €87m 2027 2027 100% pre-let 16% 2028 2028 €100m €120m 21% €249m 45% >2028 >2028 ~5.
Slide 26: Offices & distribution networks
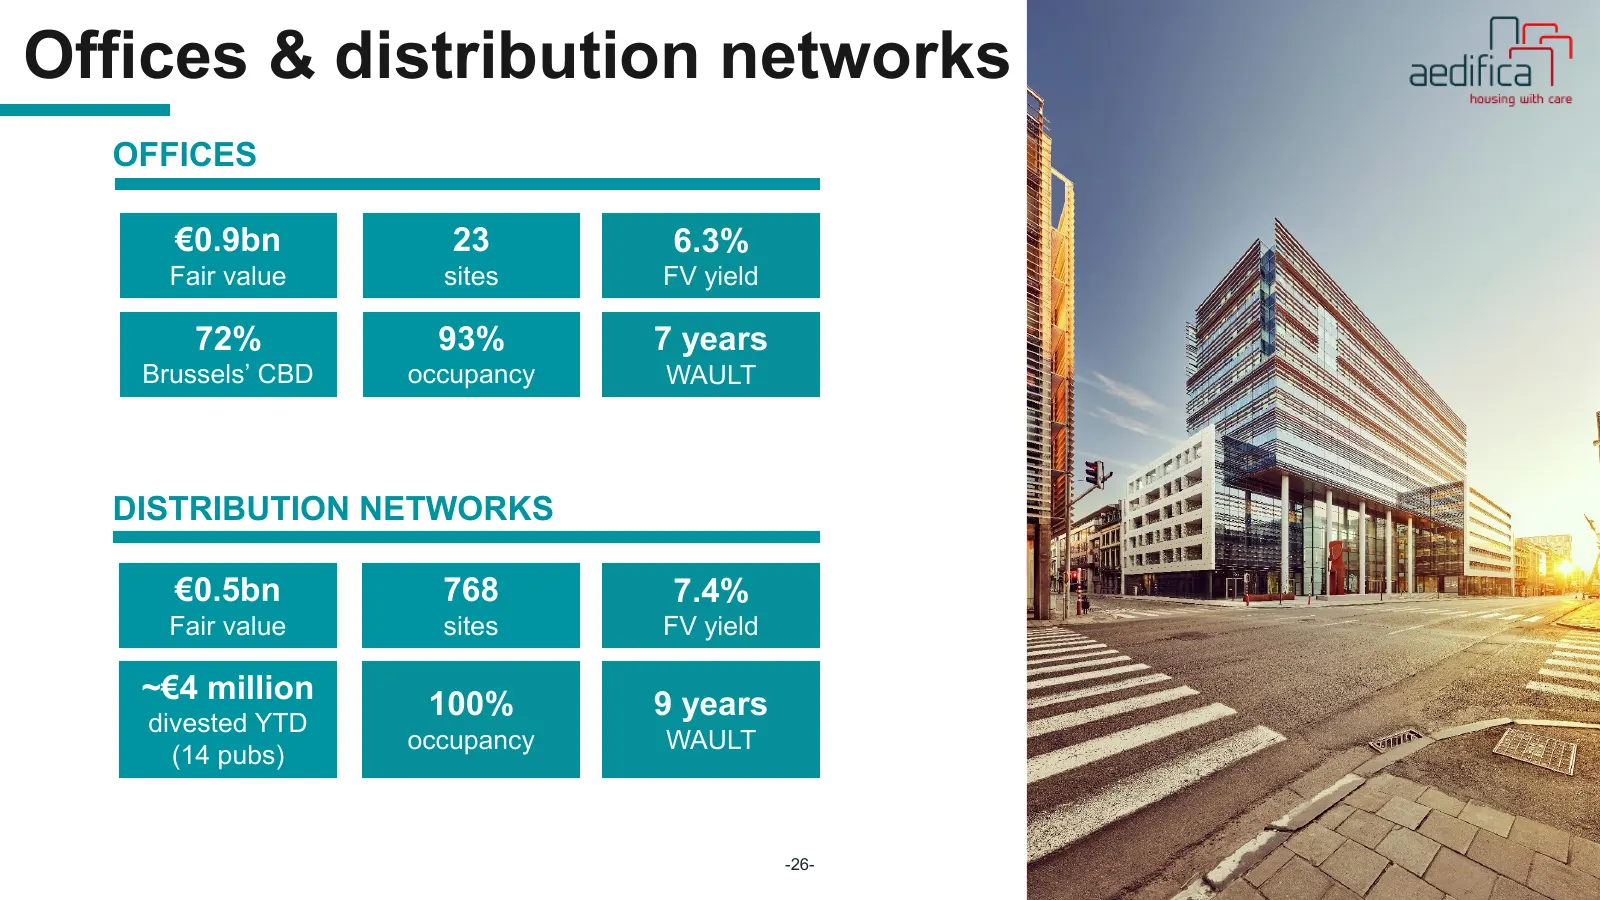
Offices & distribution networks OFFICES €0.9bn 23 6.3% Fair value sites FV yield 72% 93% 7 years Brussels’ CBD occupancy WAULT DISTRIBUTION NETWORKS €0.5bn 768 7.4% Fair value sites FV yield ~€4 million 100% 9 years divested YTD occupancy WAULT (14 pubs) -26-
Slide 27: Financials
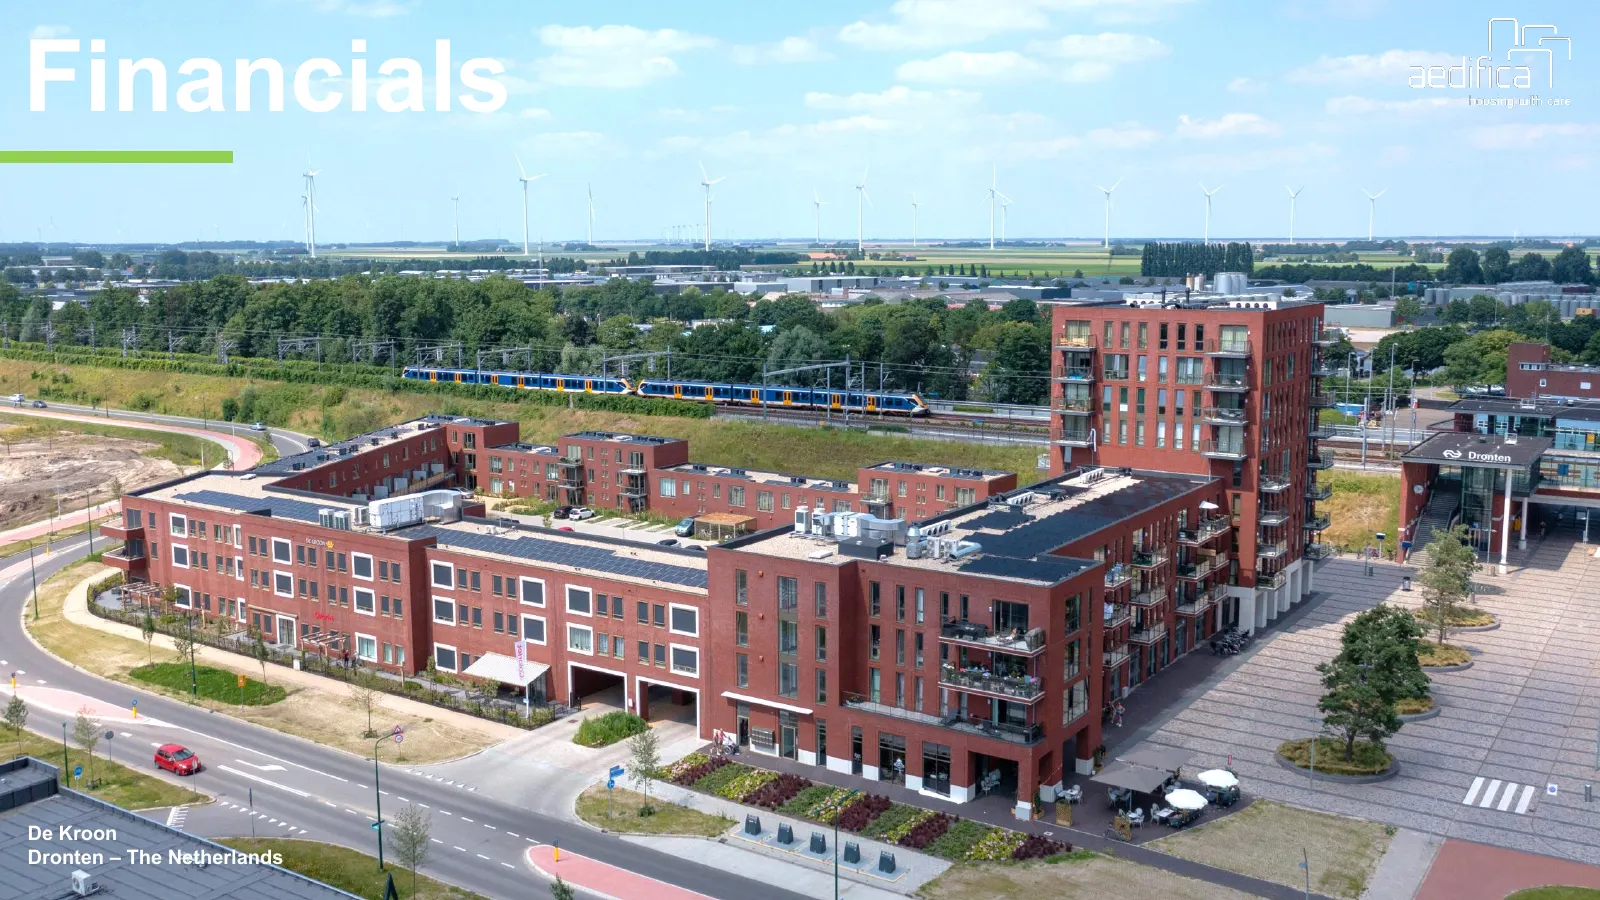
Financials De Kroon Dronten – The Netherlands -27-
Slide 28: Income Statement
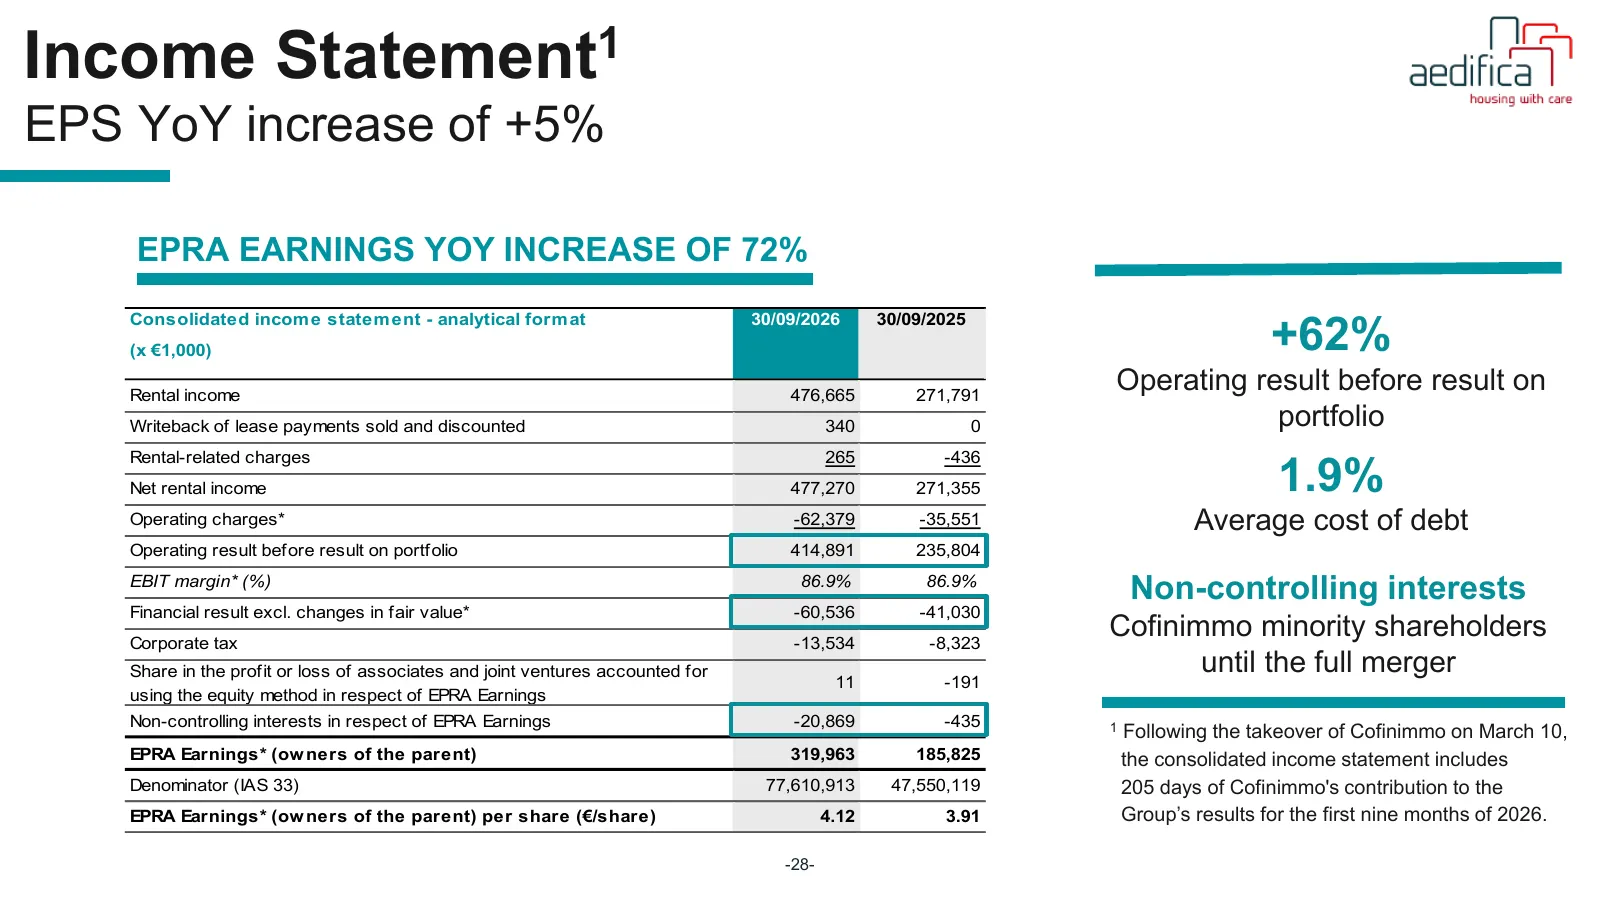
Income Statement1 EPS YoY increase of +5% EPRA EARNINGS YOY INCREASE OF 72% +62% Consolidated incom e statem ent - analytical form at 30/09/2026 30/09/2025 (x €1,000) Rental income 476,665 271,791 Operating result before result on Writeback of lease payments sold and discounted 340 0 portfolio Renta
Slide 29: Income Statement: net result
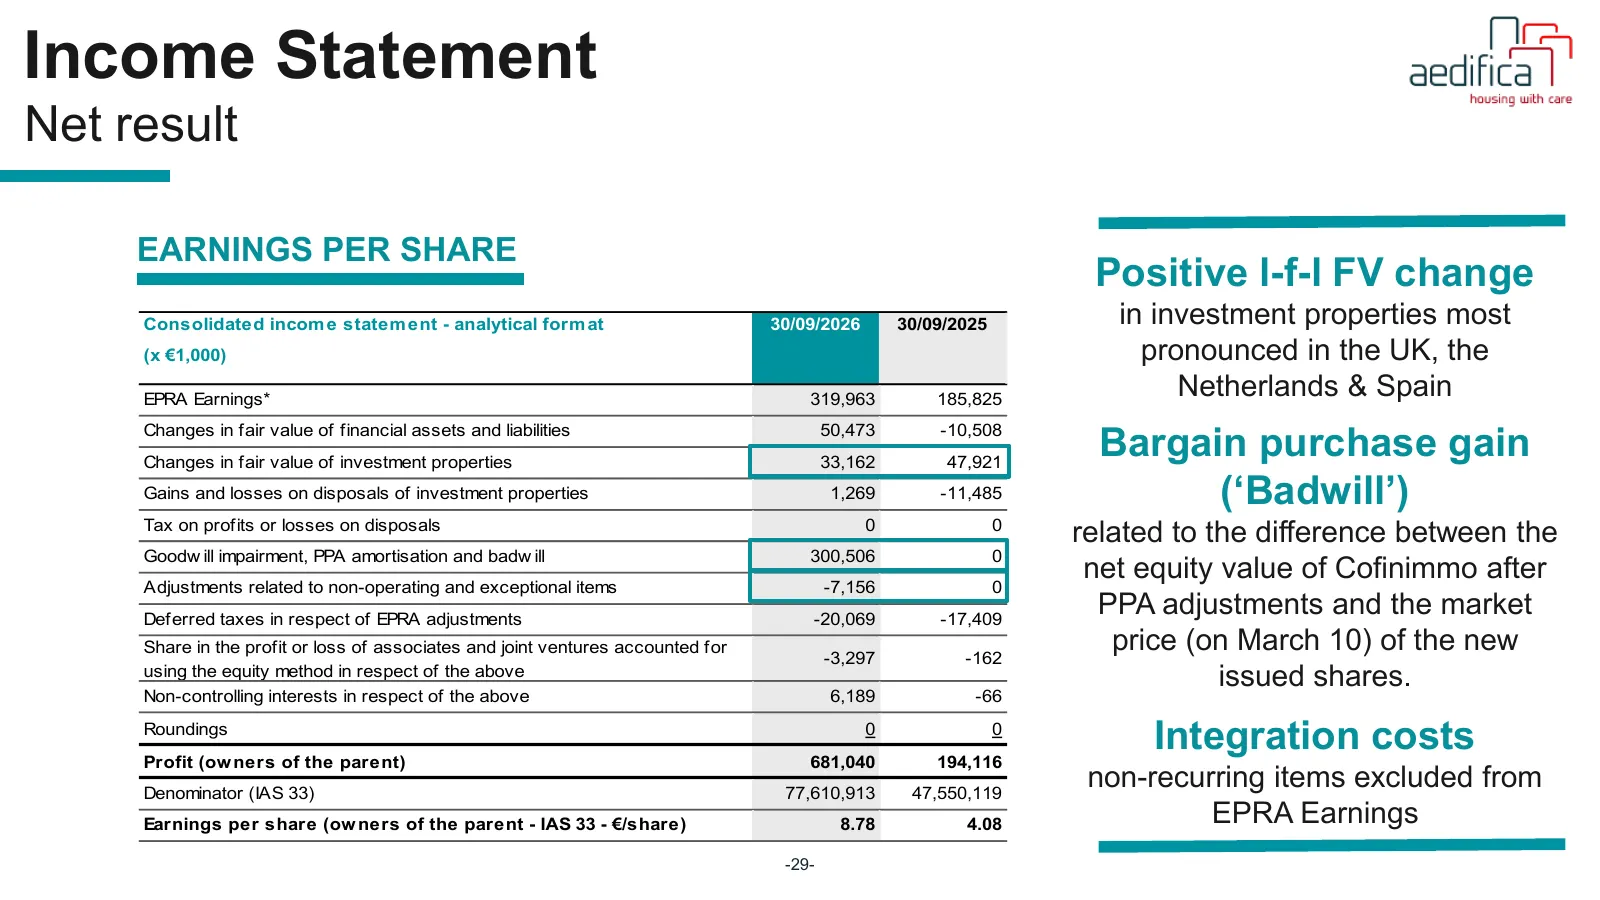
Income Statement Net result EARNINGS PER SHARE Positive l-f-l FV change Consolidated incom e statem ent - analytical form at 30/09/2026 30/09/2025 in investment properties most (x €1,000) pronounced in the UK, the EPRA Earnings* 319,963 185,825 Netherlands & Spain Changes in fair value of financial
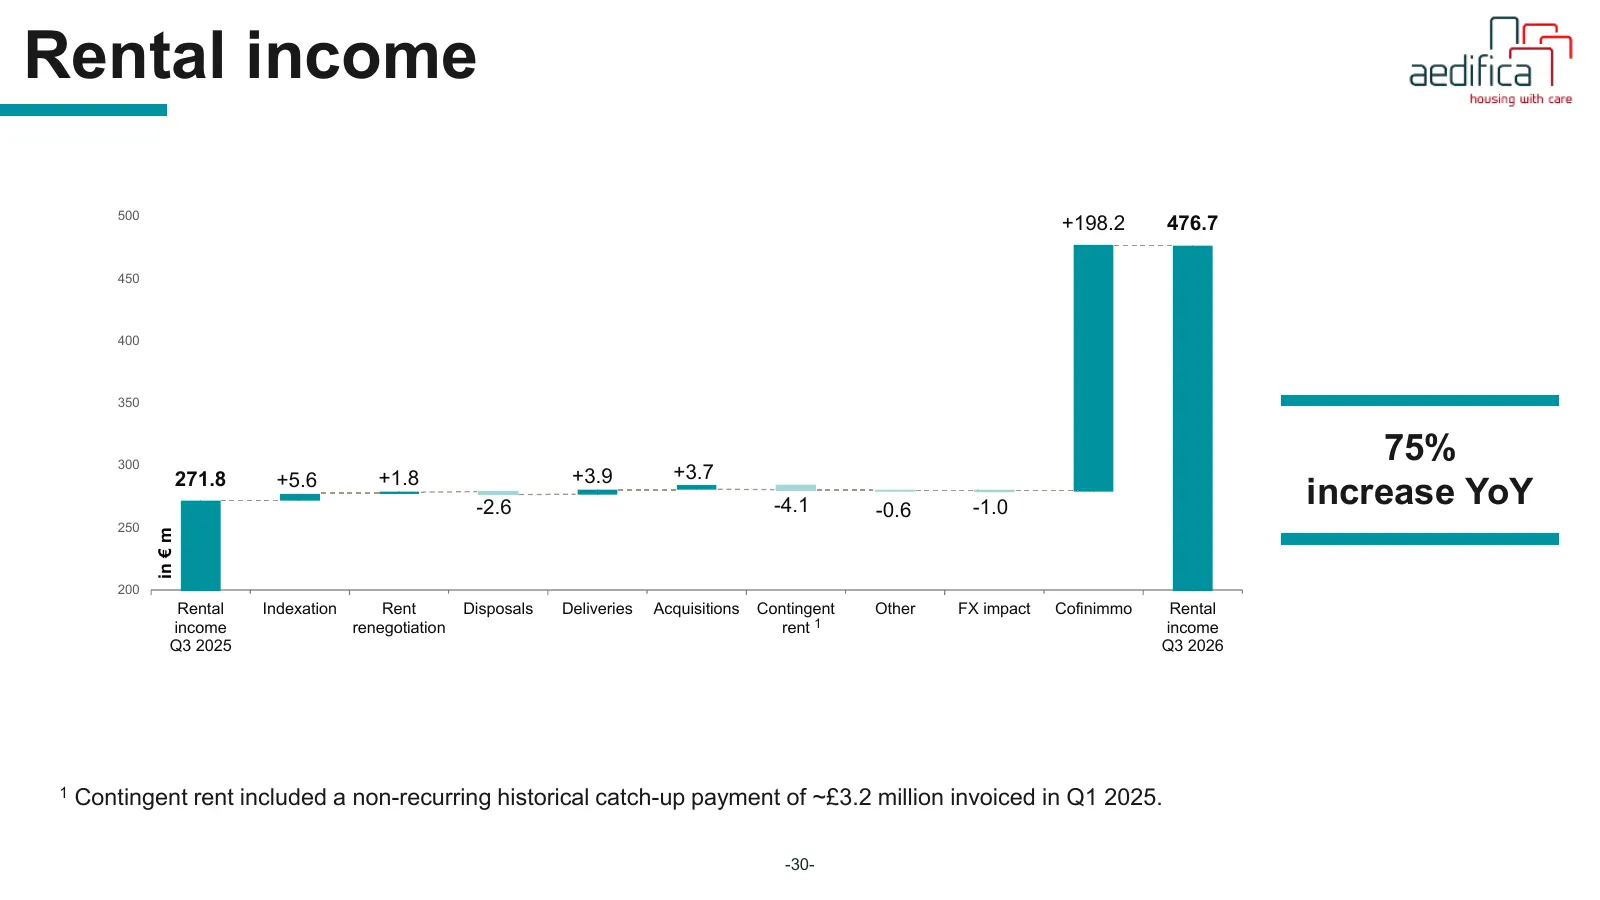
Slide 30: Rental income
Rental income 500 +198.2 476.7 450 400 350 300 75% 271.8 +5.6 +1.8 +3.9 +3.7 -2.6 -4.1 -0.6 -1.0 increase YoY 250 in € m 200 Rental Indexation Rent Disposals Deliveries Acquisitions Contingent Other FX impact Cofinimmo Rental income renegotiation rent 1 income Q3 2025 Q3 2026 1 Contingent rent inclu
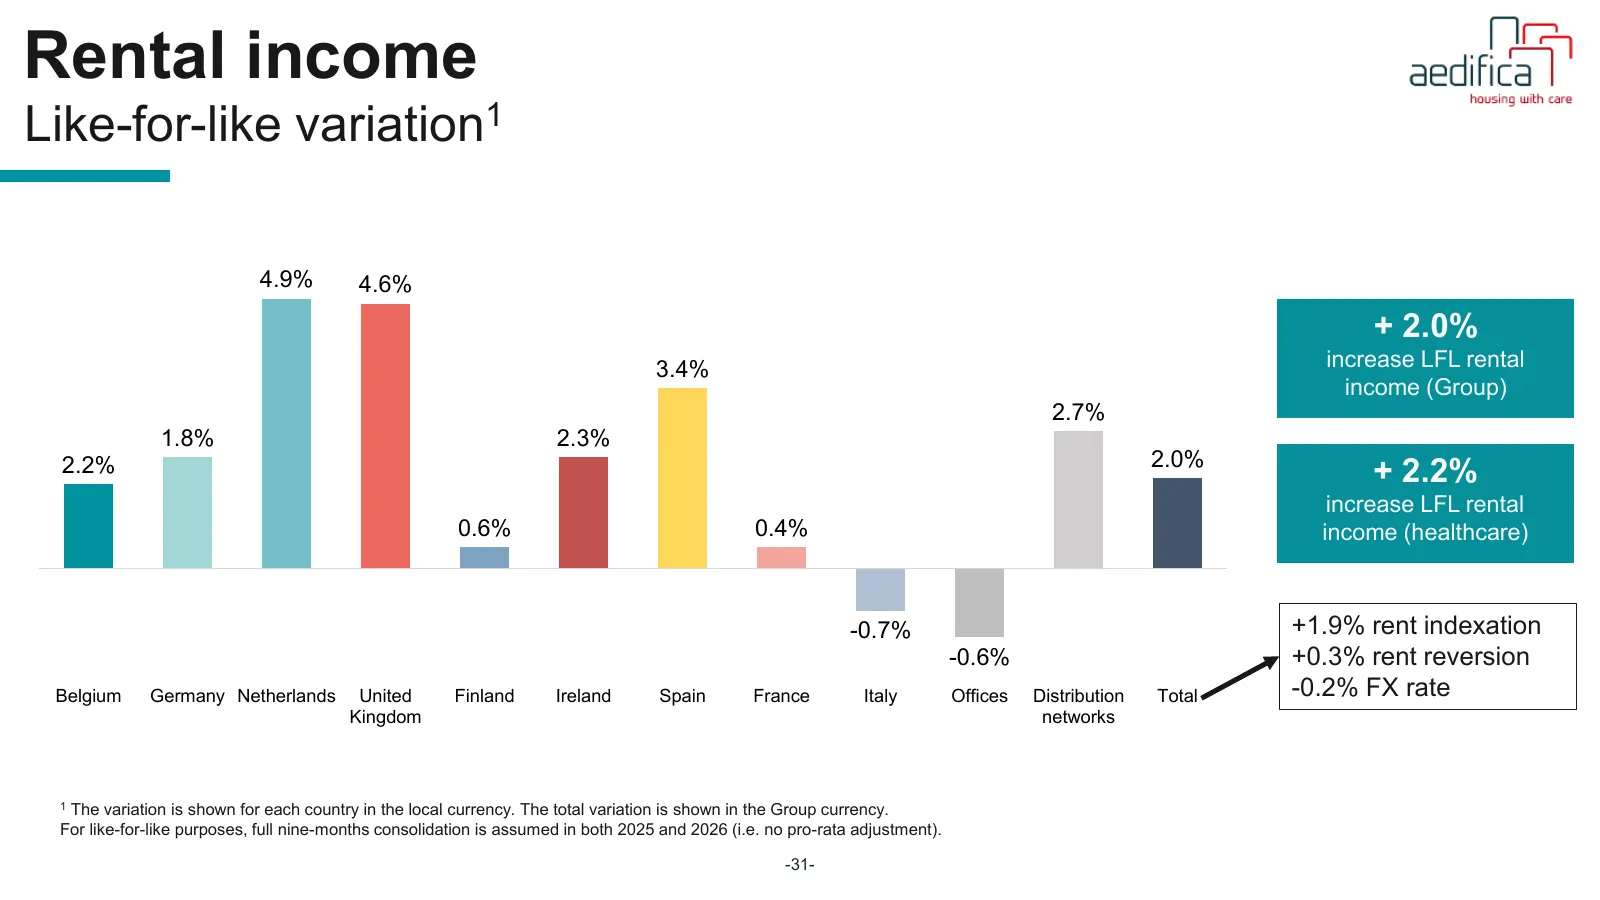
Slide 31: Rental income: like-for-like variation
Rental income Like-for-like variation1 4.9% 4.6% + 2.0% 3.4% increase LFL rental income (Group) 2.7% 1.8% 2.3% 2.2% 2.0% + 2.2% increase LFL rental 0.6% 0.4% income (healthcare) -0.7% +1.9% rent indexation -0.6% +0.3% rent reversion Belgium Germany Netherlands United Finland Ireland Spain France Ita
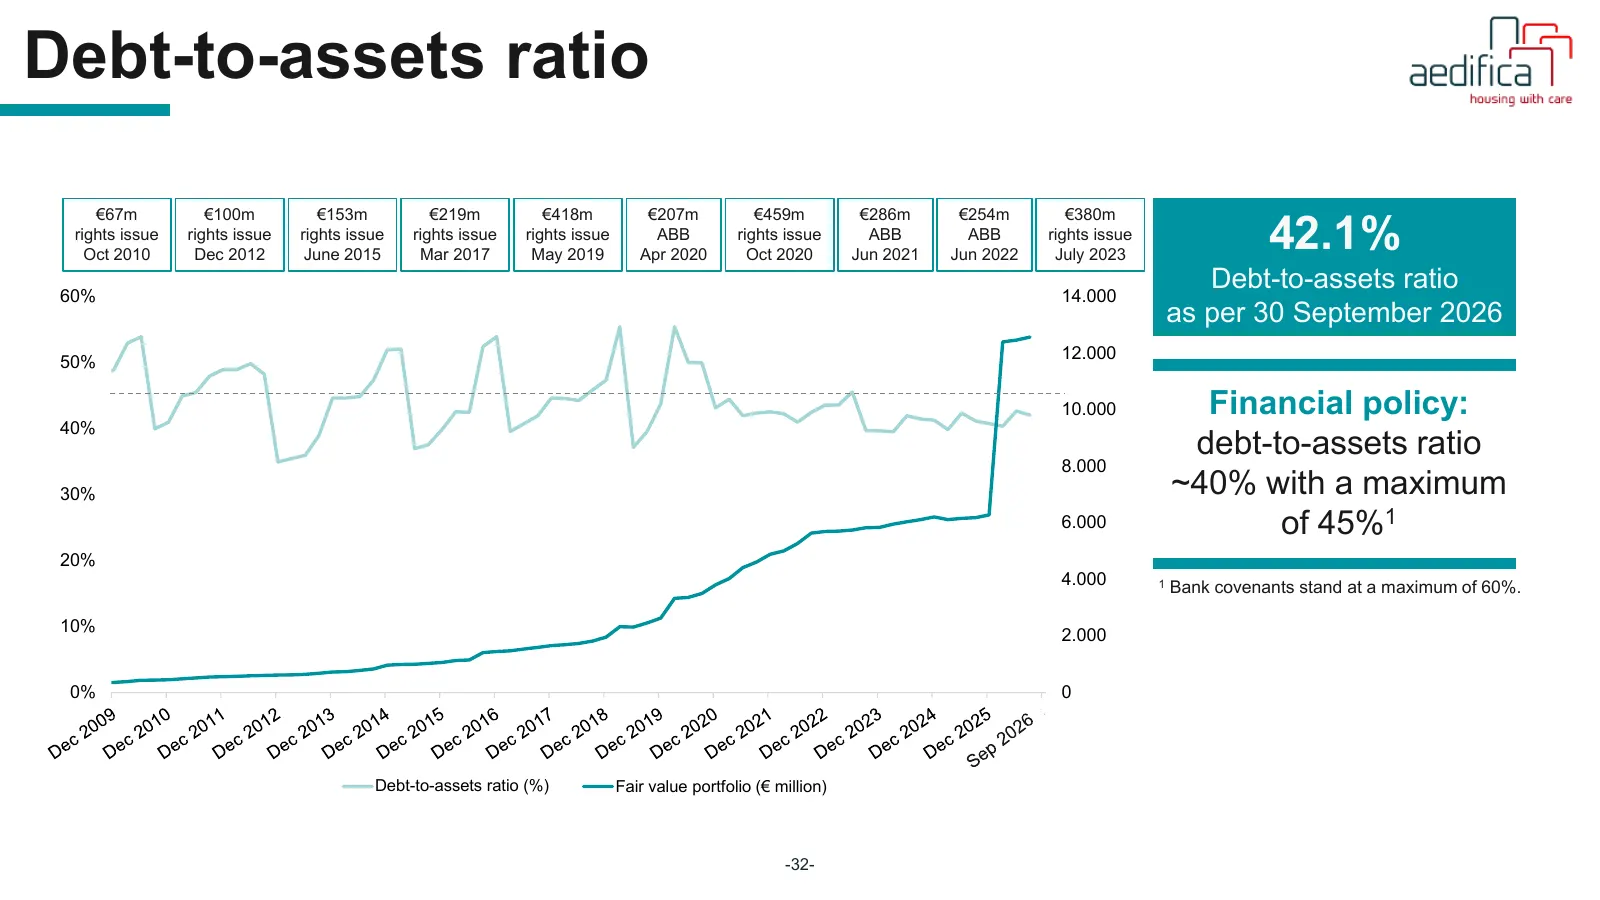
Slide 32: Debt-to-assets ratio
Debt-to-assets ratio €67m €100m €153m €219m €418m €207m €459m €286m €254m €380m rights issue Oct 2010 rights issue Dec 2012 rights issue June 2015 rights issue Mar 2017 rights issue May 2019 ABB Apr 2020 rights issue Oct 2020 ABB Jun 2021 ABB Jun 2022 rights issue July 2023 42.1% Debt-to-assets rati
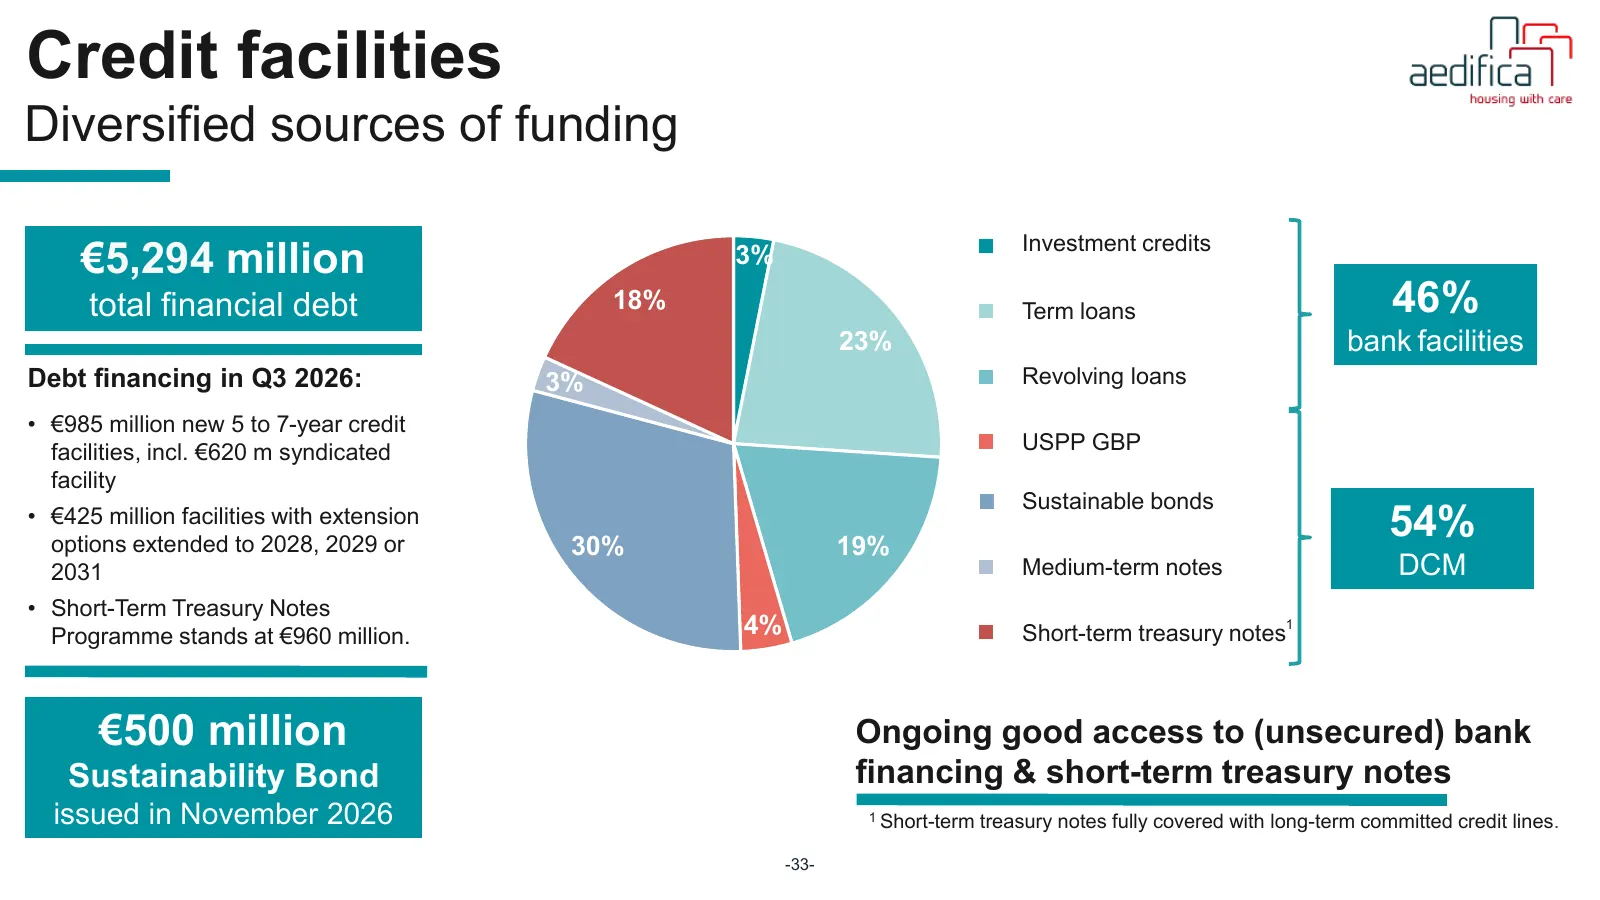
Slide 33: Credit facilities
Credit facilities Diversified sources of funding Investment Investment credits €5,294 million 3% credits total financial debt 18% Term Term loans loans 46% 23% bank facilities Debt financing in Q3 2026: 3% Revolving loans Revolving • €985 million new 5 to 7-year credit USPP GBP GBP facilities, incl.
Slide 34: Credit rating & KPI's
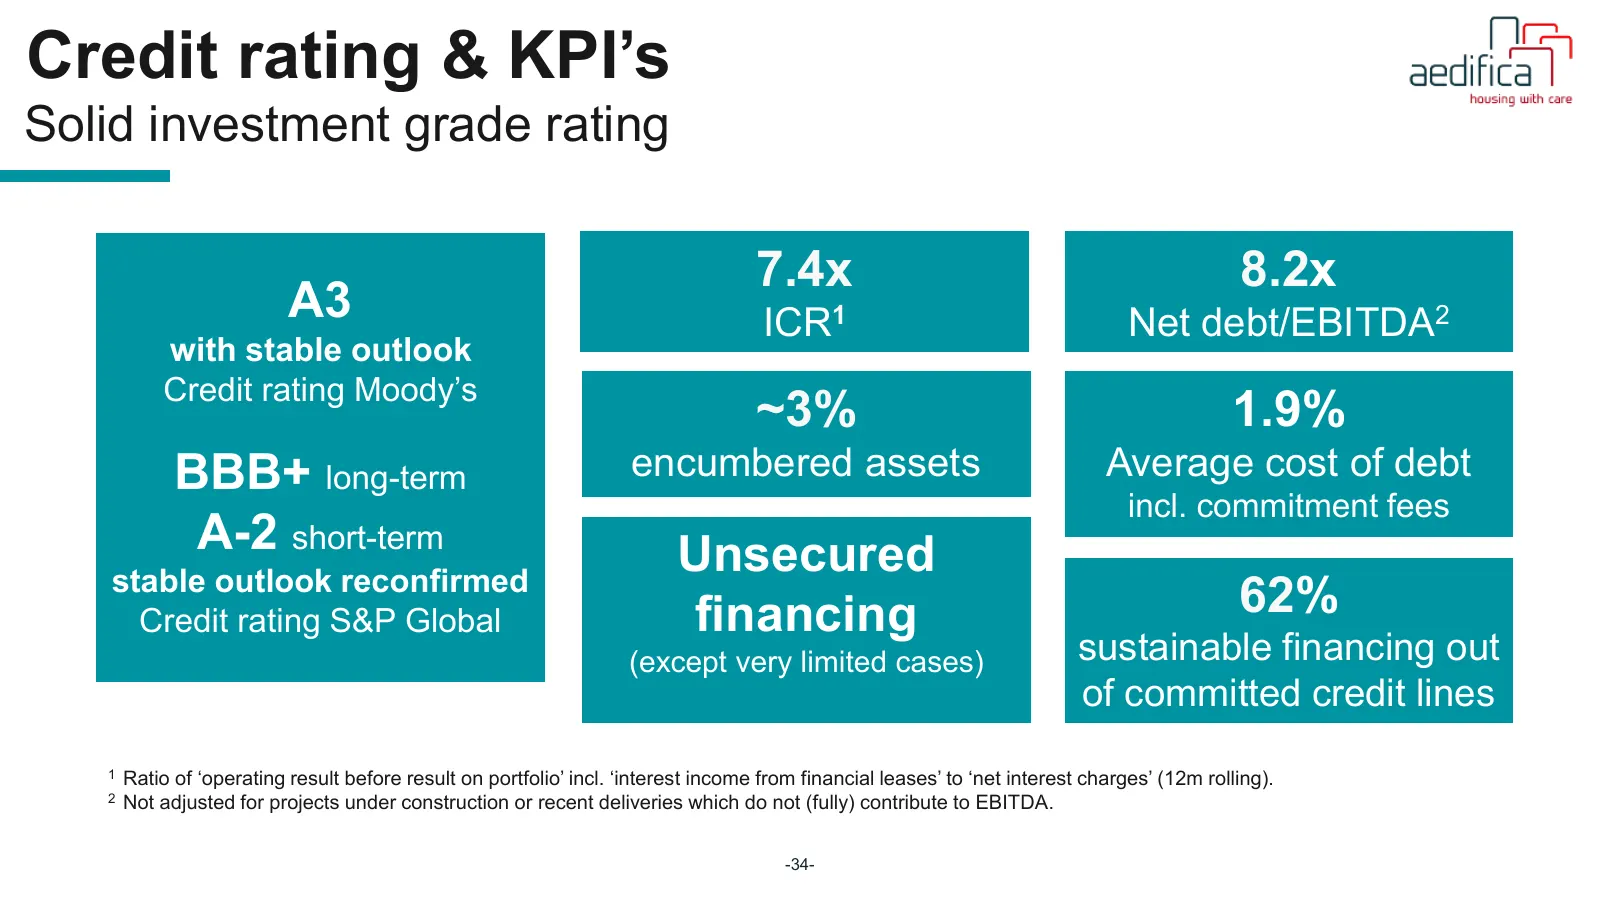
Credit rating & KPI’s Solid investment grade rating 7.4x 8.2x A3 ICR1 Net debt/EBITDA2 with stable outlook Credit rating Moody’s ~3% 1.9% BBB+ long-term encumbered assets Average cost of debt incl. commitment fees A-2 short-term Unsecured stable outlook reconfirmed Credit rating S&P Global financing
Slide 35: Credit facilities: debt maturity profile
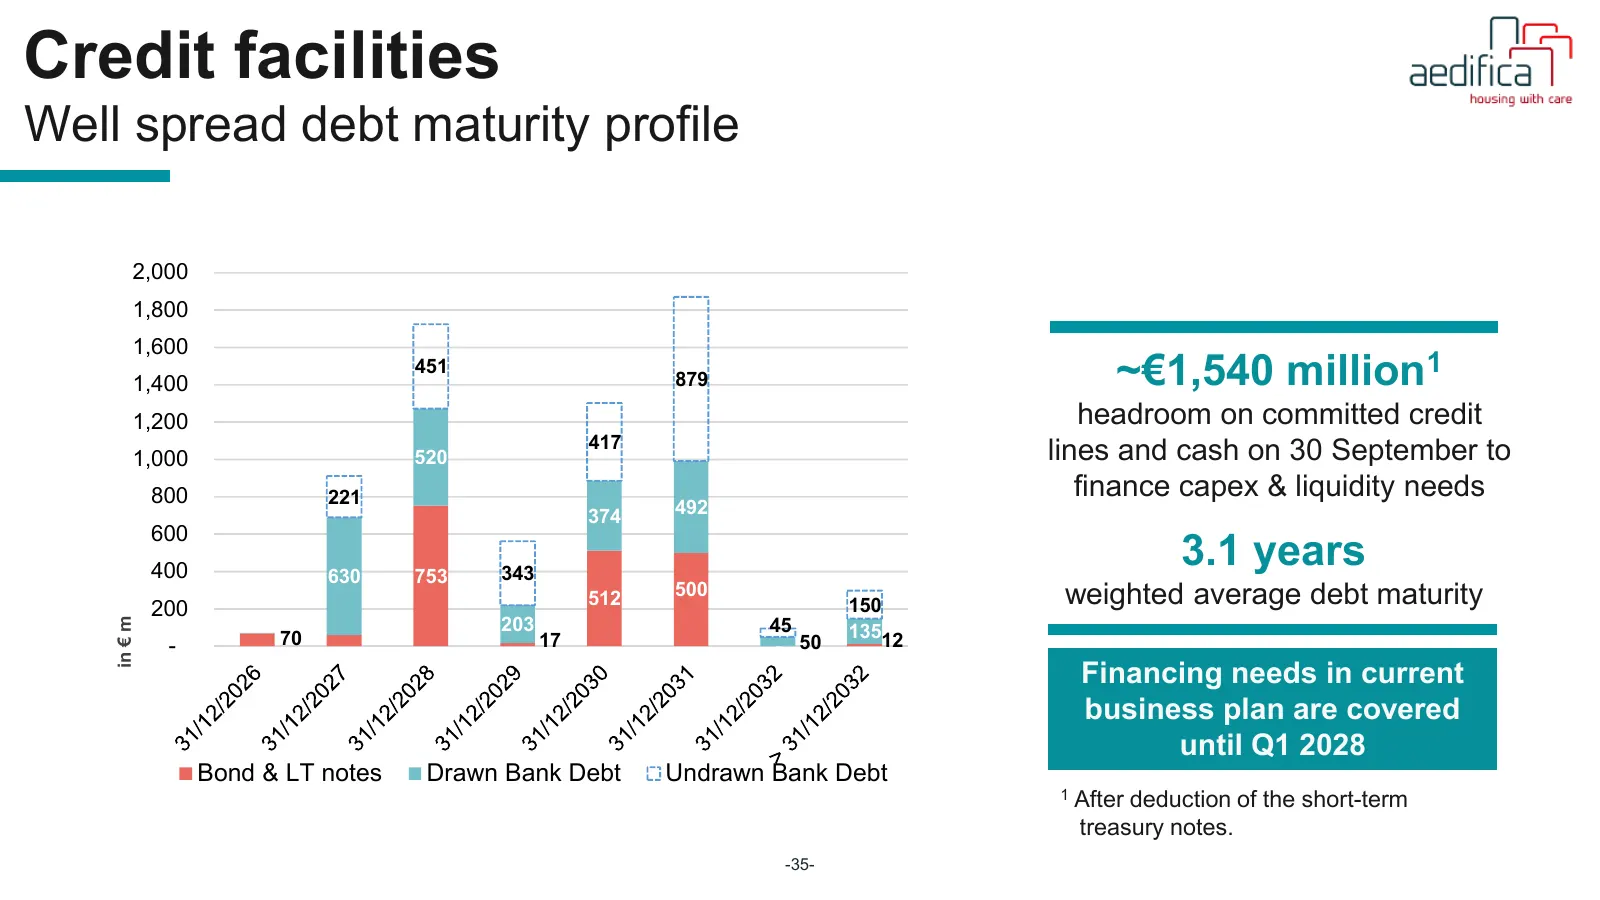
Credit facilities Well spread debt maturity profile 2,000 1,800 1,600 1,400 451 879 ~€1,540 million1 1,200 headroom on committed credit 417 1,000 520 lines and cash on 30 September to 800 221 finance capex & liquidity needs 374 492 600 400 630 753 343 3.1 years 200 512 500 150 weighted average debt
Slide 36: Credit facilities: interest rate hedging
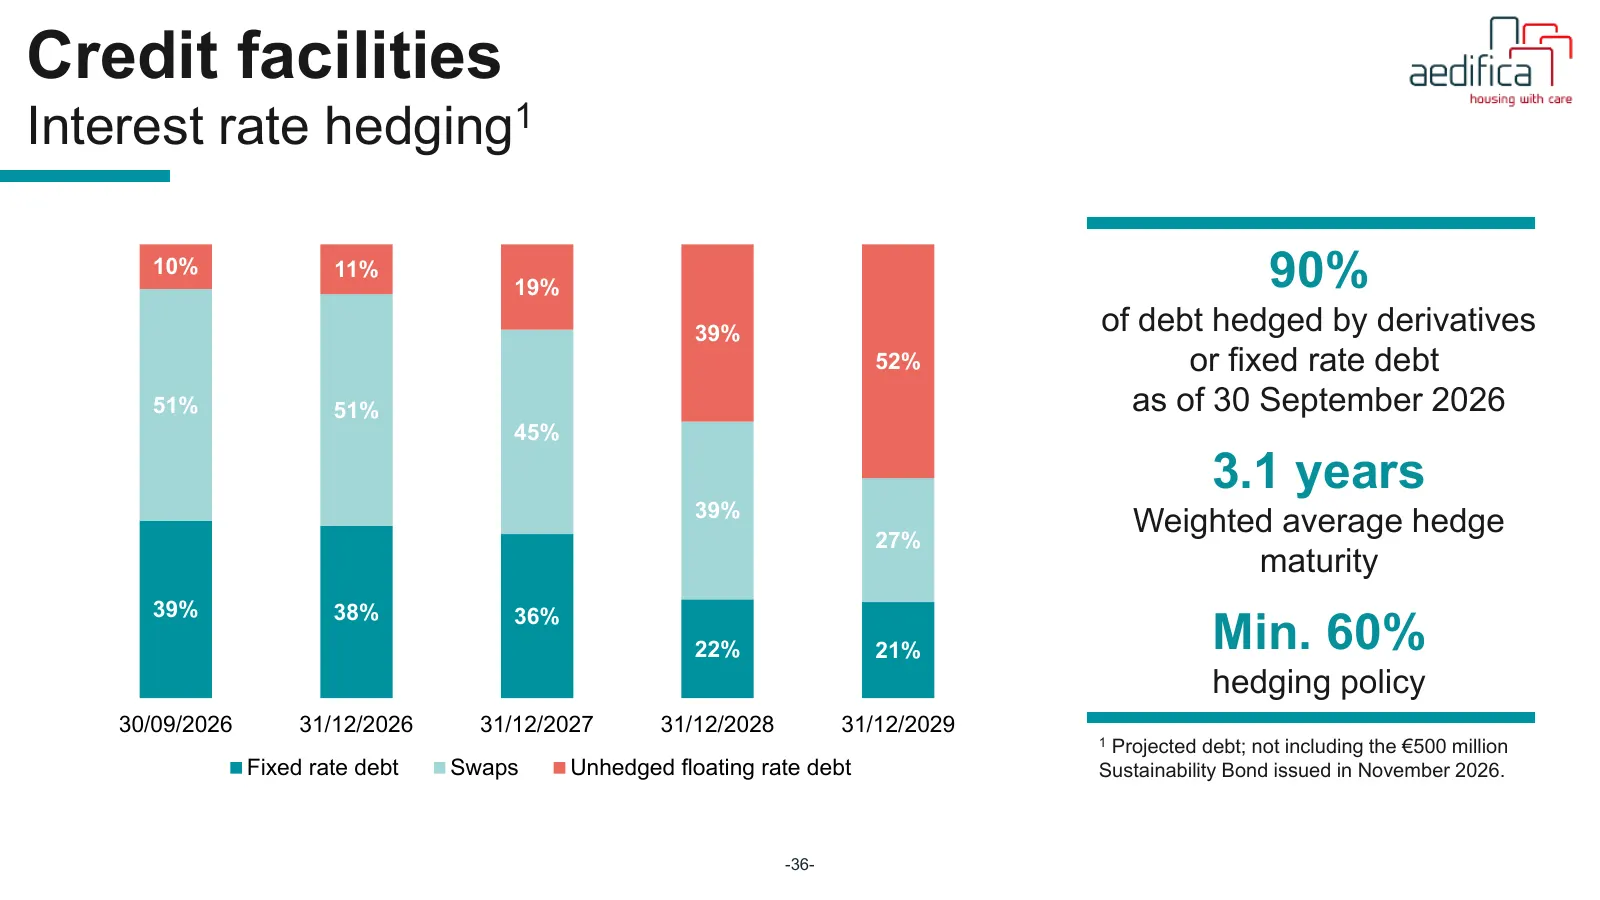
Credit facilities Interest rate hedging1 10% 11% 19% 90% 39% of debt hedged by derivatives 52% or fixed rate debt 51% 51% as of 30 September 2026 45% 3.1 years 39% 27% Weighted average hedge maturity 39% 38% 36% 22% 21% Min. 60% hedging policy 30/09/2026 31/12/2026 31/12/2027 31/12/2028 31/12/2029 1
Slide 37: Net asset value
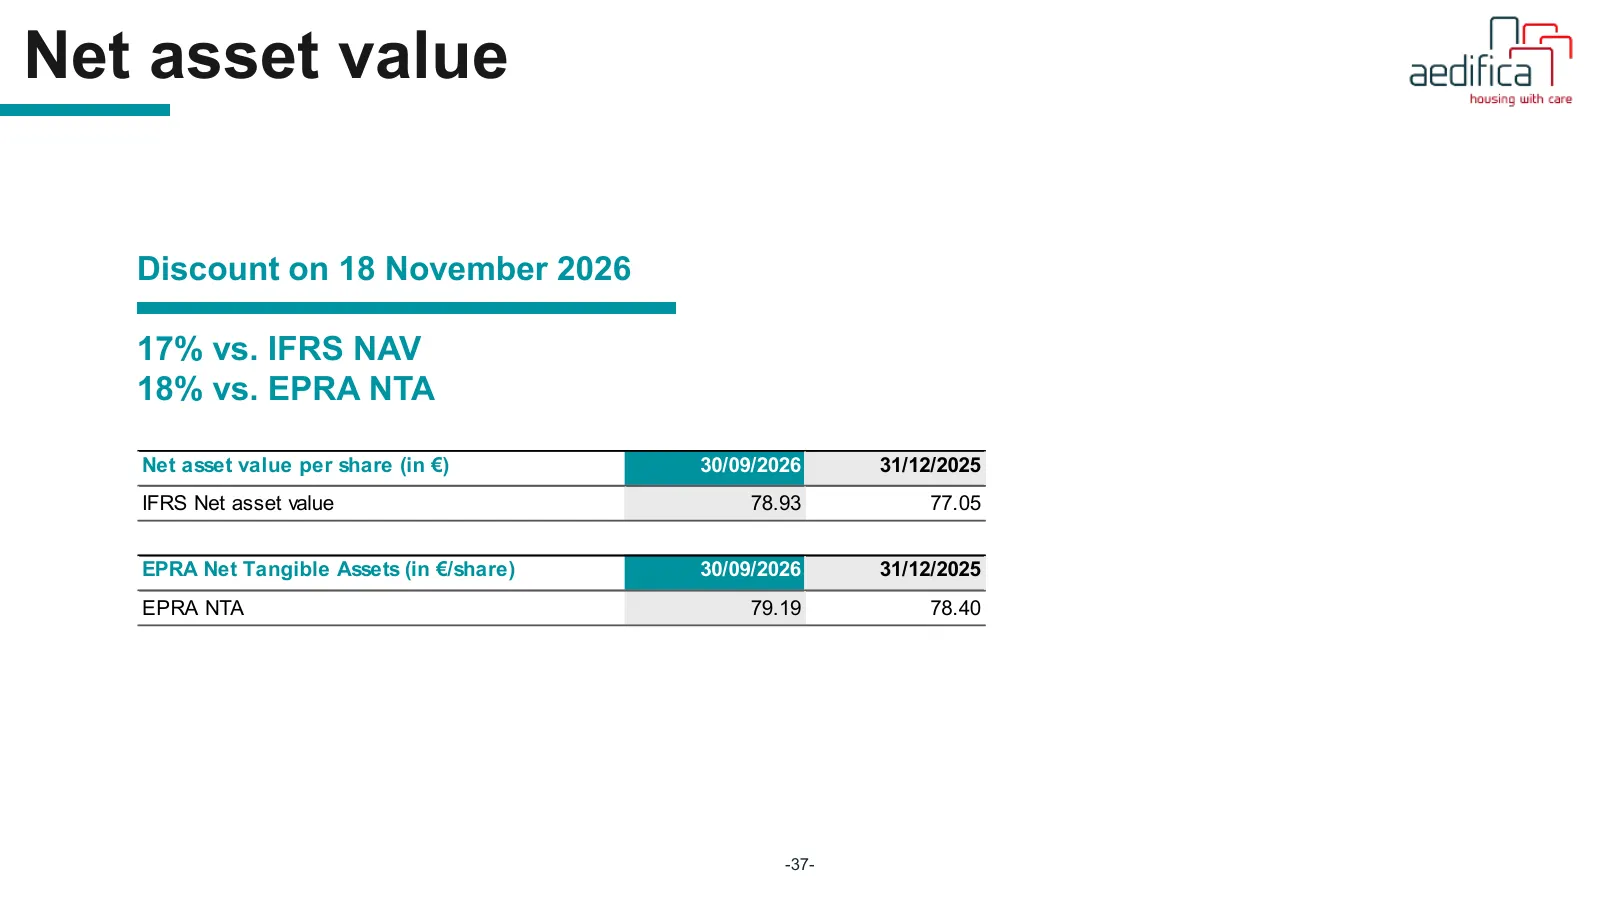
Net asset value Discount on 18 November 2026 17% vs. IFRS NAV 18% vs. EPRA NTA Net asset value per share (in €) 30/09/2026 31/12/2025 IFRS Net asset value 78.93 77.05 EPRA Net Tangible Assets (in €/share) 30/09/2026 31/12/2025 EPRA NTA 79.19 78.40 -37-
Slide 38: Shares & shareholders
Shares & shareholders An der Zitadelle, Jülich - Germany -38-
Slide 39: Shareholding
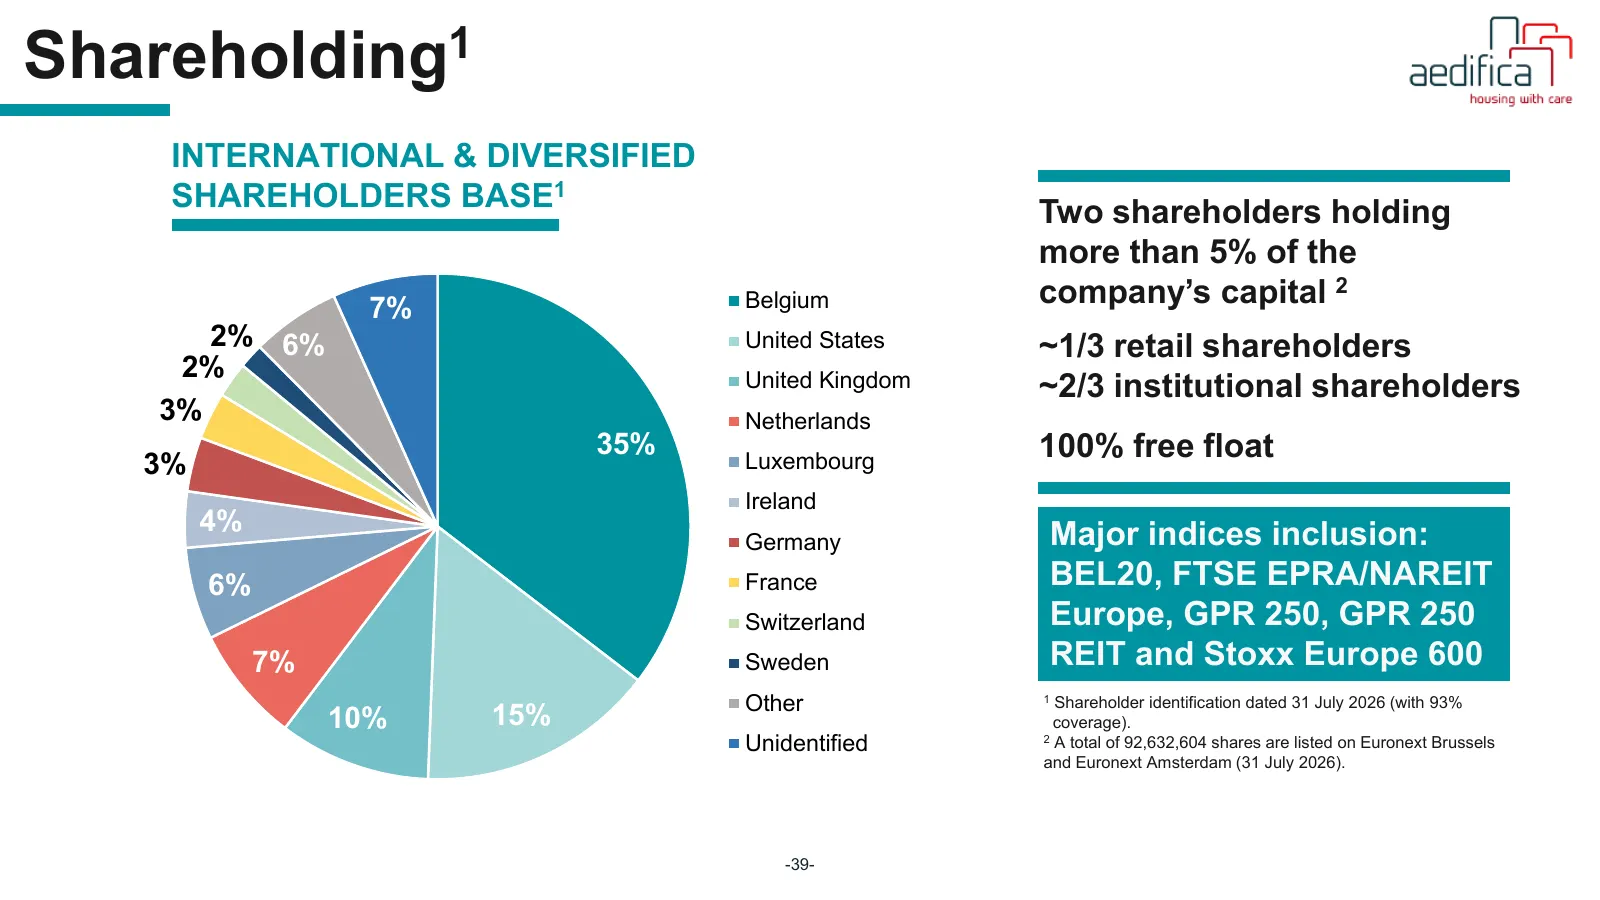
Shareholding1 INTERNATIONAL & DIVERSIFIED SHAREHOLDERS BASE1 Two shareholders holding more than 5% of the 7% Belgium company’s capital 2 2% 6% United States ~1/3 retail shareholders 2% United Kingdom ~2/3 institutional shareholders 3% Netherlands 35% 100% free float 3% Luxembourg Ireland 4% Major in
Slide 40: Outlook
Outlook Oulu Vaarapiha Oulu - Finland -40-
Slide 41: Outlook 2026
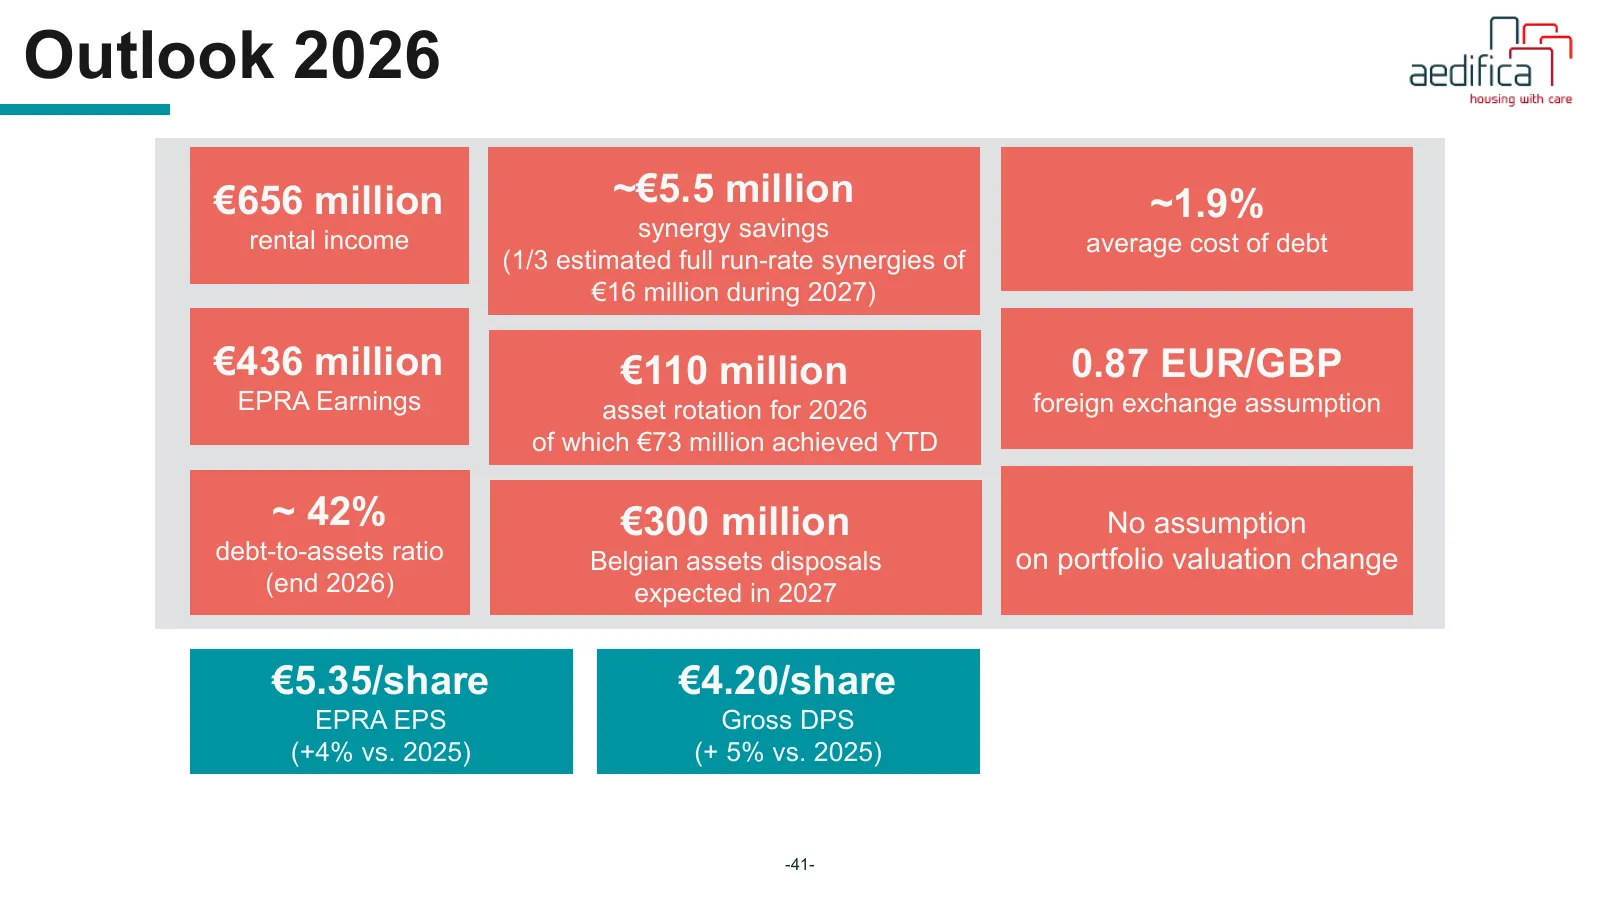
Outlook 2026 €656 million ~€5.5 million ~1.9% rental income synergy savings average cost of debt (1/3 estimated full run-rate synergies of €16 million during 2027) €436 million €110 million 0.87 EUR/GBP EPRA Earnings asset rotation for 2026 foreign exchange assumption of which €73 million achieved Y
Slide 42: Outlook: drivers for future growth
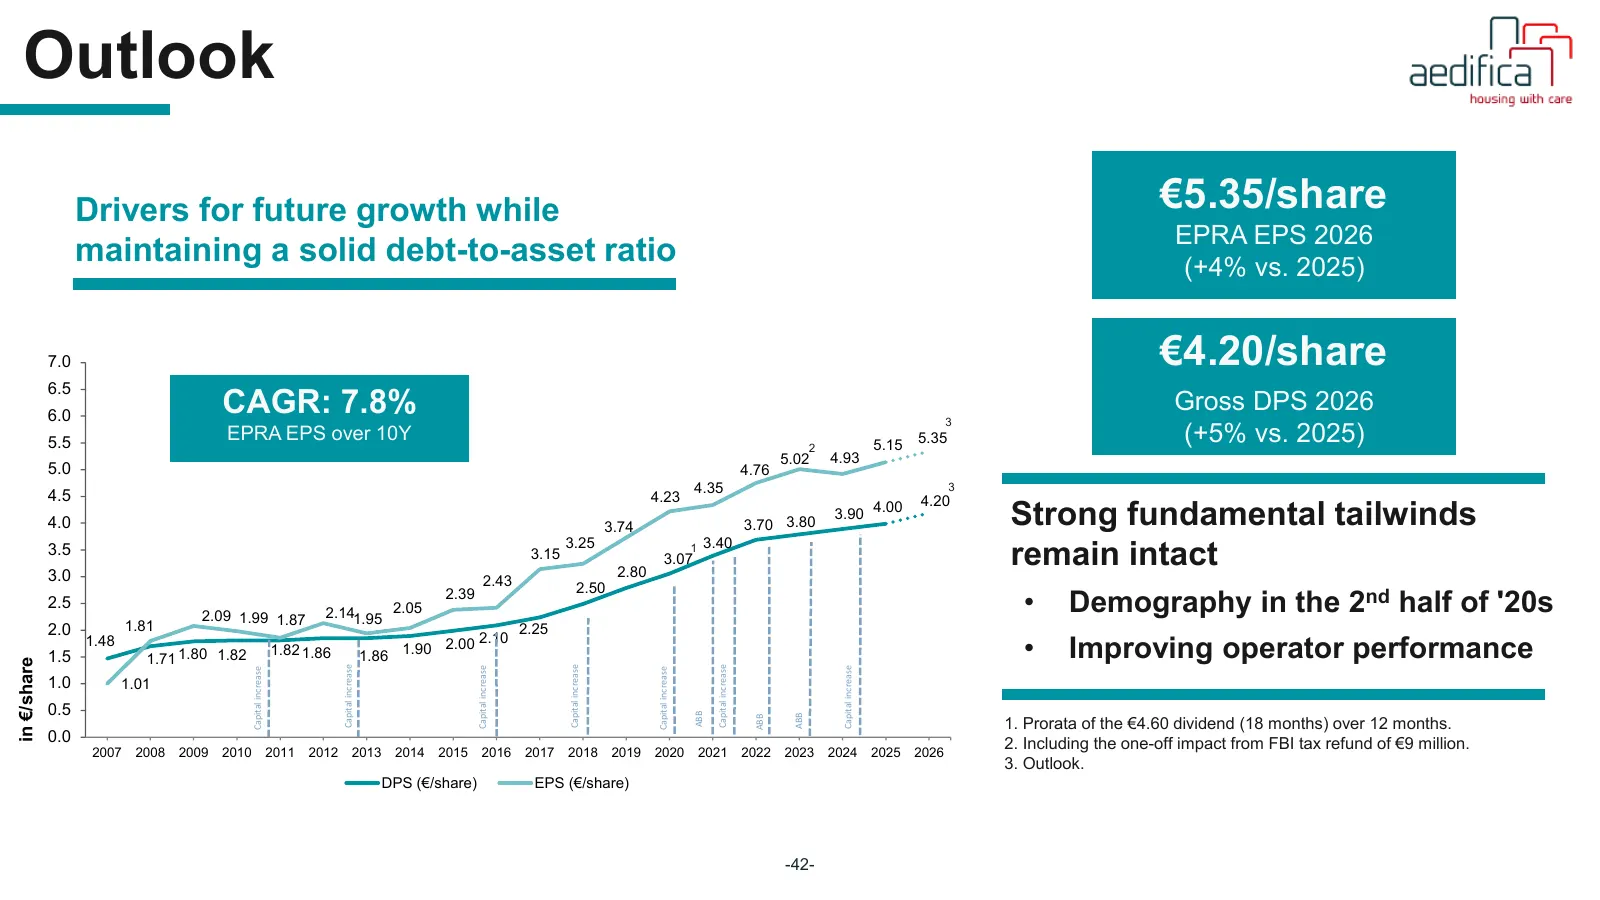
Outlook Drivers for future growth while €5.35/share EPRA EPS 2026 maintaining a solid debt-to-asset ratio (+4% vs. 2025) 7.0 €4.20/share 6.5 6.0 CAGR: 7.8% 3 Gross DPS 2026 5.5 EPRA EPS over 10Y 2 5.15 5.35 (+5% vs. 2025) 5.02 4.93 5.0 4.76 4.35 3 4.5 4.23 4.20 4.0 3.74 3.70 3.80 3.90 4.00 Strong fu
Slide 43: Conclusion
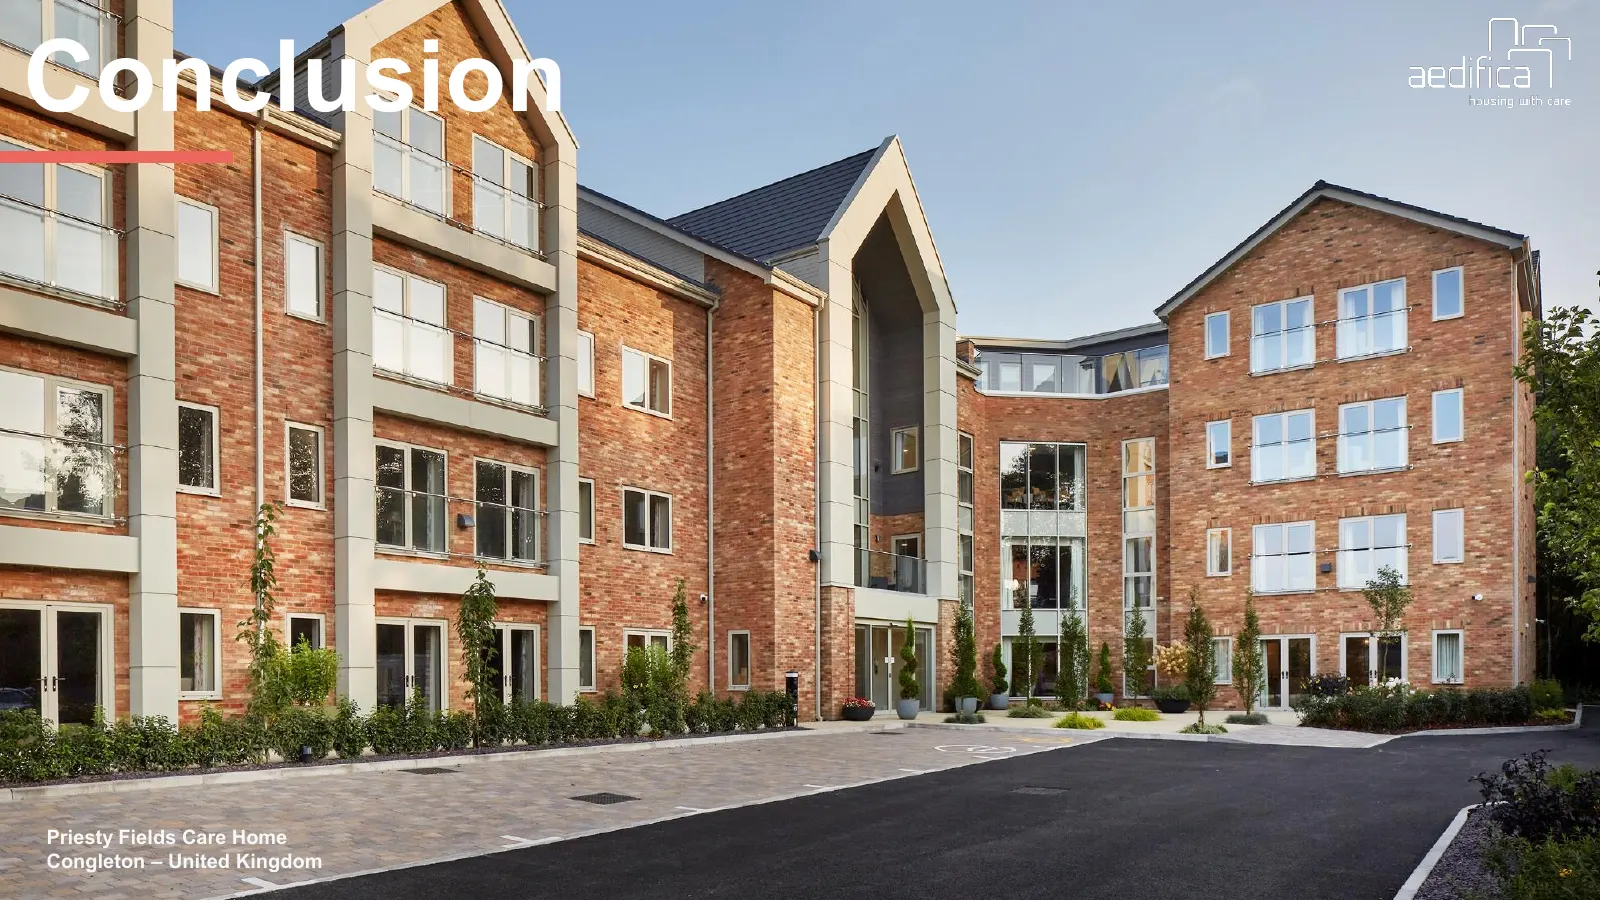
Conclusion Priesty Fields Care Home Congleton – United Kingdom -43-
Slide 44: Investment highlights
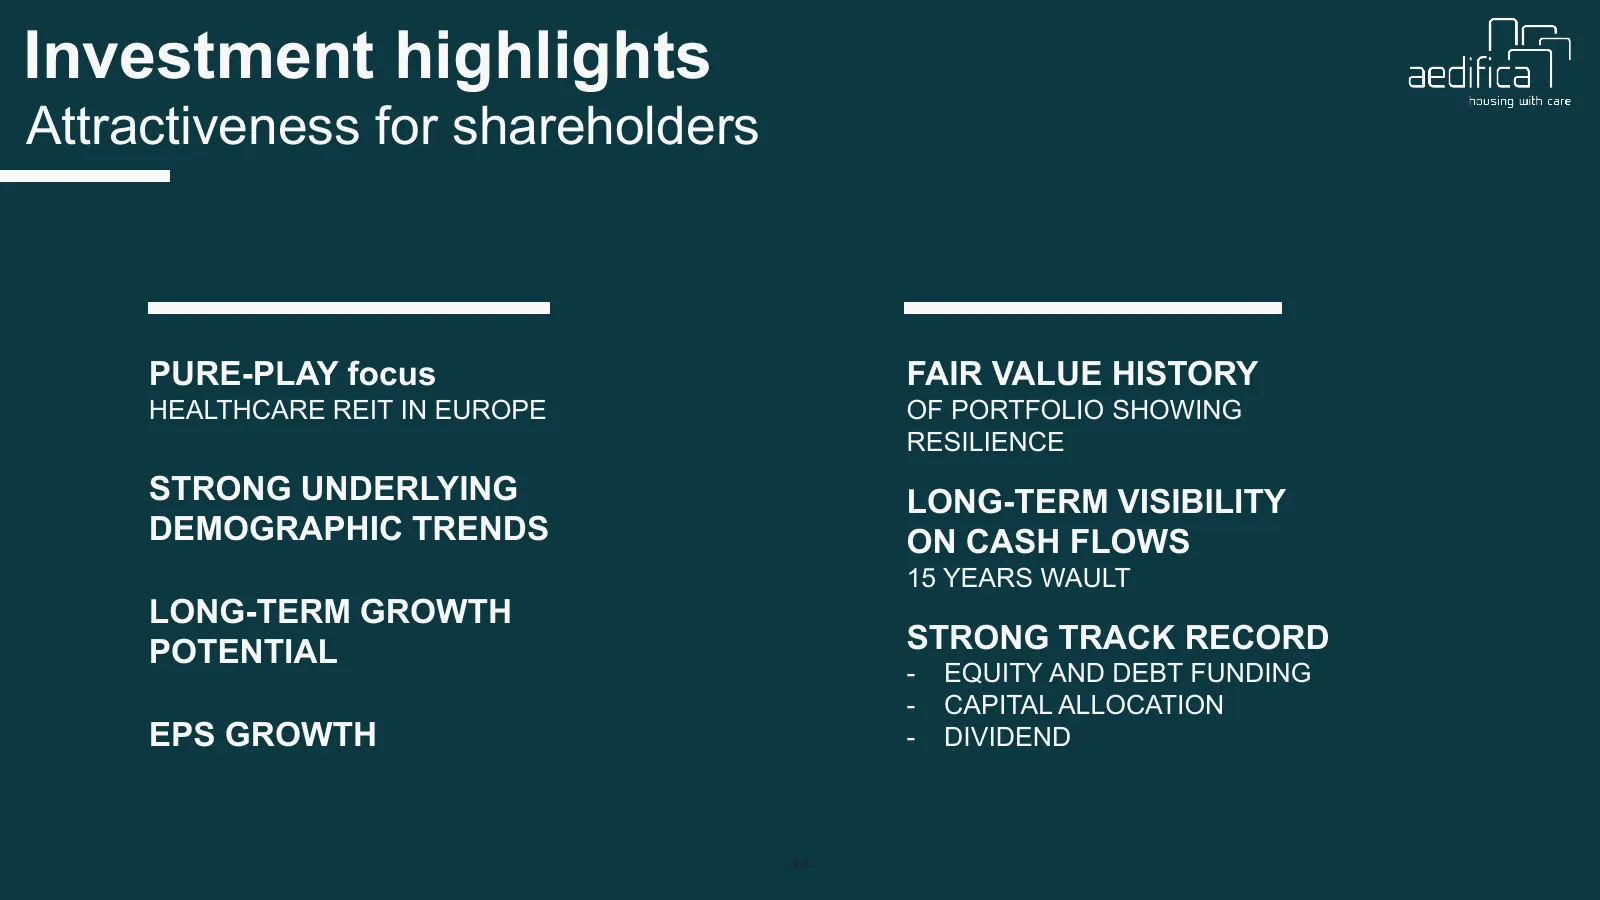
Investment highlights Attractiveness for shareholders PURE-PLAY focus FAIR VALUE HISTORY HEALTHCARE REIT IN EUROPE OF PORTFOLIO SHOWING RESILIENCE STRONG UNDERLYING LONG-TERM VISIBILITY DEMOGRAPHIC TRENDS ON CASH FLOWS 15 YEARS WAULT LONG-TERM GROWTH POTENTIAL STRONG TRACK RECORD - EQUITY AND DEBT F

Slide 45: Thank you
Thank you INVESTOR RELATIONS EVENTS 2026 ir@aedifica.eu Nov 24-25 Capital Markets Day – London Tervurenlaan 270 Avenue de Tervueren Dec 1 UBS Conference – London 1150 Brussels, Belgium https://aedifica.eu/investors/ Dates and participations are subject to change. The most up-to-date shareholder info
Slide 46: Stefaan Gielens - CEO, Ingrid Daerden - CFO
Stefaan Gielens - Chief Executive Officer Ingrid Daerden - Chief Financial Officer -46-
Slide 47: Aedifica SA/NV
Aedifica SA/NV Public REIT under Belgian Law Regulated Real Estate Company (RREC) Société immobilière réglementée (SIR) Gereglementeerde vastgoedvennootschap (GVV) Tervurenlaan 270 Avenue de Tervueren 1150 Brussels Tel: +32 (0)2 626 07 70 info@aedifica.eu - www.aedifica.eu A black background with a

Slide 48: Forward-looking statement
Forward-looking statement This Presentation includes forward-looking statements that reflect the Company's intentions, beliefs or current expectations concerning, among other things, the Company’s results, condition, performance, prospects, growth, strategies and the industry in which the Company op
Slide 49: Appendix
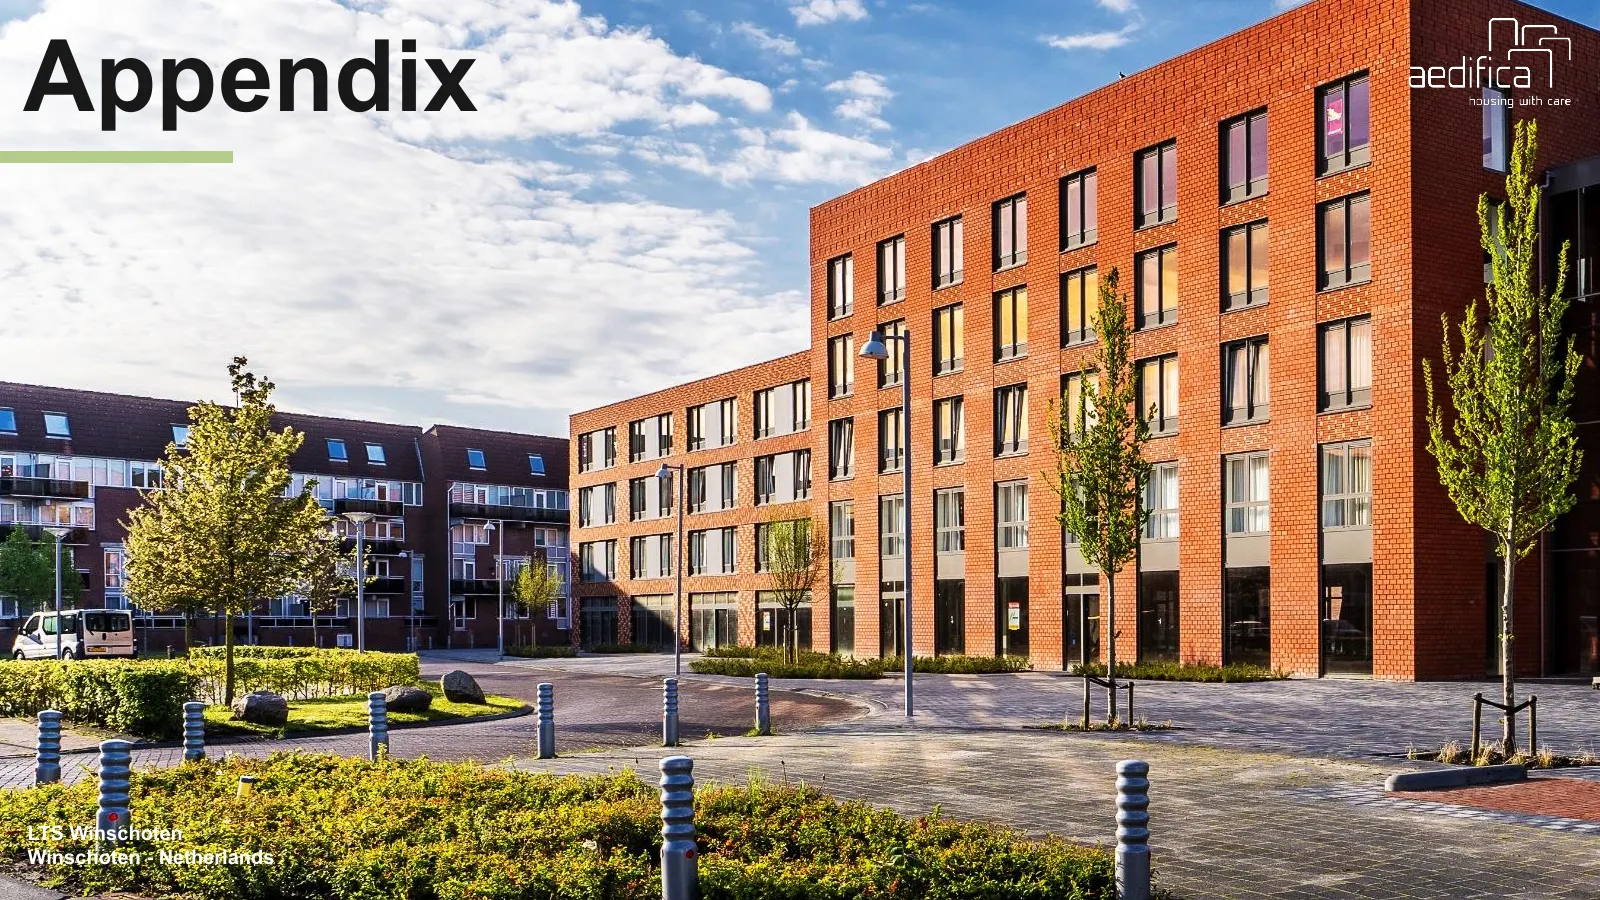
Appendix LTS Winschoten Winschoten - Netherlands -49-
Slide 50: Belgian healthcare portfolio
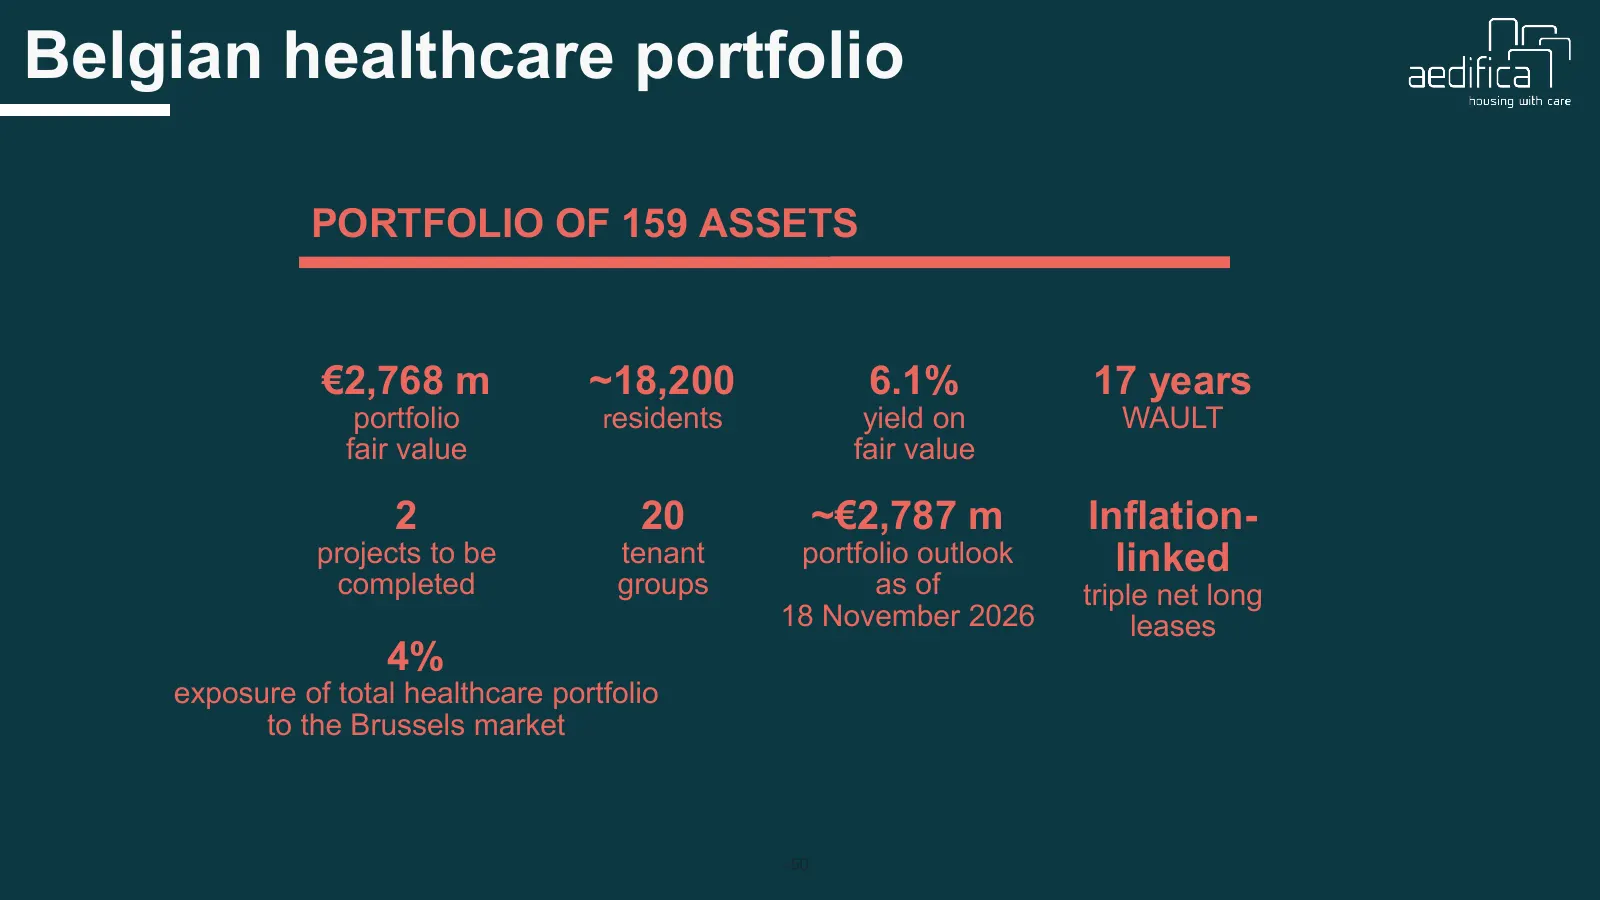
Belgian healthcare portfolio PORTFOLIO OF 159 ASSETS €2,768 m ~18,200 6.1% 17 years portfolio residents yield on WAULT fair value fair value 2 20 ~€2,787 m Inflation- projects to be tenant portfolio outlook linked completed groups as of triple net long 18 November 2026 leases 4% exposure of total he
Slide 51: Belgian healthcare portfolio
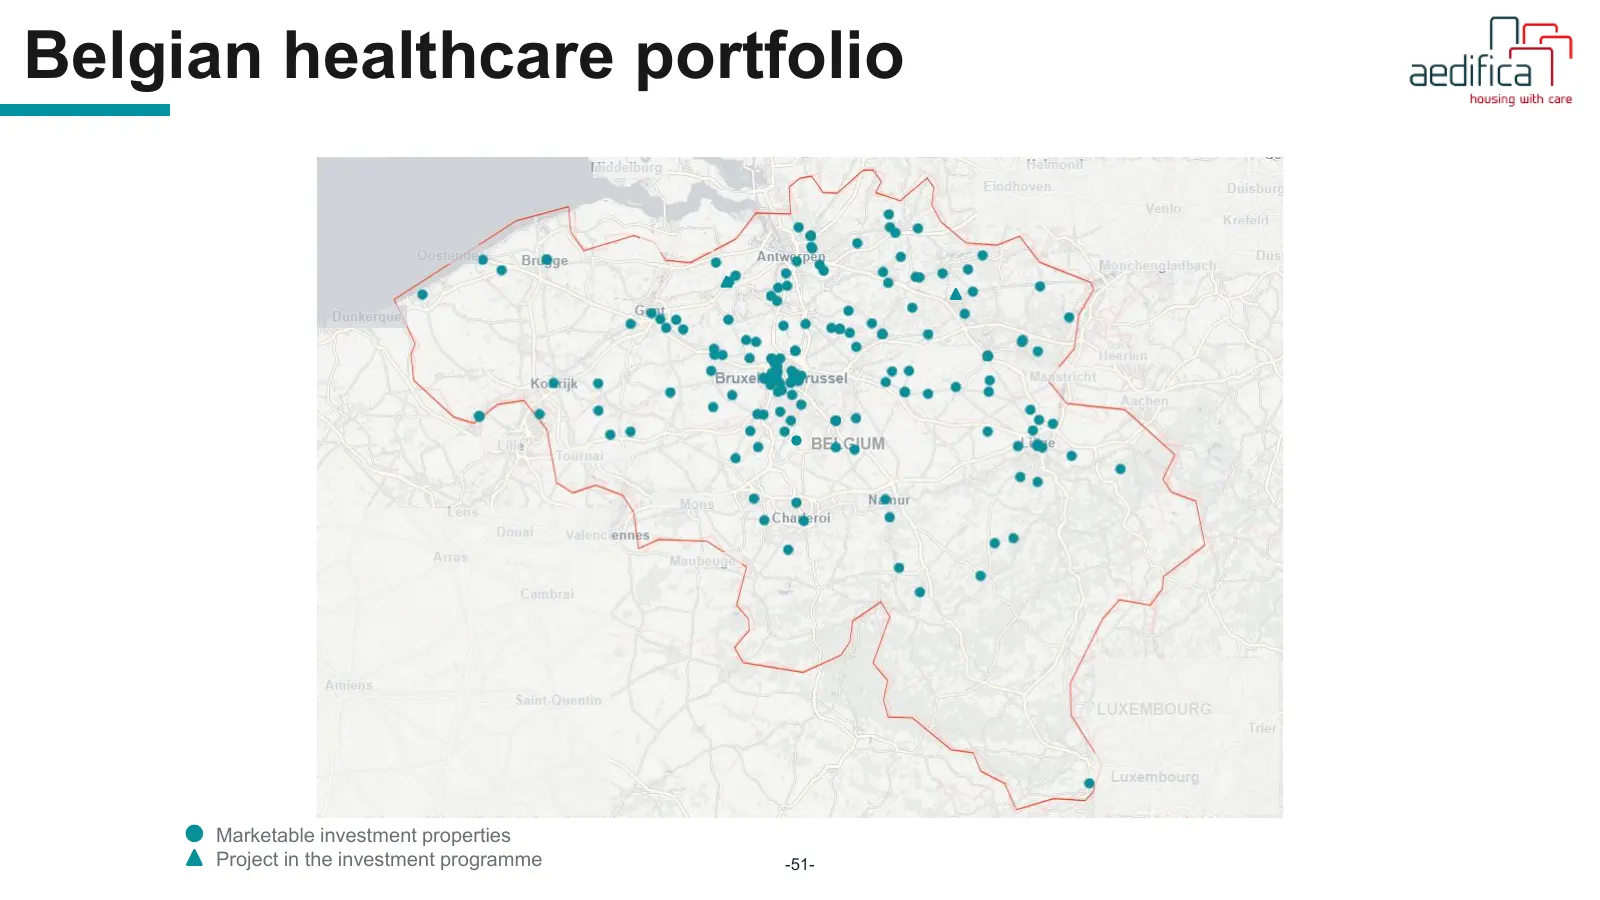
Belgian healthcare portfolio Marketable investment properties Project in the investment programme -51-
Slide 52: Belgian healthcare portfolio
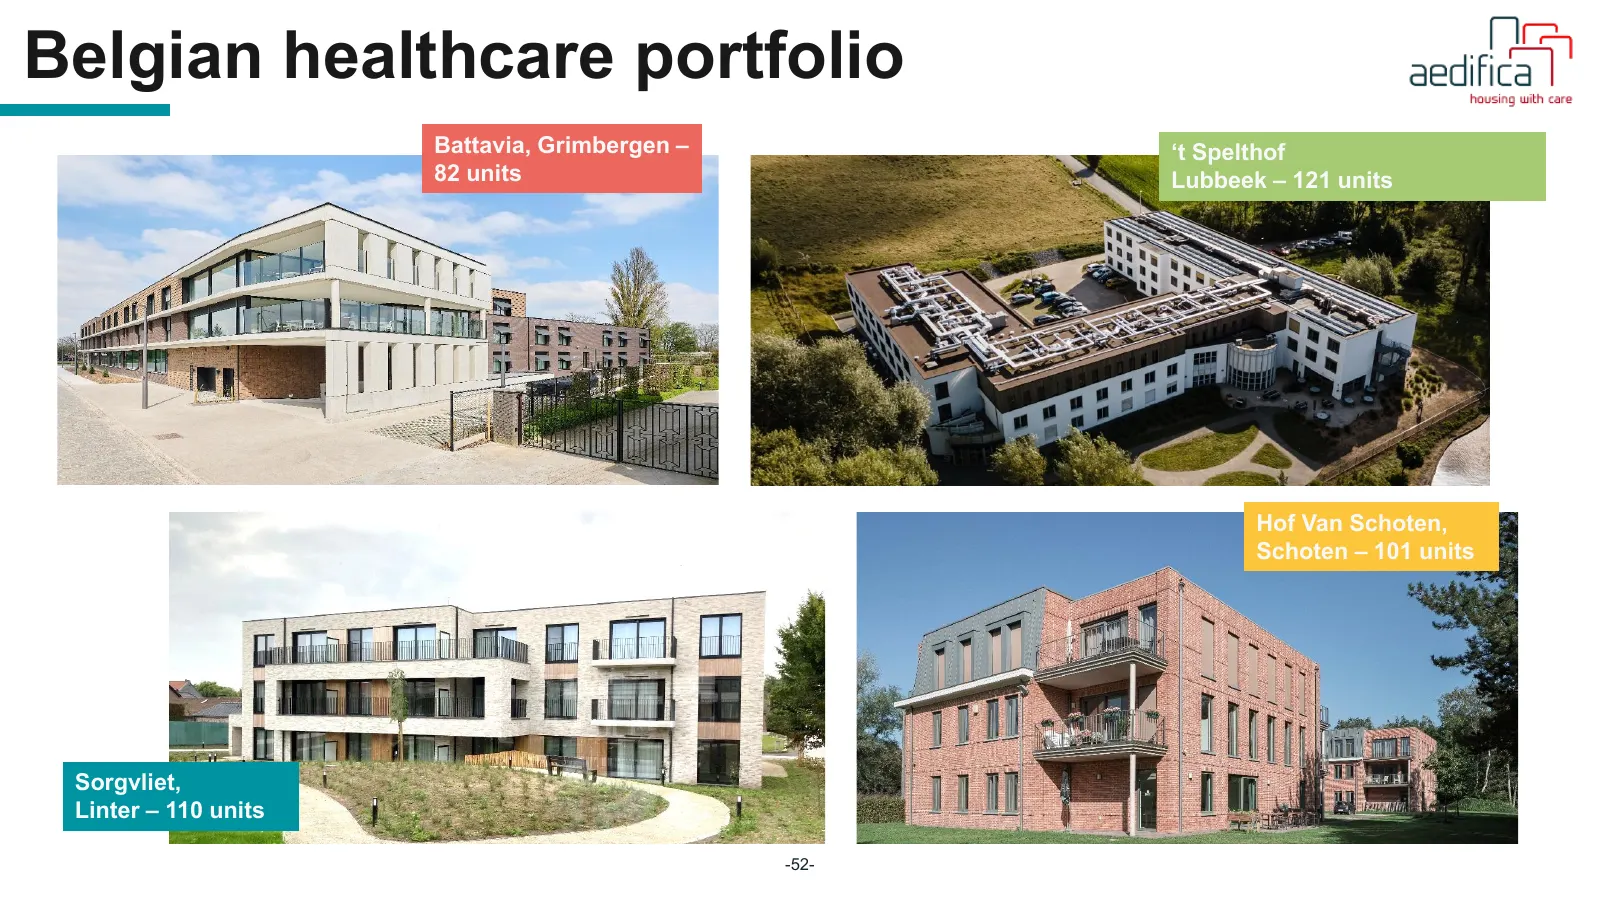
Belgian healthcare portfolio Battavia, Grimbergen – ‘t Spelthof 82 units Lubbeek – 121 units Hof Van Schoten, Schoten – 101 units Sorgvliet, Linter – 110 units -52-
Slide 53: German healthcare portfolio
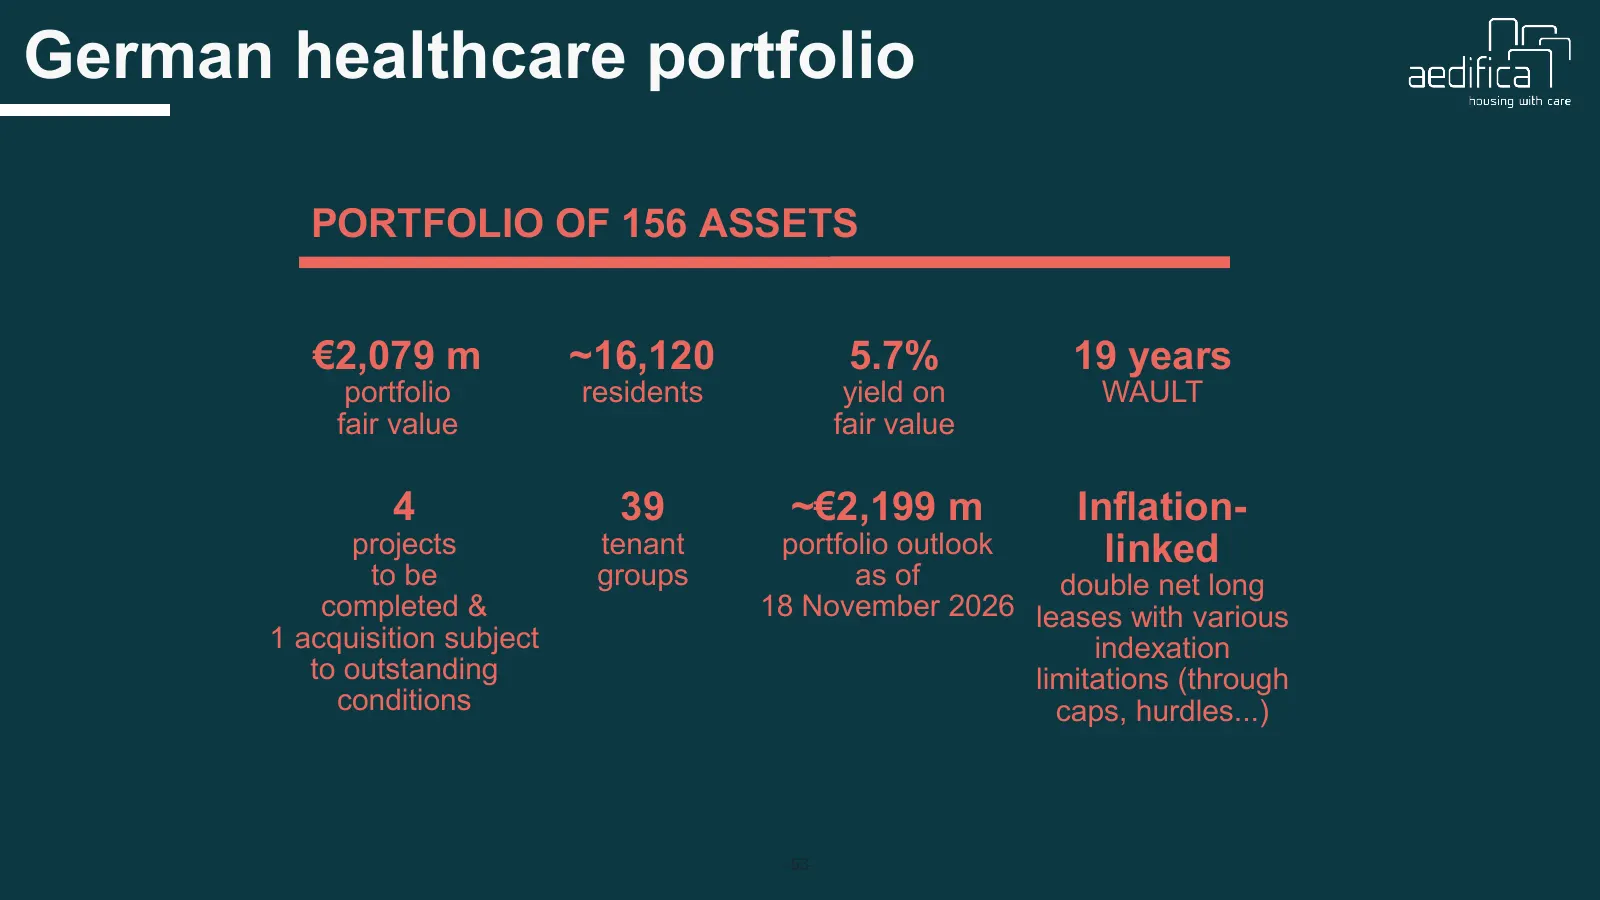
German healthcare portfolio PORTFOLIO OF 156 ASSETS €2,079 m ~16,120 5.7% 19 years portfolio residents yield on WAULT fair value fair value 4 39 ~€2,199 m Inflation- projects tenant portfolio outlook linked to be groups as of double net long completed & 18 November 2026 leases with various 1 acquisi
Slide 54: German healthcare portfolio
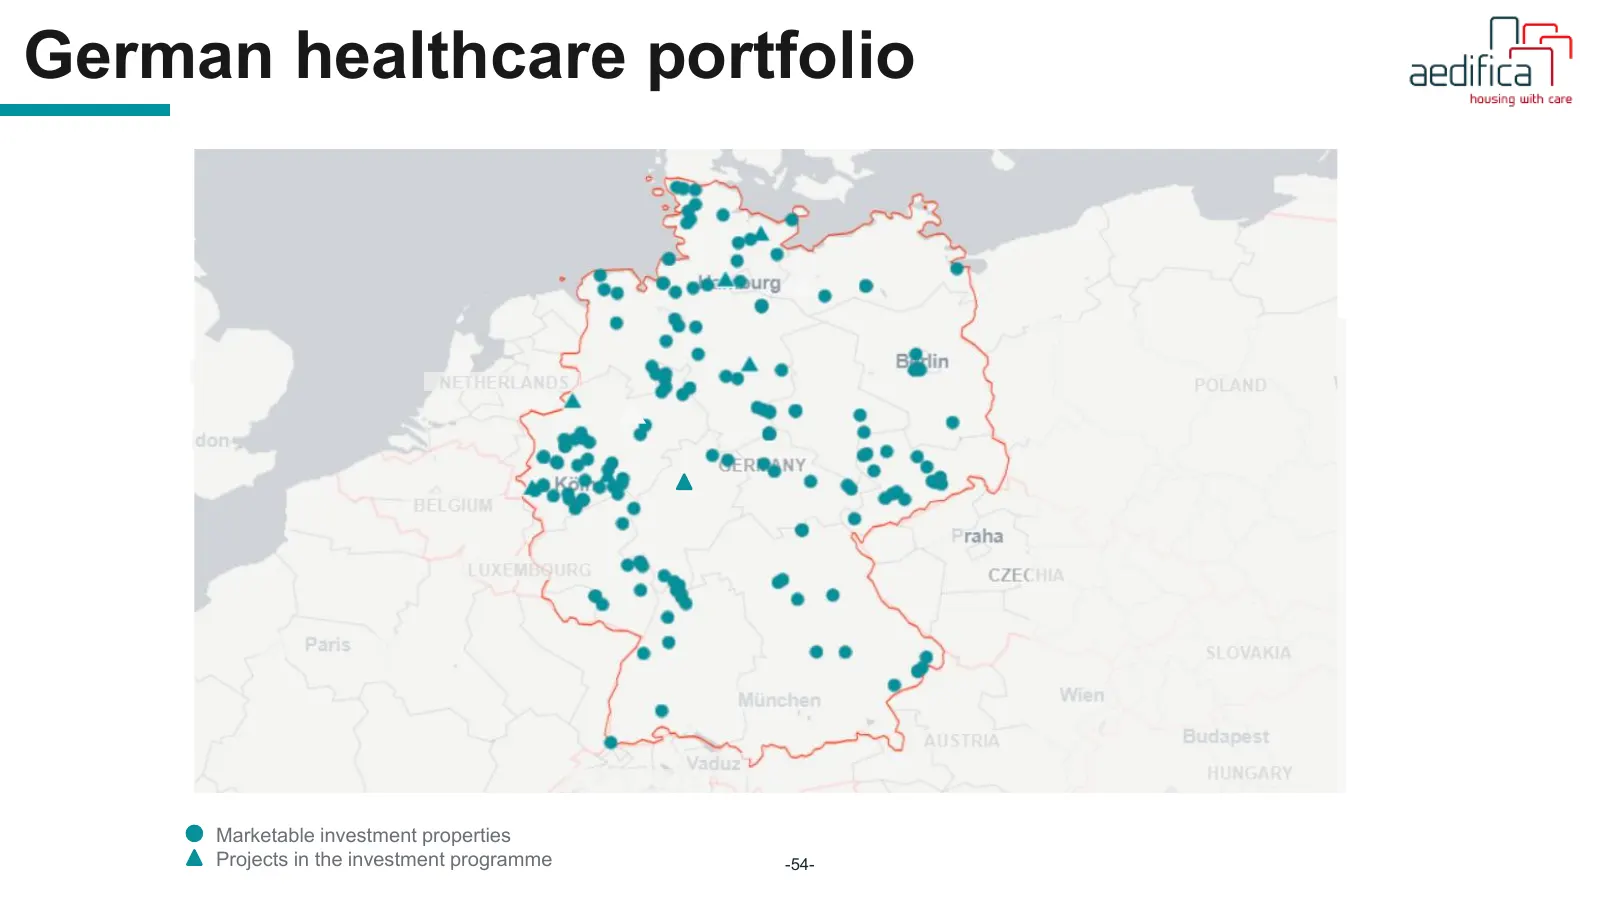
German healthcare portfolio Marketable investment properties Projects in the investment programme -54-
Slide 55: German healthcare portfolio
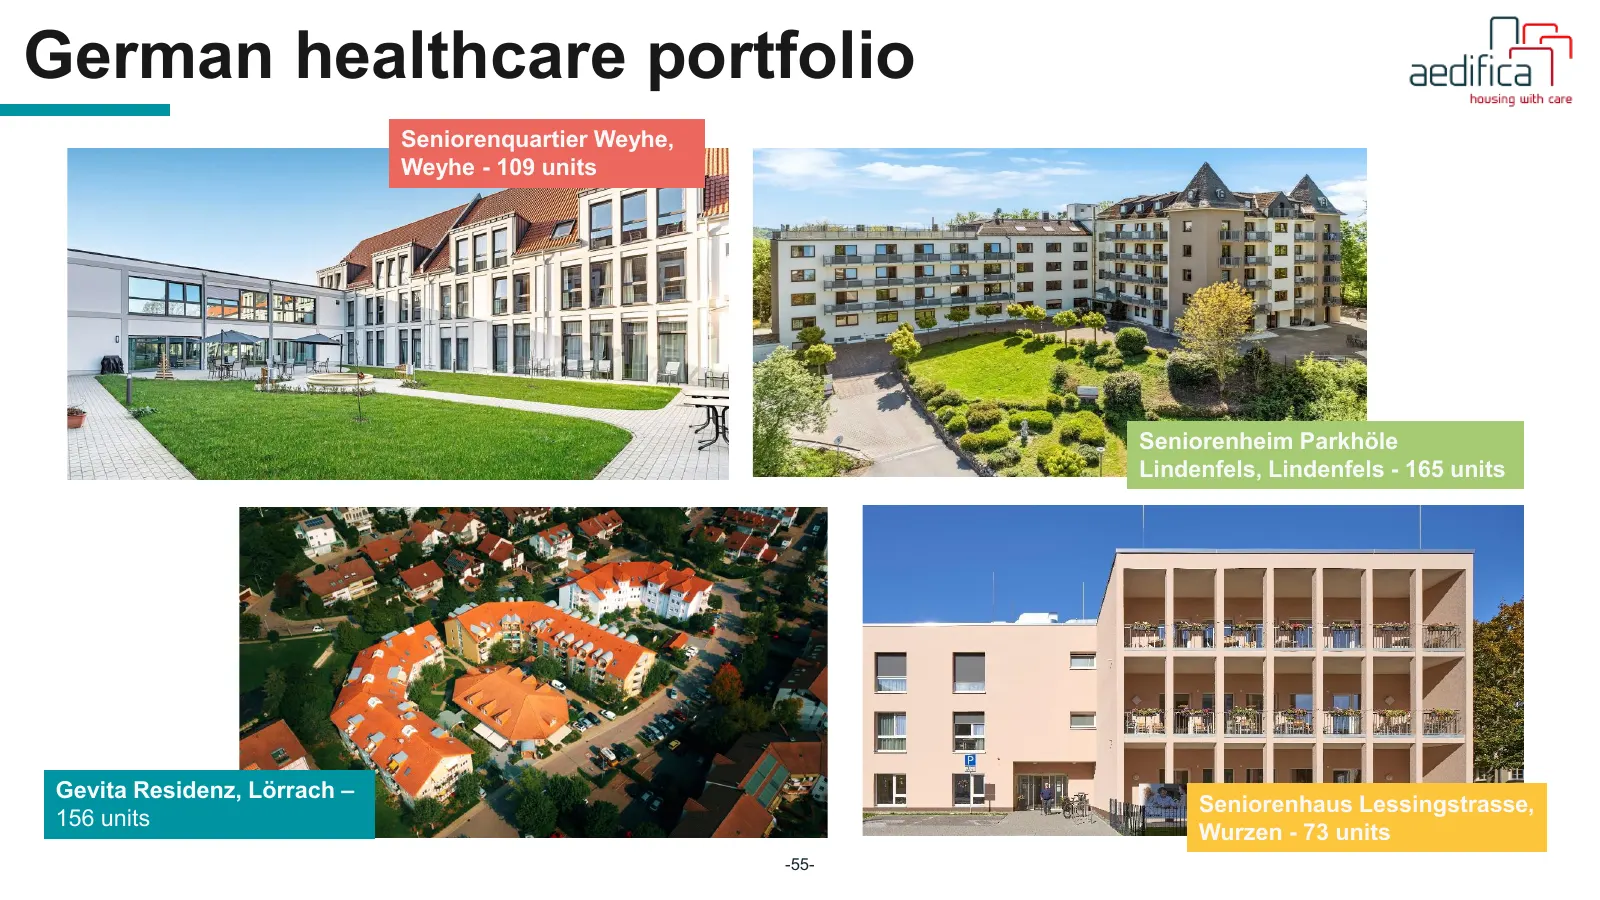
German healthcare portfolio Seniorenquartier Weyhe, Weyhe - 109 units Seniorenheim Parkhöle Lindenfels, Lindenfels - 165 units Gevita Residenz, Lörrach – Seniorenhaus Lessingstrasse, 156 units Wurzen - 73 units -55-
Slide 56: Dutch healthcare portfolio
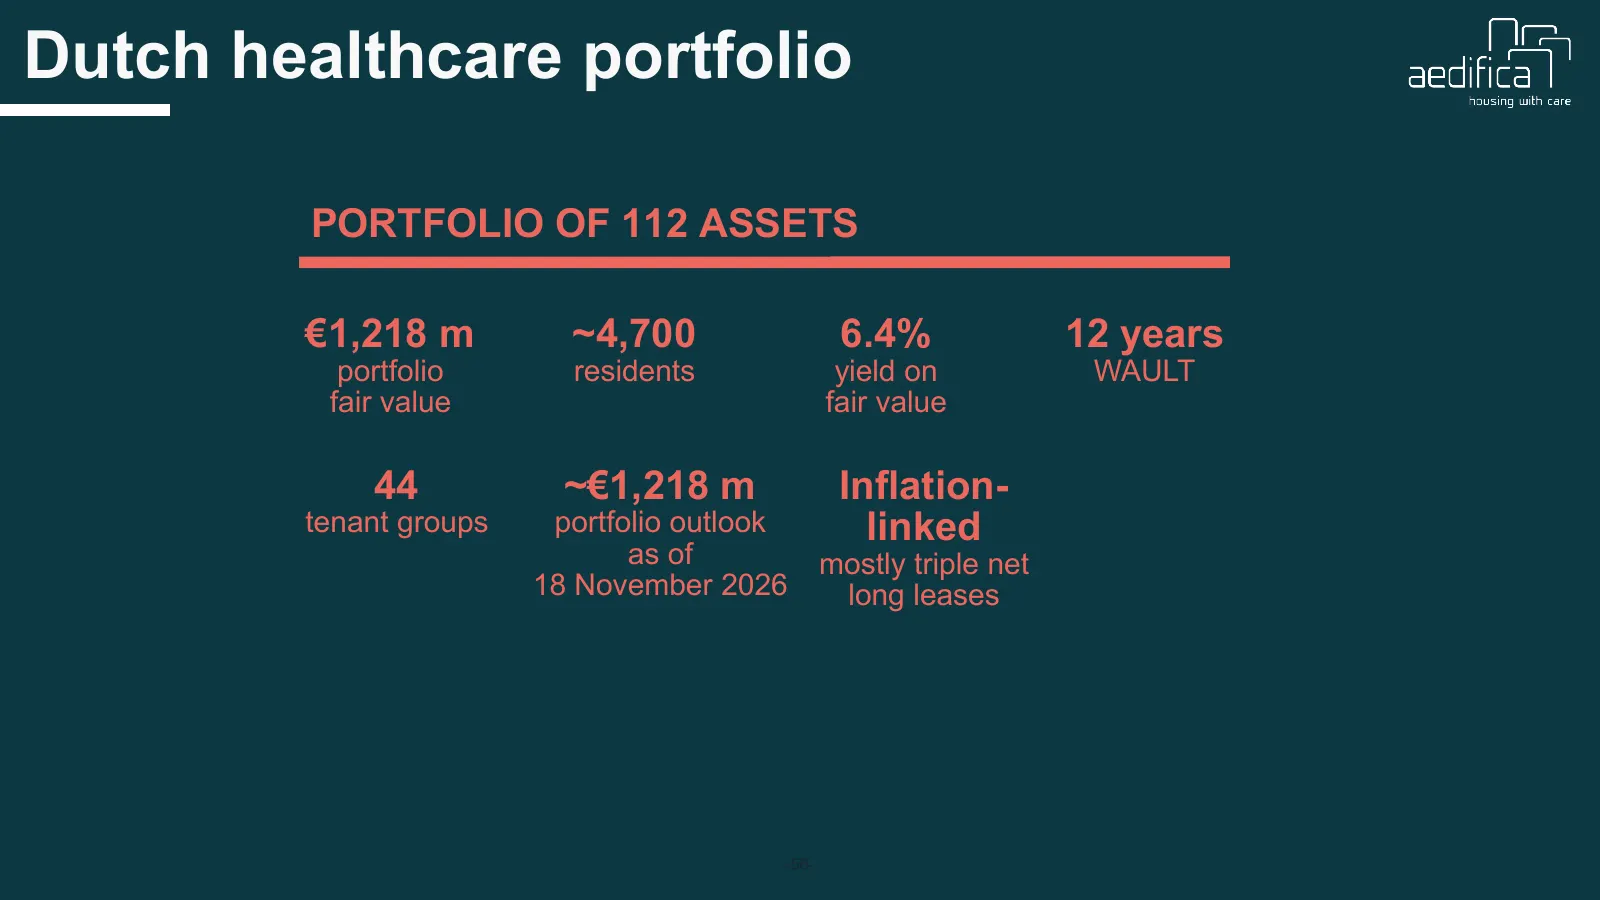
Dutch healthcare portfolio PORTFOLIO OF 112 ASSETS €1,218 m ~4,700 6.4% 12 years portfolio residents yield on WAULT fair value fair value 44 ~€1,218 m Inflation- tenant groups portfolio outlook linked as of mostly triple net 18 November 2026 long leases -56-
Slide 57: Dutch healthcare portfolio
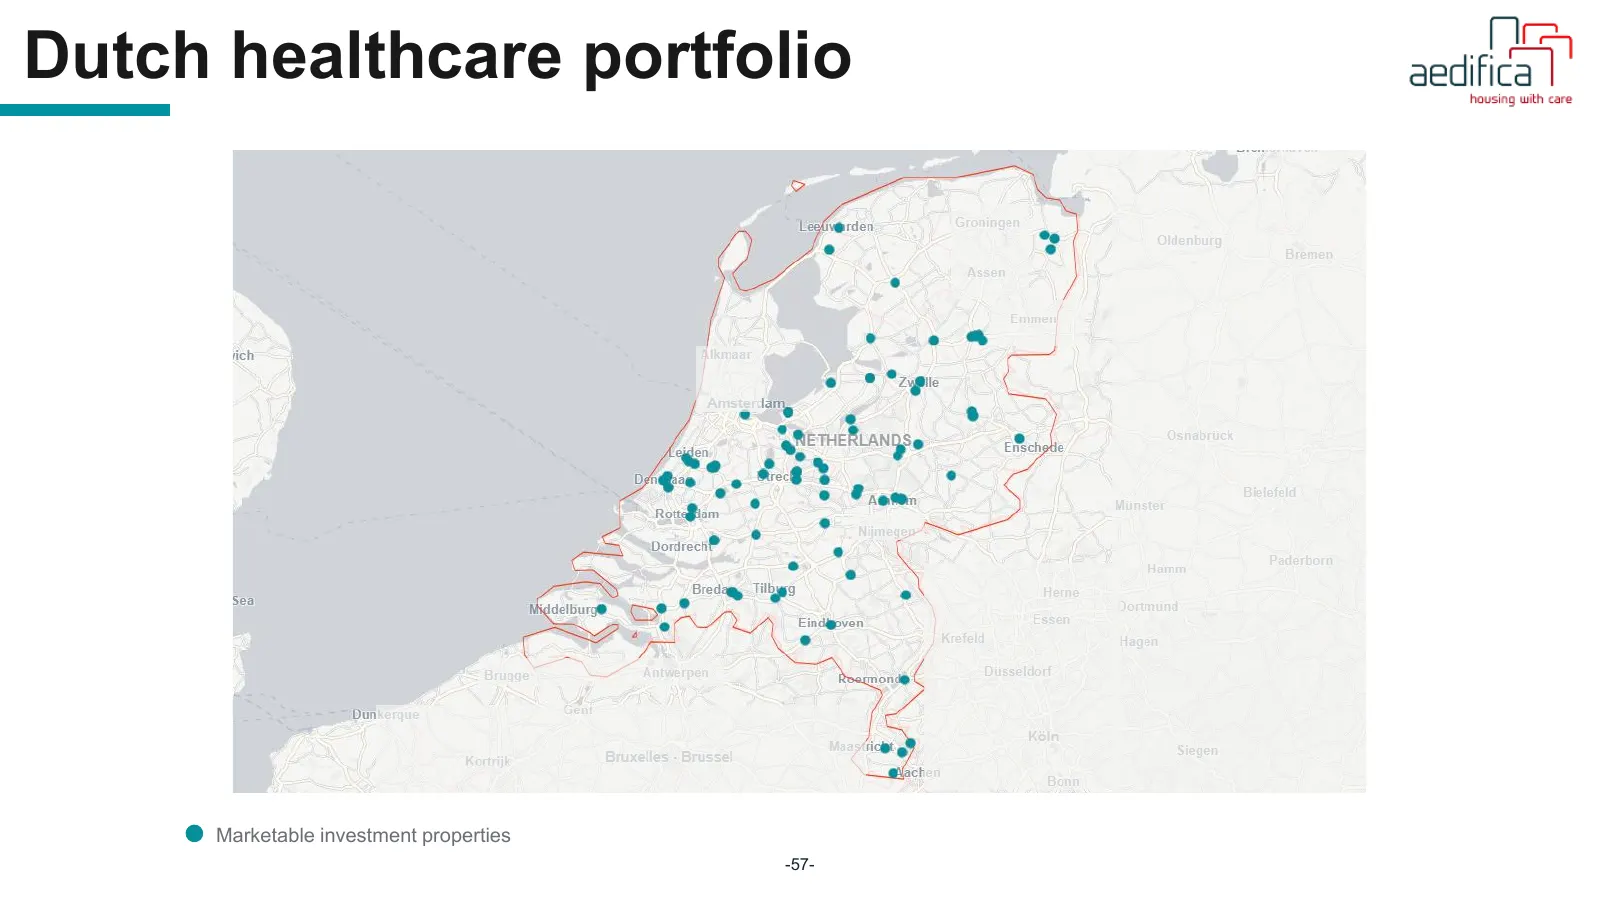
Dutch healthcare portfolio Marketable investment properties -57-
Slide 58: Dutch healthcare portfolio
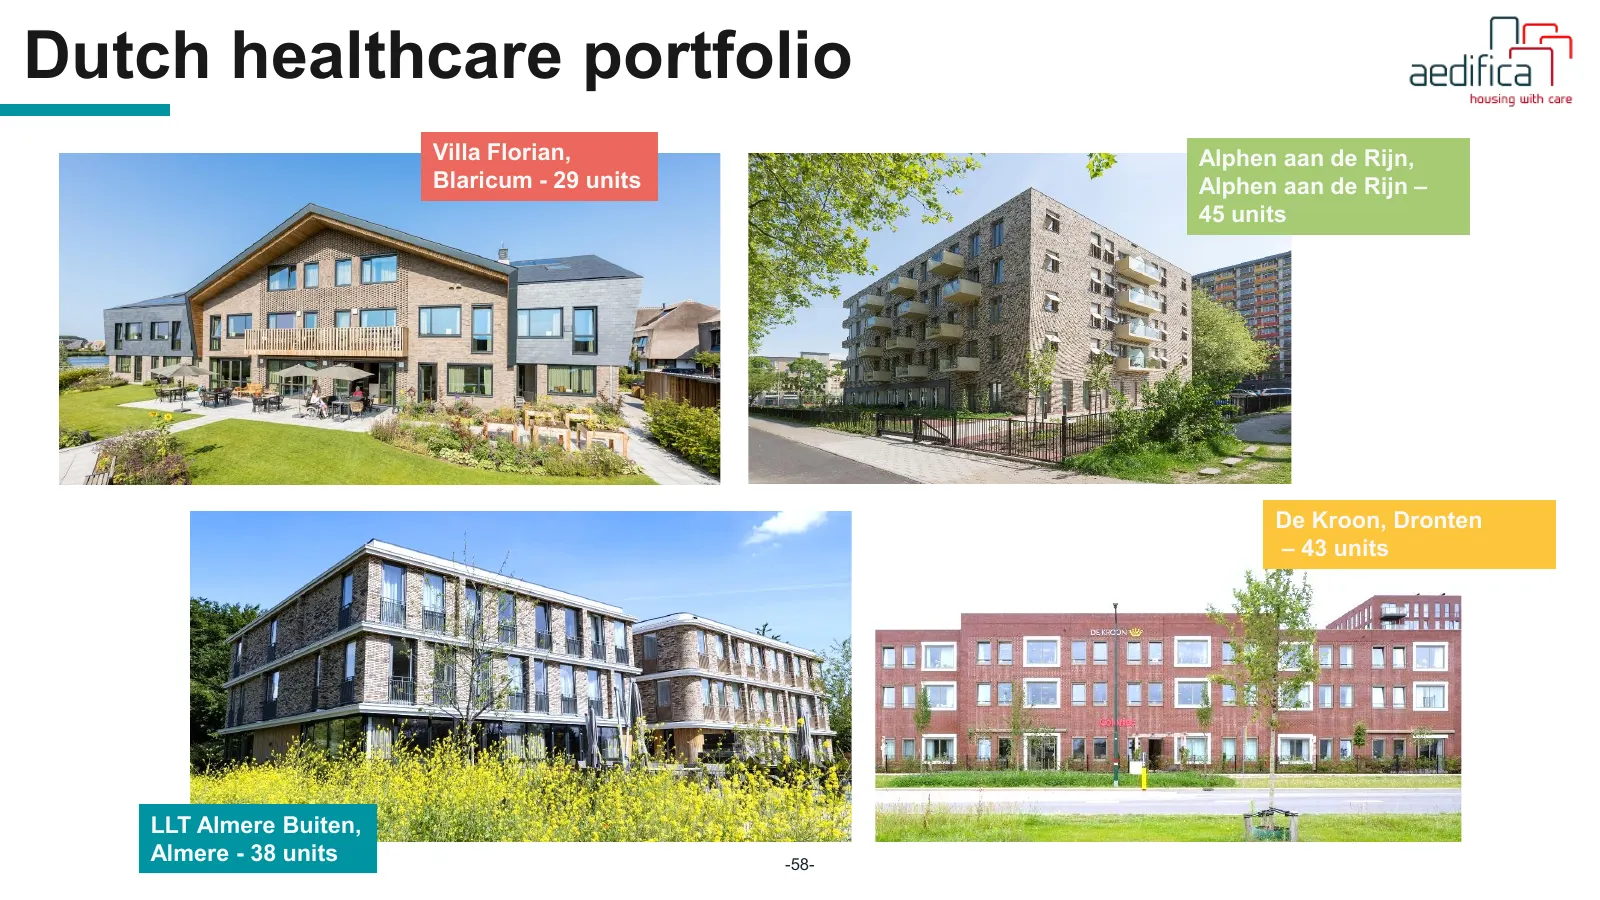
Dutch healthcare portfolio Villa Florian, Alphen aan de Rijn, Blaricum - 29 units Alphen aan de Rijn – 45 units De Kroon, Dronten – 43 units LLT Almere Buiten, Almere - 38 units -58-
Slide 59: UK & Channel Islands healthcare portfolio
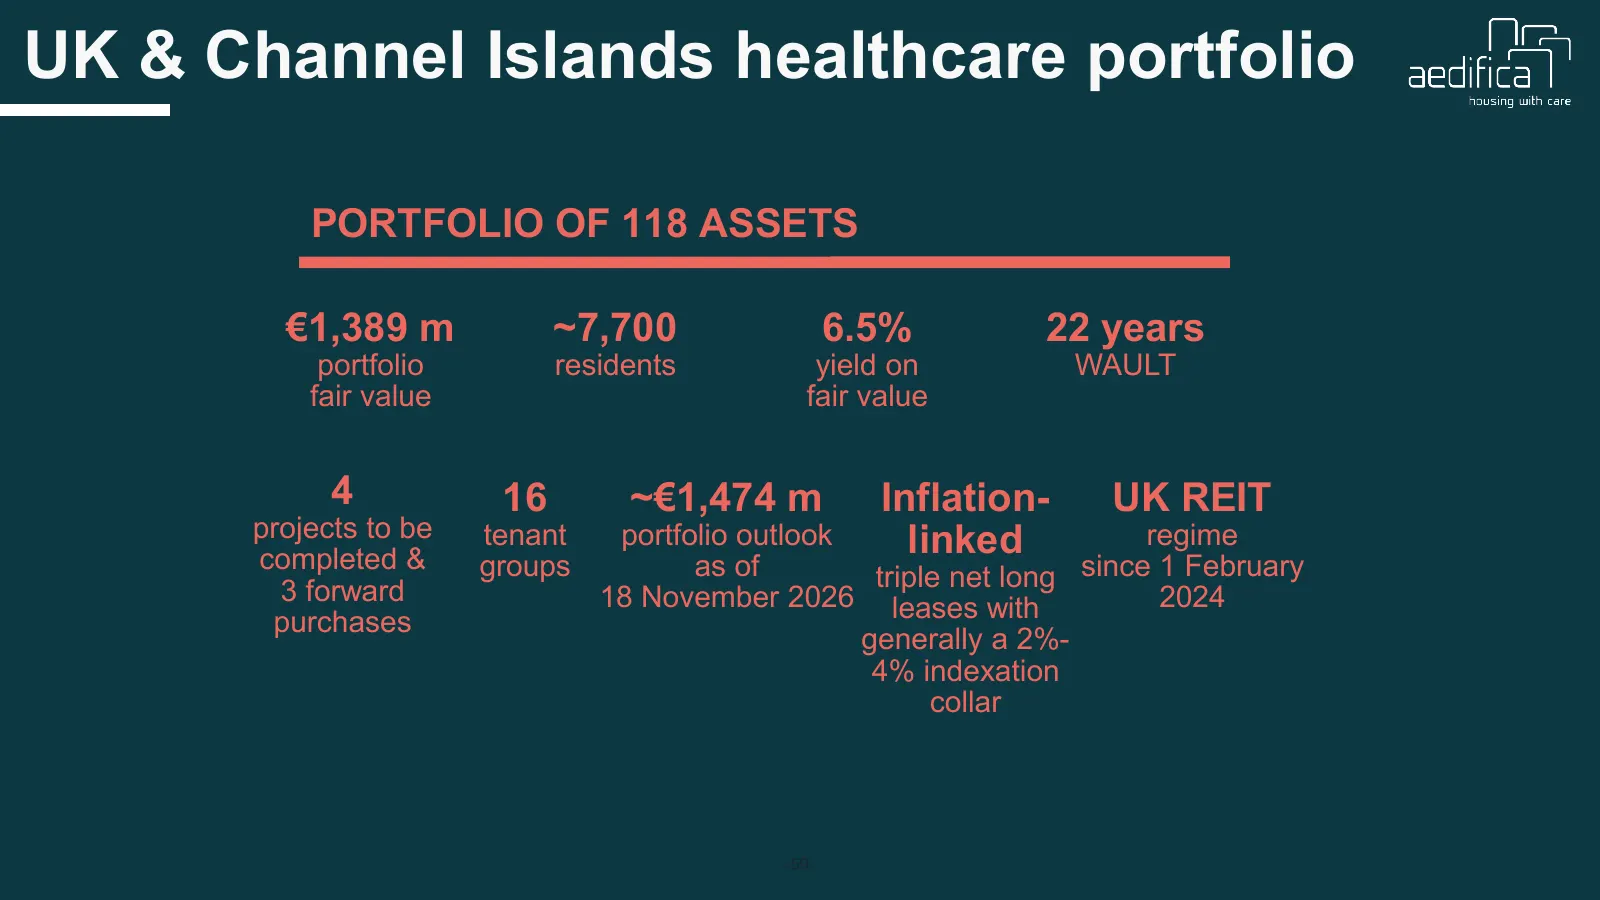
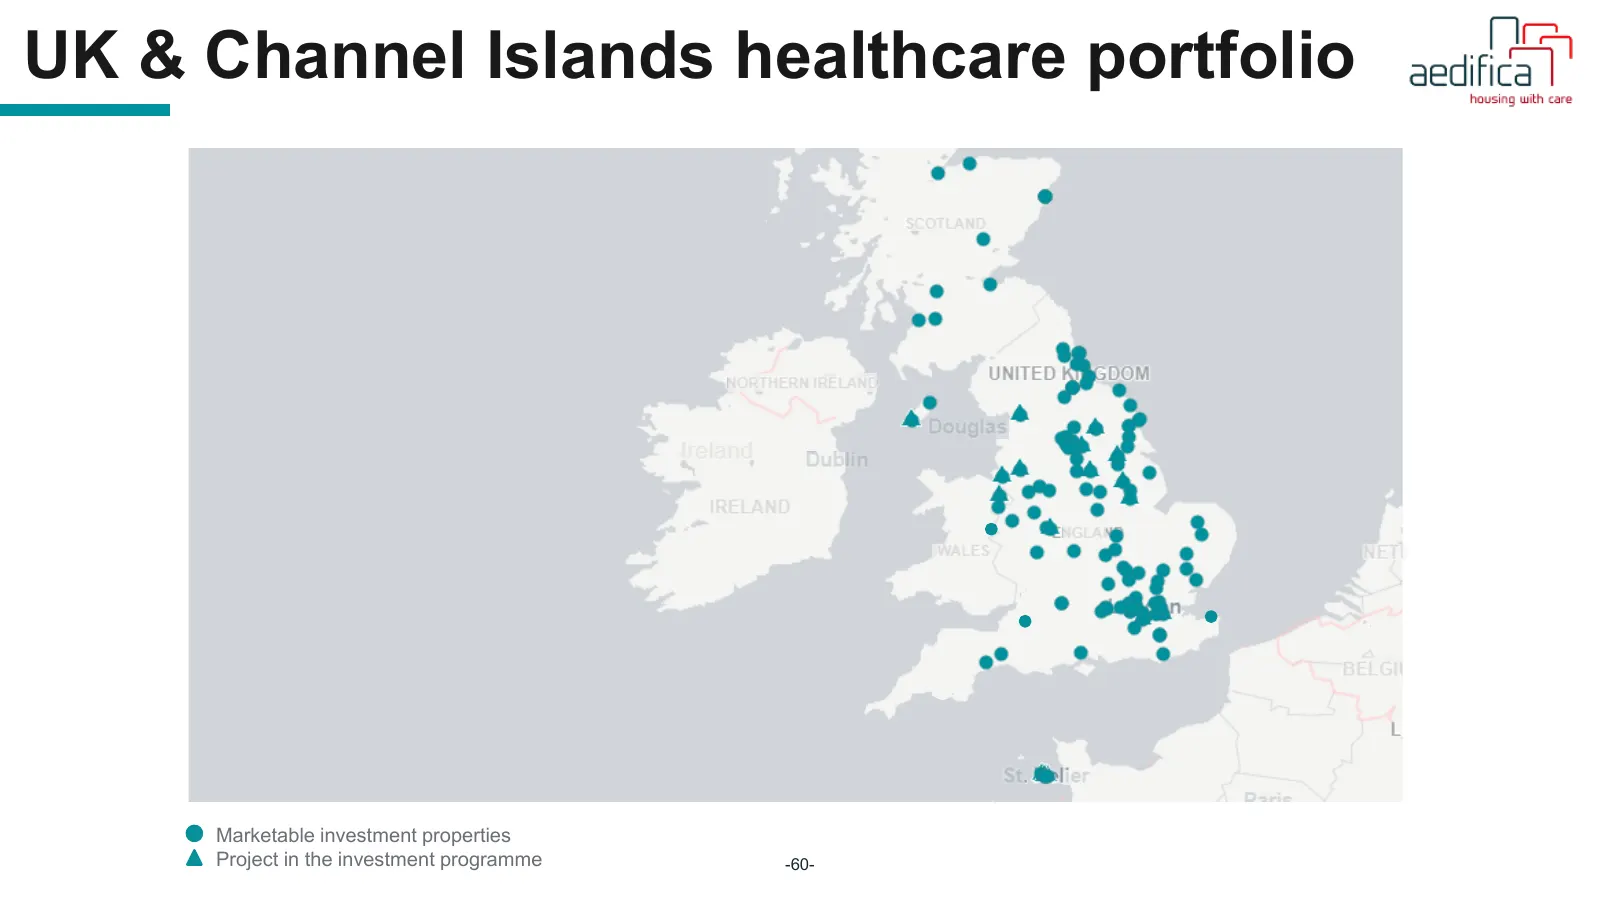
UK & Channel Islands healthcare portfolio PORTFOLIO OF 118 ASSETS €1,389 m ~7,700 6.5% 22 years portfolio residents yield on WAULT fair value fair value 4 16 ~€1,474 m Inflation- UK REIT projects to be tenant portfolio outlook linked regime completed & groups as of 3 forward triple net long since 1
Slide 60: UK & Channel Islands healthcare portfolio
UK & Channel Islands healthcare portfolio Marketable investment properties Project in the investment programme -60-
Slide 61: UK & Channel Islands healthcare portfolio
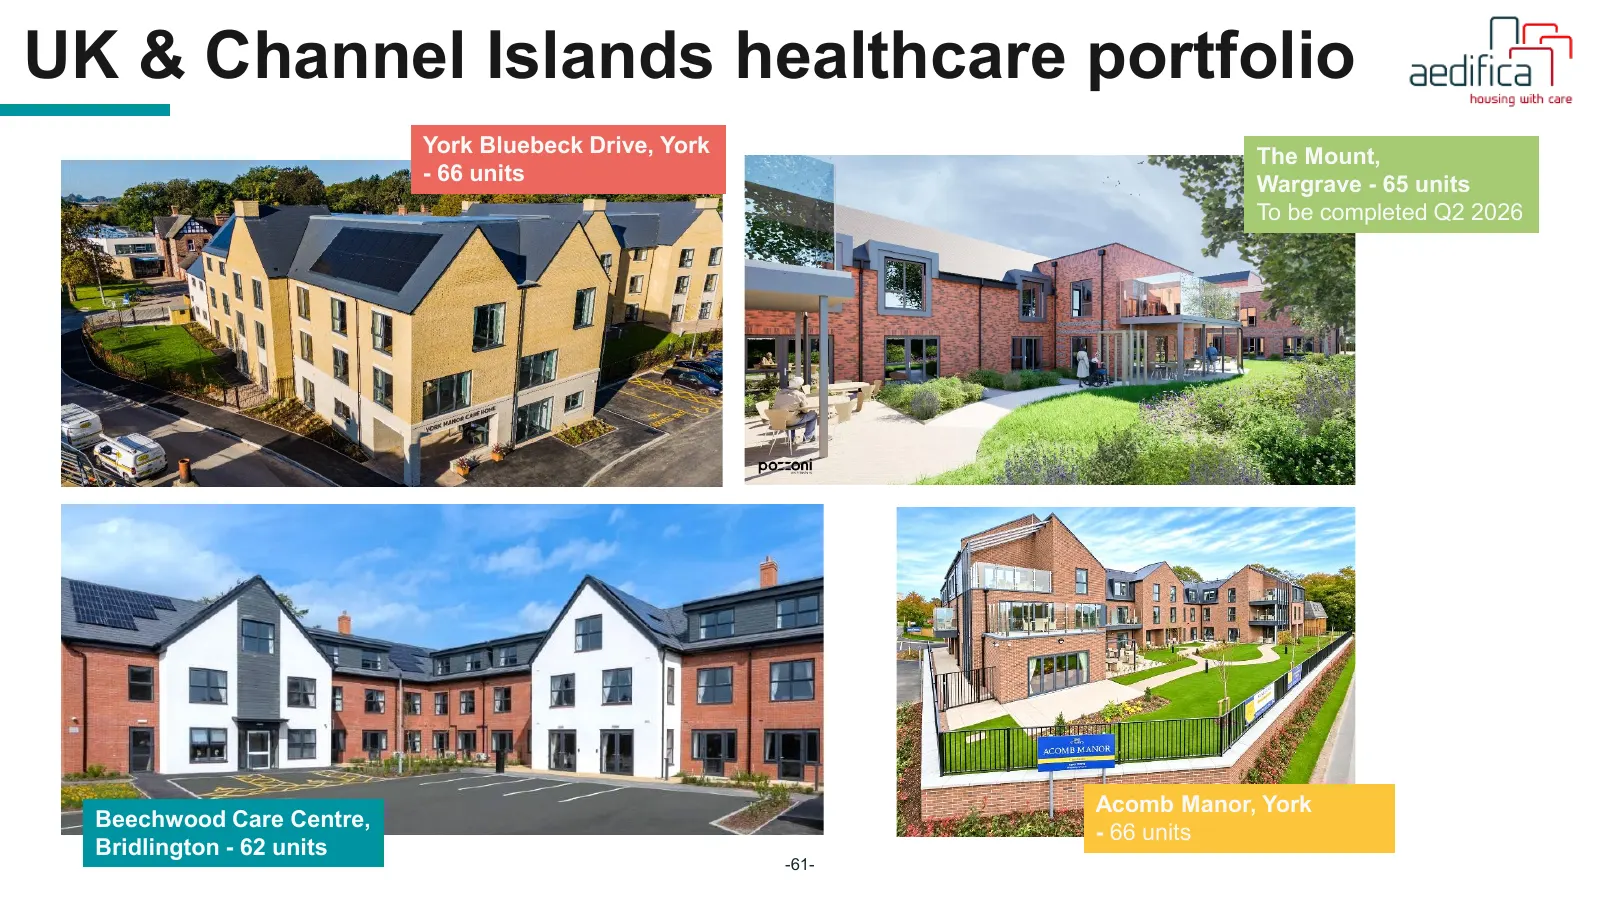
UK & Channel Islands healthcare portfolio York Bluebeck Drive, York The Mount, - 66 units Wargrave - 65 units To be completed Q2 2026 Acomb Manor, York Beechwood Care Centre, - 66 units Bridlington - 62 units -61-
Slide 62: Finnish healthcare portfolio
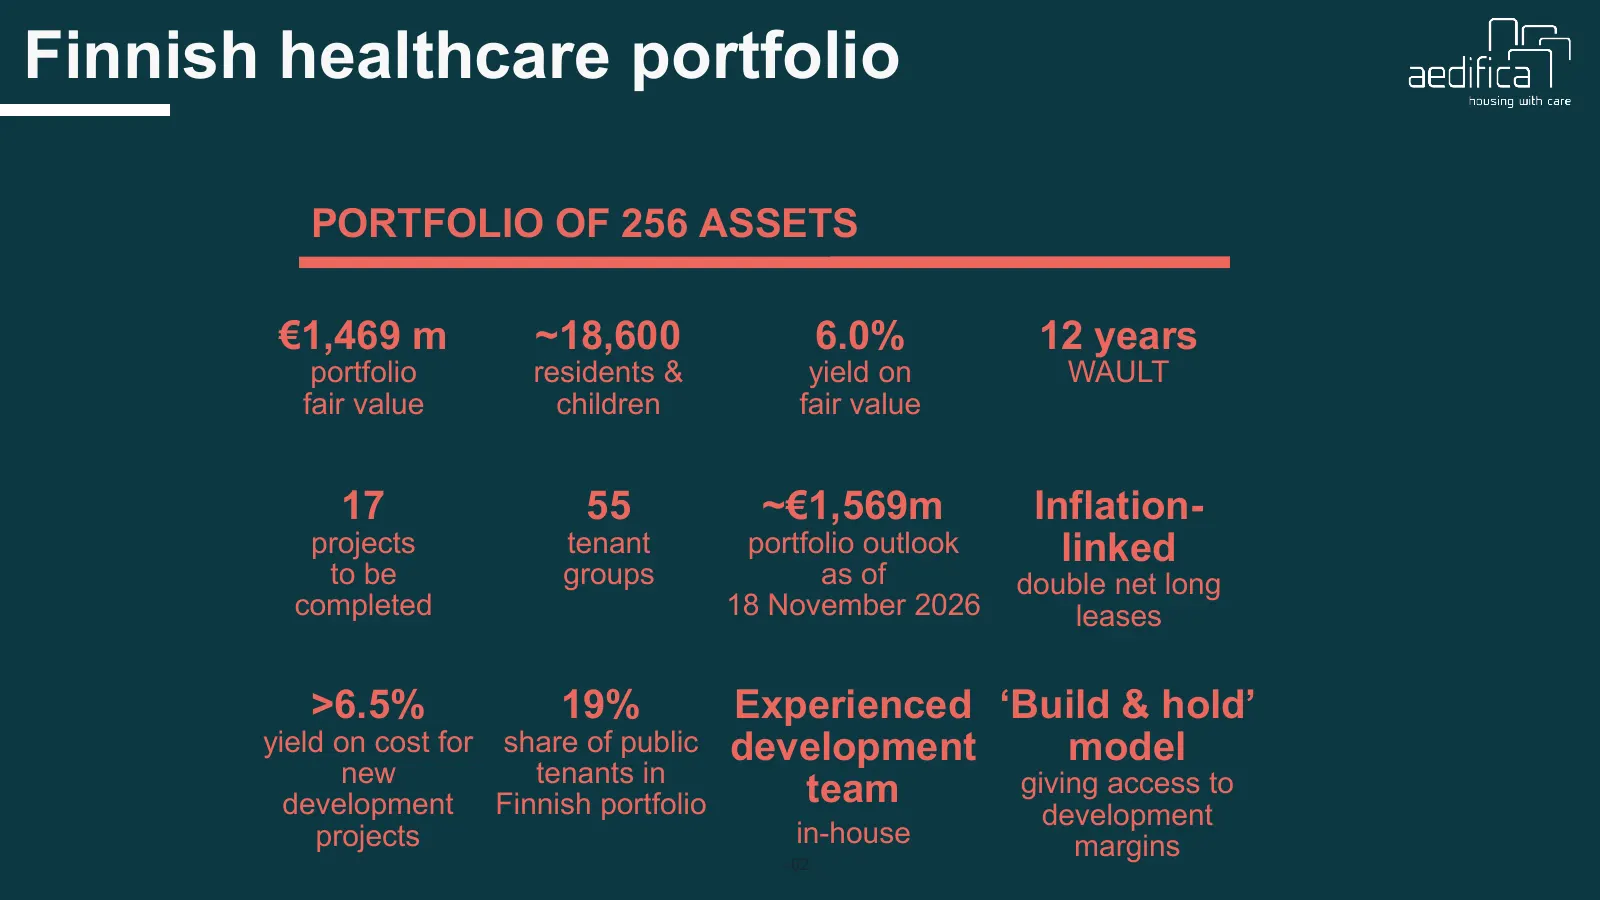
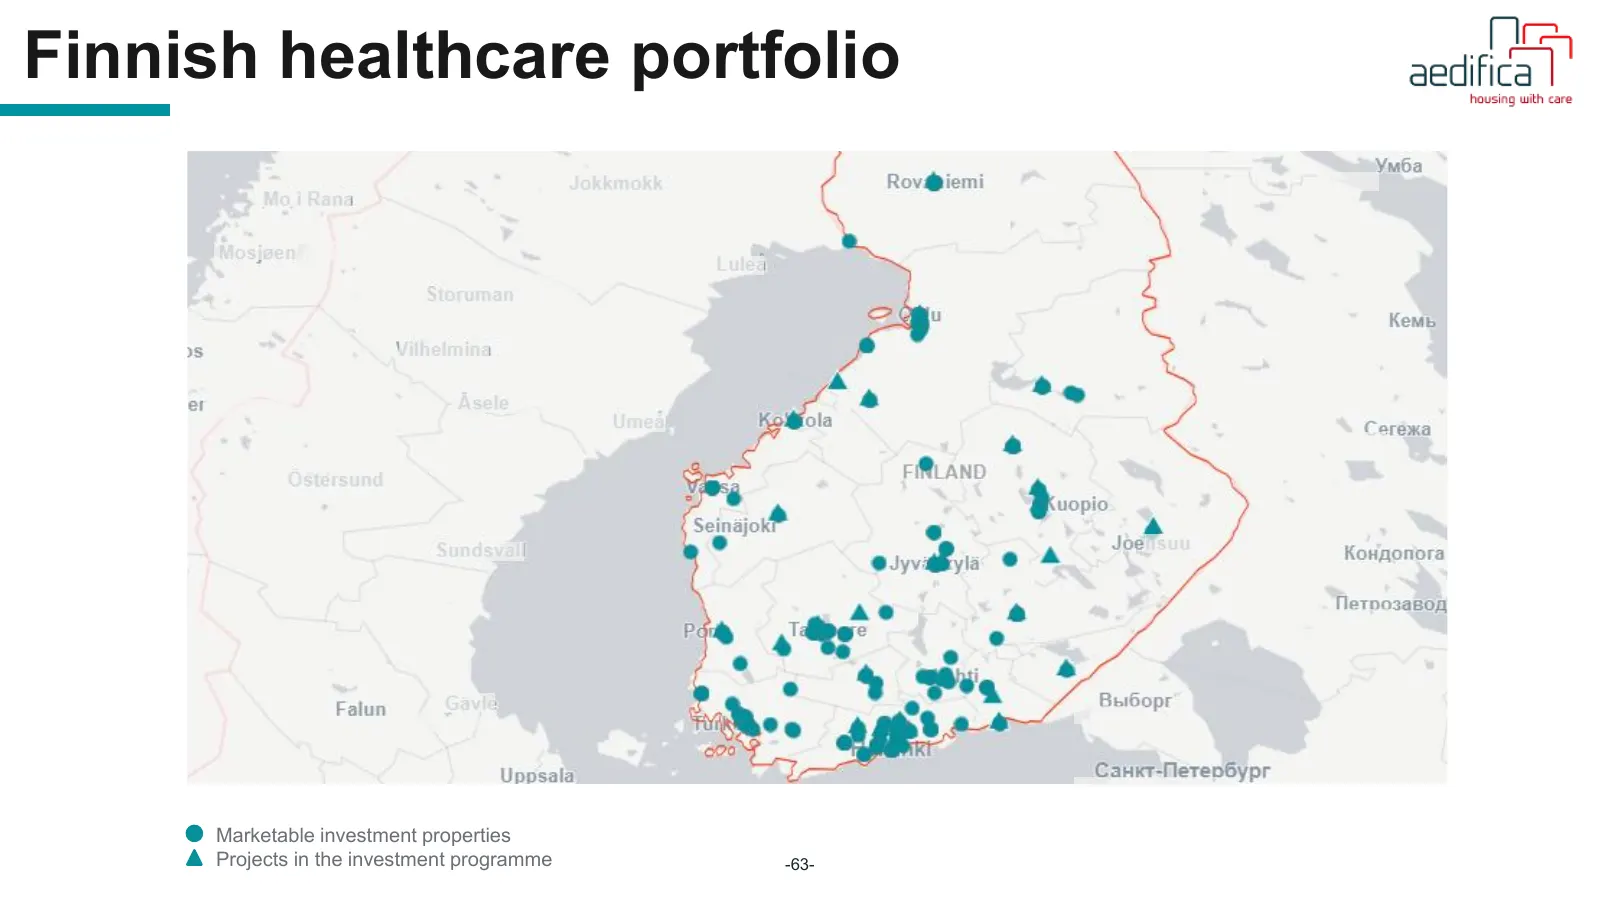
Finnish healthcare portfolio PORTFOLIO OF 256 ASSETS €1,469 m ~18,600 6.0% 12 years portfolio residents & yield on WAULT fair value children fair value 17 55 ~€1,569m Inflation- projects tenant portfolio outlook linked to be groups as of double net long completed 18 November 2026 leases >6.5% 19% Ex
Slide 63: Finnish healthcare portfolio
Finnish healthcare portfolio Marketable investment properties Projects in the investment programme -63-
Slide 64: Finnish healthcare portfolio
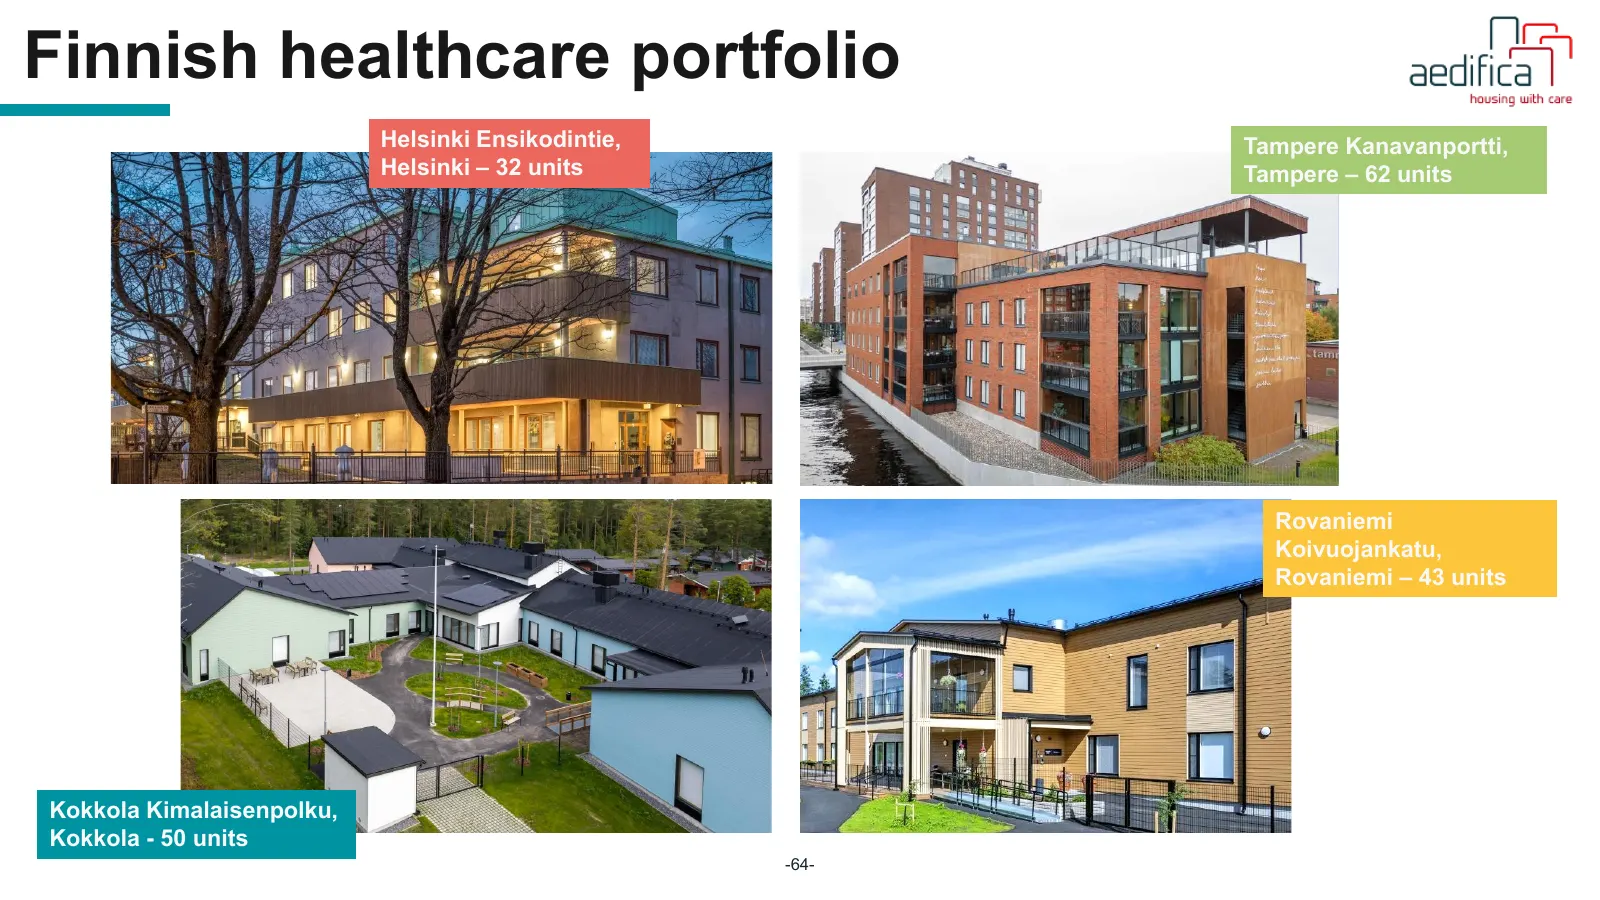
Finnish healthcare portfolio Helsinki Ensikodintie, Tampere Kanavanportti, Helsinki – 32 units Tampere – 62 units Rovaniemi Koivuojankatu, Rovaniemi – 43 units Kokkola Kimalaisenpolku, Kokkola - 50 units -64-
Slide 65: Irish healthcare portfolio
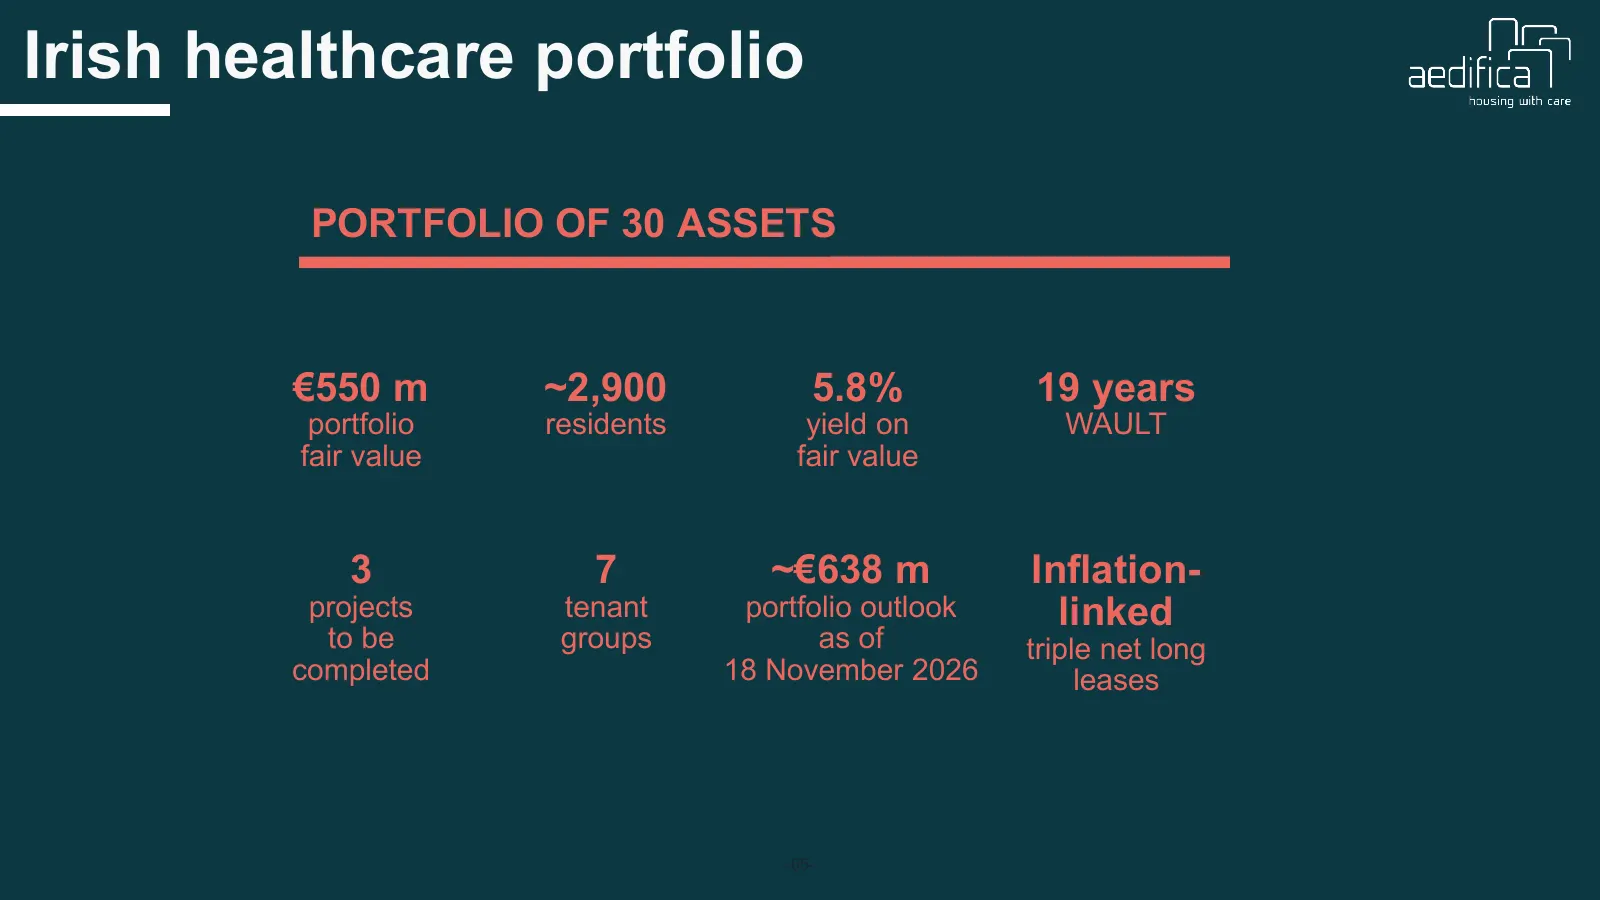
Irish healthcare portfolio PORTFOLIO OF 30 ASSETS €550 m ~2,900 5.8% 19 years portfolio residents yield on WAULT fair value fair value 3 7 ~€638 m Inflation- projects tenant portfolio outlook linked to be groups as of triple net long completed 18 November 2026 leases -65-
Slide 66: Irish healthcare portfolio
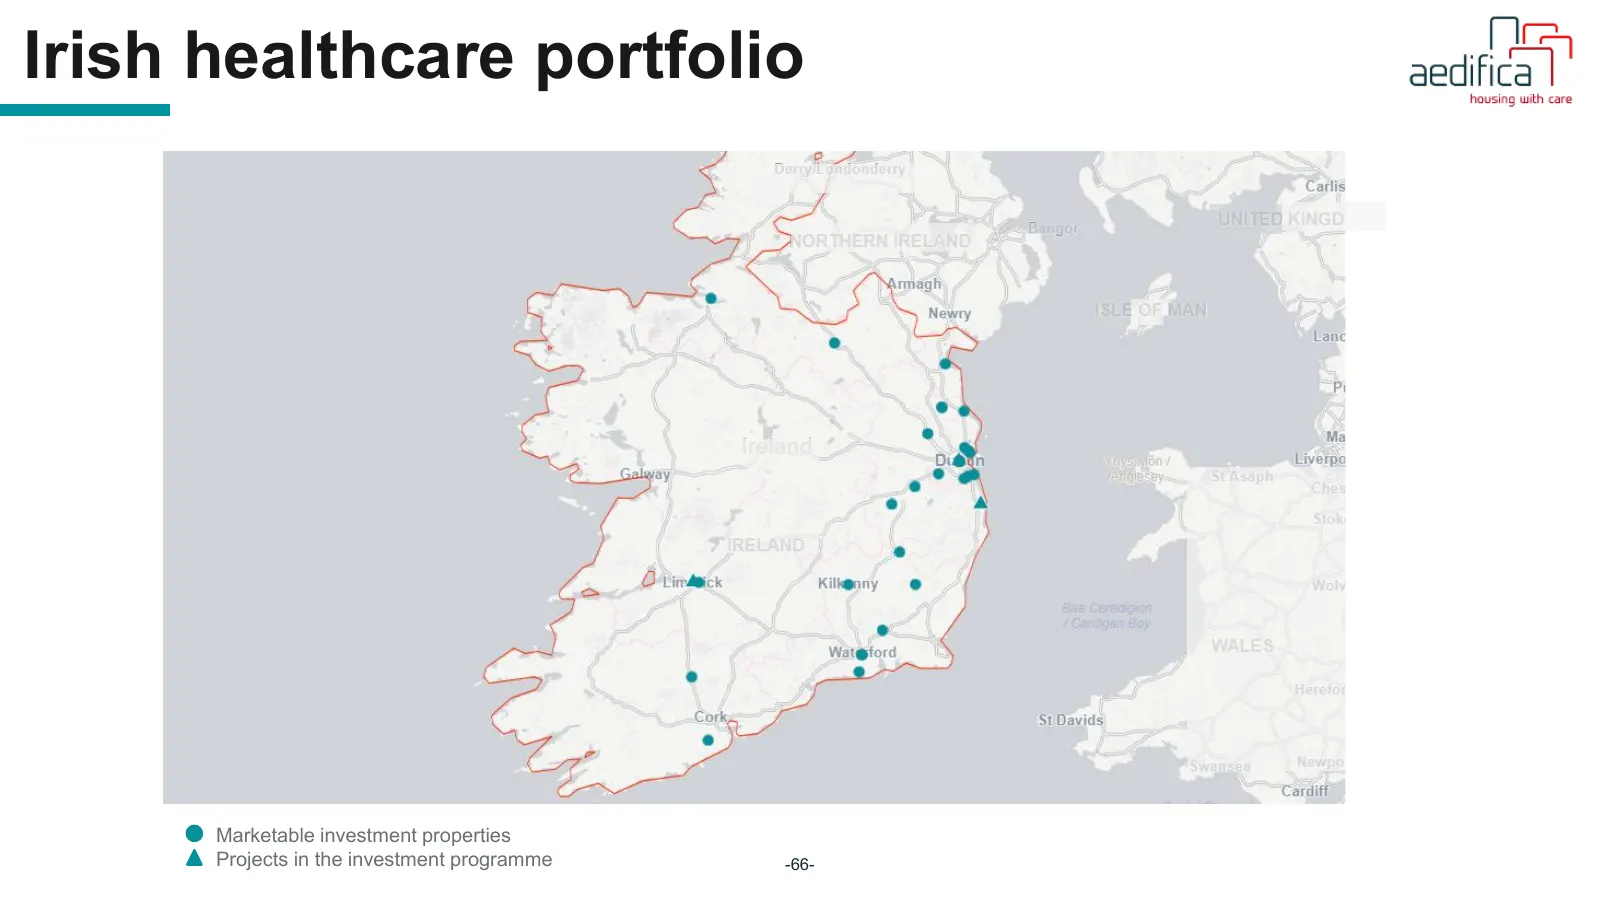
Irish healthcare portfolio Marketable investment properties Projects in the investment programme -66-
Slide 67: Irish healthcare portfolio
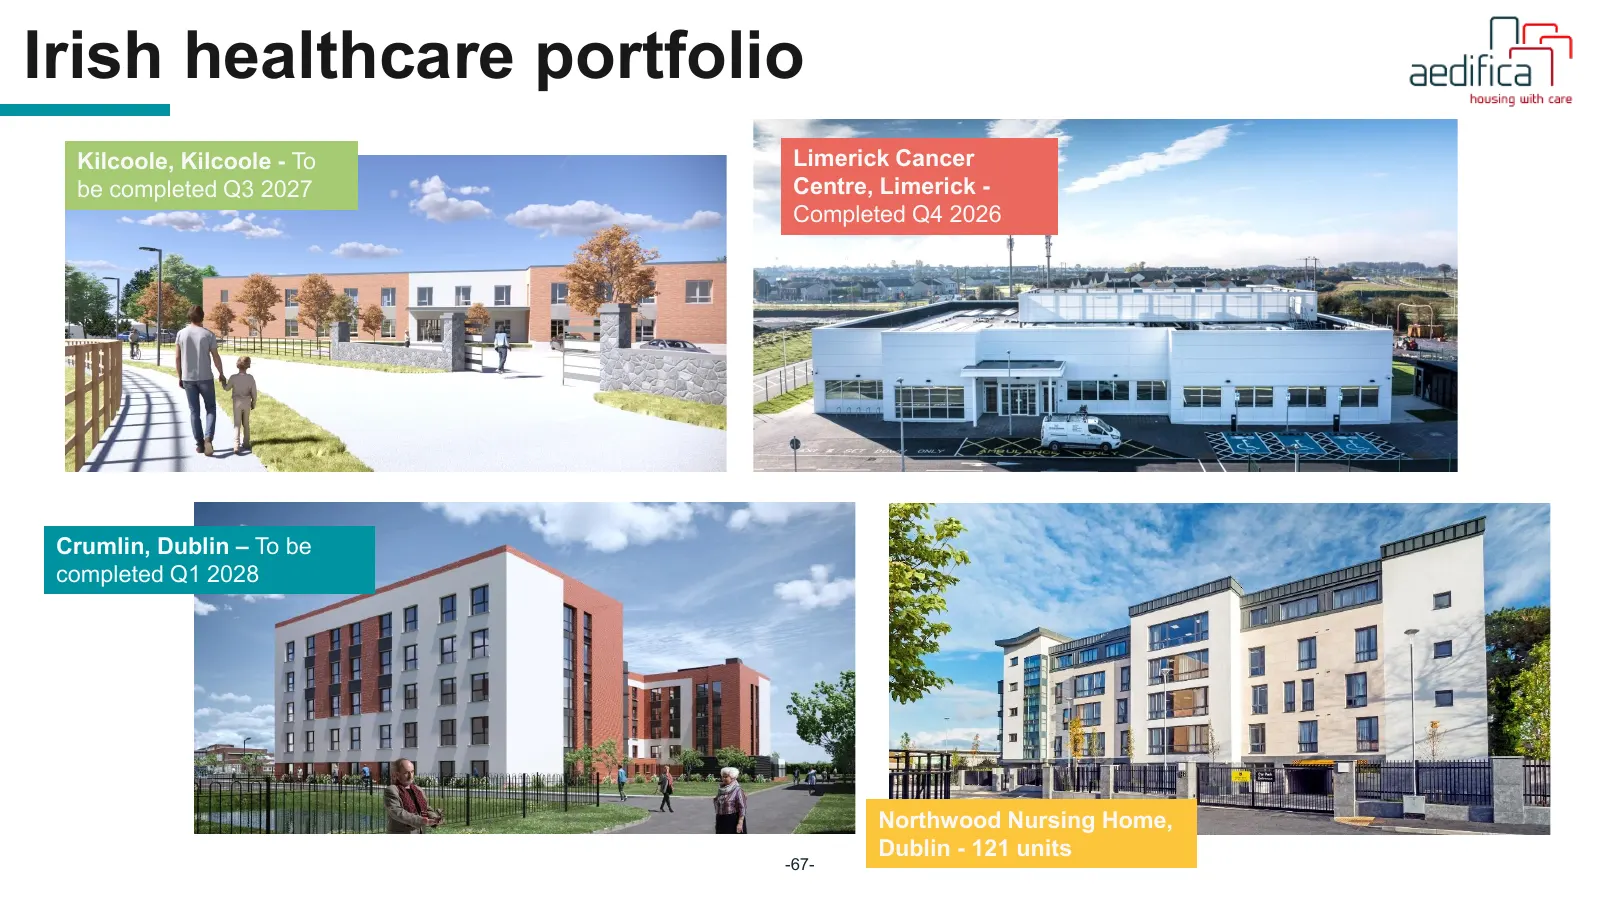
Irish healthcare portfolio Kilcoole, Kilcoole - To Limerick Cancer be completed Q3 2027 Centre, Limerick - Completed Q4 2026 Crumlin, Dublin – To be completed Q1 2028 Northwood Nursing Home, Dublin - 121 units -67-
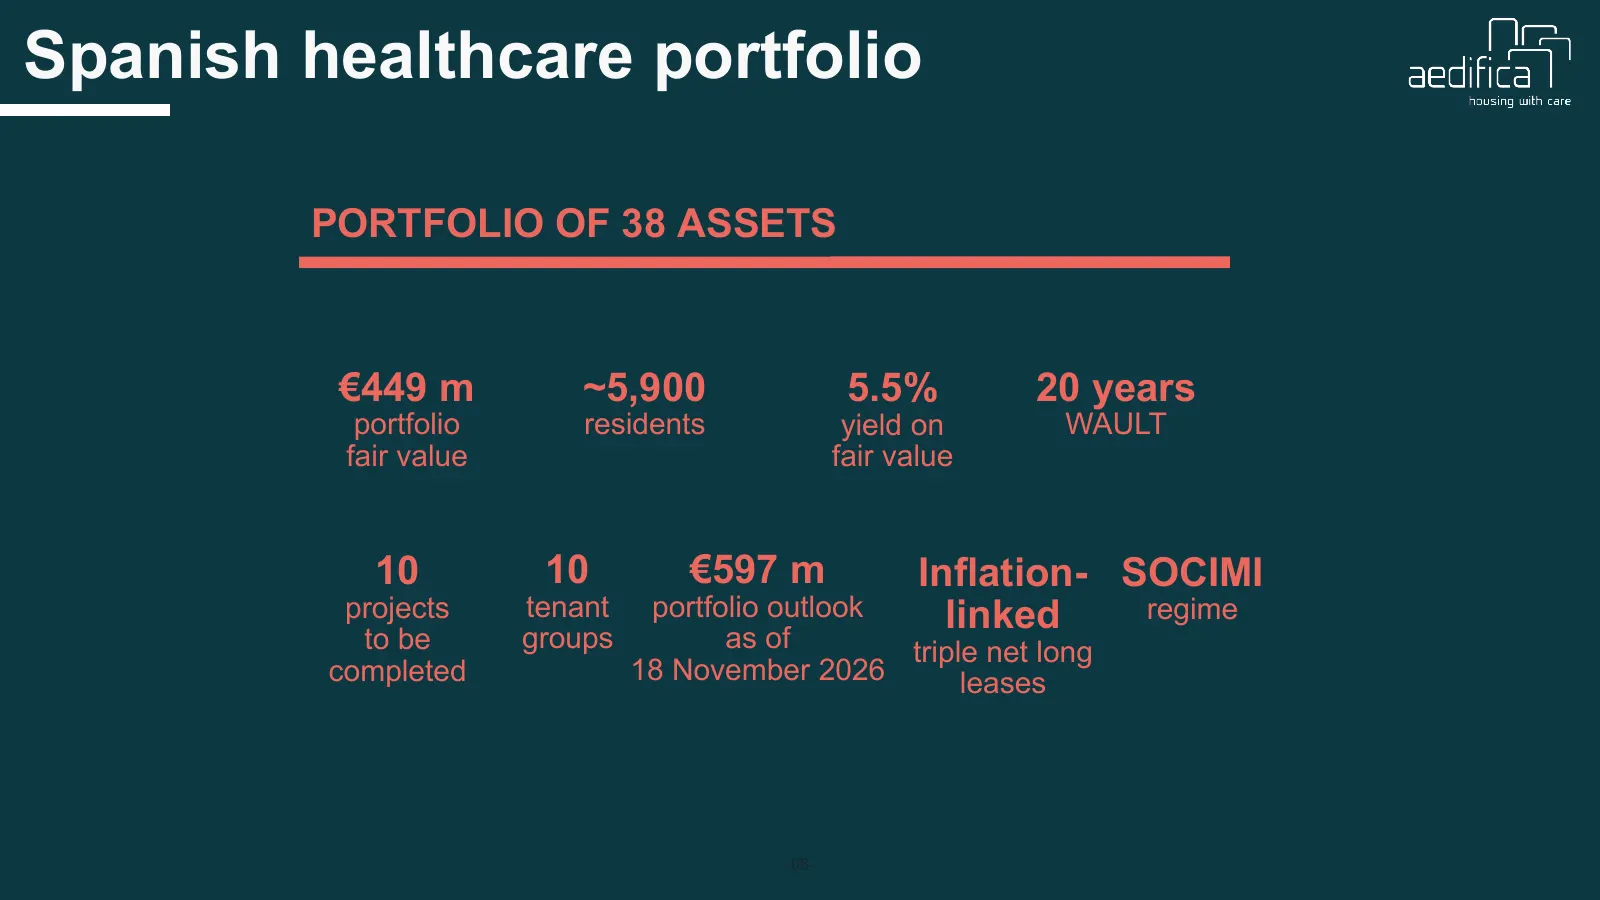
Slide 68: Spanish healthcare portfolio
Spanish healthcare portfolio PORTFOLIO OF 38 ASSETS €449 m ~5,900 5.5% 20 years portfolio residents yield on WAULT fair value fair value 10 10 €597 m Inflation- SOCIMI projects tenant portfolio outlook linked regime to be groups as of triple net long completed 18 November 2026 leases -68-
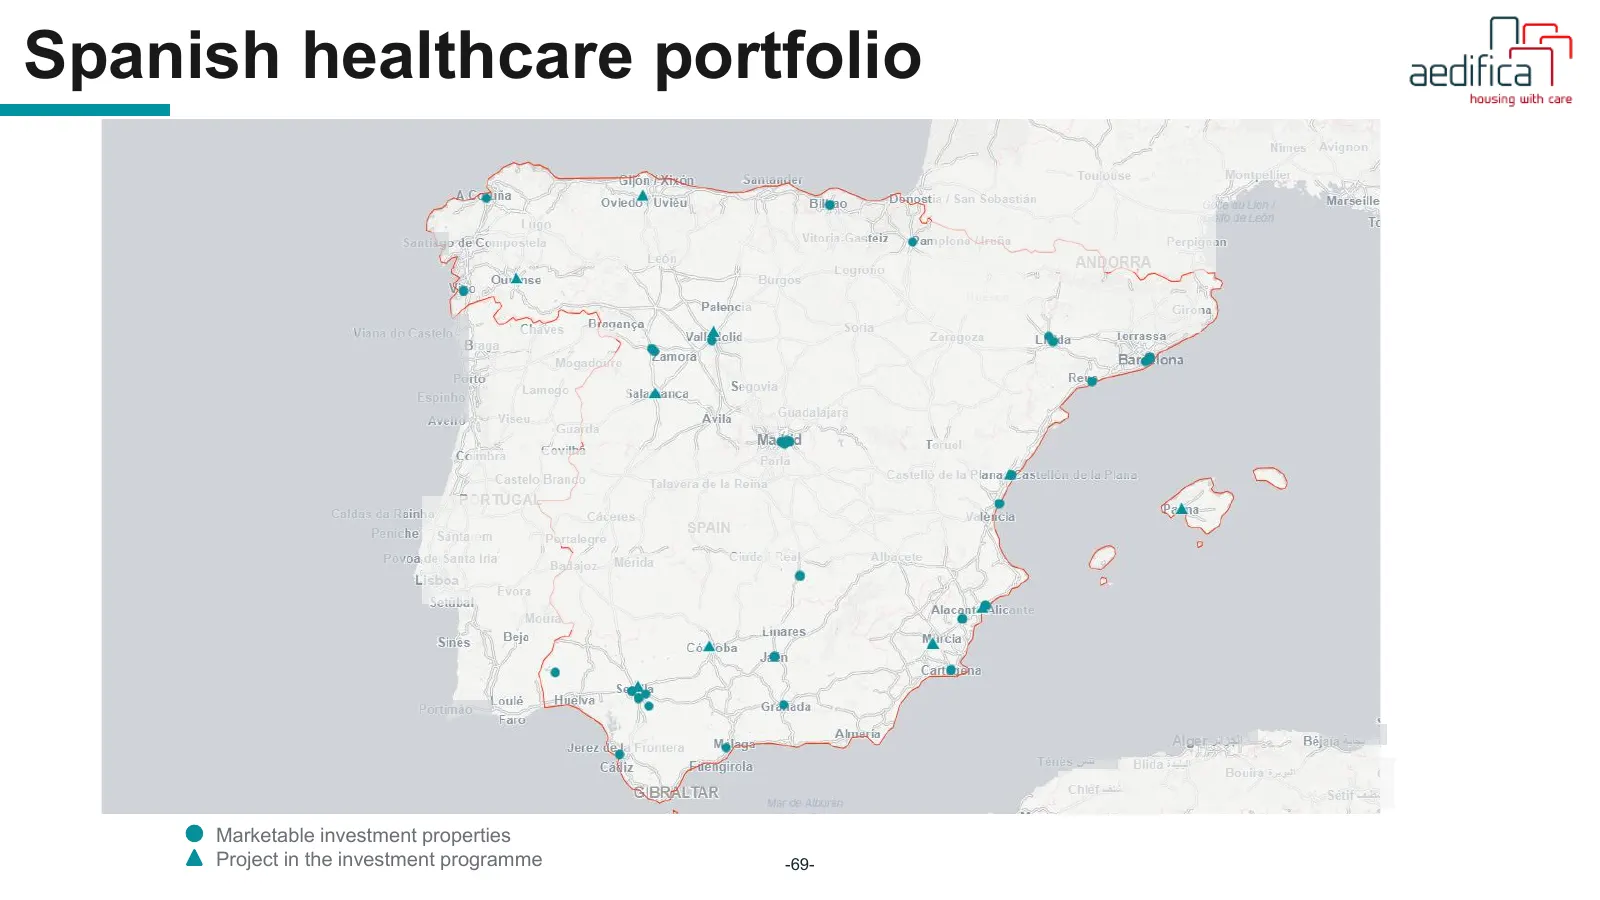
Slide 69: Spanish healthcare portfolio
Spanish healthcare portfolio Marketable investment properties Project in the investment programme -69-
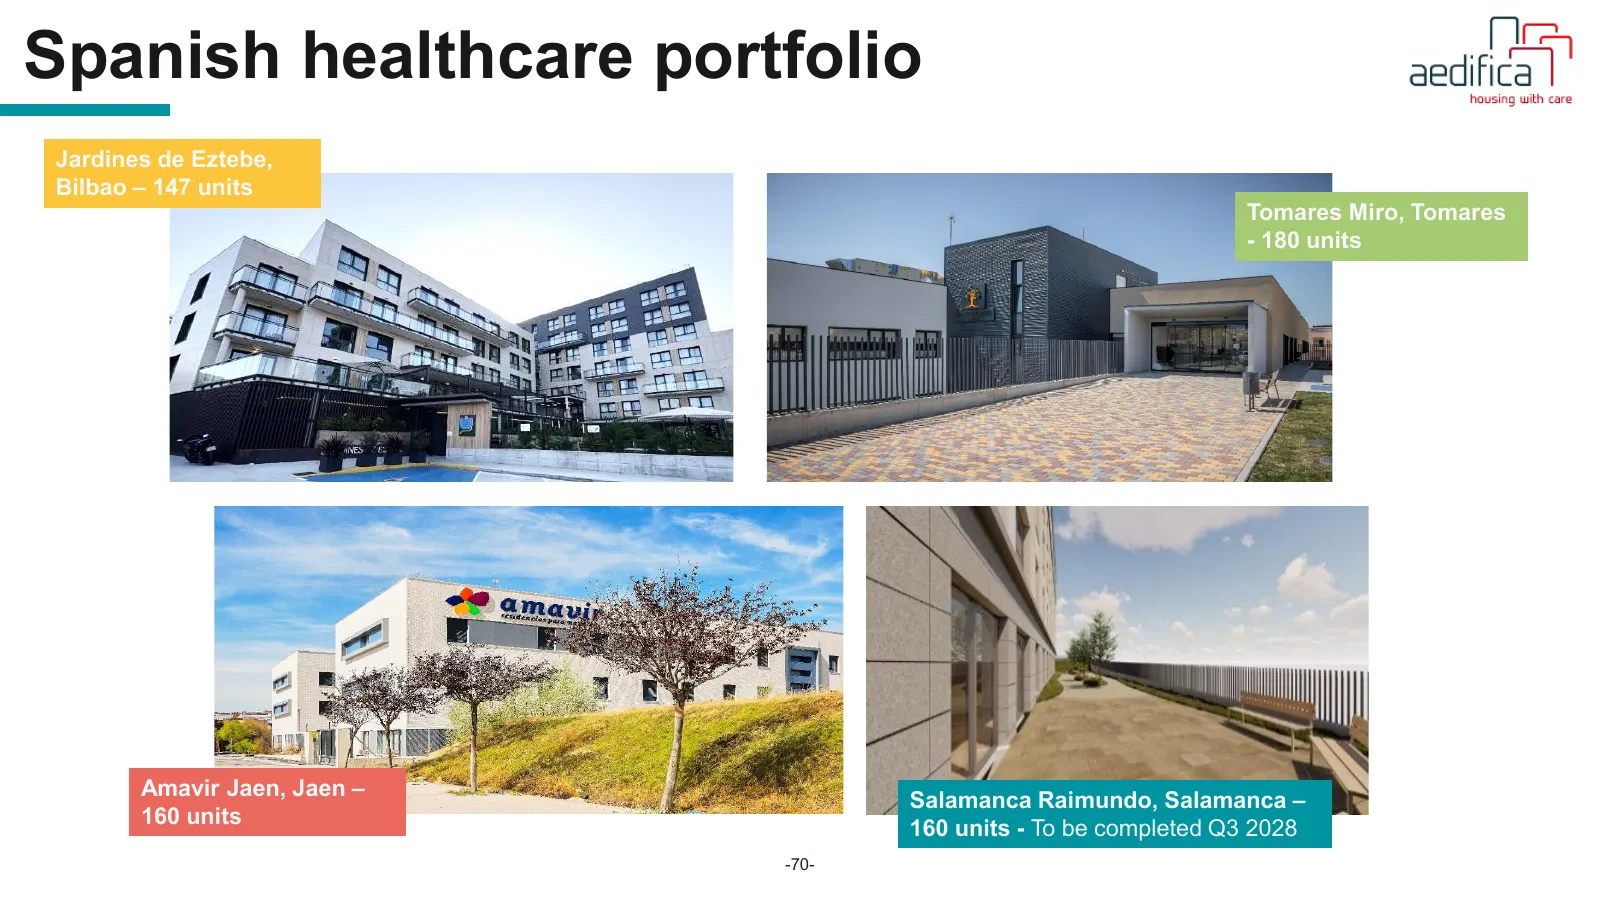
Slide 70: Spanish healthcare portfolio
Spanish healthcare portfolio Jardines de Eztebe, Bilbao – 147 units Tomares Miro, Tomares - 180 units Amavir Jaen, Jaen – Salamanca Raimundo, Salamanca – 160 units 160 units - To be completed Q3 2028 -70-
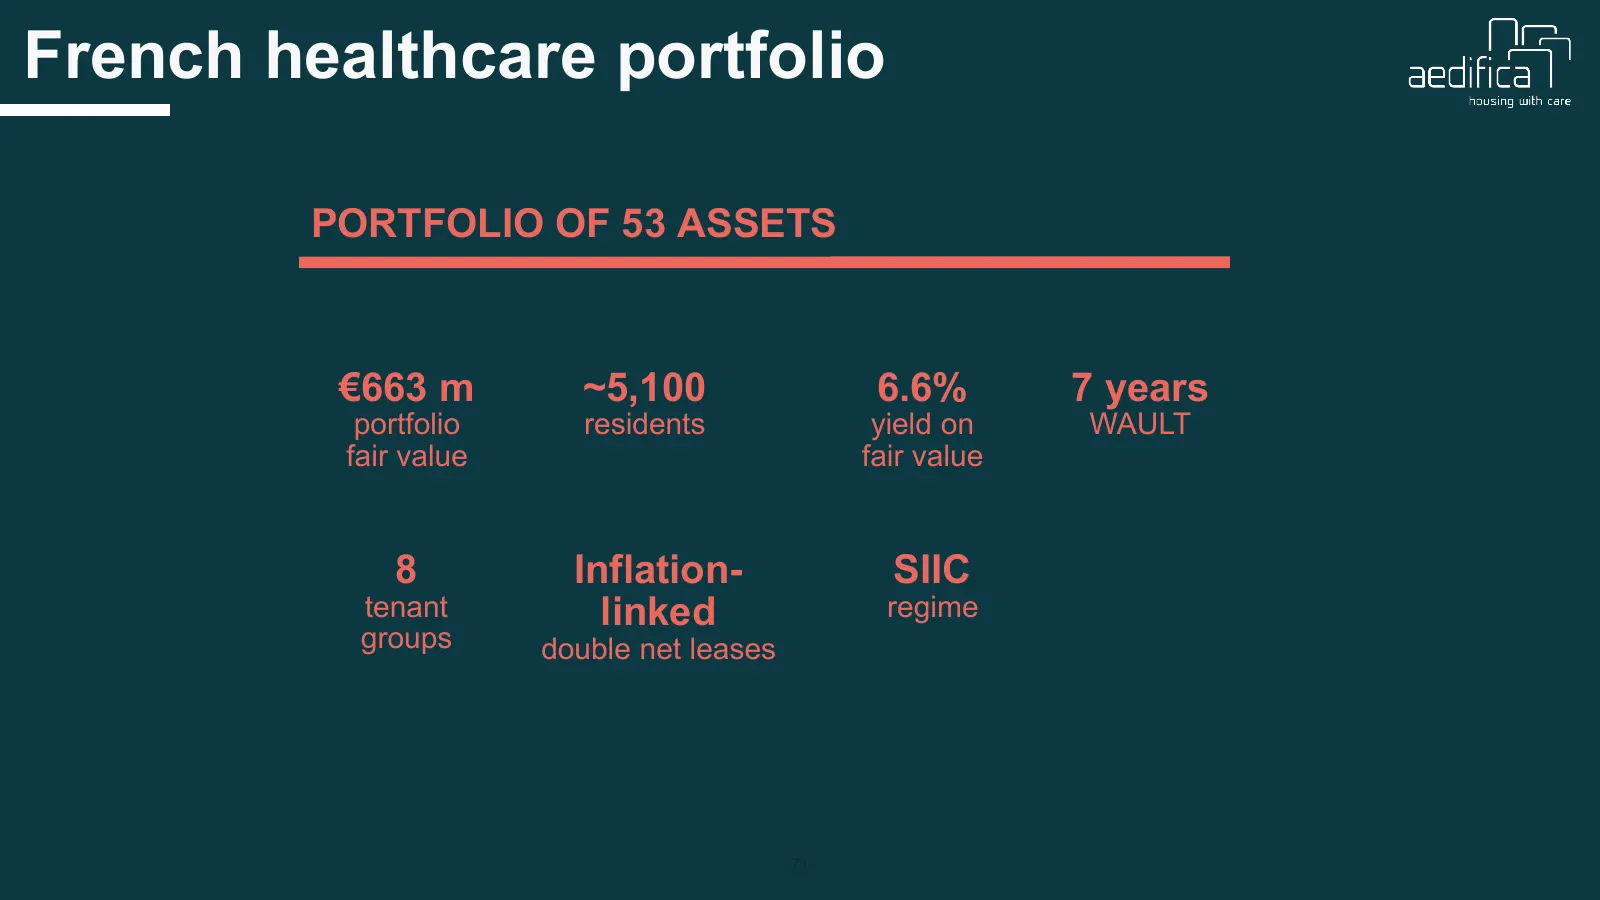
Slide 71: French healthcare portfolio
French healthcare portfolio PORTFOLIO OF 53 ASSETS €663 m ~5,100 6.6% 7 years portfolio residents yield on WAULT fair value fair value 8 Inflation- SIIC tenant linked regime groups double net leases -71-
Slide 72: French healthcare portfolio
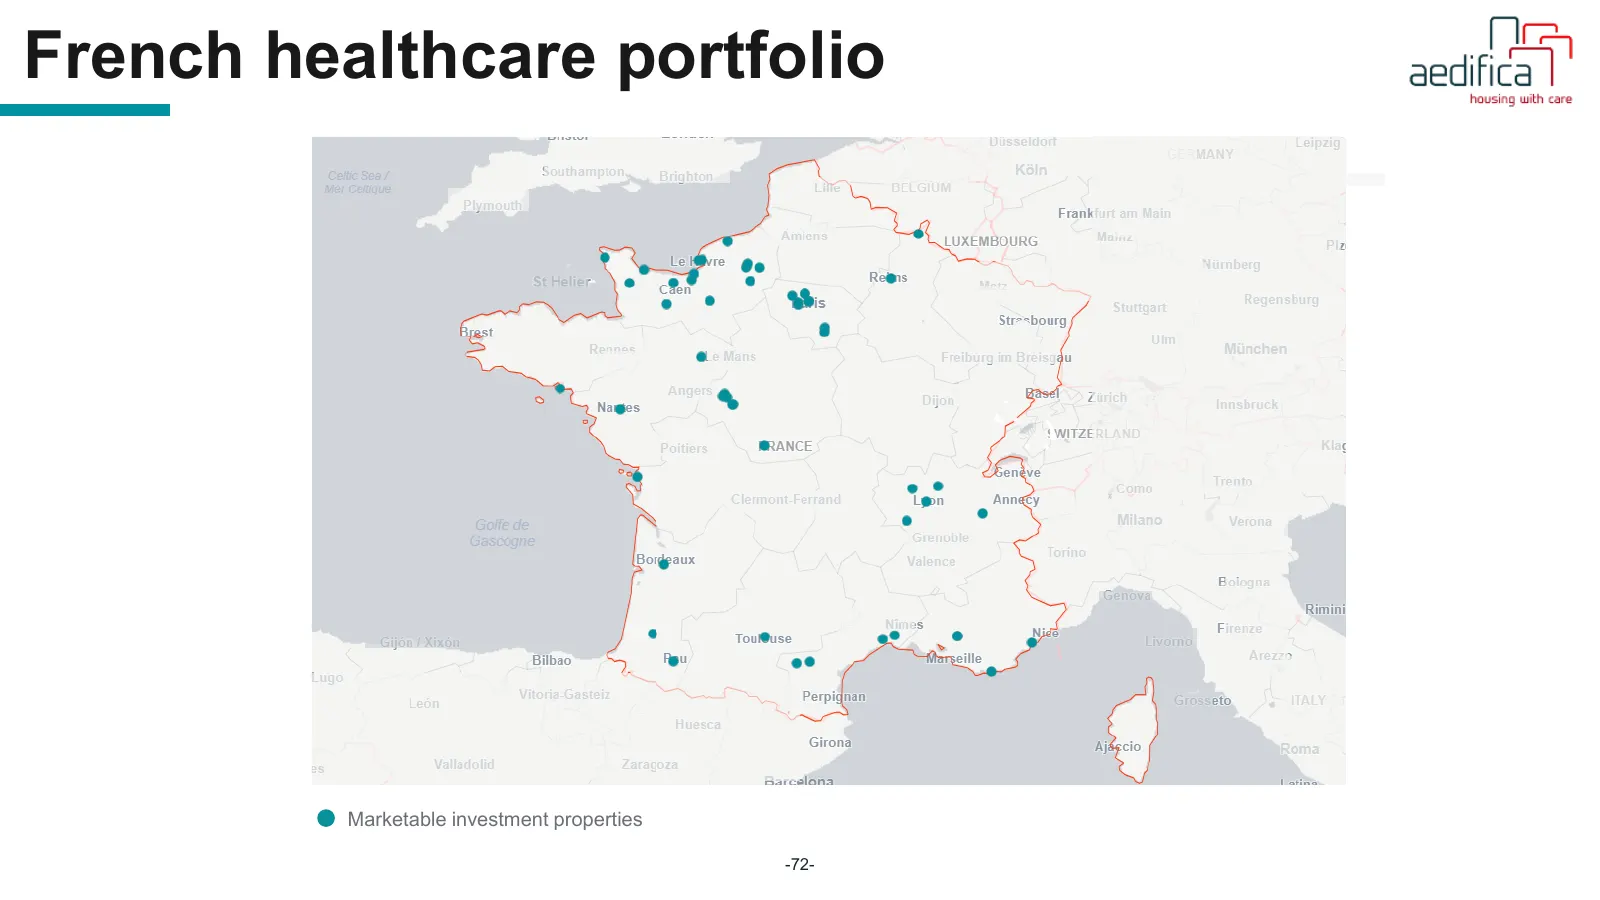
French healthcare portfolio Marketable investment properties -72-
Slide 73: French healthcare portfolio
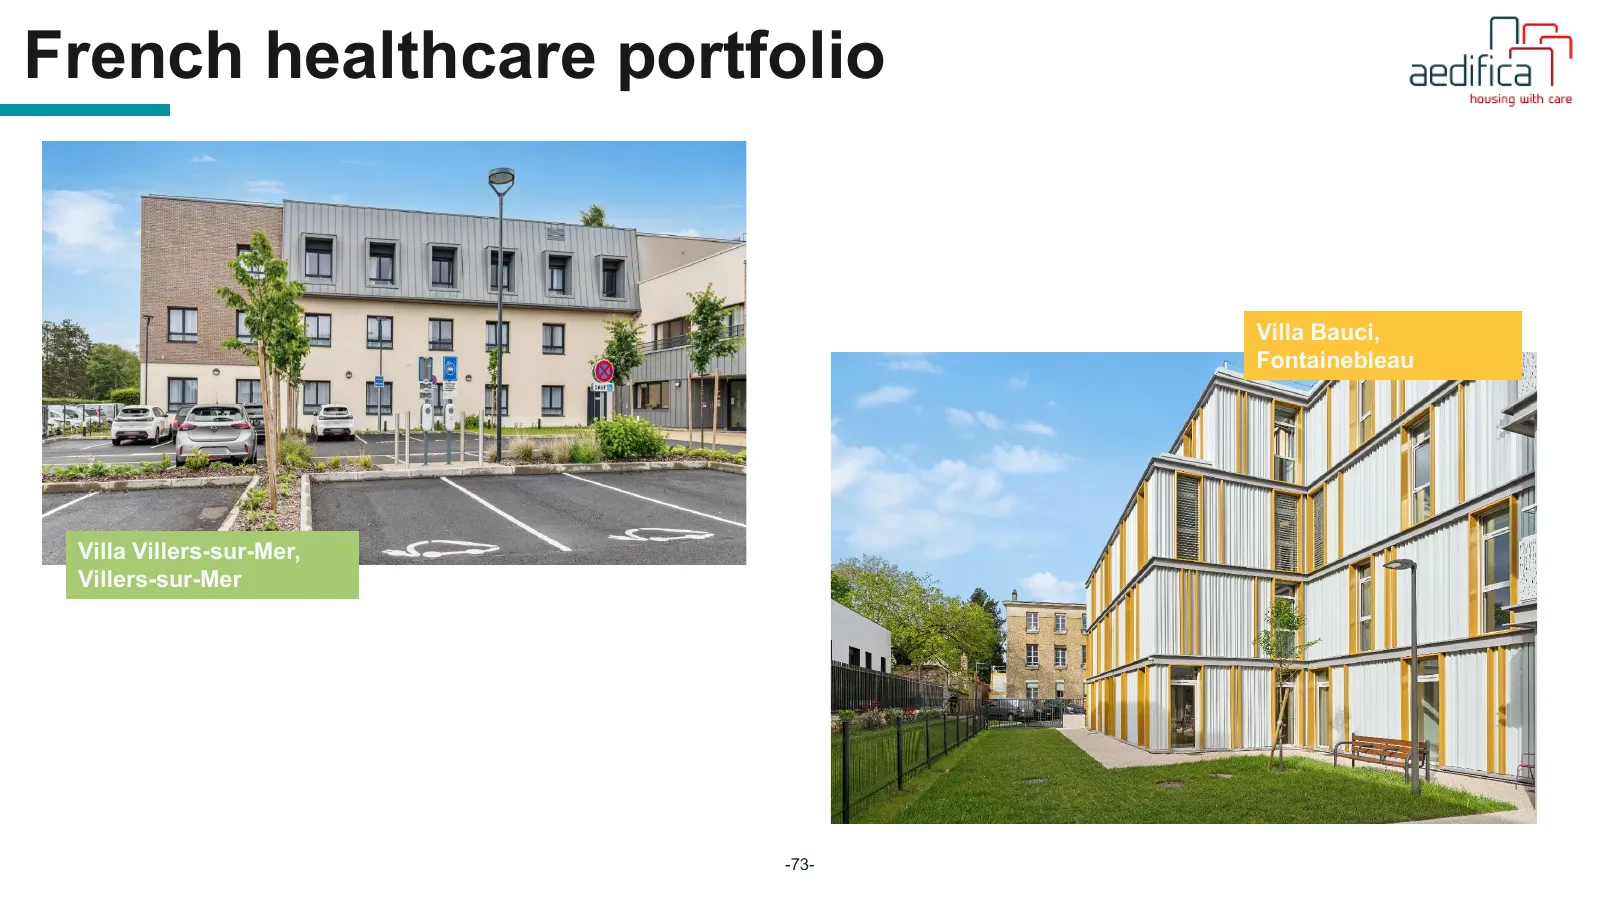
French healthcare portfolio Villa Bauci, Fontainebleau Villa Villers-sur-Mer, Villers-sur-Mer -73-
Slide 74: Italian healthcare portfolio
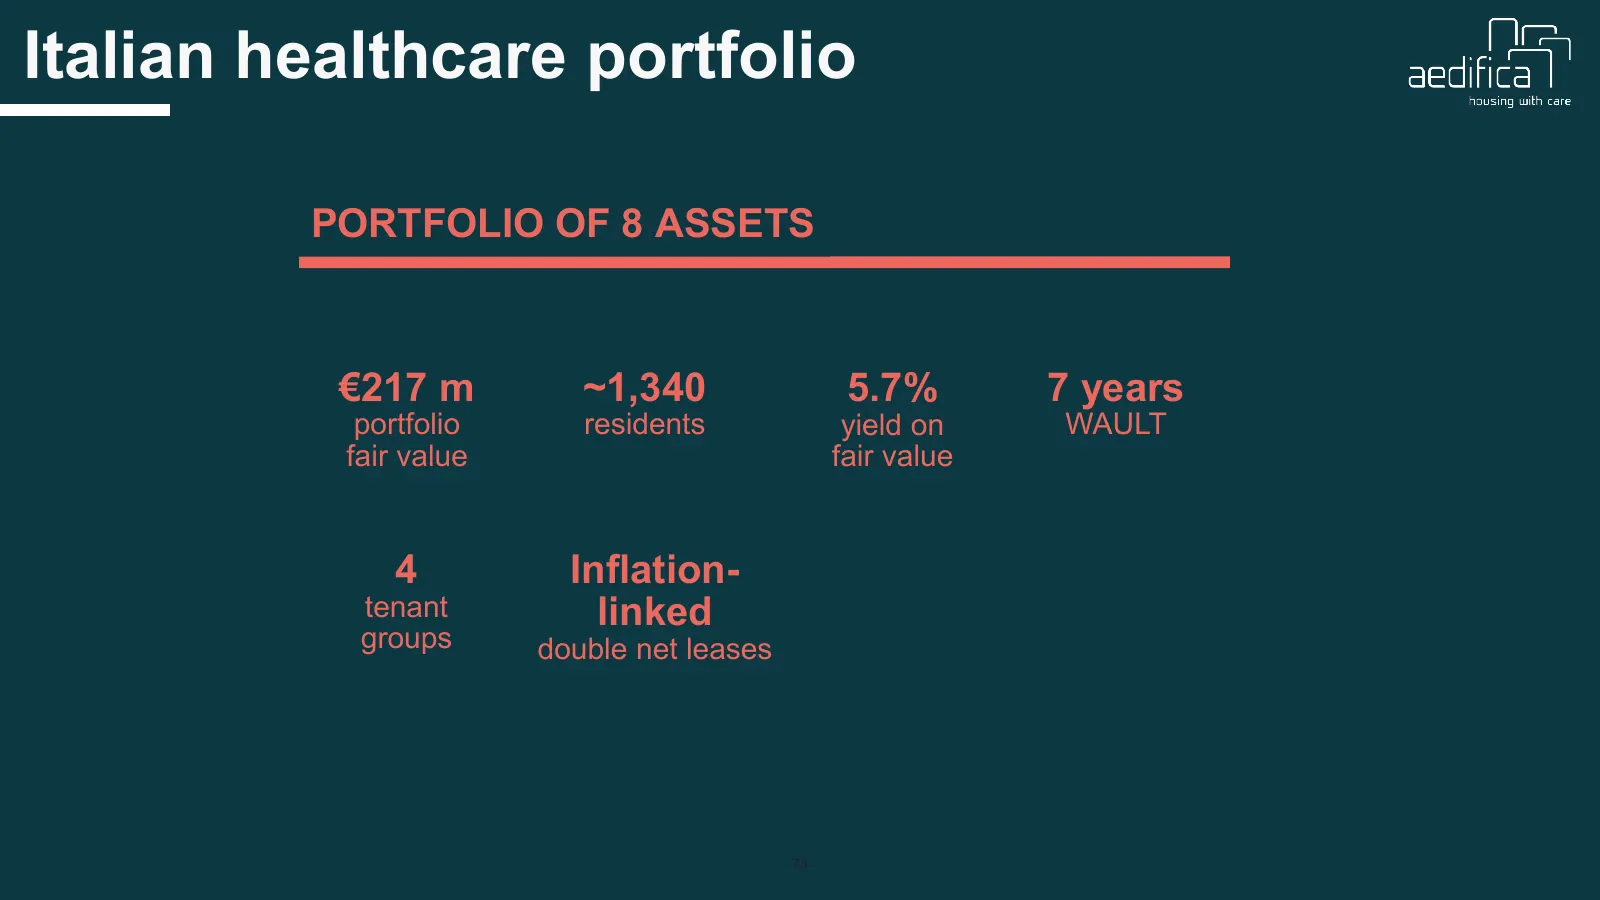
Italian healthcare portfolio PORTFOLIO OF 8 ASSETS €217 m ~1,340 5.7% 7 years portfolio residents yield on WAULT fair value fair value 4 Inflation- tenant linked groups double net leases -74-
Slide 75: Italian healthcare portfolio
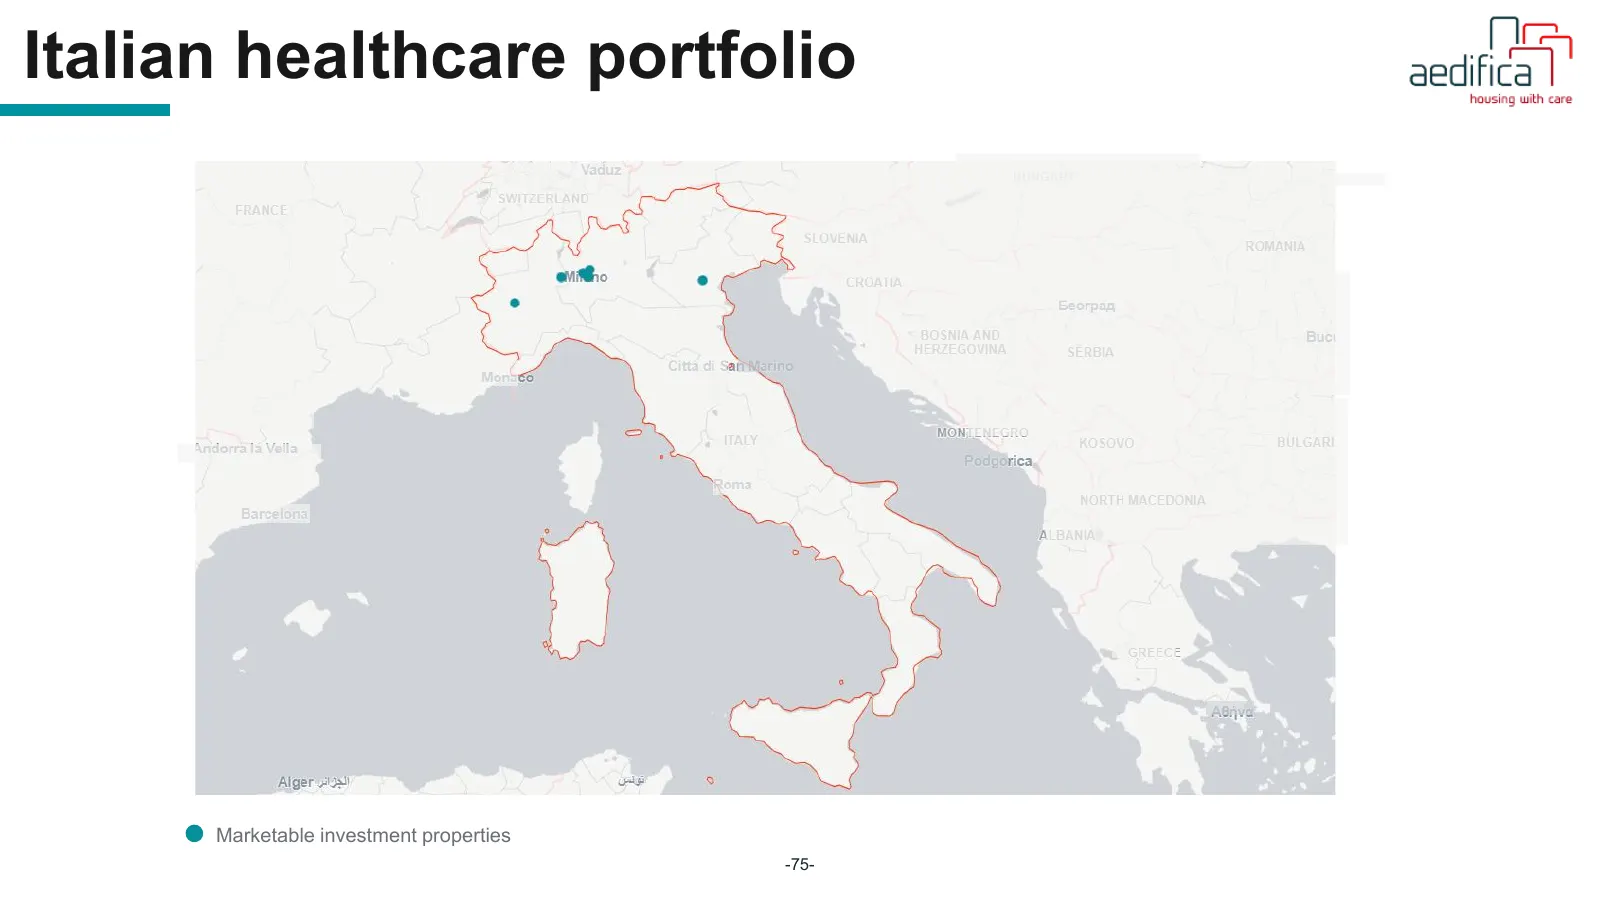
Italian healthcare portfolio Marketable investment properties -75-
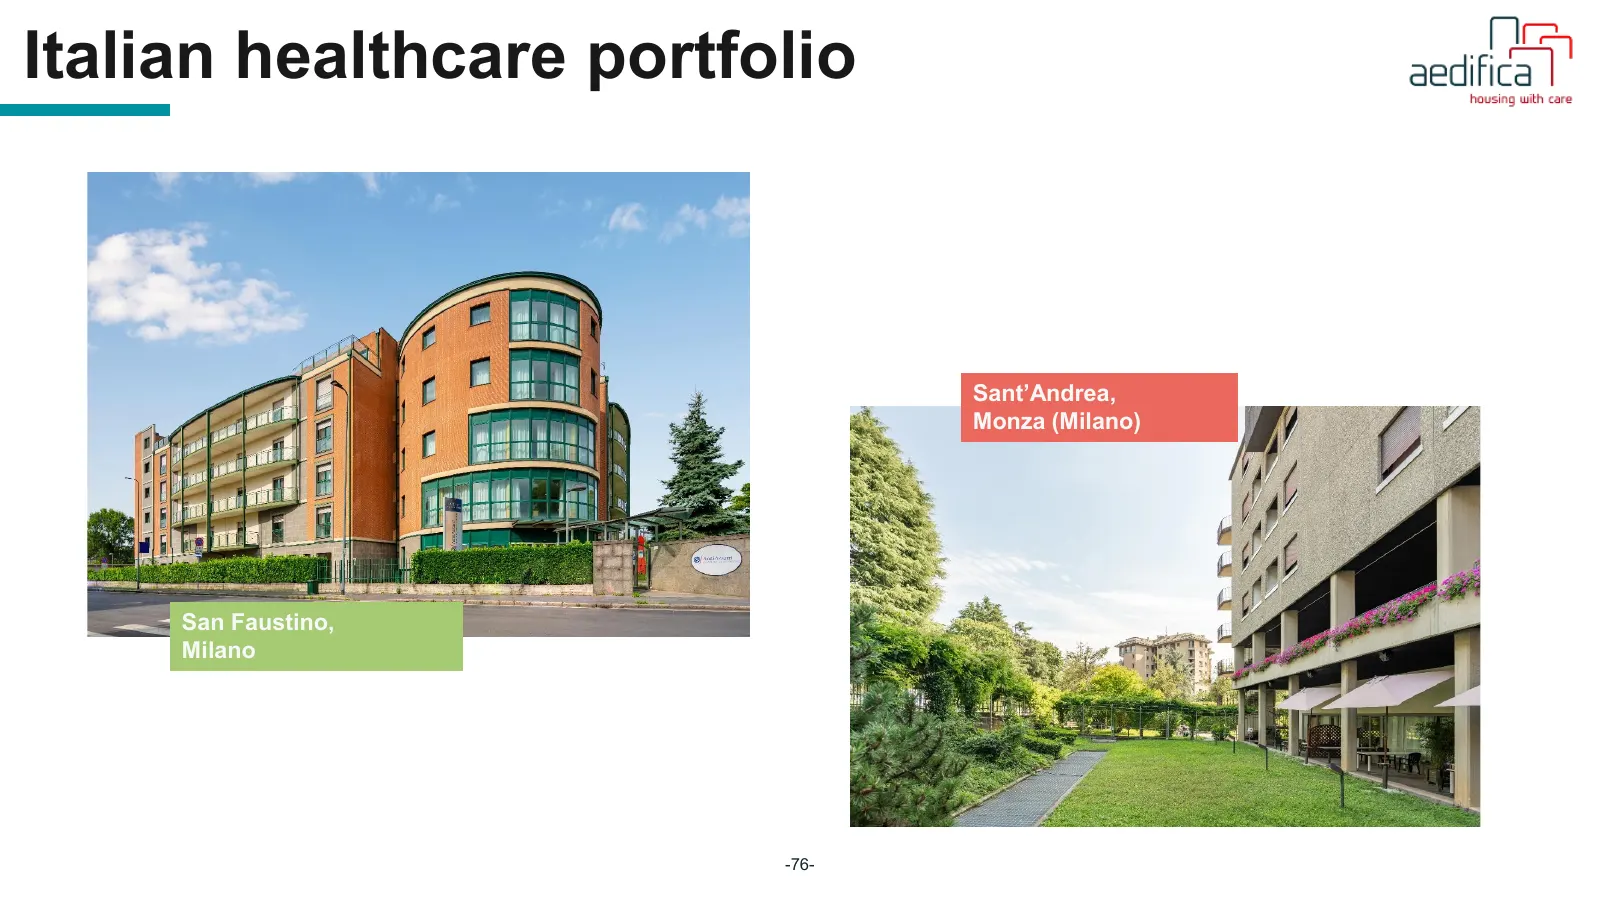
Slide 76: Italian healthcare portfolio
Italian healthcare portfolio Sant’Andrea, Monza (Milano) San Faustino, Milano -76-

Slide 77: Notes
fl Notes aedifica |" housing with care -TT-
Source: company website
More decks from Aedifica SA
 H1 2026 Earnings Presentation79 slides · Sep 1, 2026
 H1 2026 Earnings Presentation66 slides · Sep 1, 2026
 Q1 2026 Earnings Presentation79 slides · May 19, 2026
 FY2025 Earnings Presentation56 slides · Feb 13, 2026
 FY 2025 Earnings Presentation80 slides · Feb 13, 2026
 Finance Avenue 202529 slides · Nov 15, 2025