Cmb.tech NV · EURONEXT:CMBT
Cmb.tech NV — Q1 2024 Earnings Presentation
22 slides from Cmb.tech NV's earnings presentation, May 8, 2024
Slide 1: Decarbonise Today, Navigate Tomorrow – Earnings release Q1 2024
Decarbonise Today Navigate Tomorrow Earnings release Q1 2024 Alexander Saverys – Ludovic Saverys
Slide 2: Forward-looking statements
Forward-looking statements Matters discussed in this presentation may constitute forward-looking statements under U.S. federal securities laws, including the Private Securities Litigation Reform Act of 1995. Forward-looking statements reflect the Company’s current views with respect to future events
Slide 3: Presentation topics
Presentation topics 1. Q1 2024 financials & highlights 2. Marine division market update 1. TCE performance 2. Market outlook 3. Conclusion 4. Questions & Answers © 2024 – CMB.TECH 3
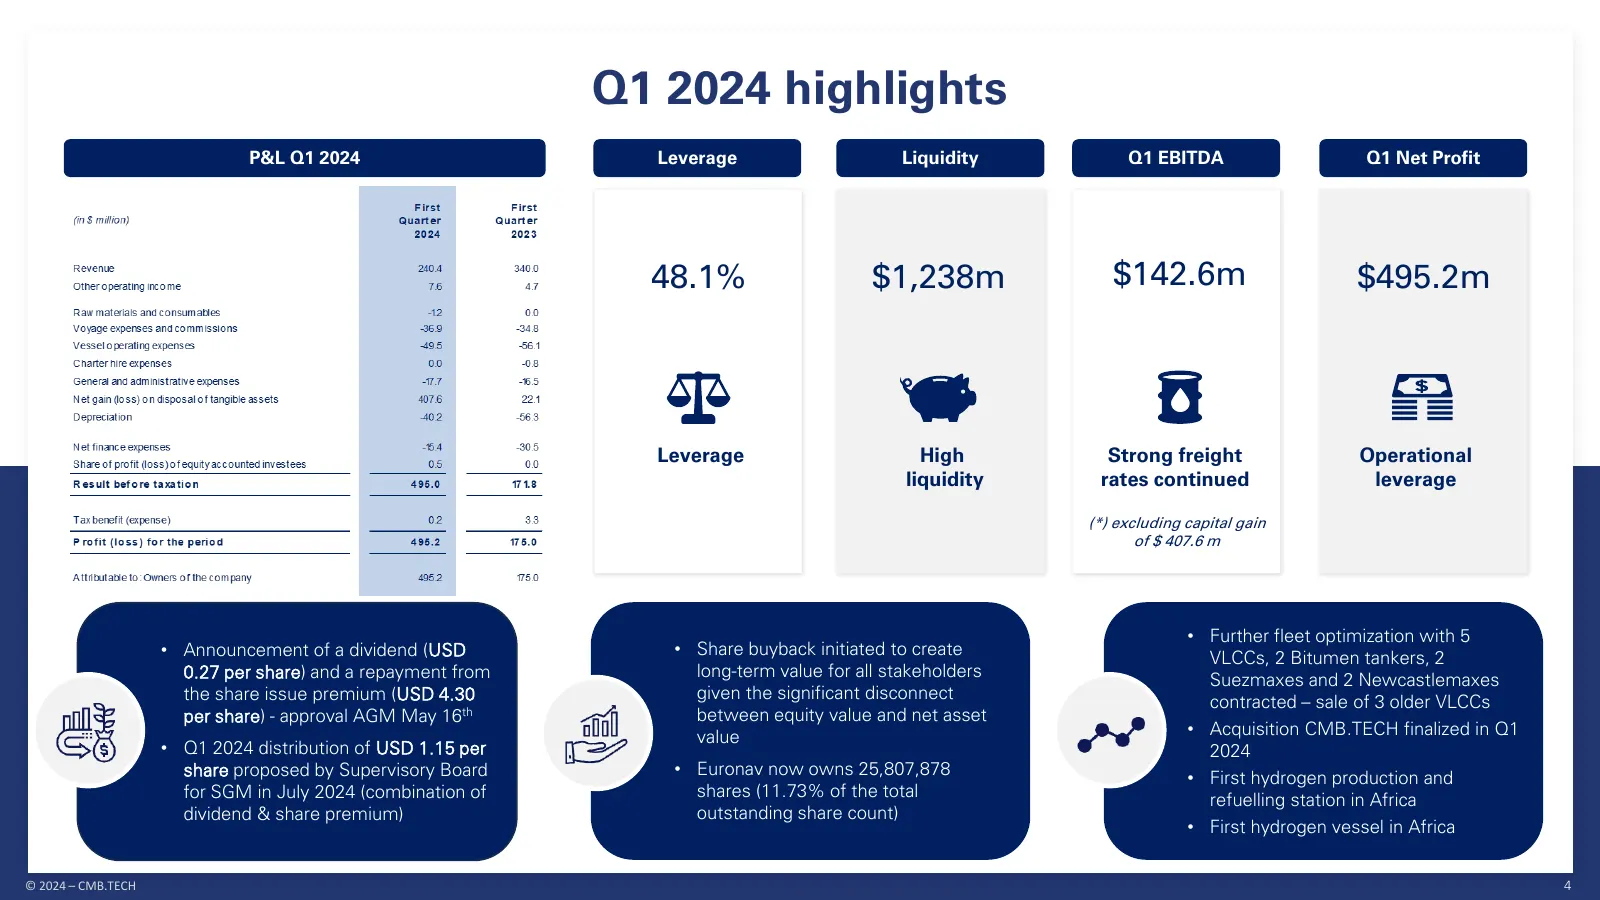
Slide 4: Q1 2024 highlights
Q1 2024 highlights P&L Q1 2024 Leverage Liquidity Q1 EBITDA Q1 Net Profit 48.1% $1,238m $142.6m $495.2m Leverage High Strong freight Operational liquidity rates continued leverage (*) excluding capital gain of $ 407.6 m • Further fleet optimization with 5 • Announcement of a dividend (USD • Share bu
Slide 5: 1. Q1 2024 financials & highlights
1. Q1 2024 financials & highlights © 2024 – CMB.TECH
Slide 6: Q1 2024 Marine division highlights
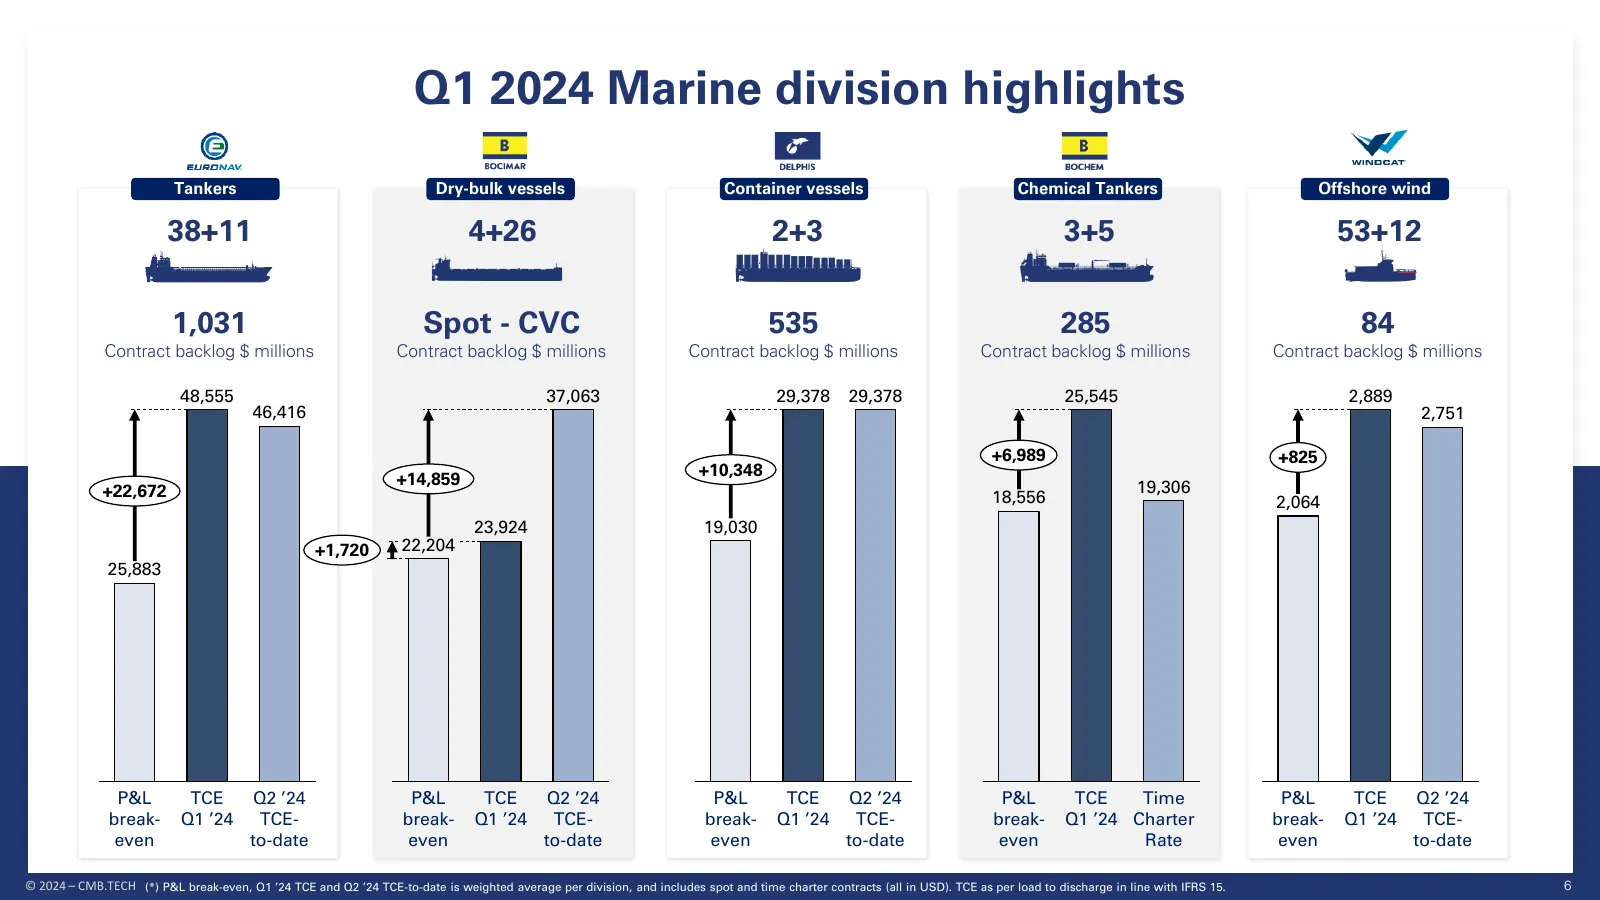
Q1 2024 Marine division highlights Tankers Dry-bulk vessels Container vessels Chemical Tankers Offshore wind 38+11 4+26 2+3 3+5 53+12 1,031 Spot - CVC 535 285 84 Contract backlog $ millions Contract backlog $ millions Contract backlog $ millions Contract backlog $ millions Contract backlog $ million
Slide 7: Marine division available days
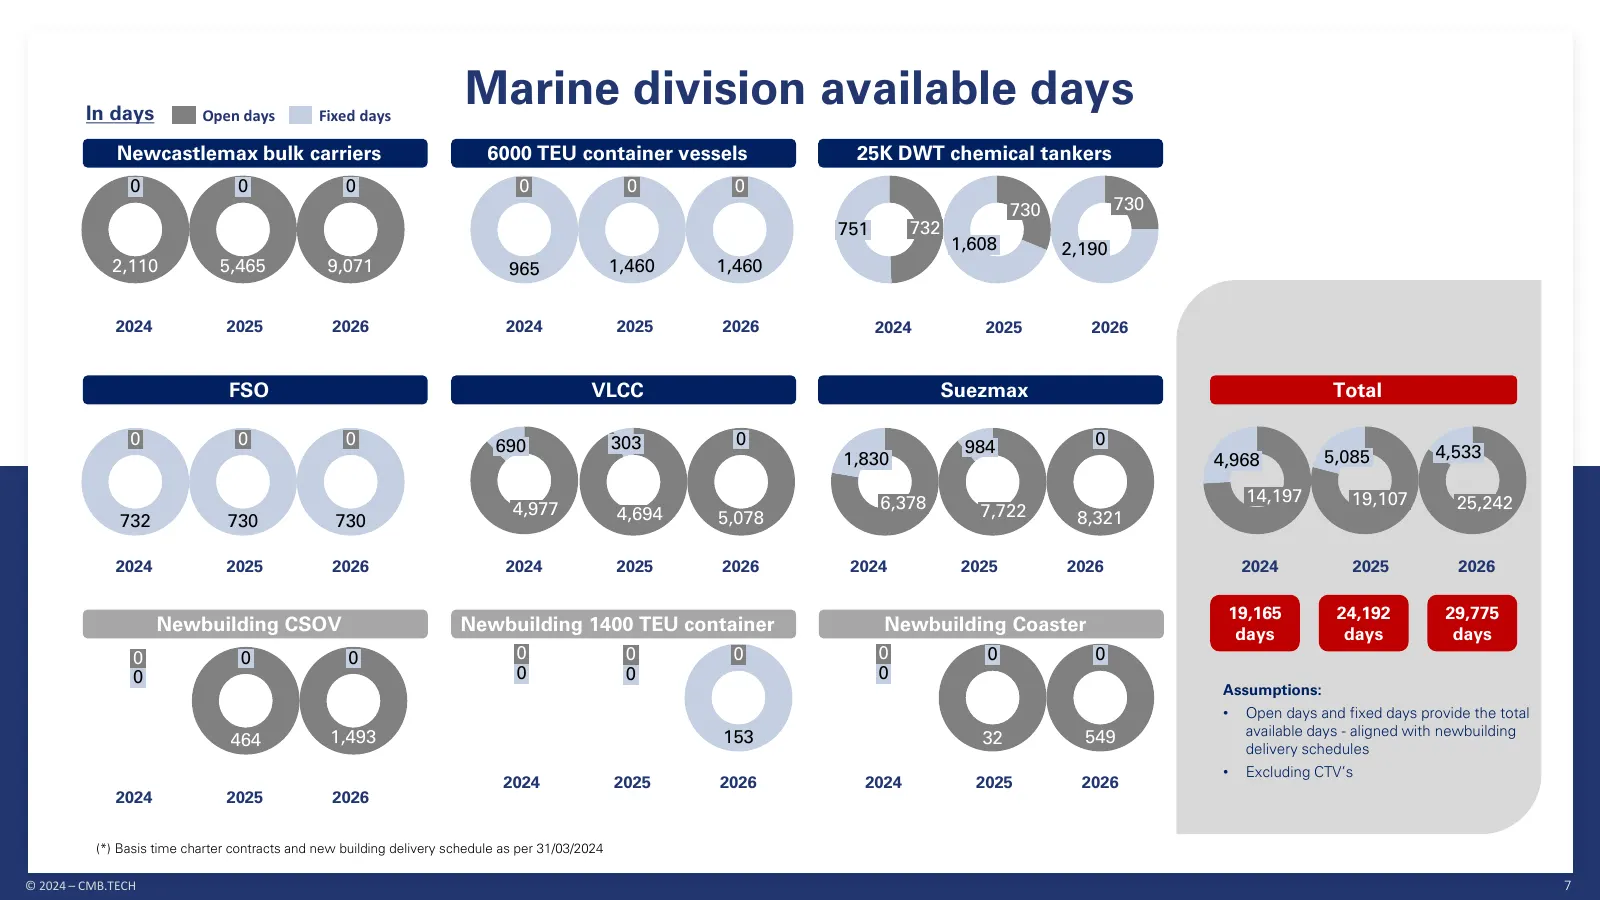
In days Open days Fixed days Marine division available days Newcastlemax bulk carriers 6000 TEU container vessels 25K DWT chemical tankers 0 0 0 0 0 0 730 730 751 732 1,608 2,190 2,110 5,465 9,071 965 1,460 1,460 2024 2025 2026 2024 2025 2026 2024 2025 2026 FSO VLCC Suezmax Total 0 0 0 690 303 0 984
Slide 8: Q1 2024 highlights – full steam ahead!
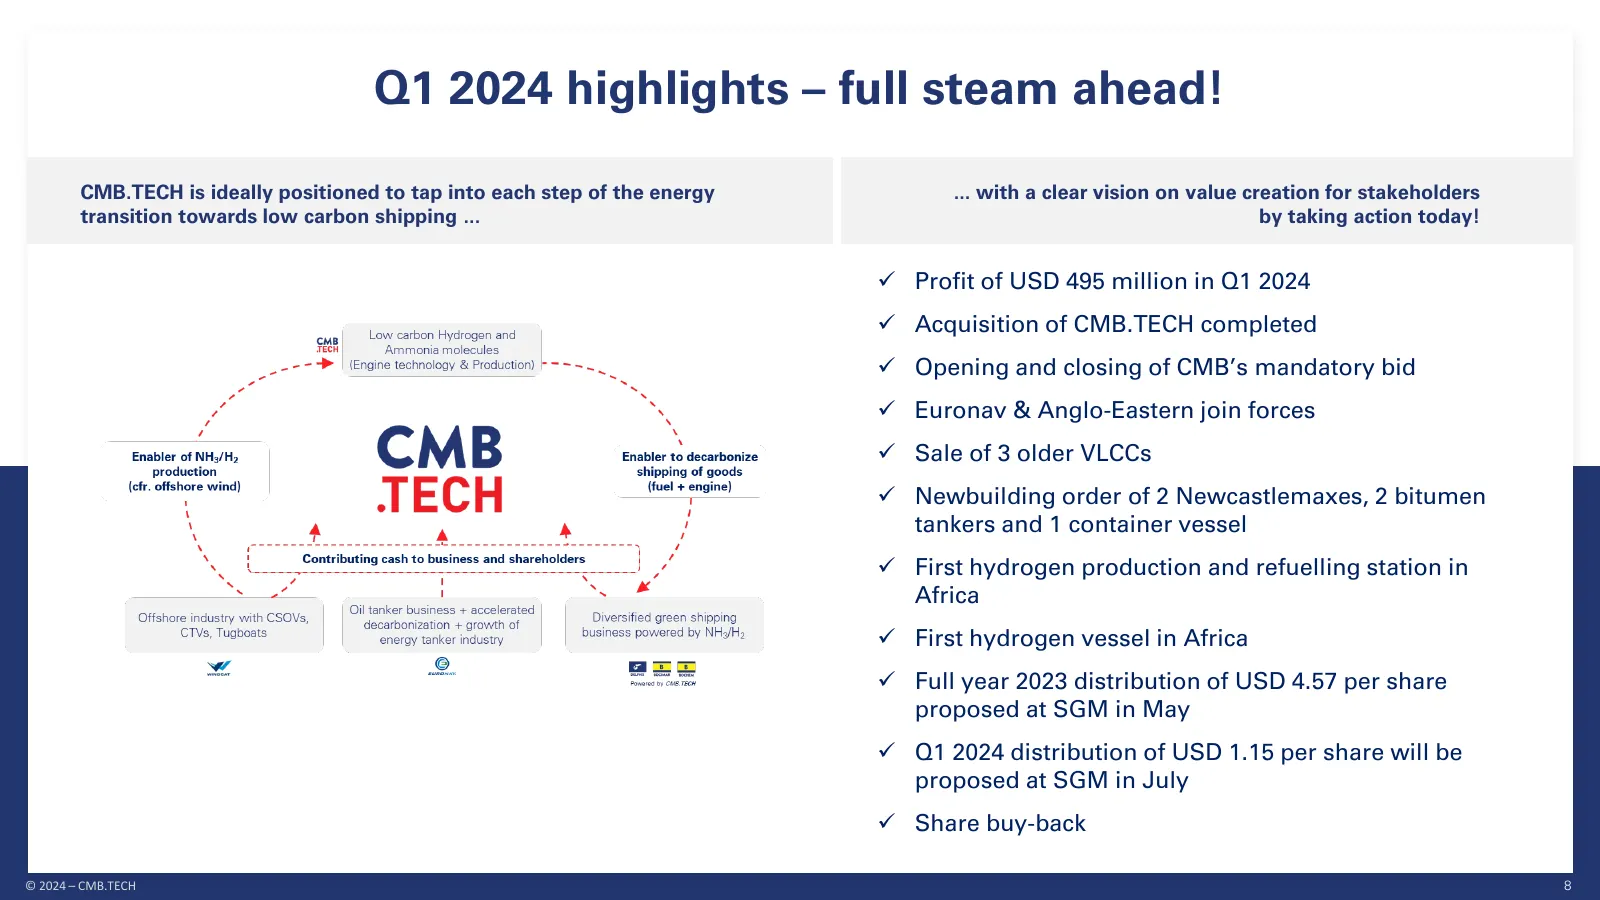
Q1 2024 highlights – full steam ahead! CMB.TECH is ideally positioned to tap into each step of the energy ... with a clear vision on value creation for stakeholders transition towards low carbon shipping ... by taking action today! ✓ Profit of USD 495 million in Q1 2024 ✓ Acquisition of CMB.TECH com
Slide 9: 2. Marine division market update
2. Marine division market update © 2024 – CMB.TECH
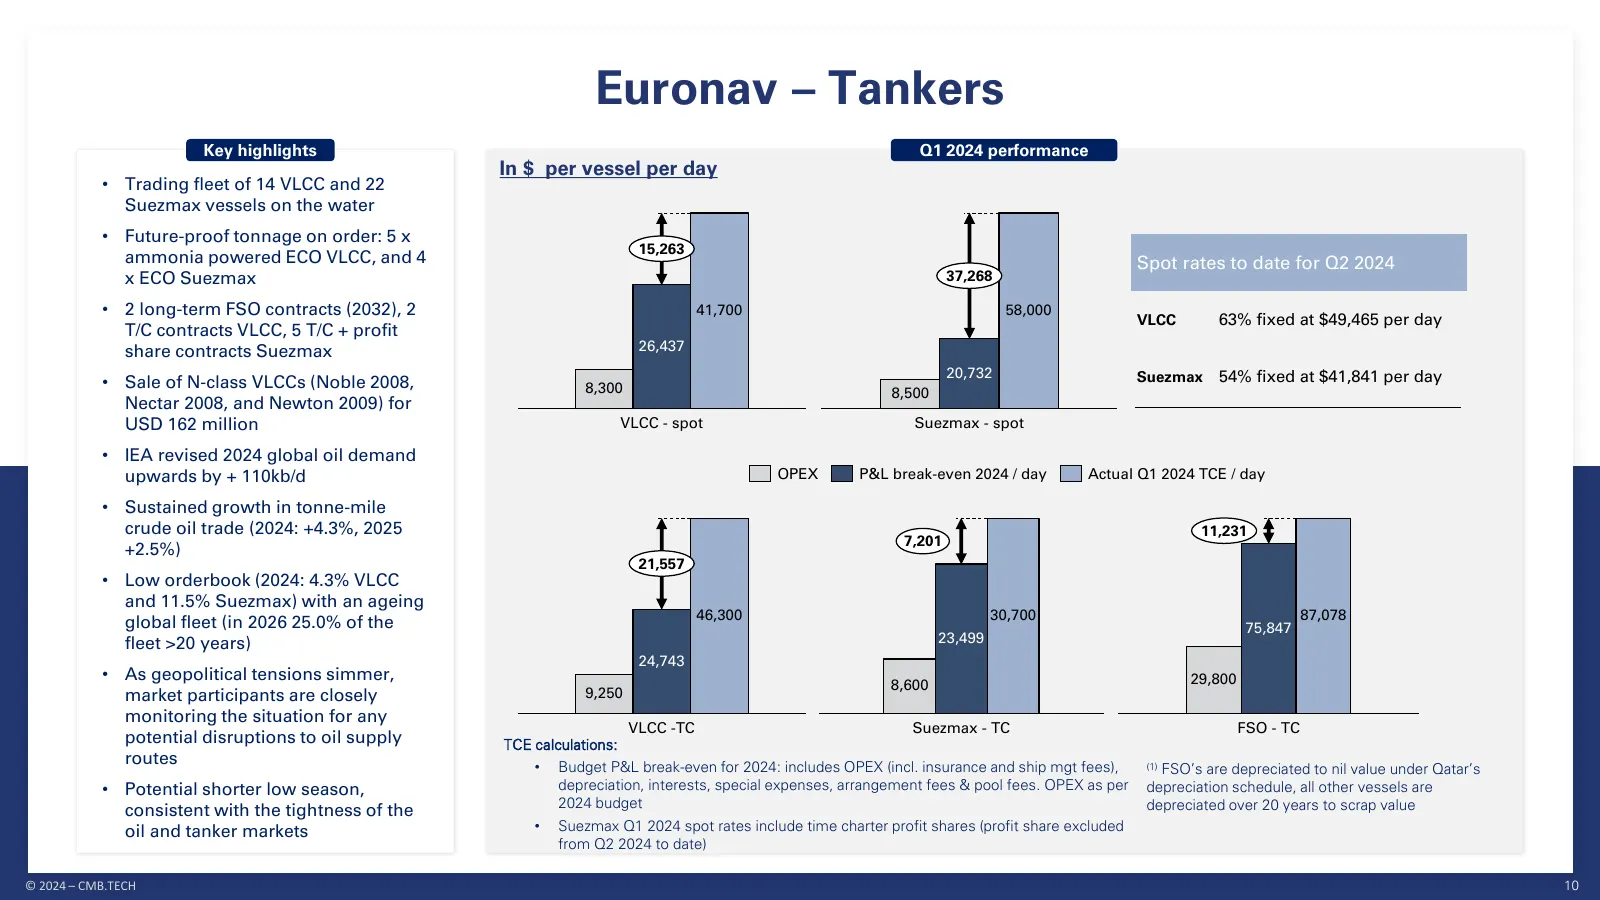
Slide 10: Euronav – Tankers
Euronav – Tankers Key highlights Q1 2024 performance In $ per vessel per day • Trading fleet of 14 VLCC and 22 Suezmax vessels on the water • Future-proof tonnage on order: 5 x 15,263 ammonia powered ECO VLCC, and 4 Spot rates to date for Q2 2024 x ECO Suezmax 37,268 • 2 long-term FSO contracts (203
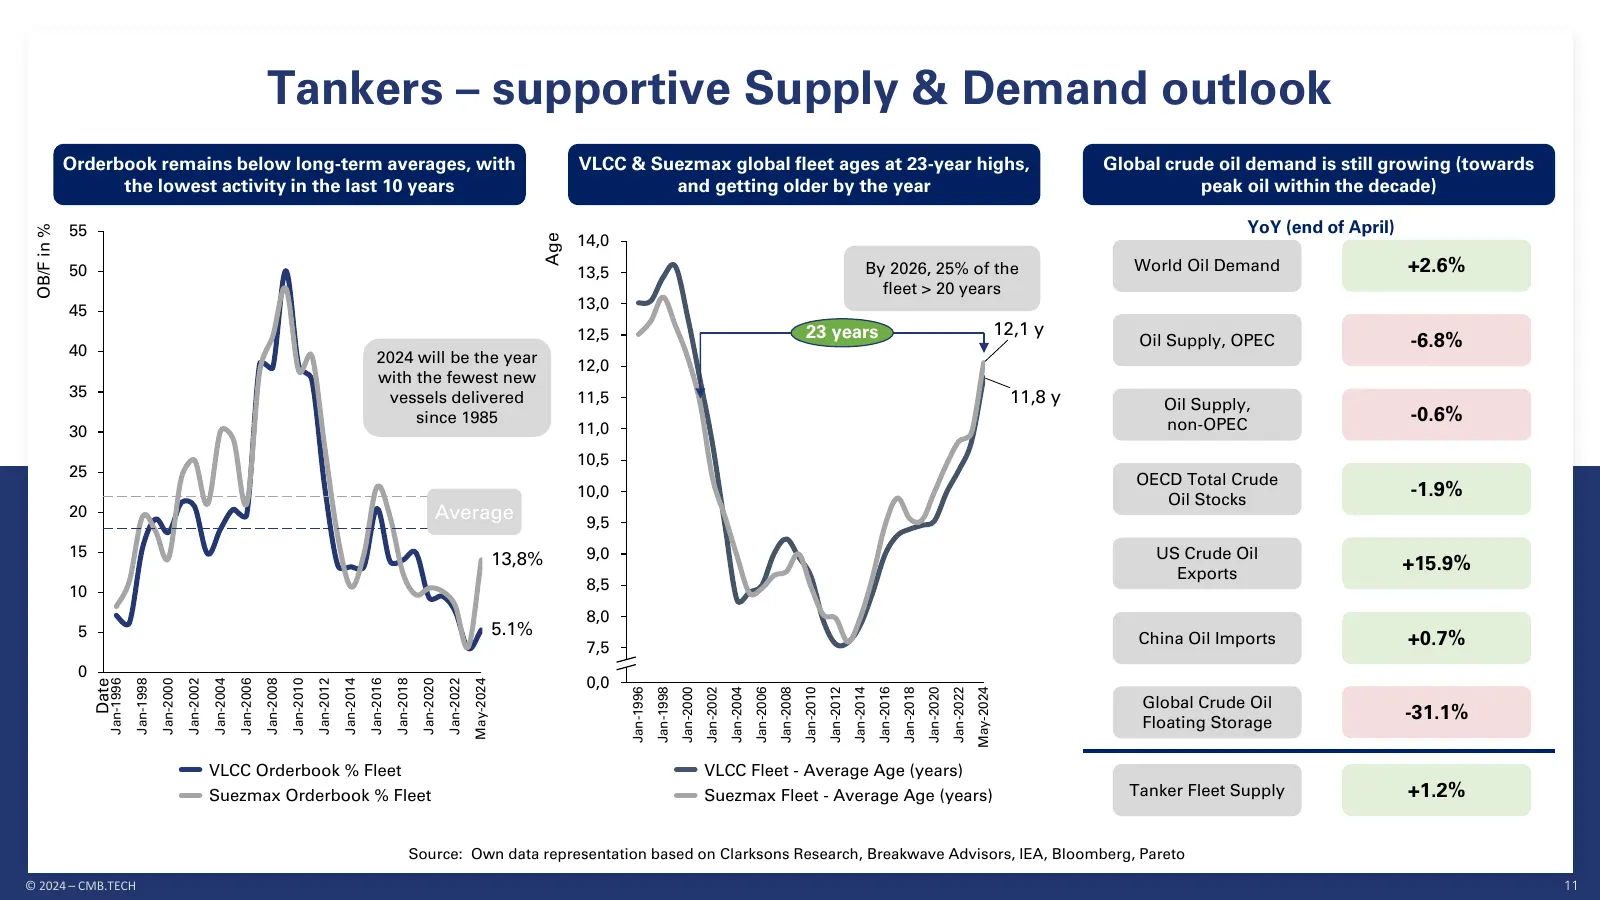
Slide 11: Tankers – supportive Supply & Demand outlook
Tankers – supportive Supply & Demand outlook Orderbook remains below long-term averages, with VLCC & Suezmax global fleet ages at 23-year highs, Global crude oil demand is still growing (towards the lowest activity in the last 10 years and getting older by the year peak oil within the decade) 55 YoY
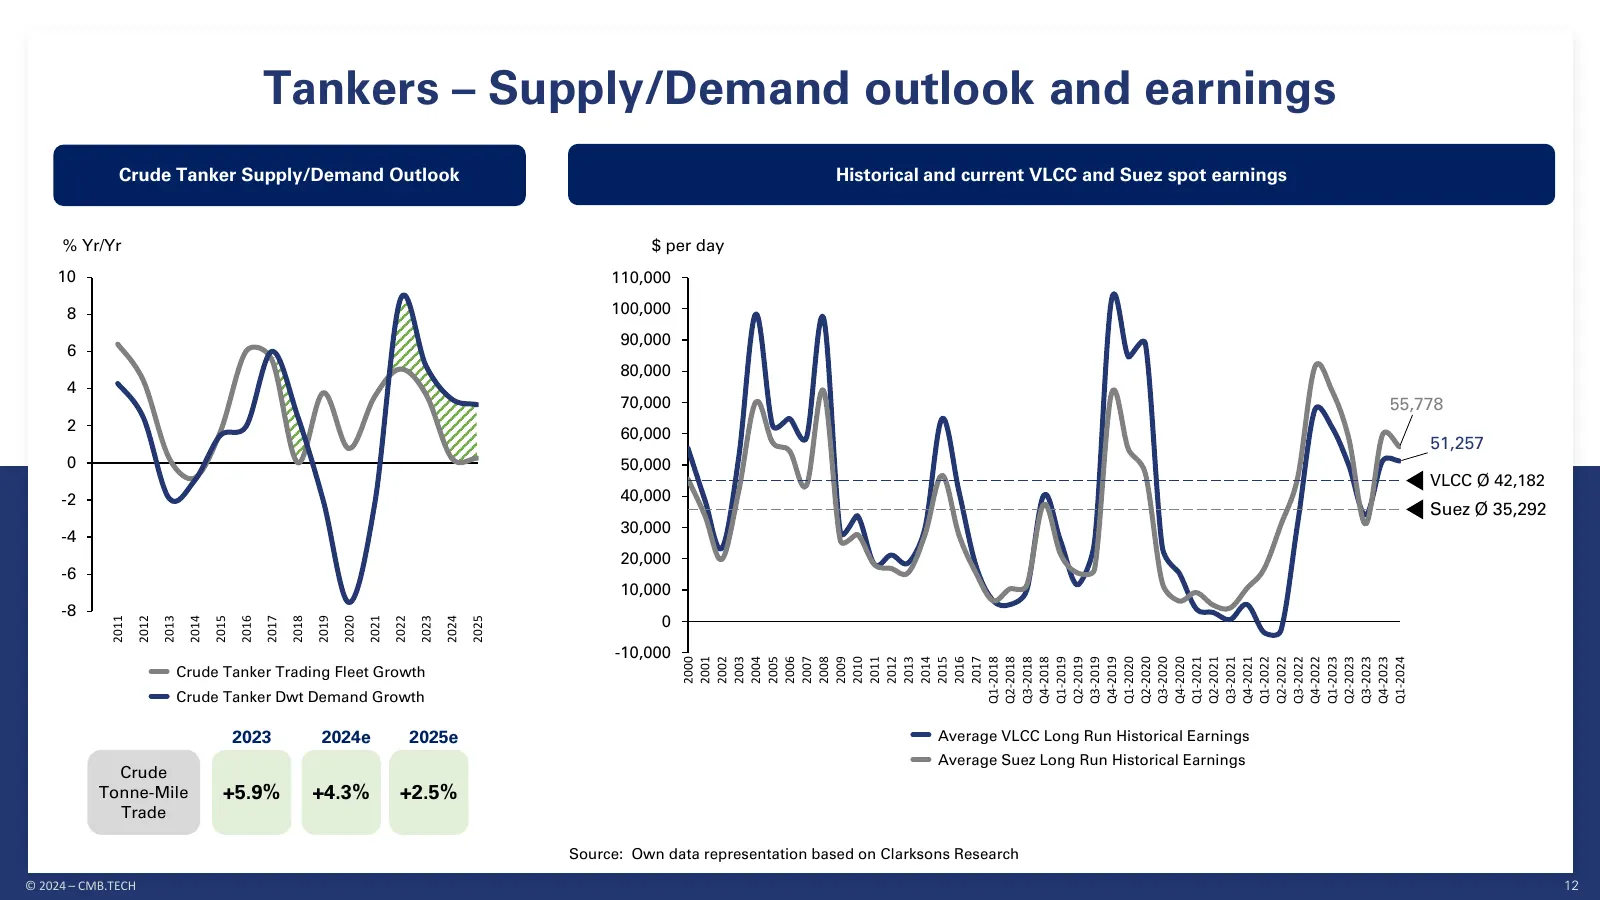
Slide 12: Tankers – Supply/Demand outlook and earnings
Tankers – Supply/Demand outlook and earnings Crude Tanker Supply/Demand Outlook Historical and current VLCC and Suez spot earnings % Yr/Yr $ per day 10 110,000 8 100,000 90,000 6 80,000 4 70,000 55,778 2 60,000 51,257 0 50,000 VLCC Ø 42,182 -2 40,000 Suez Ø 35,292 30,000 -4 20,000 -6 10,000 -8 0 201
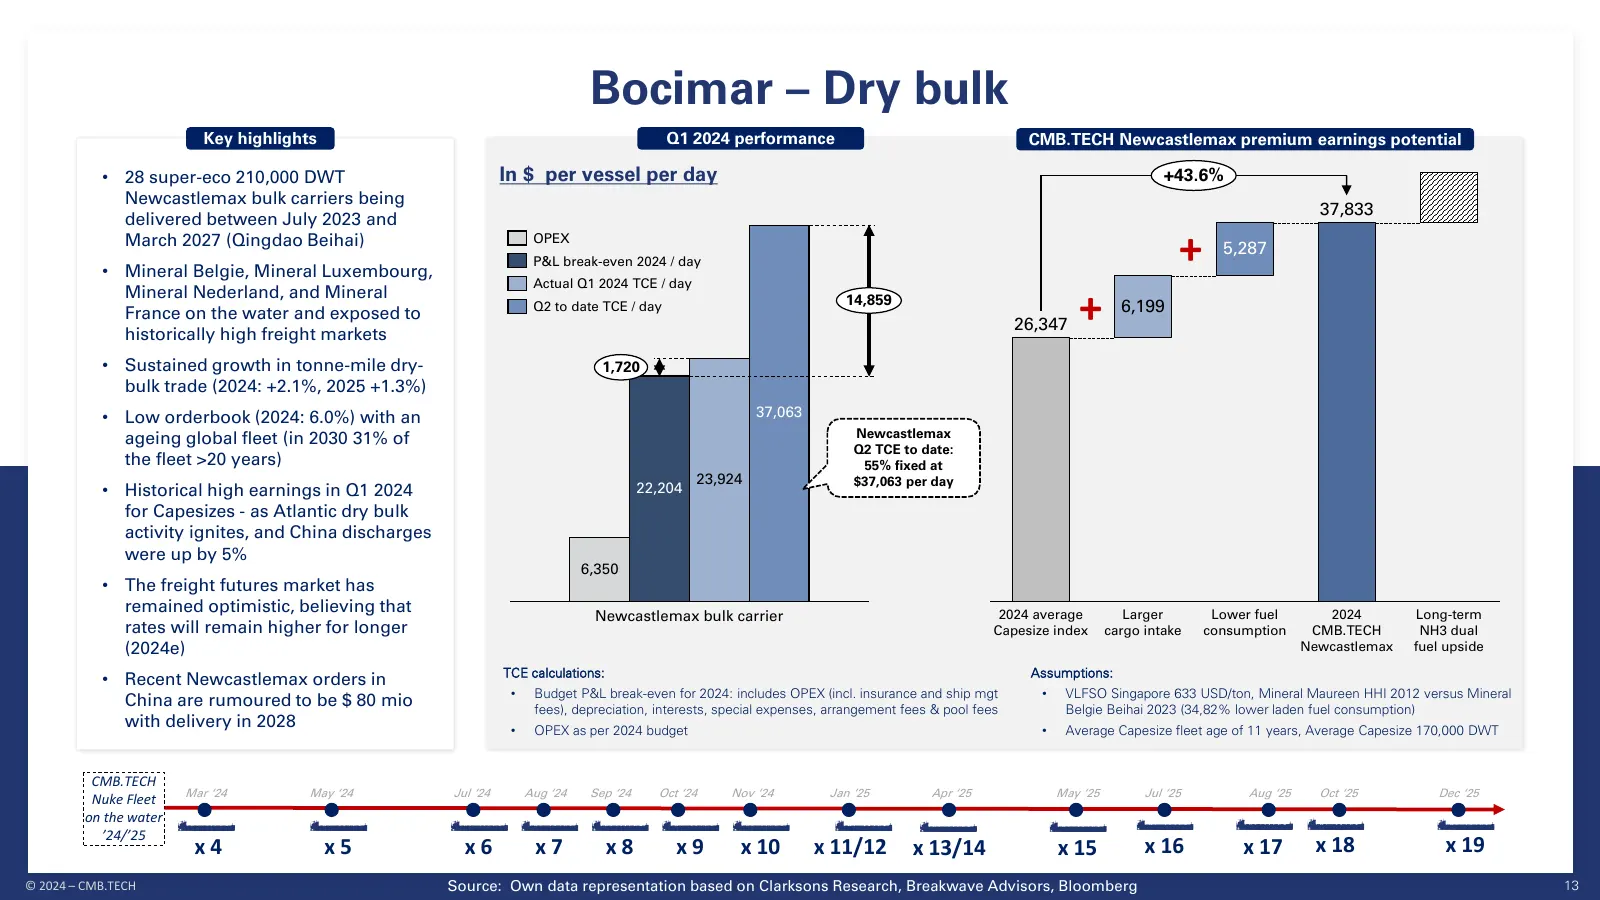
Slide 13: Bocimar – Dry bulk
Bocimar – Dry bulk Key highlights Q1 2024 performance CMB.TECH Newcastlemax premium earnings potential • 28 super-eco 210,000 DWT In $ per vessel per day +43.6% Newcastlemax bulk carriers being 37,833 delivered between July 2023 and March 2027 (Qingdao Beihai) • Mineral Belgie, Mineral Luxembourg, O
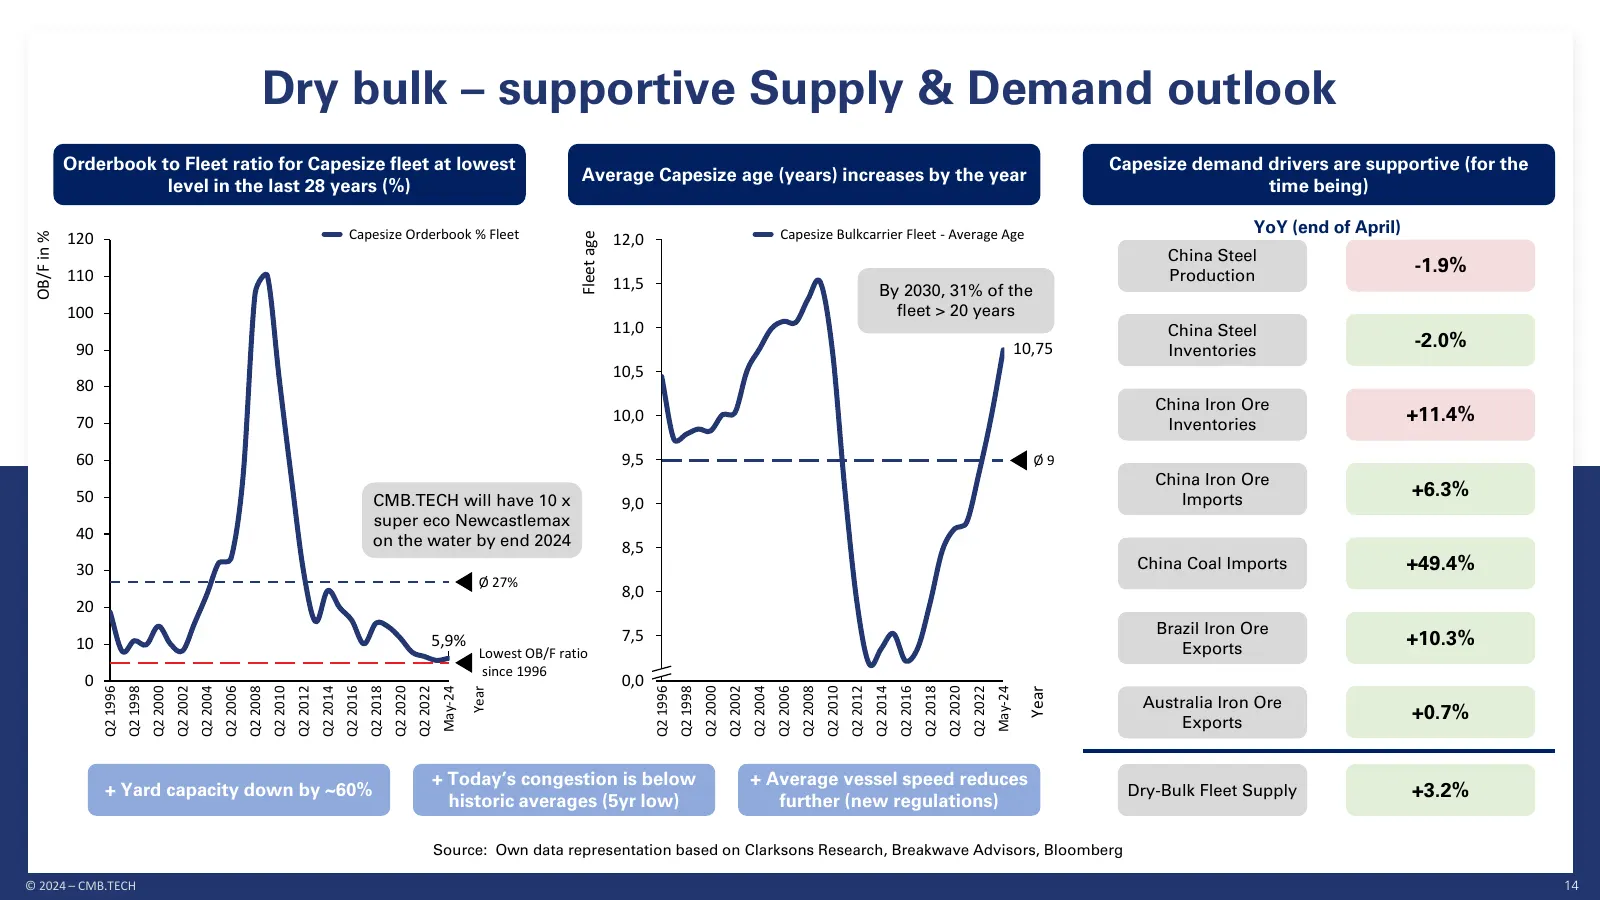
Slide 14: Dry bulk – supportive Supply & Demand outlook
Dry bulk – supportive Supply & Demand outlook Orderbook to Fleet ratio for Capesize fleet at lowest Capesize demand drivers are supportive (for the Average Capesize age (years) increases by the year level in the last 28 years (%) time being) Capesize Orderbook % Fleet Capesize Bulkcarrier Fleet - Av
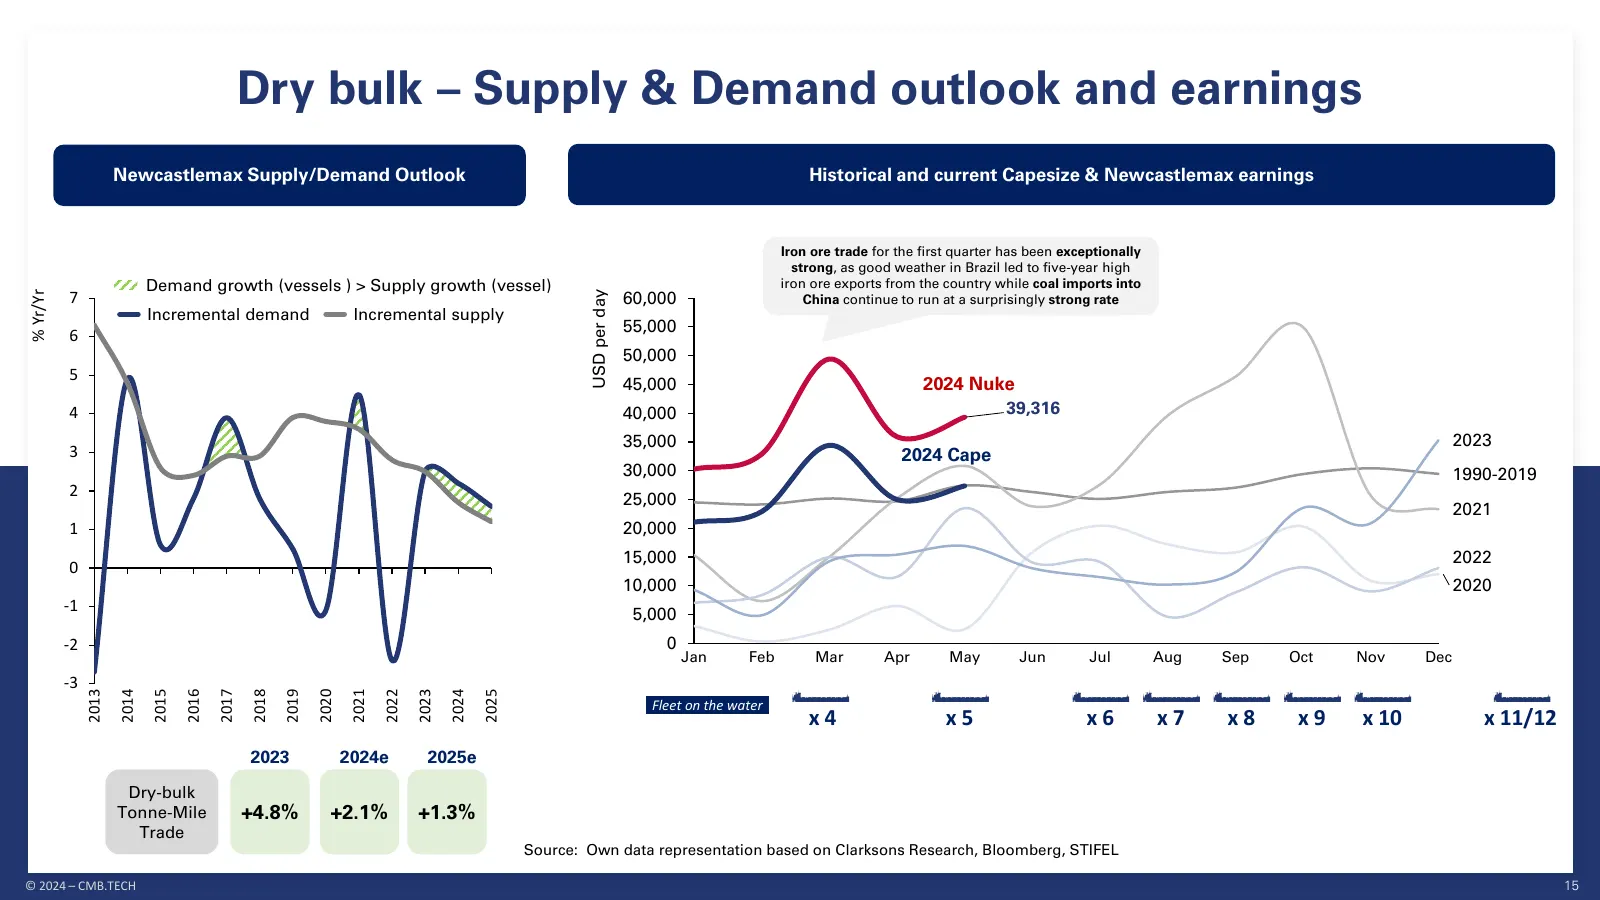
Slide 15: Dry bulk – Supply & Demand outlook and earnings
Dry bulk – Supply & Demand outlook and earnings Newcastlemax Supply/Demand Outlook Historical and current Capesize & Newcastlemax earnings Iron ore trade for the first quarter has been exceptionally strong, as good weather in Brazil led to five-year high Demand growth (vessels ) > Supply growth (ves
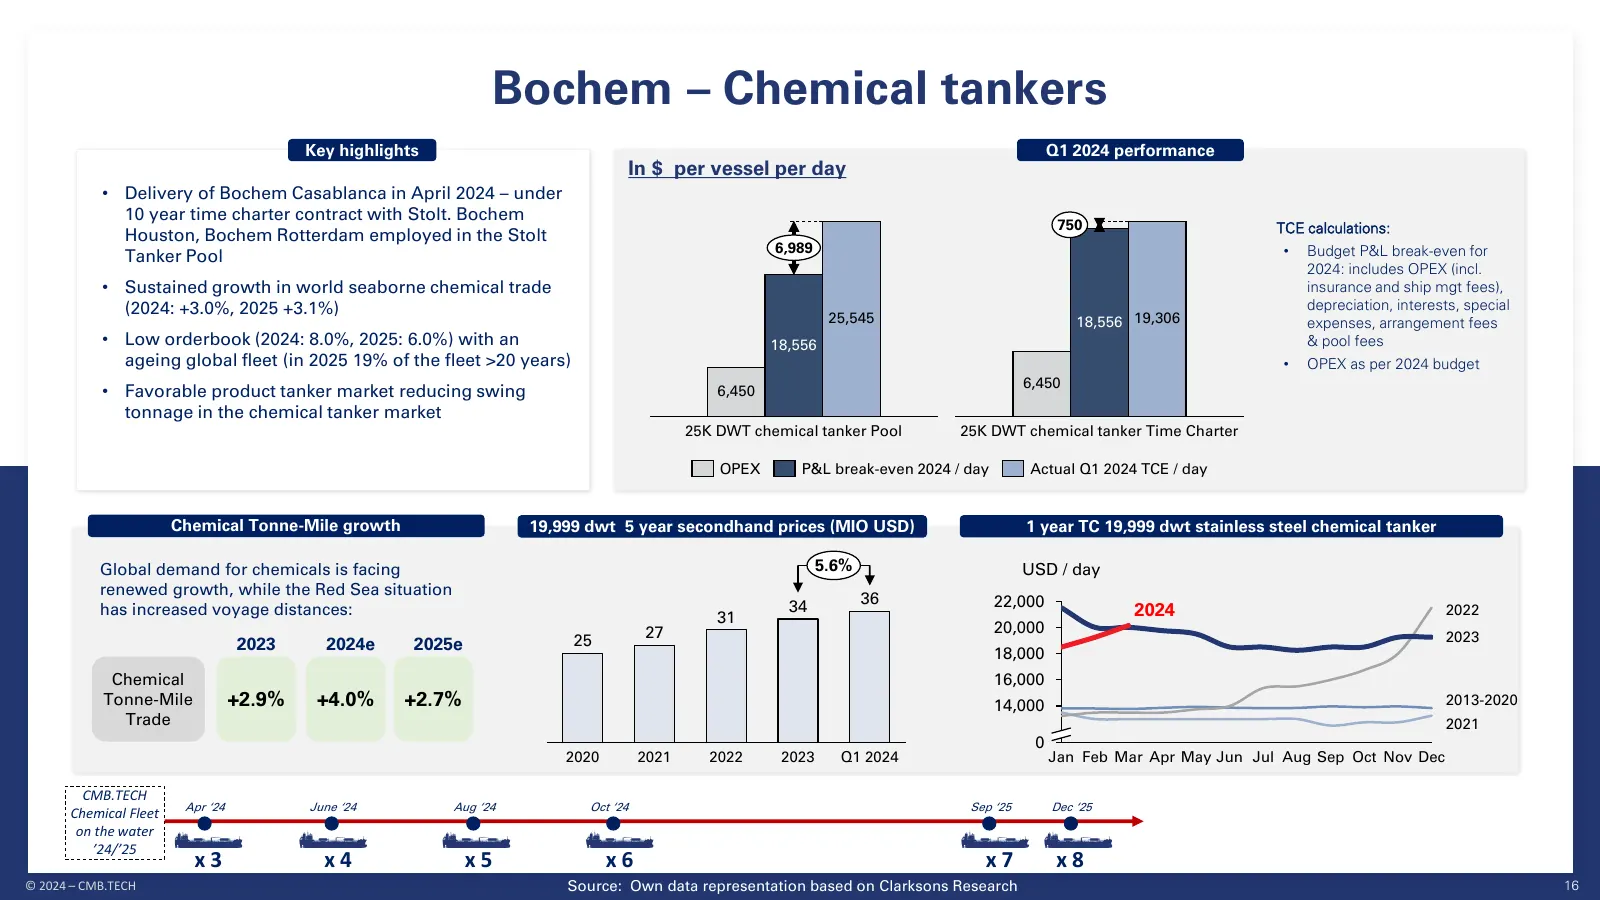
Slide 16: Bochem – Chemical tankers
Bochem – Chemical tankers Key highlights Q1 2024 performance In $ per vessel per day • Delivery of Bochem Casablanca in April 2024 – under 10 year time charter contract with Stolt. Bochem 750 TCE calculations: Houston, Bochem Rotterdam employed in the Stolt 6,989 • Budget P&L break-even for Tanker P
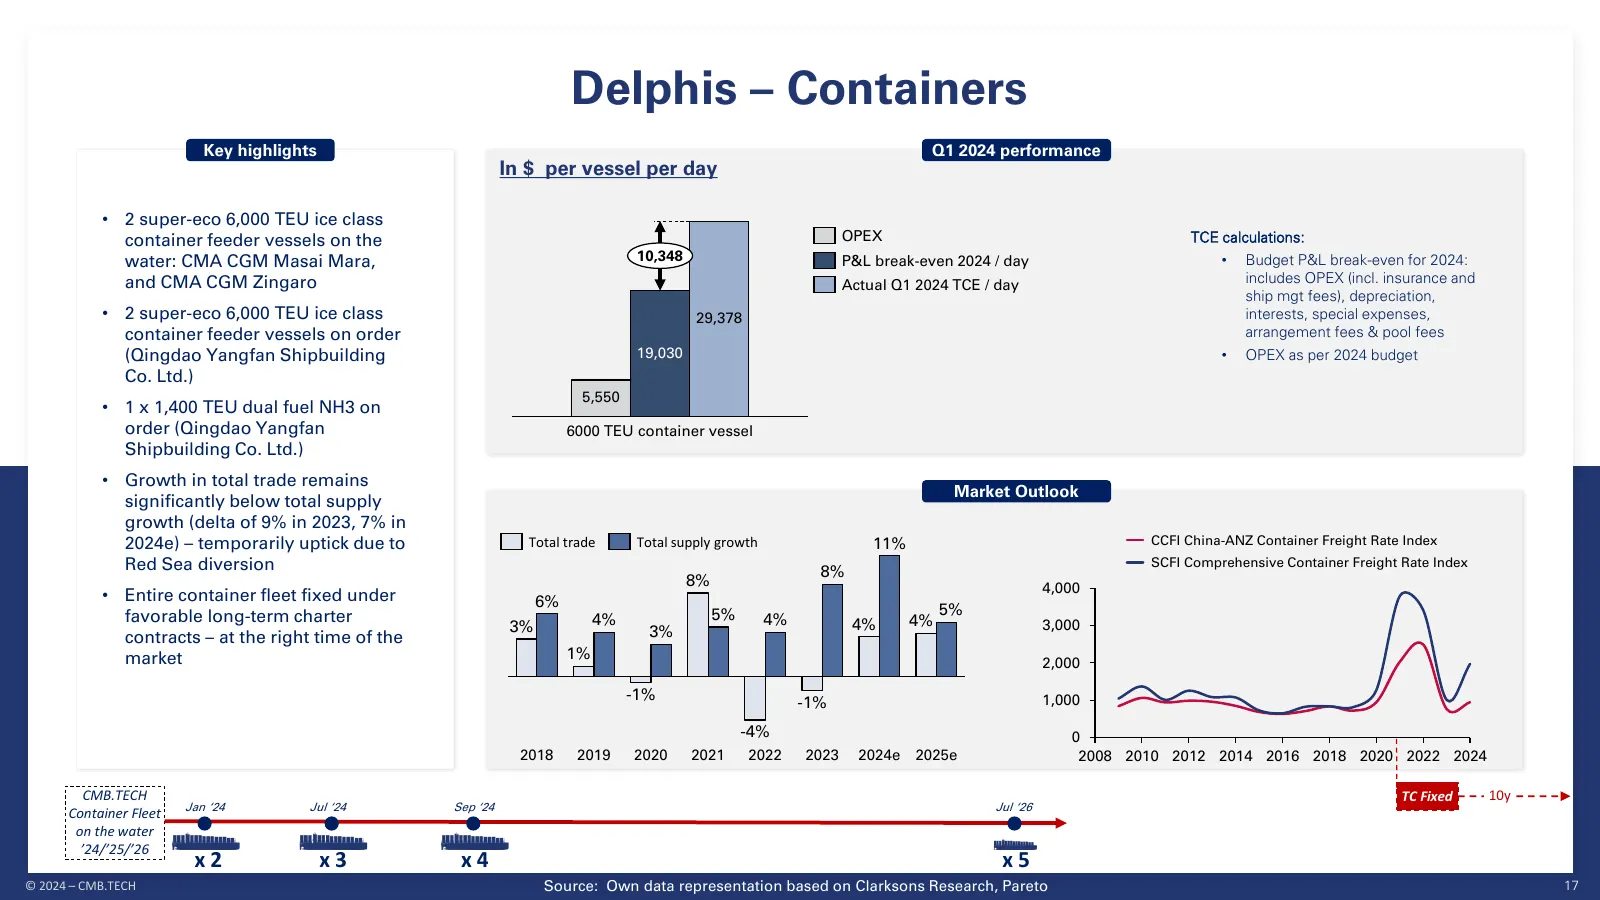
Slide 17: Delphis – Containers
Delphis – Containers Key highlights Q1 2024 performance In $ per vessel per day • 2 super-eco 6,000 TEU ice class container feeder vessels on the OPEX TCE calculations: water: CMA CGM Masai Mara, 10,348 P&L break-even 2024 / day • Budget P&L break-even for 2024: and CMA CGM Zingaro Actual Q1 2024 TC
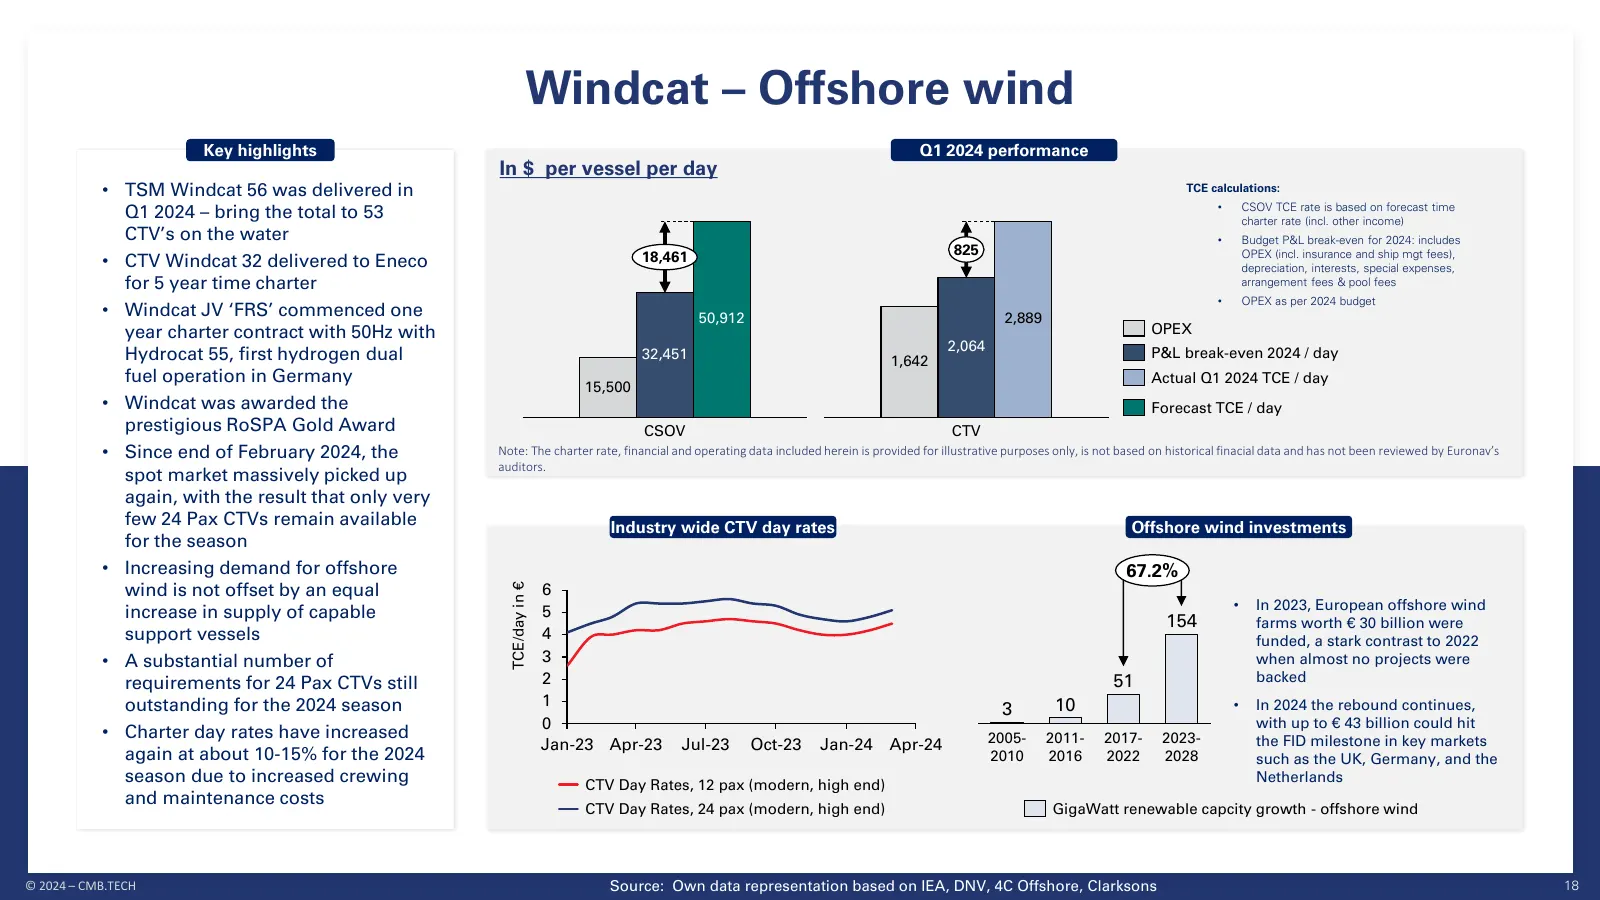
Slide 18: Windcat – Offshore wind
Windcat – Offshore wind Key highlights Q1 2024 performance In $ per vessel per day • TSM Windcat 56 was delivered in TCE calculations: • CSOV TCE rate is based on forecast time Q1 2024 – bring the total to 53 charter rate (incl. other income) CTV’s on the water • Budget P&L break-even for 2024: incl
Slide 19: 3. Conclusion
3. Conclusion © 2024 – CMB.TECH
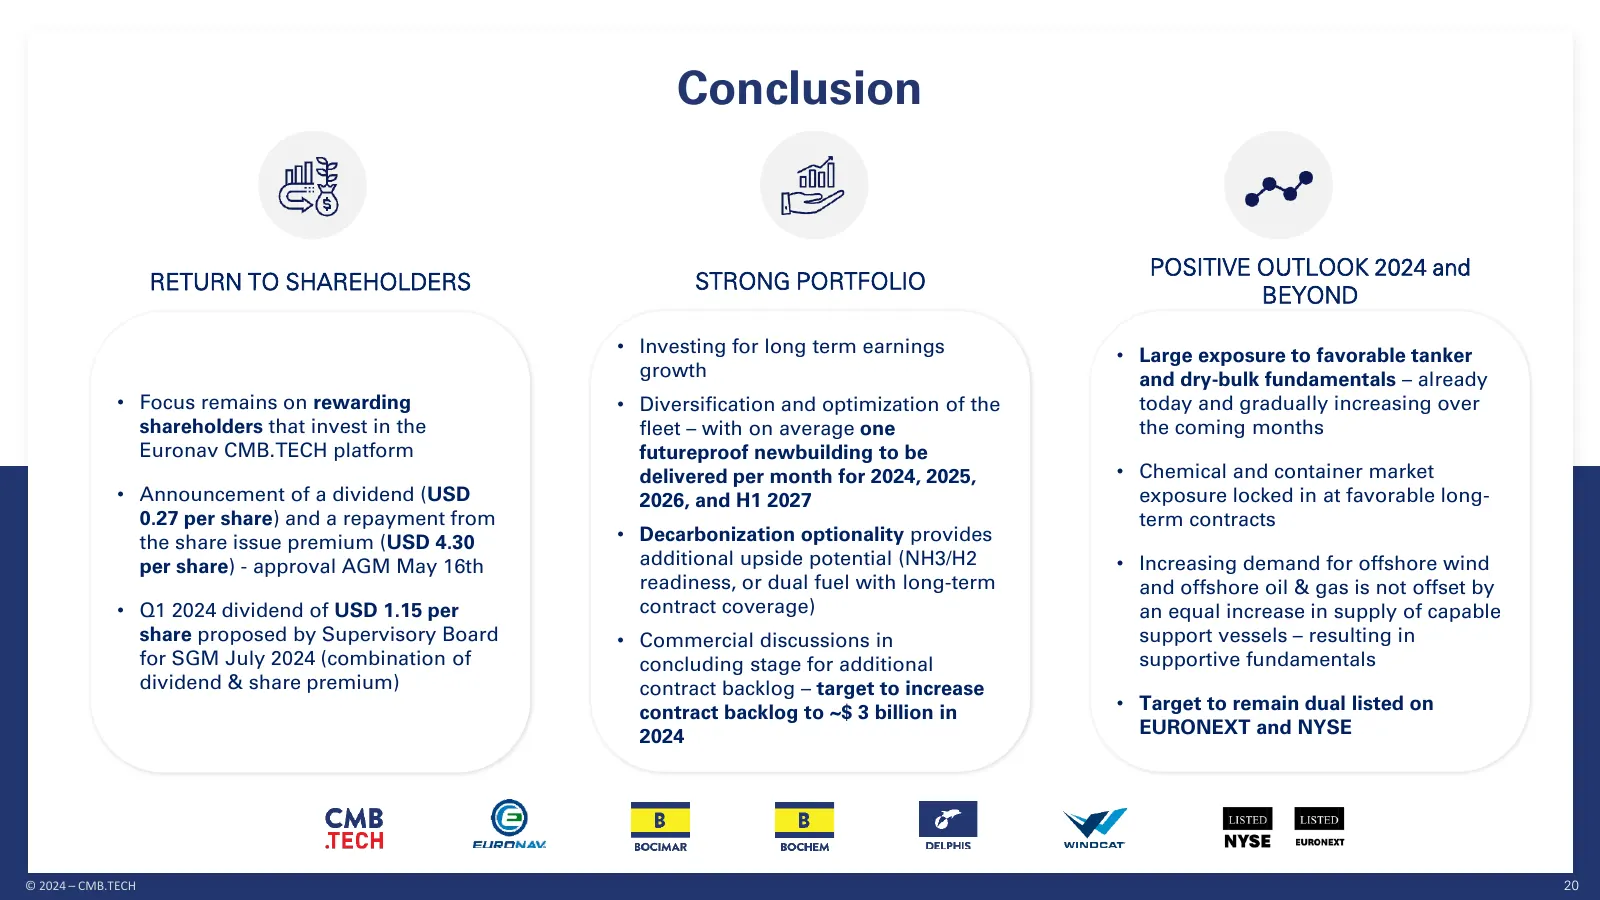
Slide 20: Conclusion
Conclusion POSITIVE OUTLOOK 2024 and RETURN TO SHAREHOLDERS STRONG PORTFOLIO BEYOND • Investing for long term earnings • Large exposure to favorable tanker growth and dry-bulk fundamentals – already • Focus remains on rewarding • Diversification and optimization of the today and gradually increasing
Slide 21: 4. Questions & Answers
4. Questions & Answers © 2024 – CMB.TECH
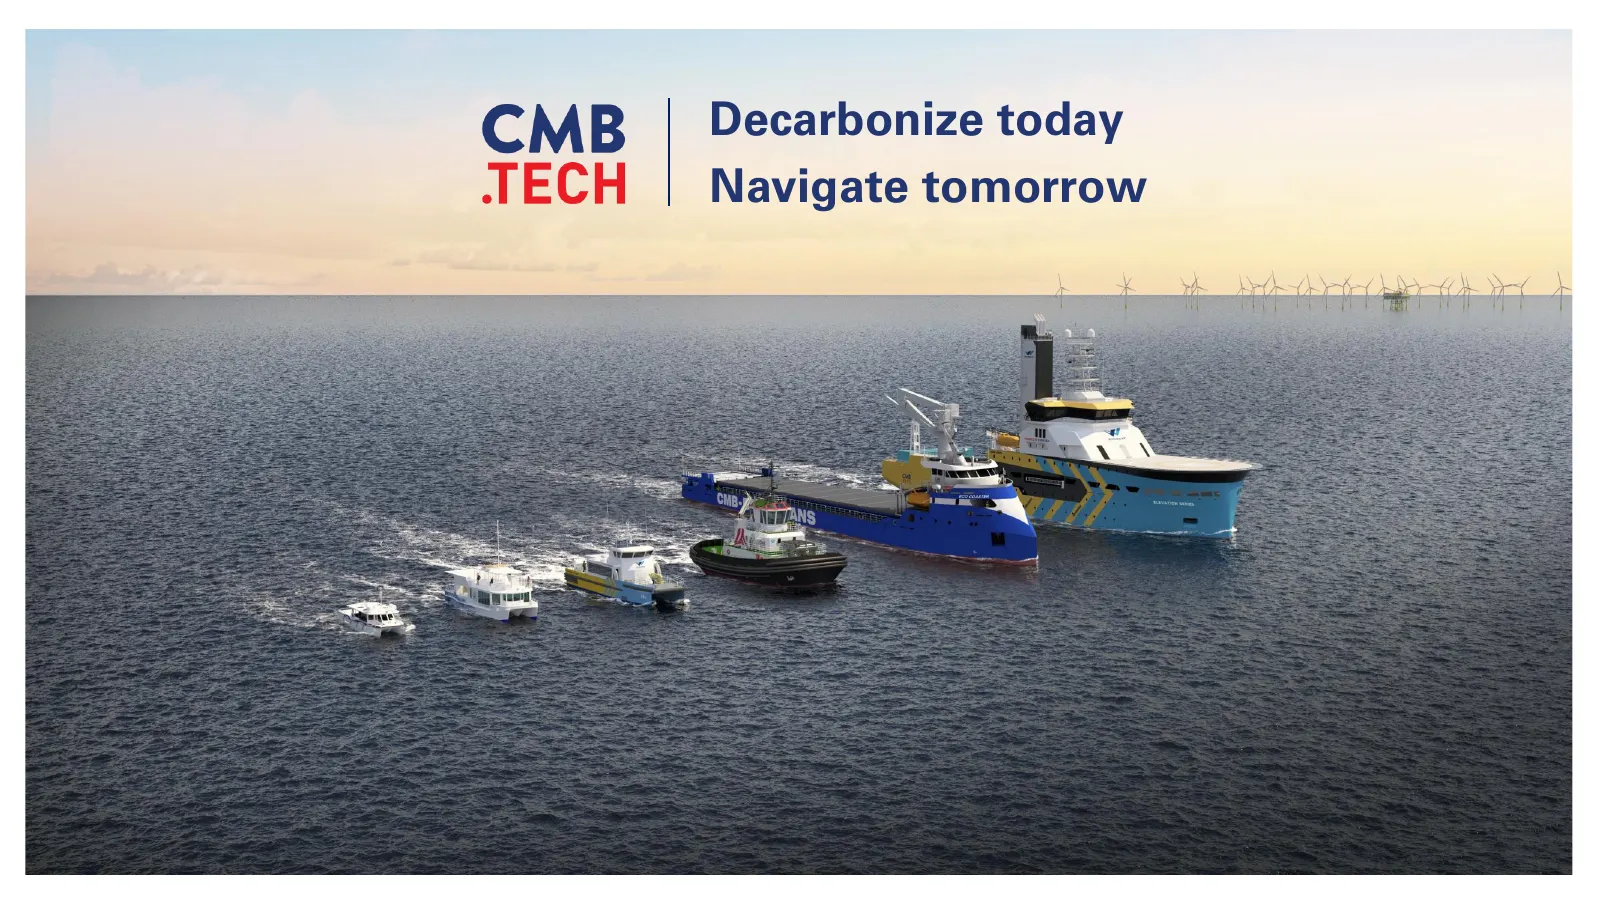
Slide 22: Decarbonize today Navigate tomorrow
Decarbonize today Navigate tomorrow
Source: 6ix earnings call
More decks from Cmb.tech NV
 Q2 2026 Earnings Presentation33 slides · Aug 27, 2026
 Q1 2026 Earnings Presentation32 slides · May 19, 2026
 Q4 2025 Earnings Presentation31 slides · Feb 26, 2026
 Q3 2025 Earnings Presentation31 slides · Nov 26, 2025
 Q2 2025 Earnings Presentation39 slides · Aug 28, 2025
 Merger or Acquisition (April 2025)12 slides · Apr 24, 2025