Elecon Engineering Co. Ltd. · NSE:ELECON
Elecon Engineering — Q2 FY2018 Earnings Presentation
25 slides from Elecon Engineering's earnings presentation, 2017
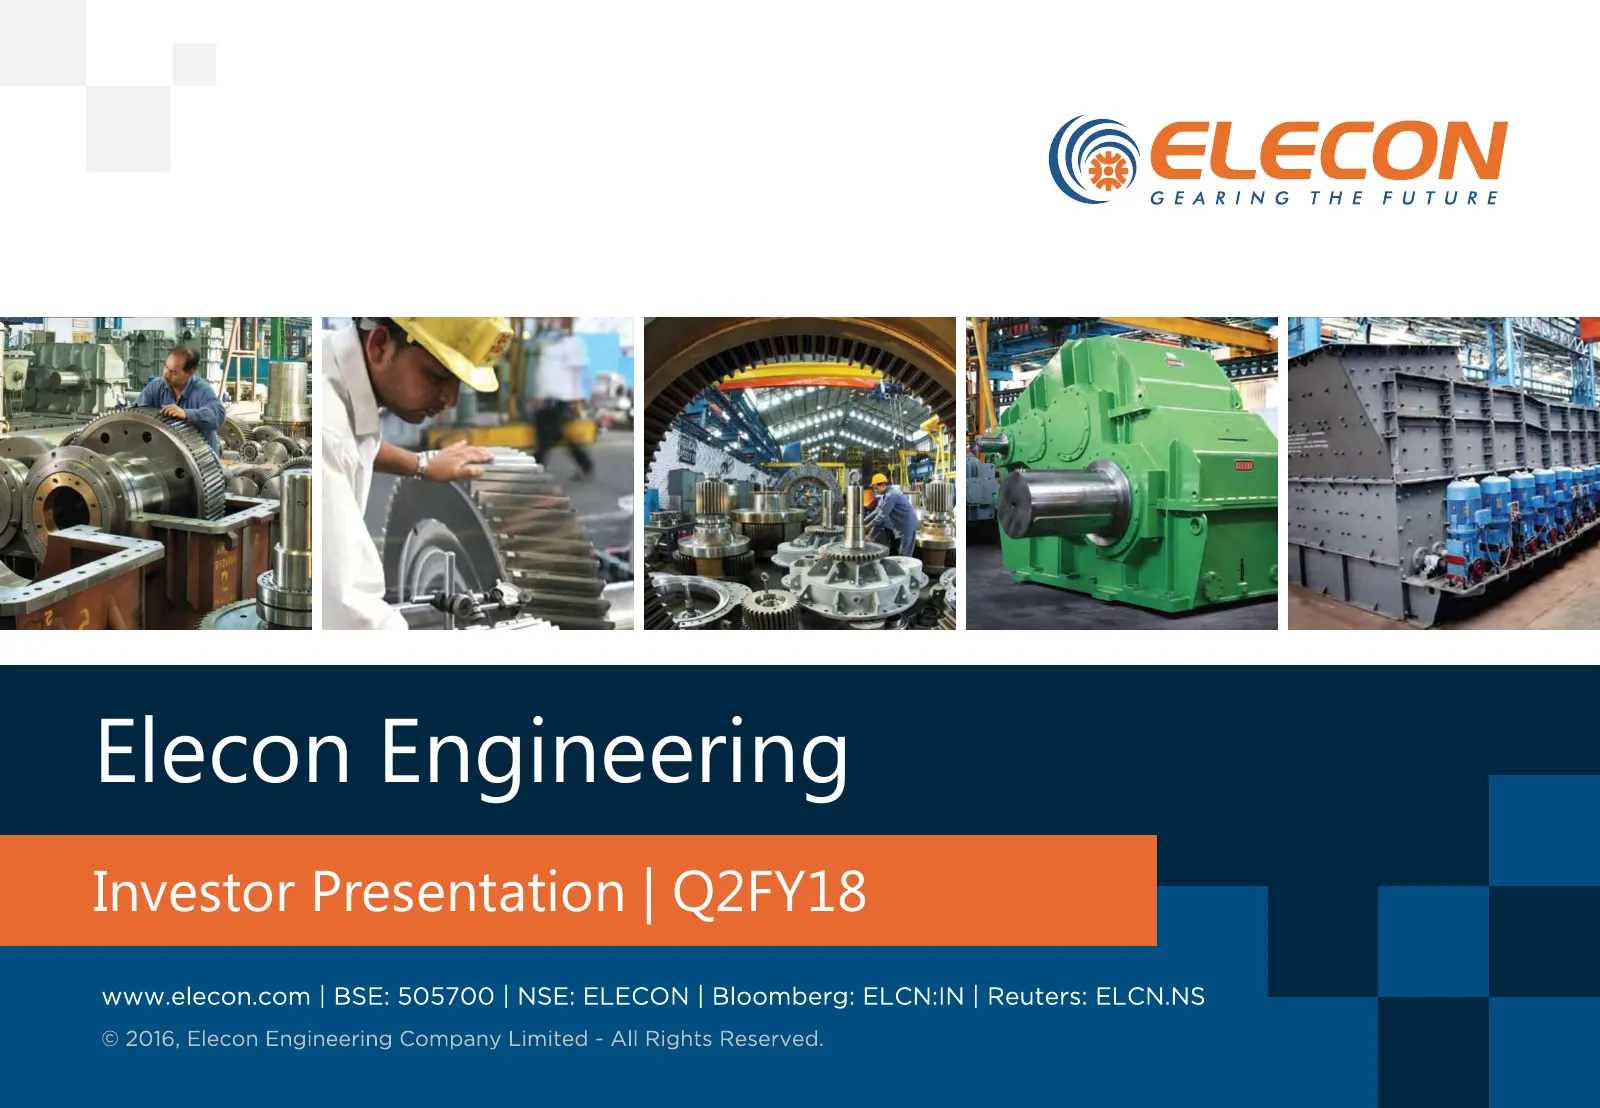
Slide 1: Elecon Engineering Investor Presentation Q2FY18
Elecon Engineering Investor Presentation | Q2FY18
Slide 2: Safe Harbor
Safe Harbor Except for the historical information contained herein, statements in this presentation and the subsequent discussions, which include words or phrases such as "will", "aim", "will likely result", "would", "believe", "may", "expect", "will continue", "anticipate", "estimate", "intend", "p
Slide 3: Financial Performance Q2FY18 and H1FY18
Financial Performance Q2FY18 and H1FY18
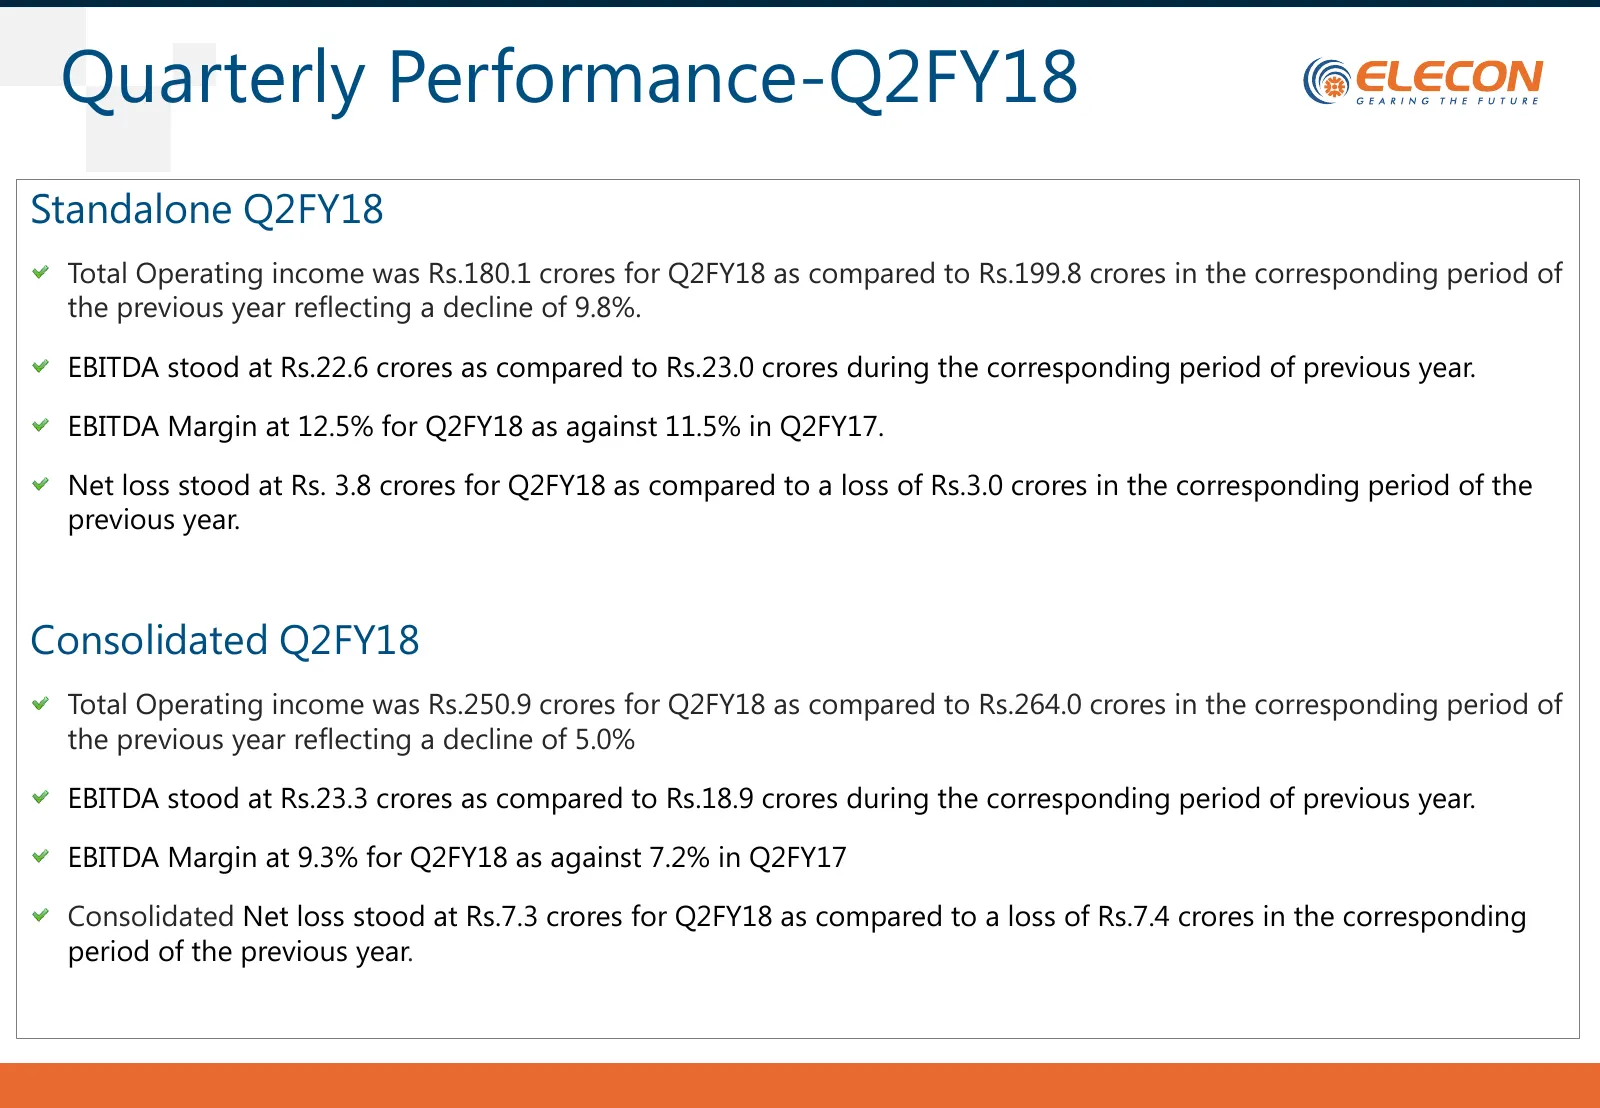
Slide 4: Quarterly Performance-Q2FY18
Quarterly Performance-Q2FY18 Standalone Q2FY18 Total Operating income was Rs.180.1 crores for Q2FY18 as compared to Rs.199.8 crores in the corresponding period of the previous year reflecting a decline of 9.8%. EBITDA stood at Rs.22.6 crores as compared to Rs.23.0 crores during the corresponding per
Slide 5: Quarterly Performance-H1FY18
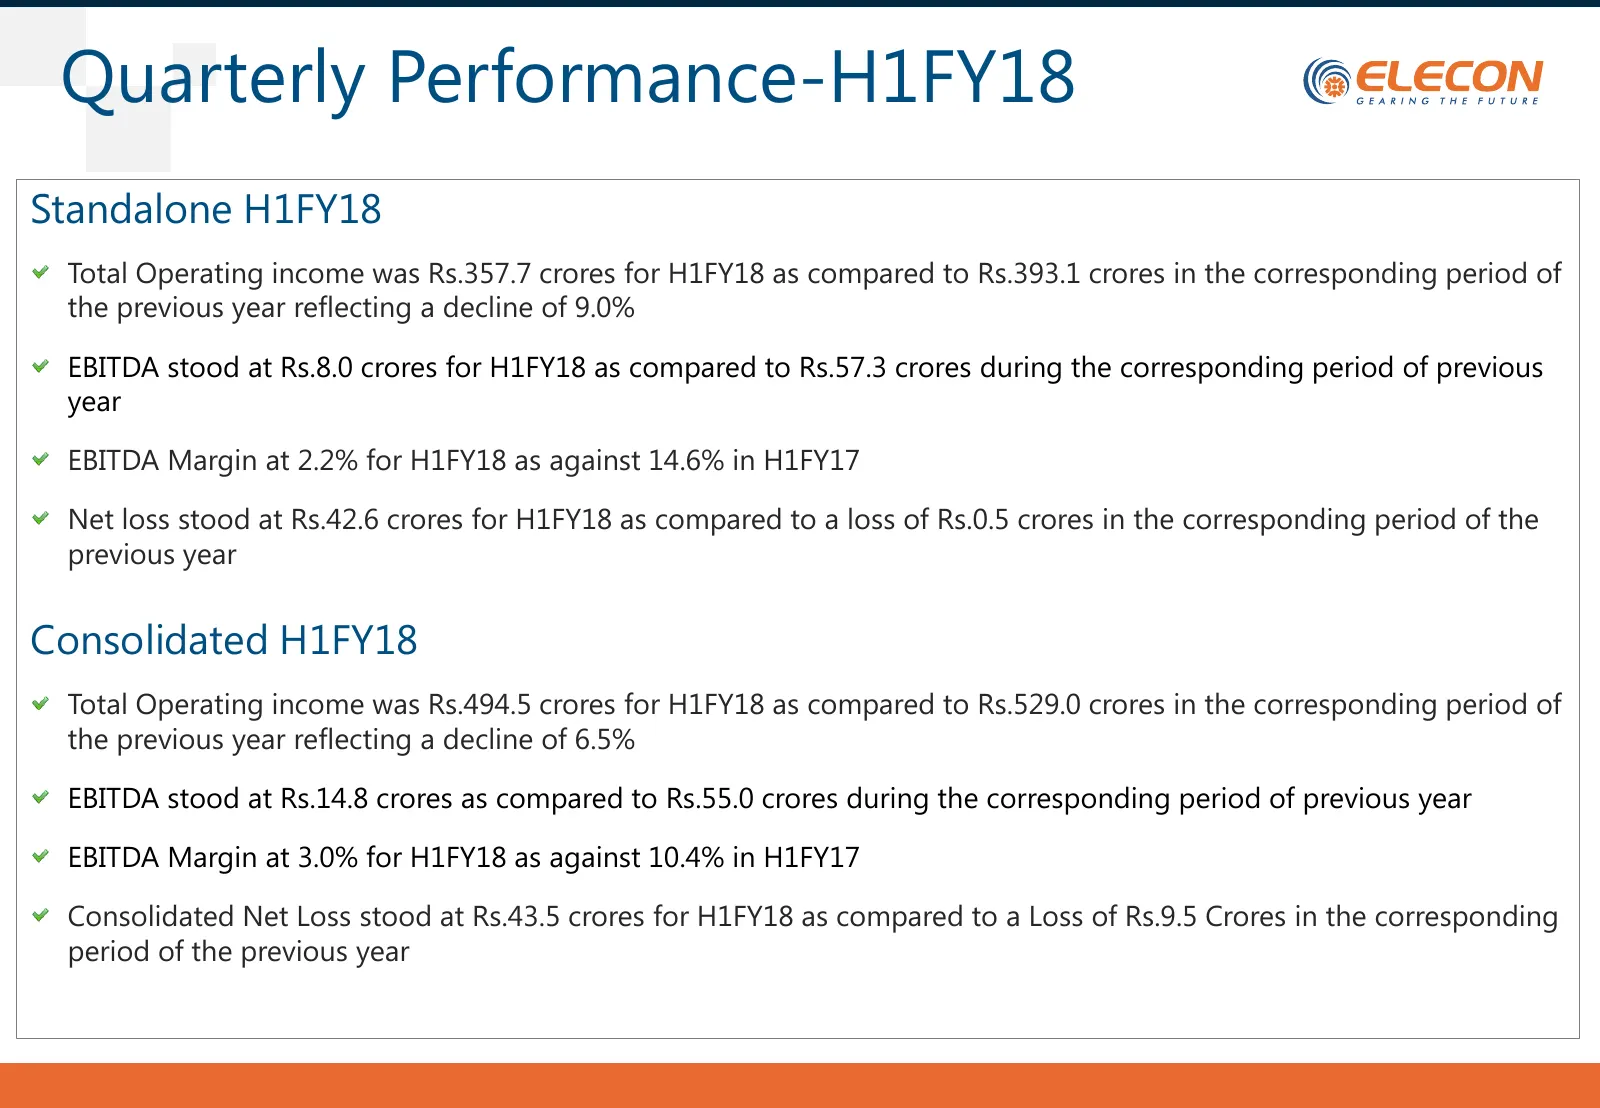
Quarterly Performance-H1FY18 Standalone H1FY18 Total Operating income was Rs.357.7 crores for H1FY18 as compared to Rs.393.1 crores in the corresponding period of the previous year reflecting a decline of 9.0% EBITDA stood at Rs.8.0 crores for H1FY18 as compared to Rs.57.3 crores during the correspo
Slide 6: Order Position
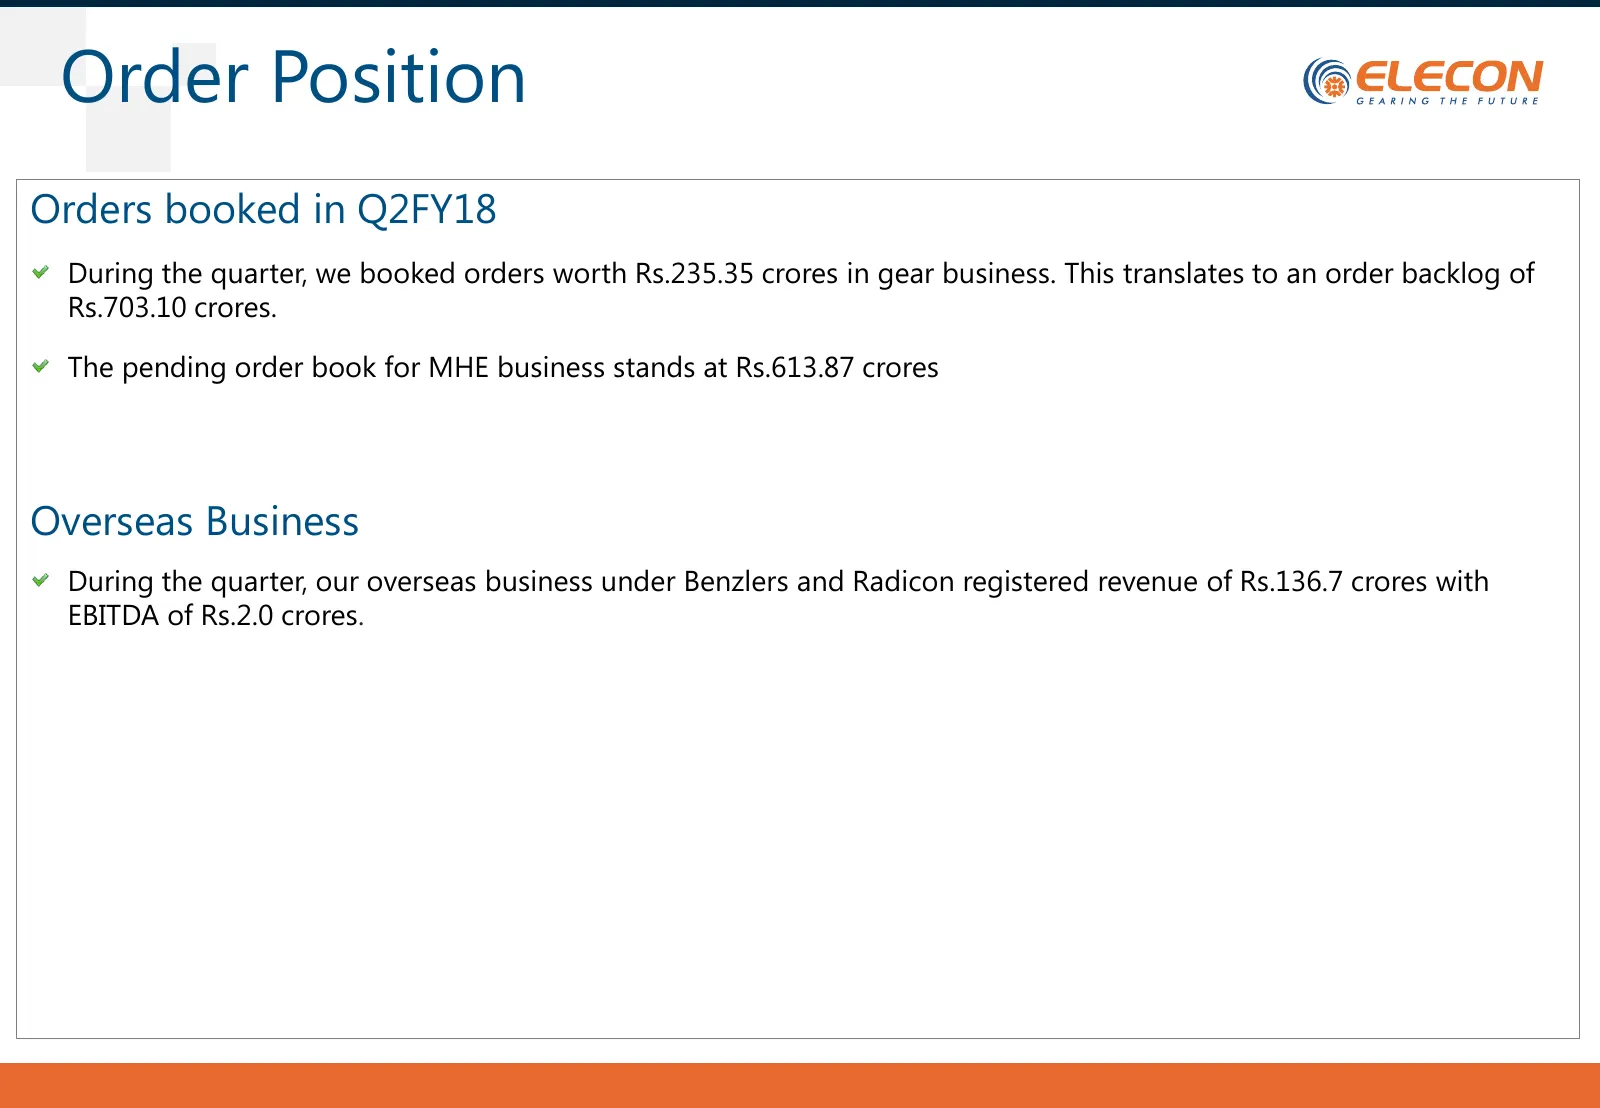
Order Position Orders booked in Q2FY18 During the quarter, we booked orders worth Rs.235.35 crores in gear business. This translates to an order backlog of Rs.703.10 crores. The pending order book for MHE business stands at Rs.613.87 crores Overseas Business During the quarter, our overseas business
Slide 7: Yearly Performance-FY17
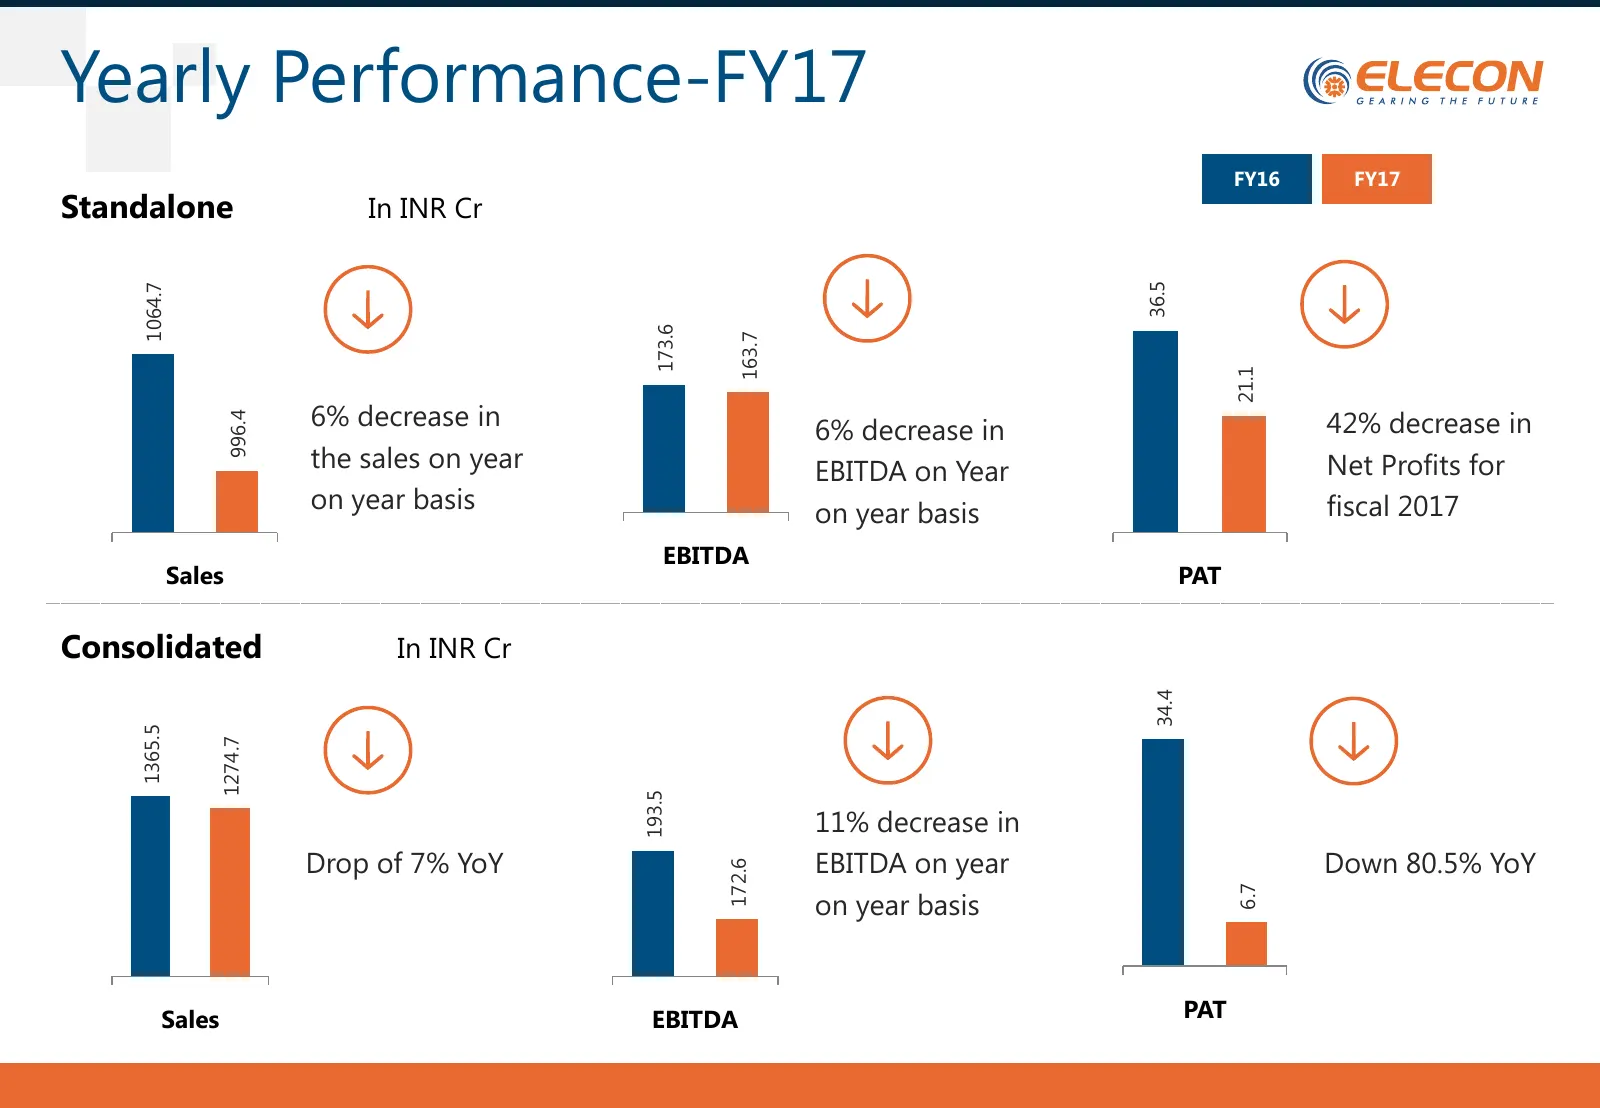
Yearly Performance-FY17 FY16 FY17 Standalone In INR Cr 36.5 1064.7 40 1080 173.6 35 163.7 1060 200 30 21.1 180 1040 160 25 6% decrease in 140 6% decrease in 20 42% decrease in 996.4 1020 120 100 1000 the sales on year 80 60 EBITDA on Year 15 Net Profits for 40 10 980 on year basis 20 0 on year basis
Slide 8: Balance Sheet Position
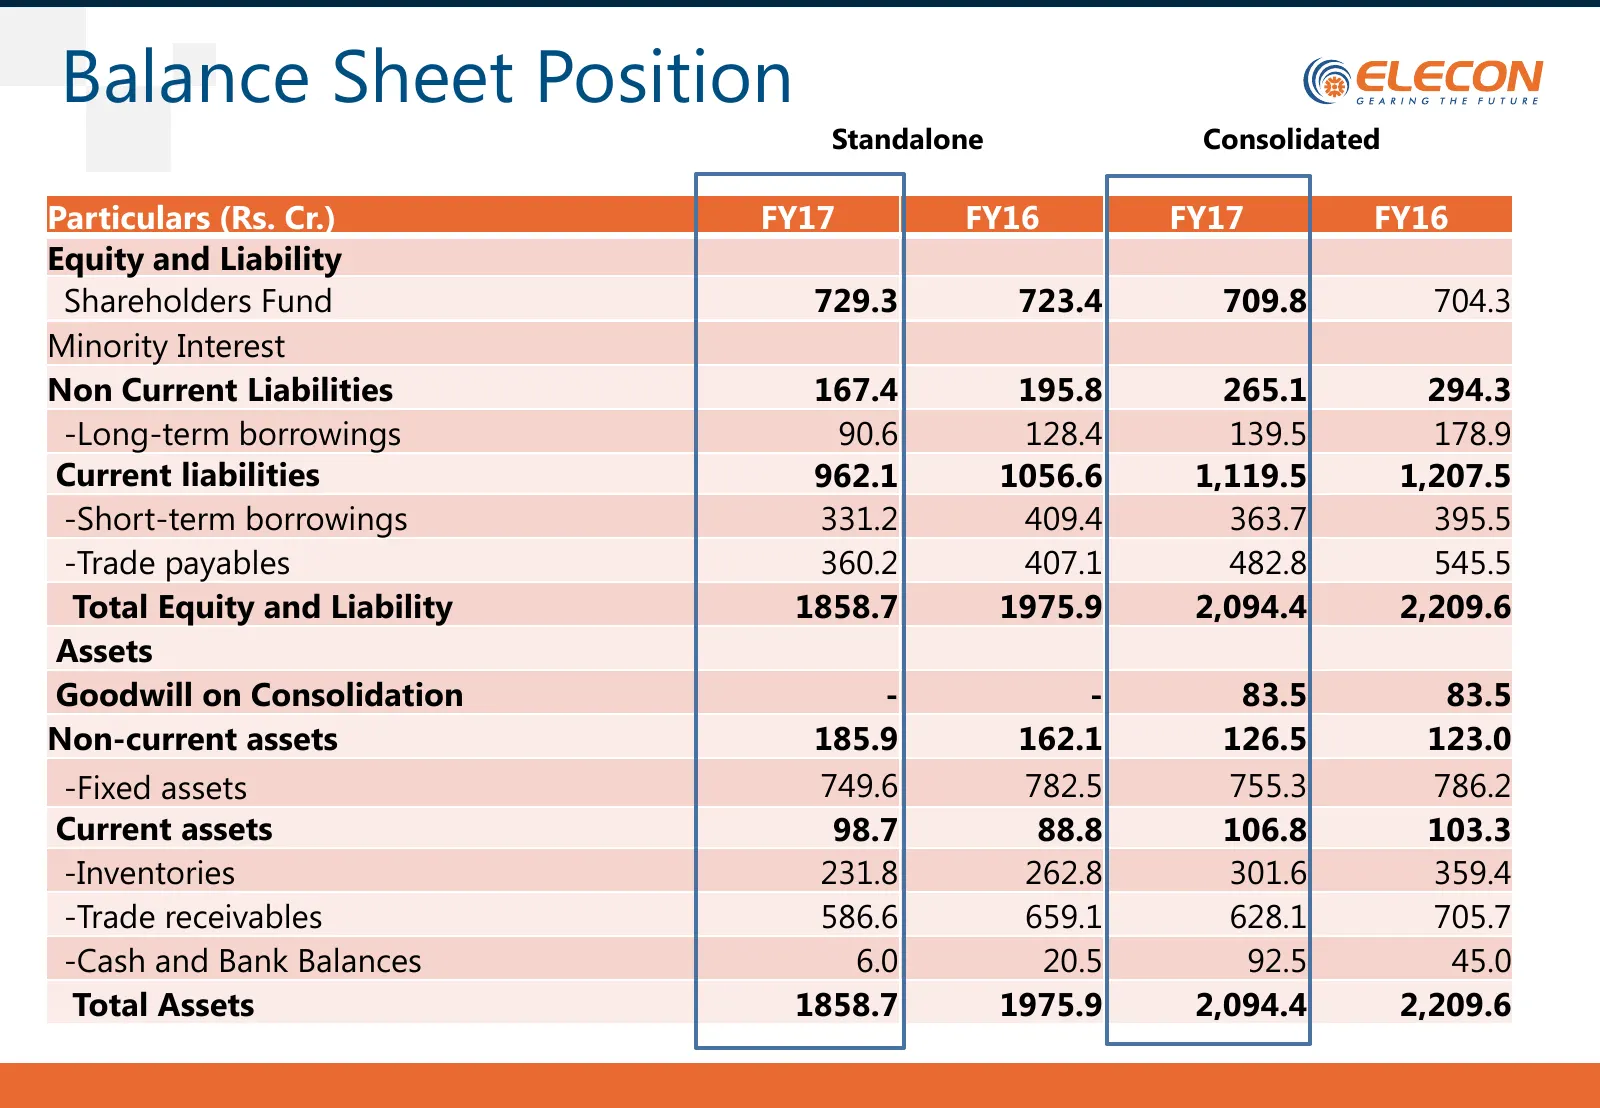
Balance Sheet Position Standalone Consolidated Particulars (Rs. Cr.) FY17 FY16 FY17 FY16 Equity and Liability Shareholders Fund 729.3 723.4 709.8 704.3 Minority Interest Non Current Liabilities 167.4 195.8 265.1 294.3 -Long-term borrowings 90.6 128.4 139.5 178.9 Current liabilities 962.1 1056.6 1,11
Slide 9: Operational Highlights 2017
Operational Highlights 2017
Slide 10: Highlights- Gear Business
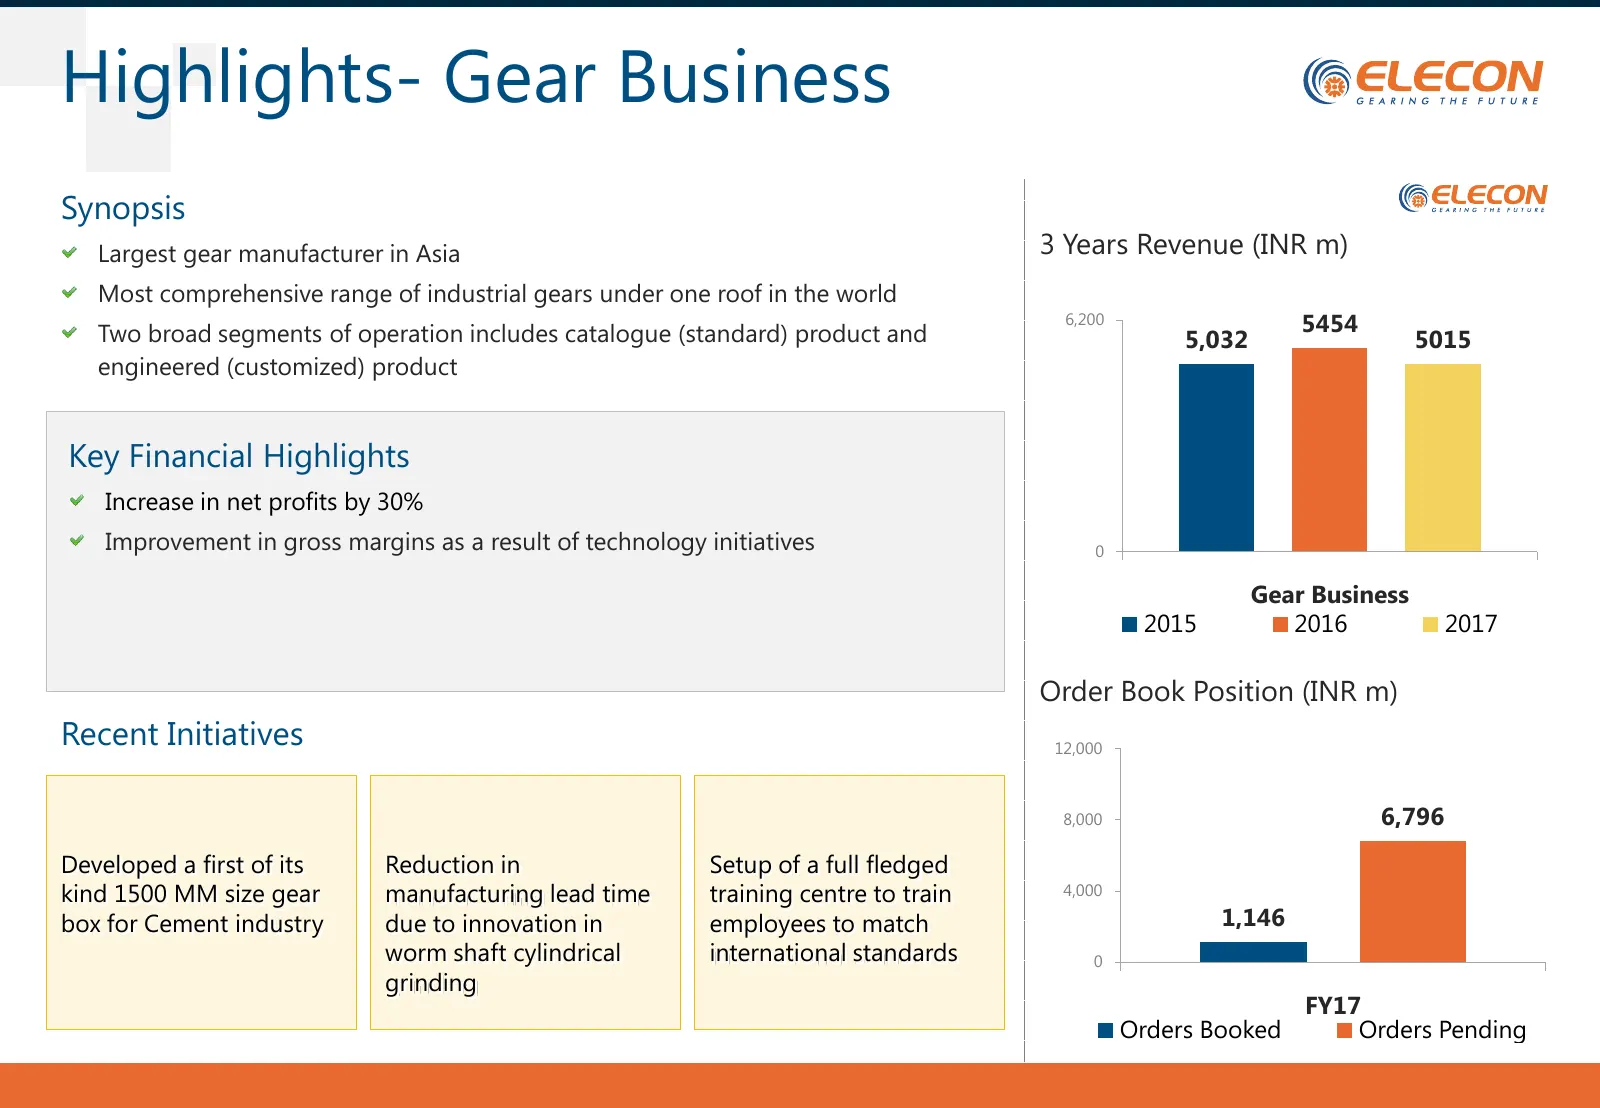
Highlights- Gear Business Synopsis Largest gear manufacturer in Asia 3 Years Revenue (INR m) Most comprehensive range of industrial gears under one roof in the world Two broad segments of operation includes catalogue (standard) product and 6,200 5454 5,032 5015 engineered (customized) product Key Fi
Slide 11: Sales Mix- Gears
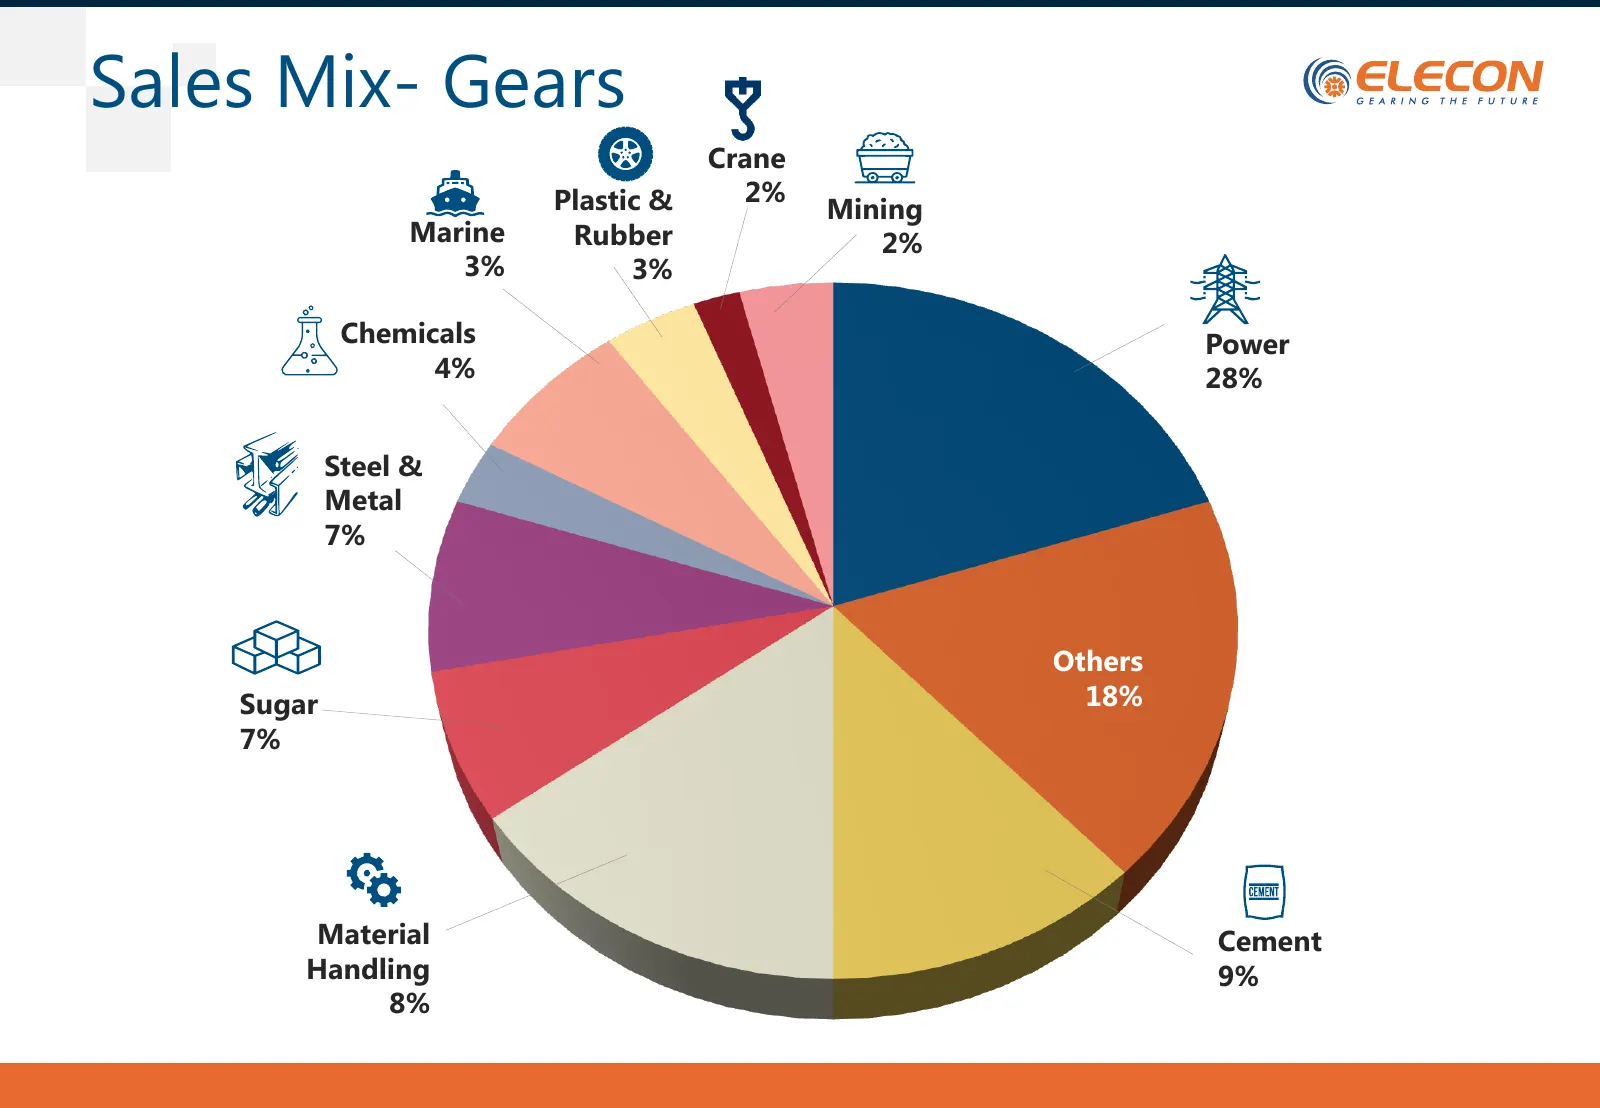
Sales Mix- Gears Crane Plastic & 2% Mining Marine Rubber 2% 3% 3% Chemicals Power 4% 28% Steel & Metal 7% Others Sugar 18% 7% Material Cement Handling 9% 8%
Slide 12: Target Industry Opportunity
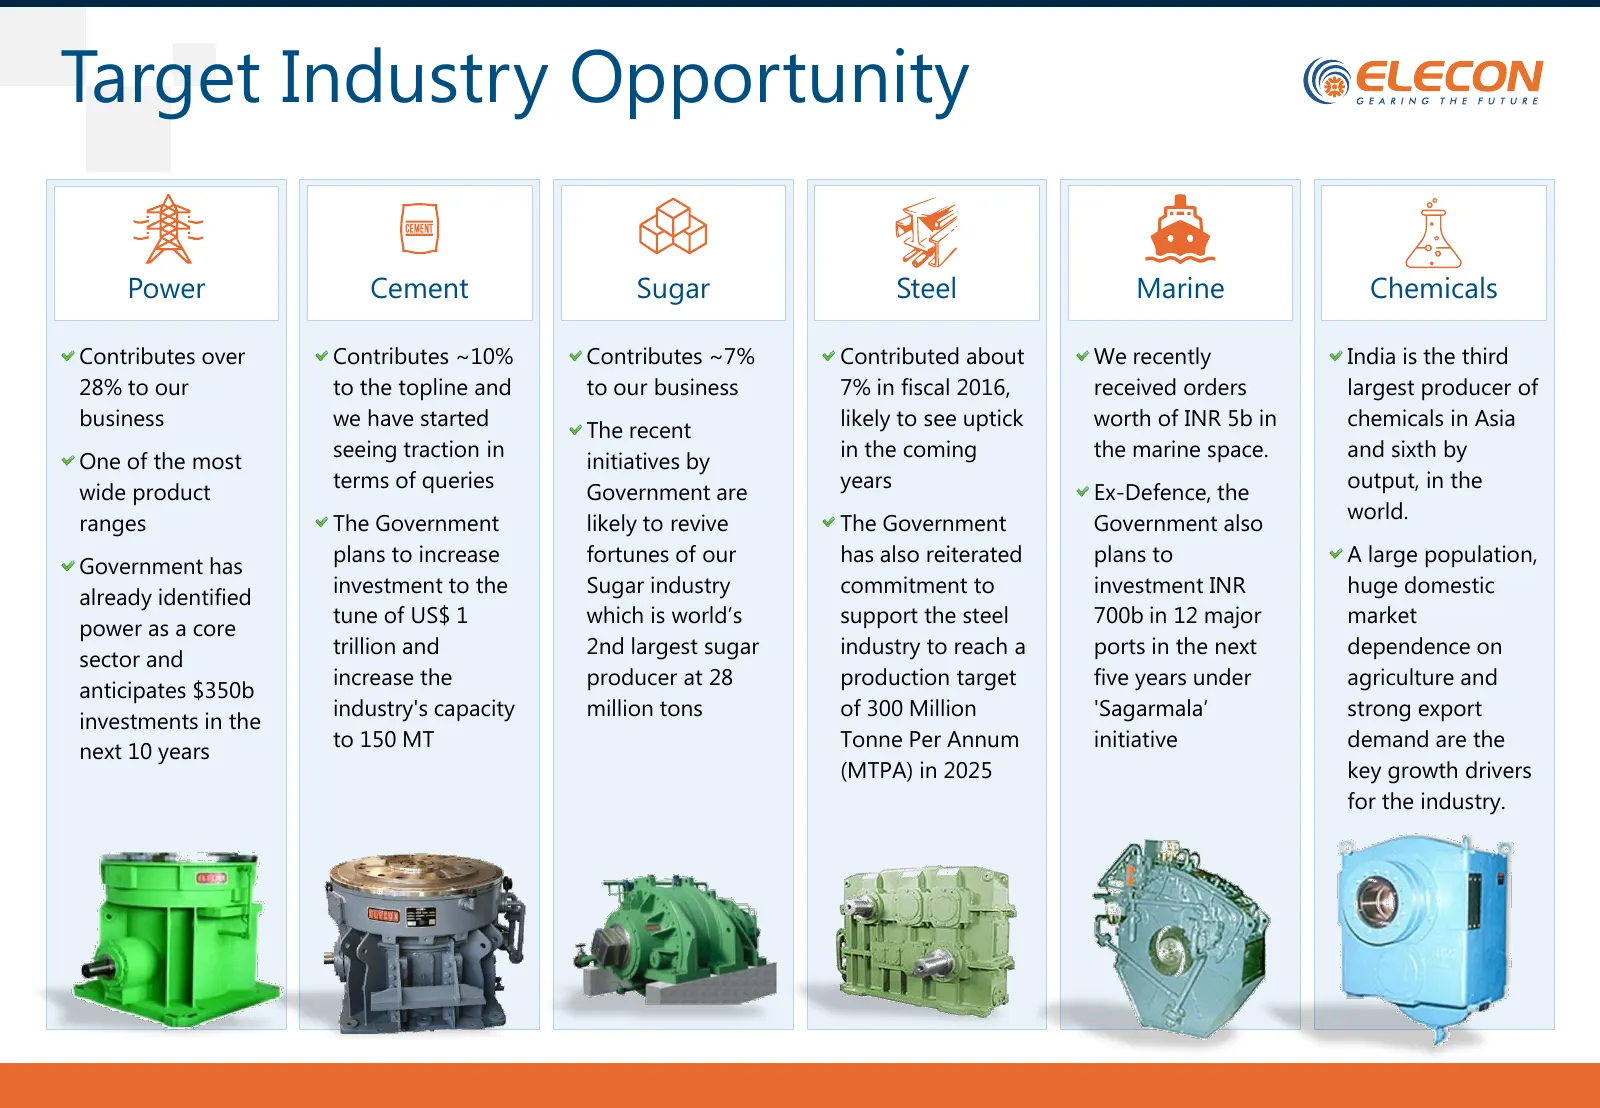
Target Industry Opportunity Power Cement Sugar Steel Marine Chemicals Contributes over Contributes ~10% Contributes ~7% Contributed about We recently India is the third 28% to our to the topline and to our business 7% in fiscal 2016, received orders largest producer of business we have started likel
Slide 13: Gears Business- International
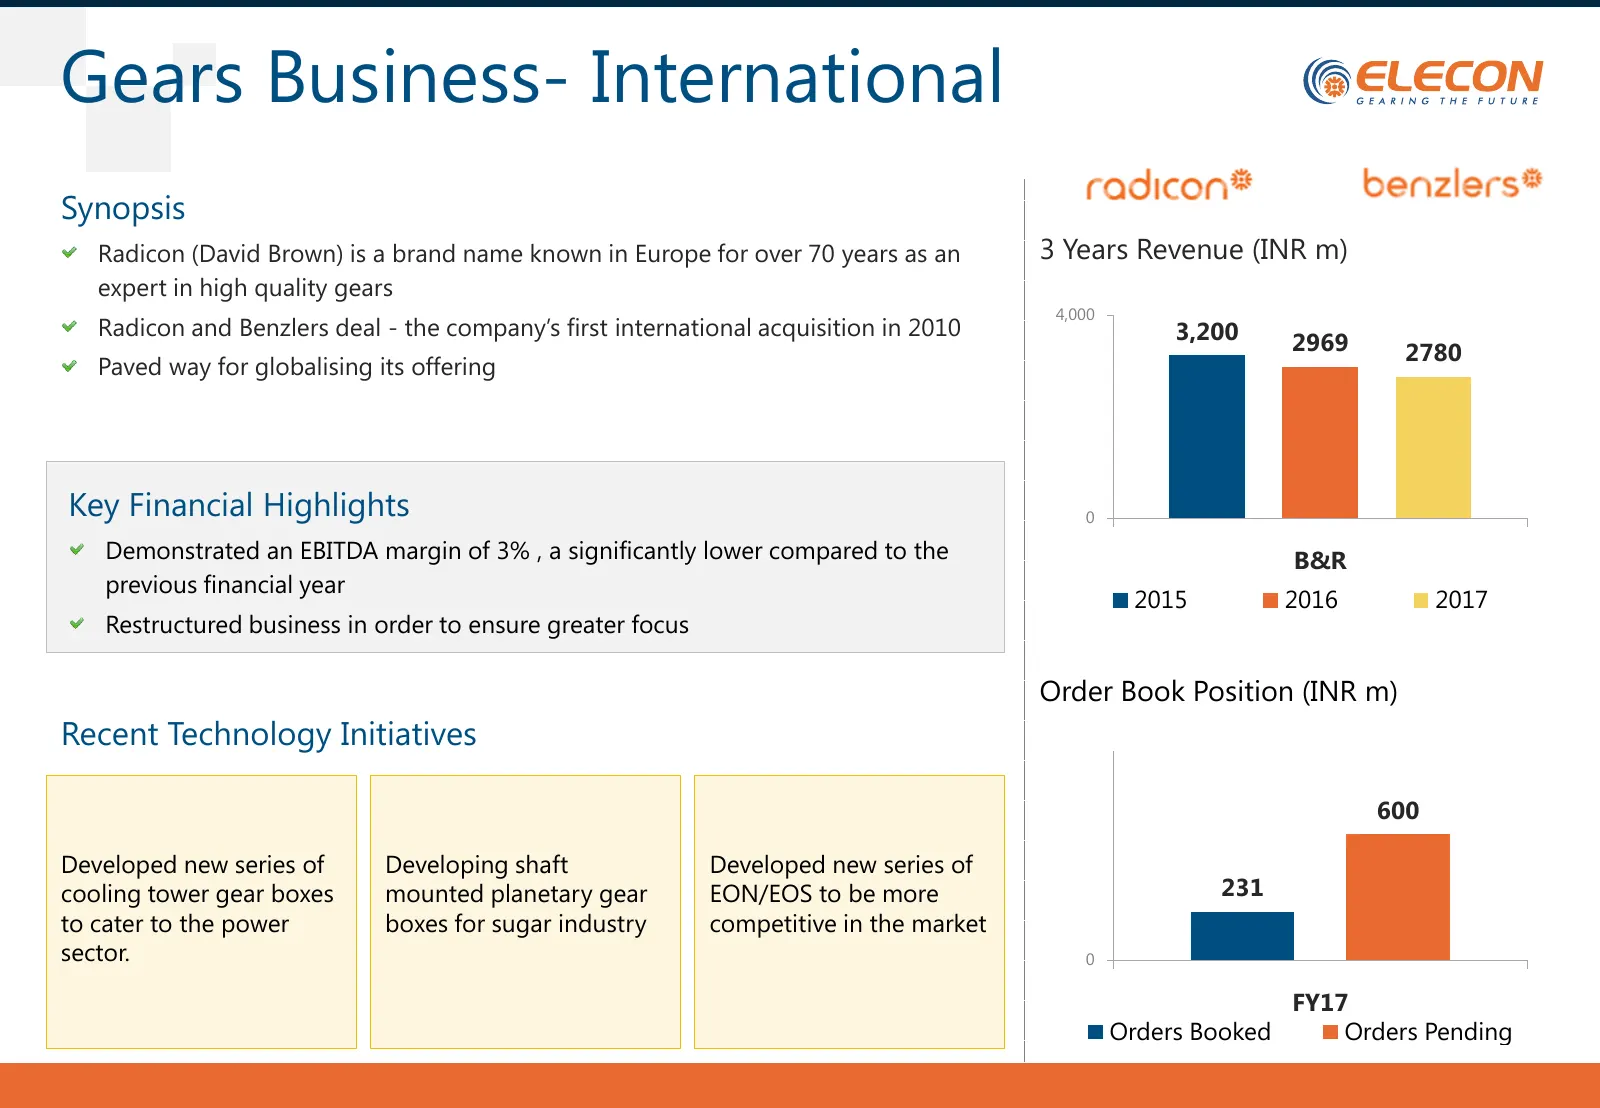
Gears Business- International Synopsis Radicon (David Brown) is a brand name known in Europe for over 70 years as an 3 Years Revenue (INR m) expert in high quality gears 4,000 Radicon and Benzlers deal - the company’s first international acquisition in 2010 3,200 2969 2780 Paved way for globalising
Slide 14: Material Handling(MHE) business
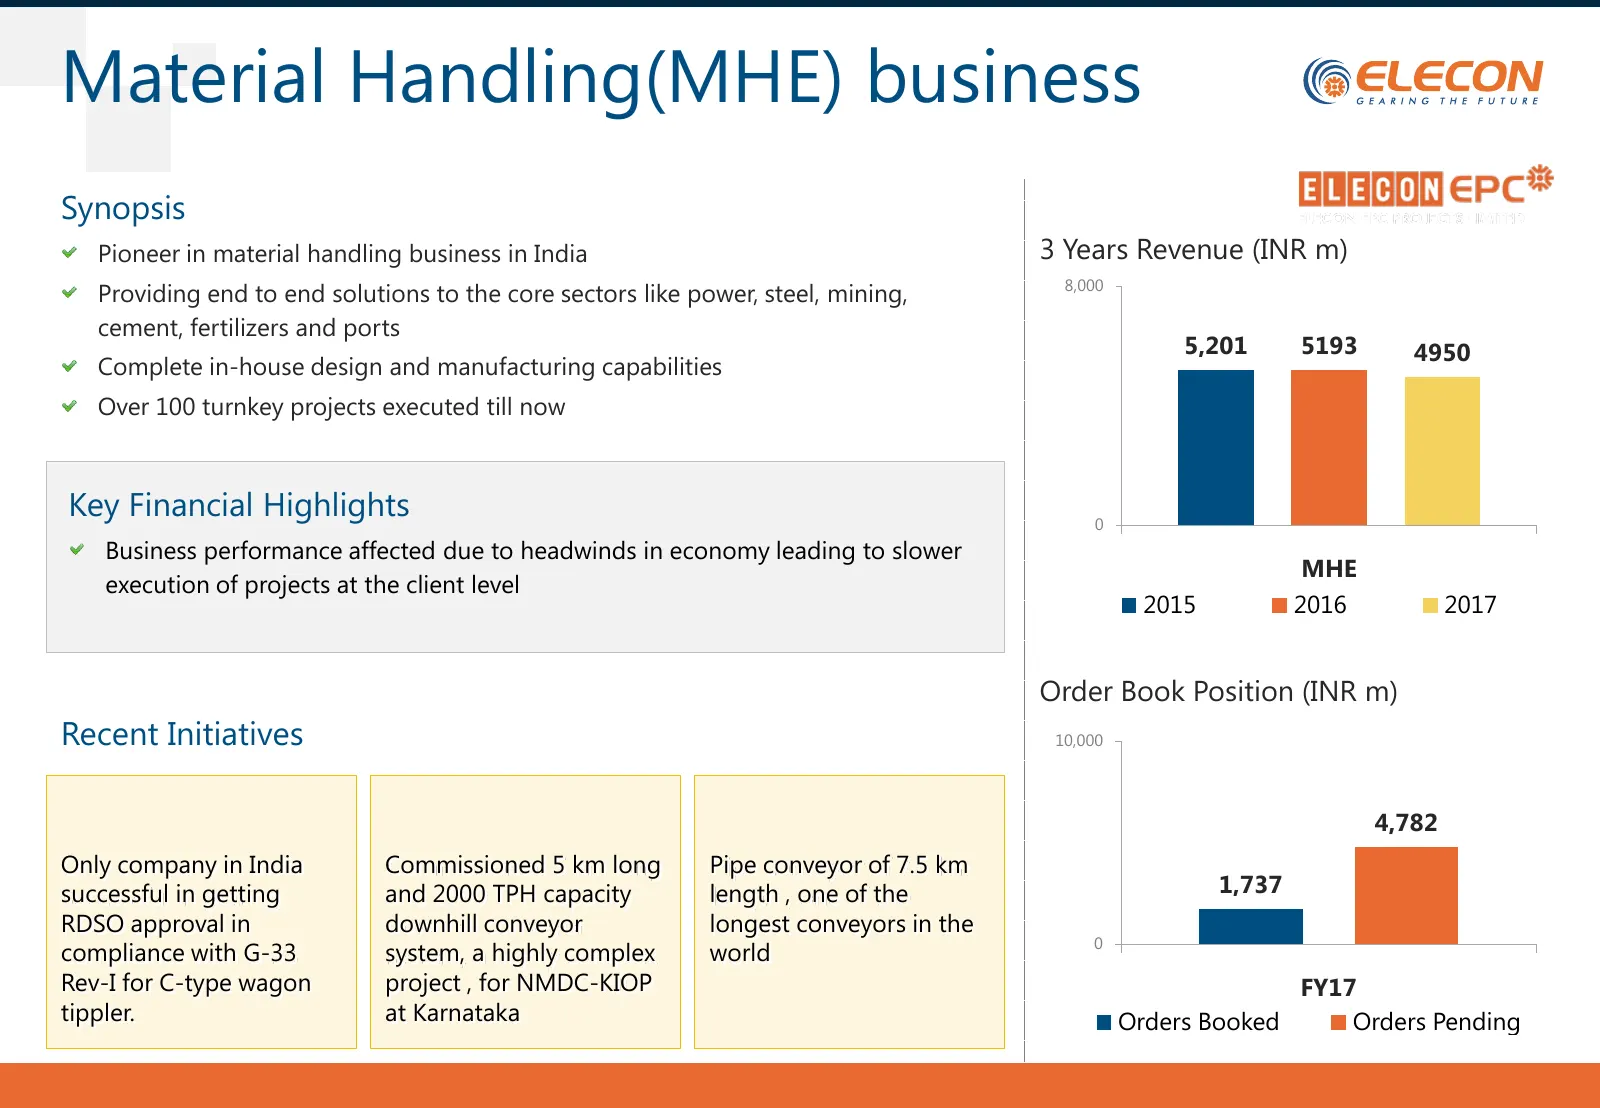
Material Handling(MHE) business Synopsis Pioneer in material handling business in India 3 Years Revenue (INR m) 8,000 Providing end to end solutions to the core sectors like power, steel, mining, cement, fertilizers and ports 5,201 5193 4950 Complete in-house design and manufacturing capabilities Ov
Slide 15: Industry Opportunity for MHE
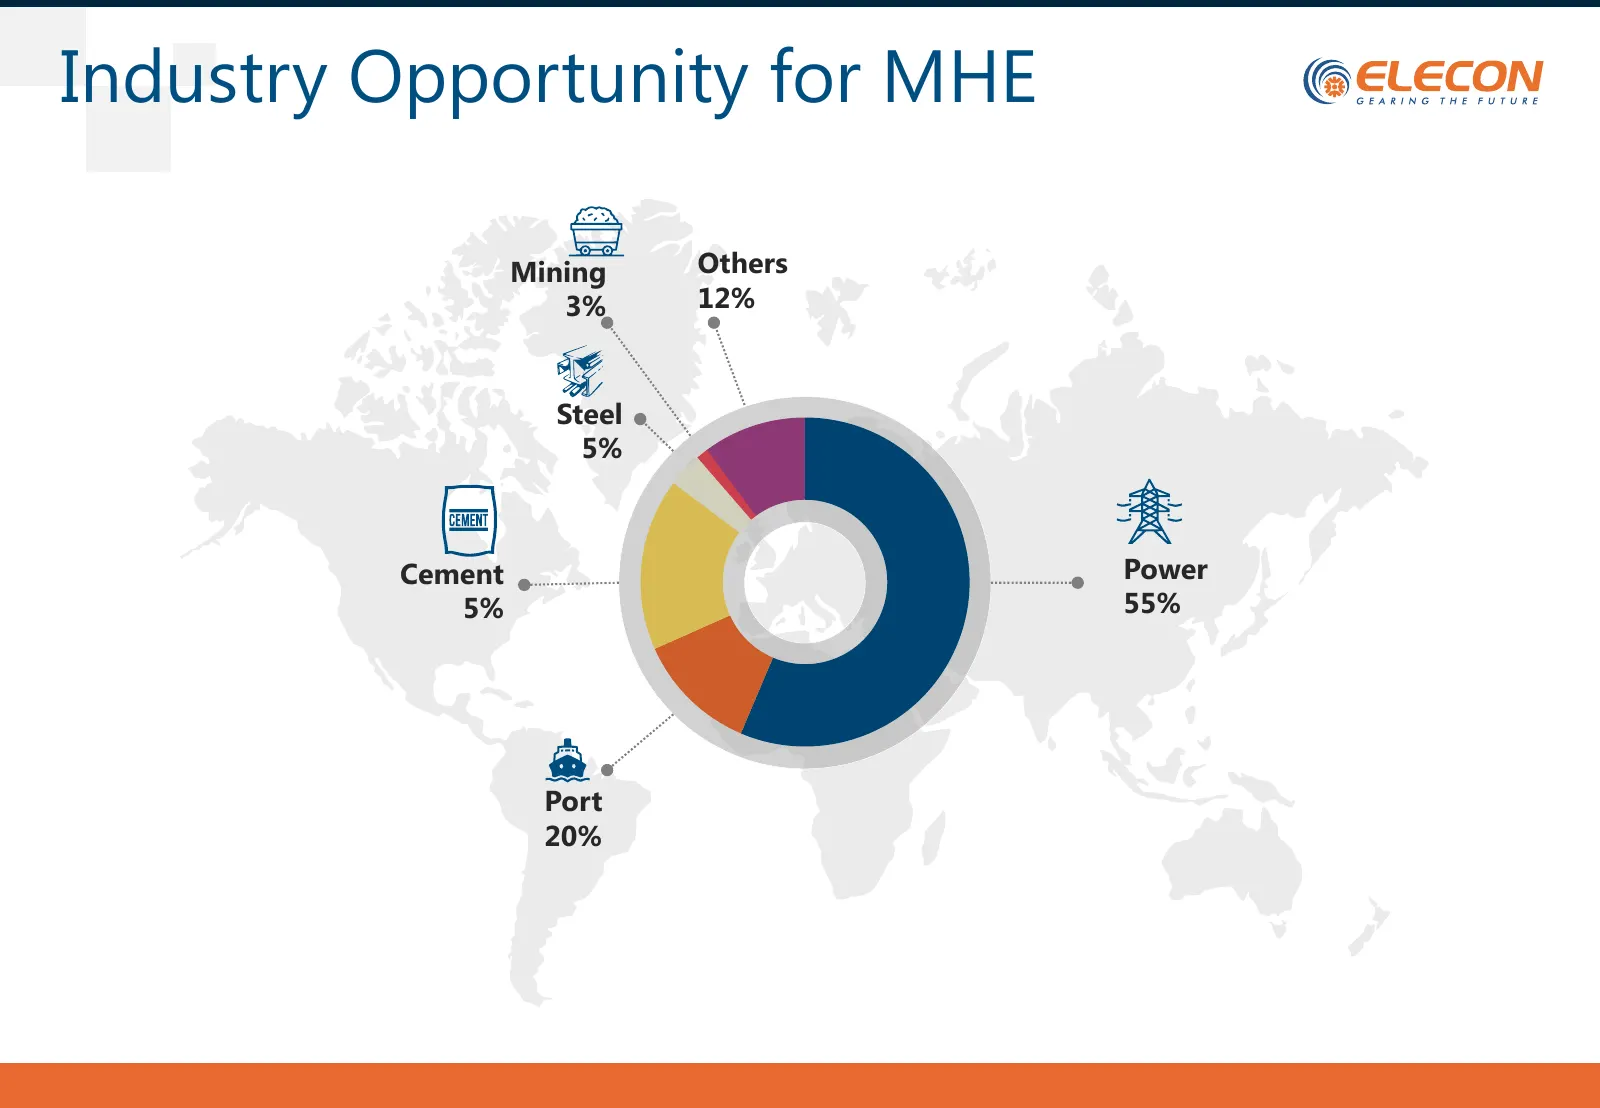
Industry Opportunity for MHE Mining Others 3% 12% Steel 5% Cement Power 5% 55% Port 20%
Slide 16: Business Reorganization
GEARING THE FUTURE Business Reorganization
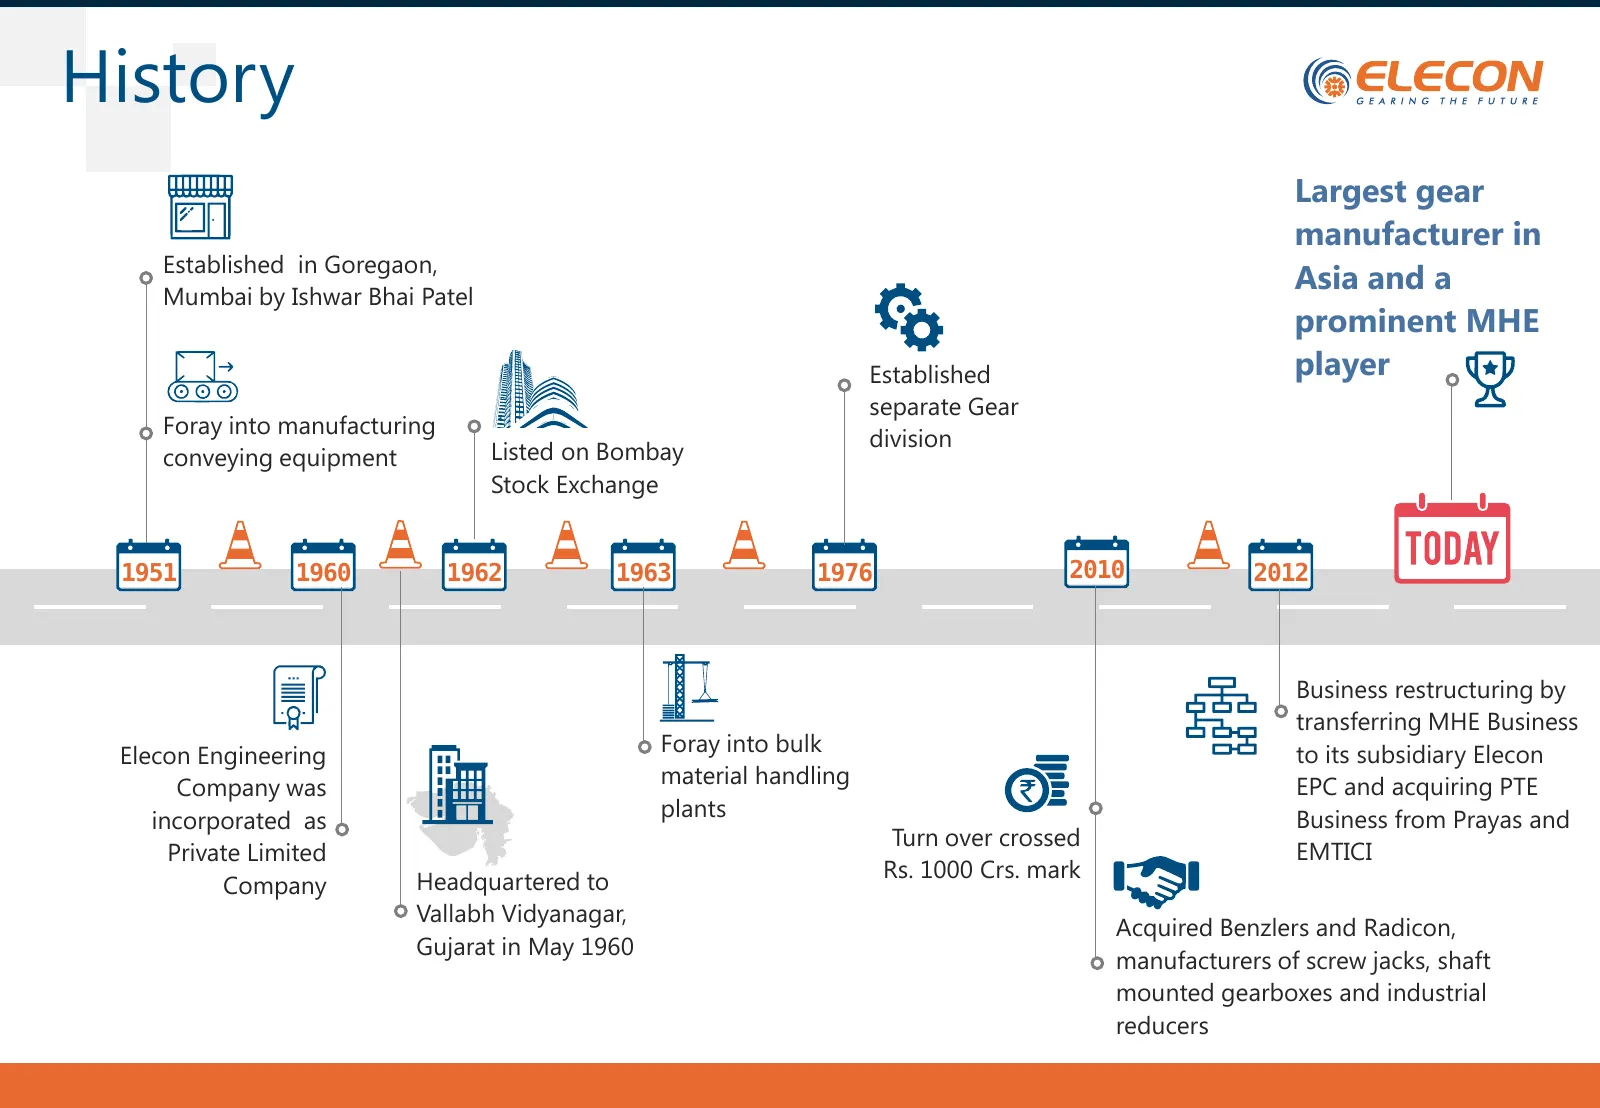
Slide 17: History
History Largest gear manufacturer in Established in Goregaon, Asia and a Mumbai by Ishwar Bhai Patel prominent MHE Established player separate Gear Foray into manufacturing division conveying equipment Listed on Bombay Stock Exchange 1951 1960 1962 1963 1976 2010 2012 Business restructuring by trans
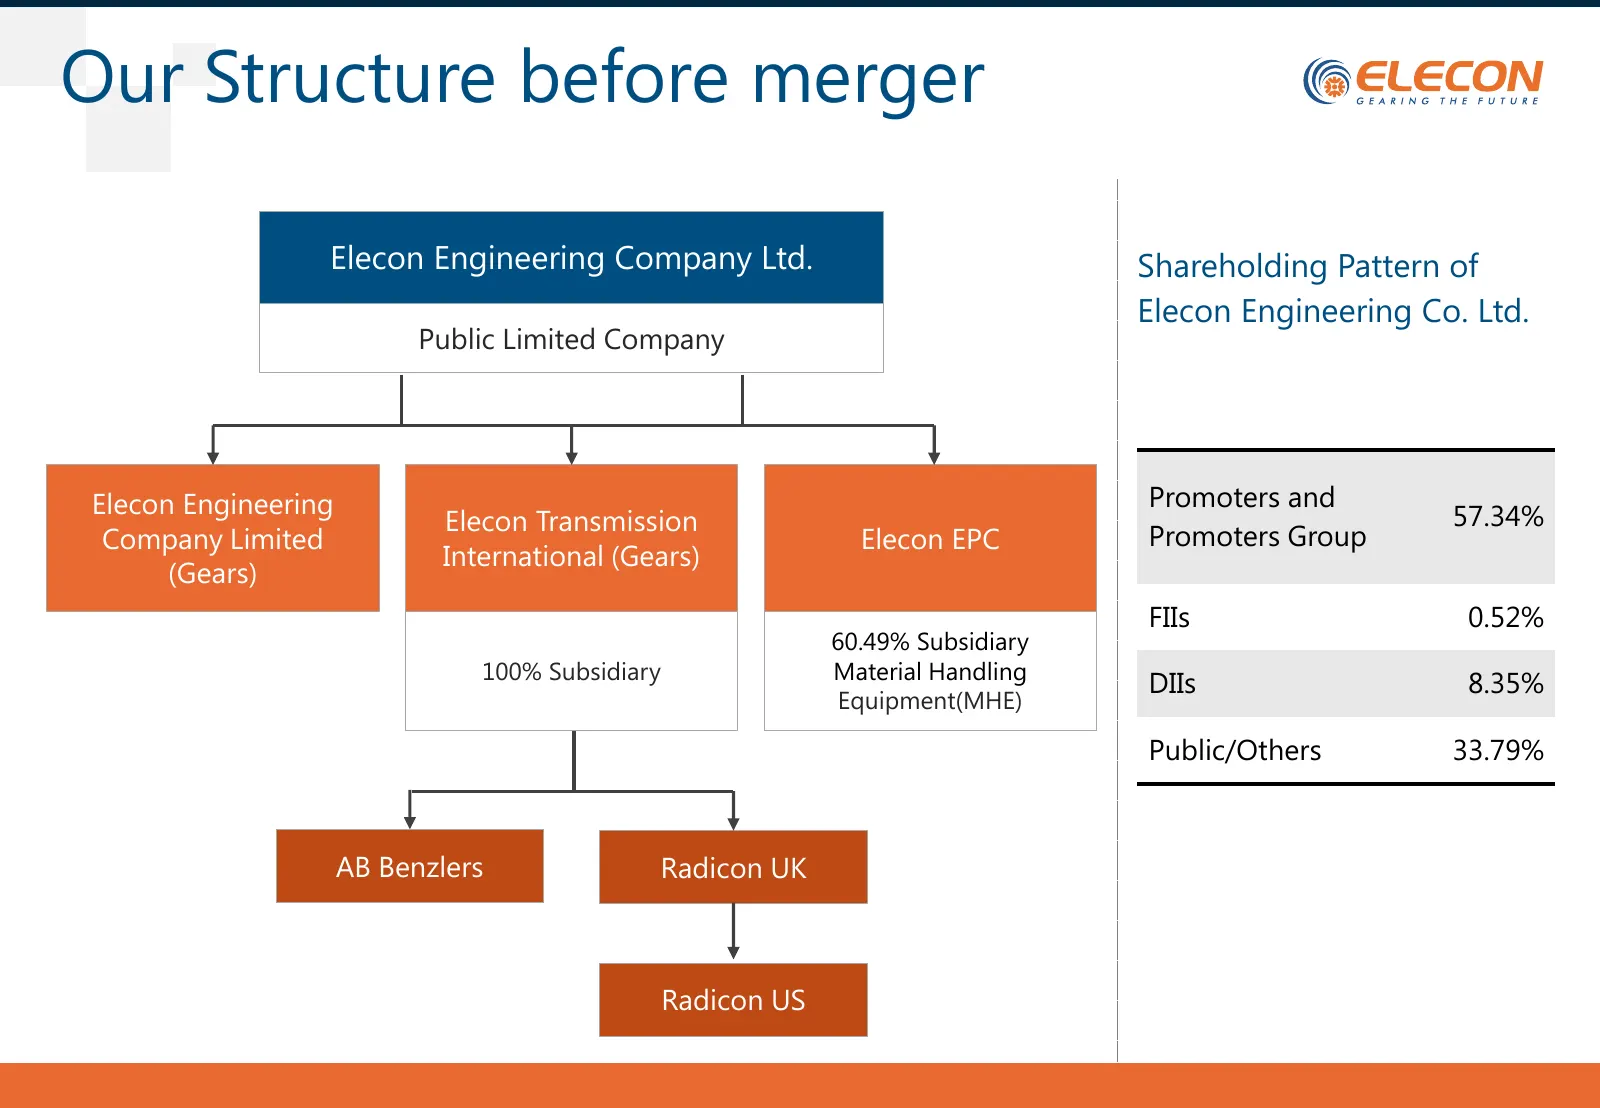
Slide 18: Our Structure before merger
Our Structure before merger Elecon Engineering Company Ltd. Shareholding Pattern of Elecon Engineering Co. Ltd. Public Limited Company Elecon Engineering Promoters and Elecon Transmission 57.34% Company Limited Elecon EPC Promoters Group International (Gears) (Gears) FIIs 0.52% 60.49% Subsidiary 100
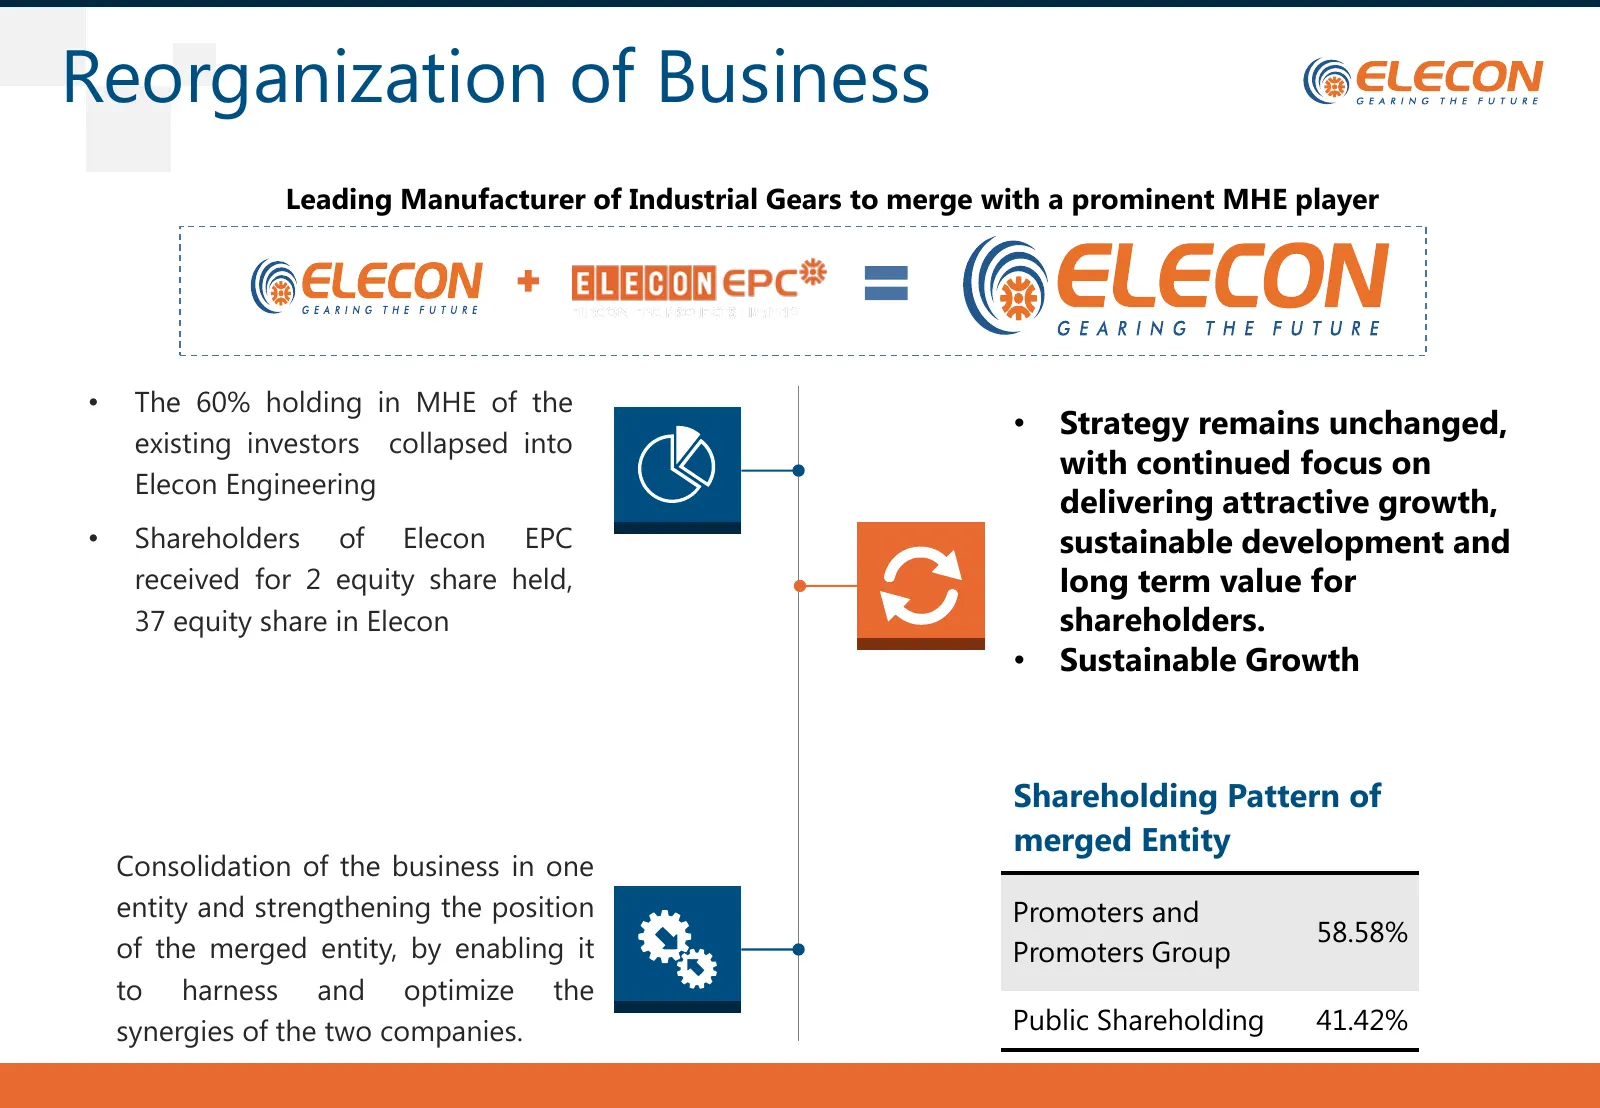
Slide 19: Reorganization of Business
Reorganization of Business Leading Manufacturer of Industrial Gears to merge with a prominent MHE player • The 60% holding in MHE of the • Strategy remains unchanged, existing investors collapsed into with continued focus on Elecon Engineering delivering attractive growth, • Shareholders of Elecon E
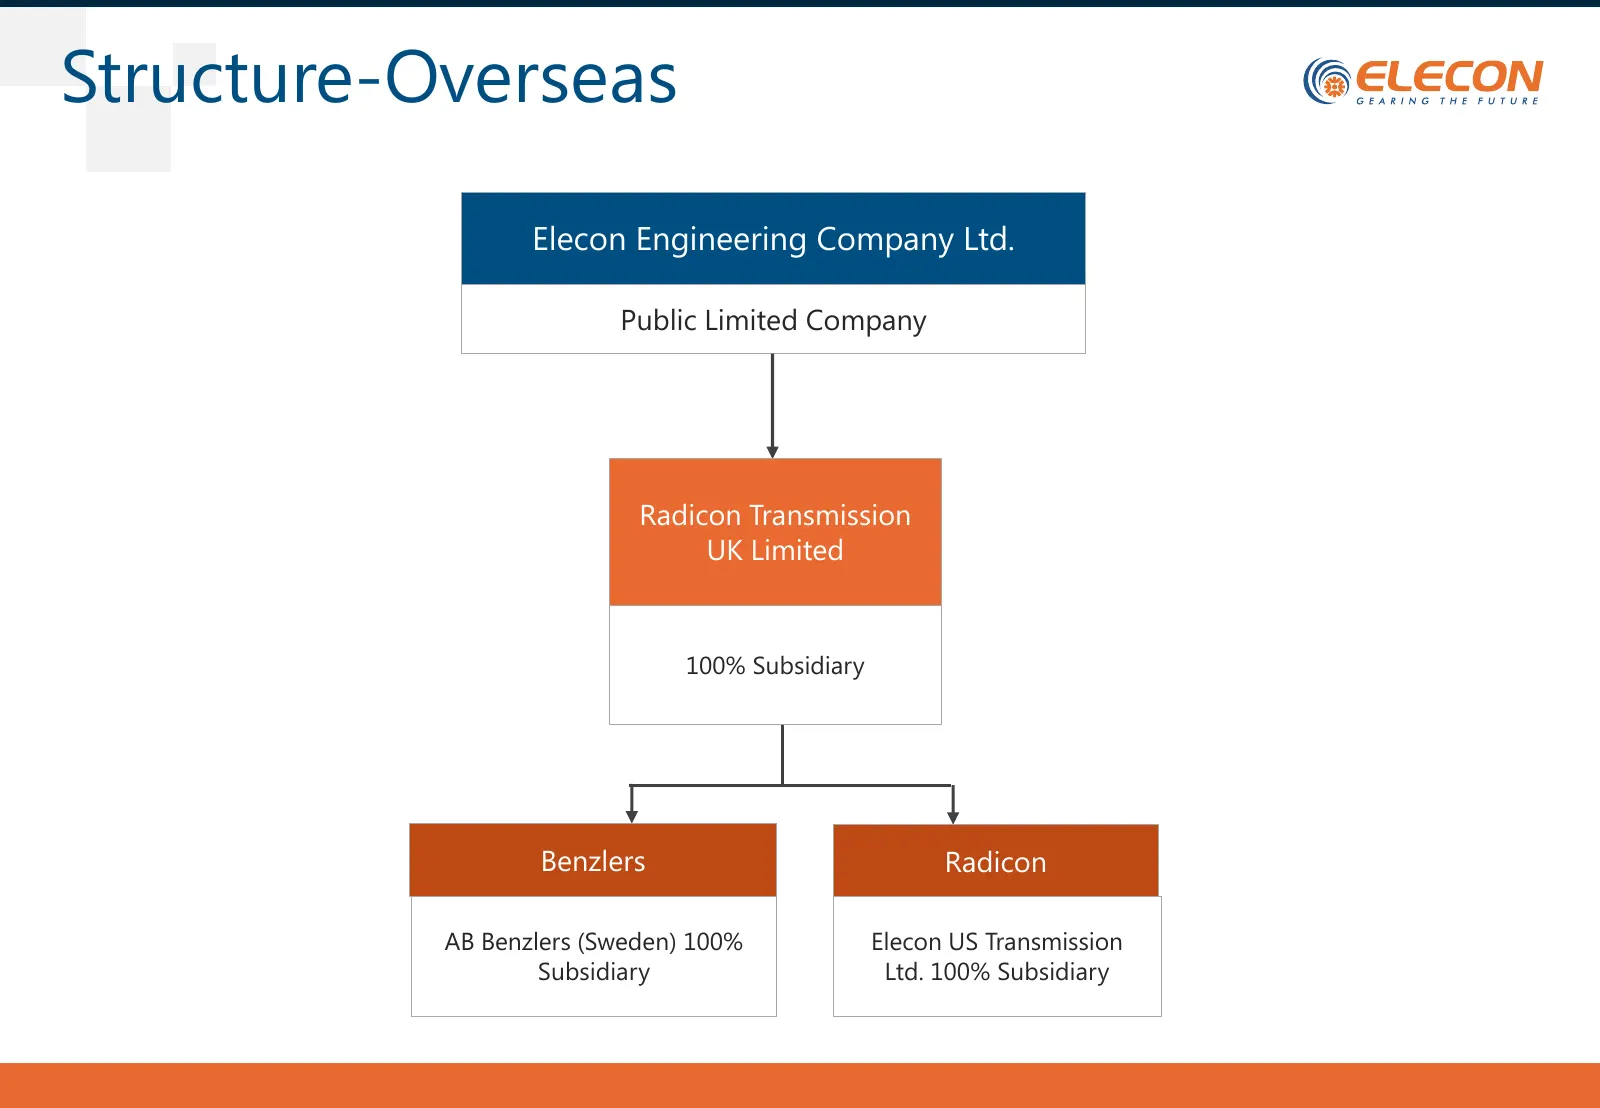
Slide 20: Structure-Overseas
Structure-Overseas Elecon Engineering Company Ltd. Public Limited Company Radicon Transmission UK Limited 100% Subsidiary Benzlers Radicon AB Benzlers (Sweden) 100% Elecon US Transmission Subsidiary Ltd. 100% Subsidiary
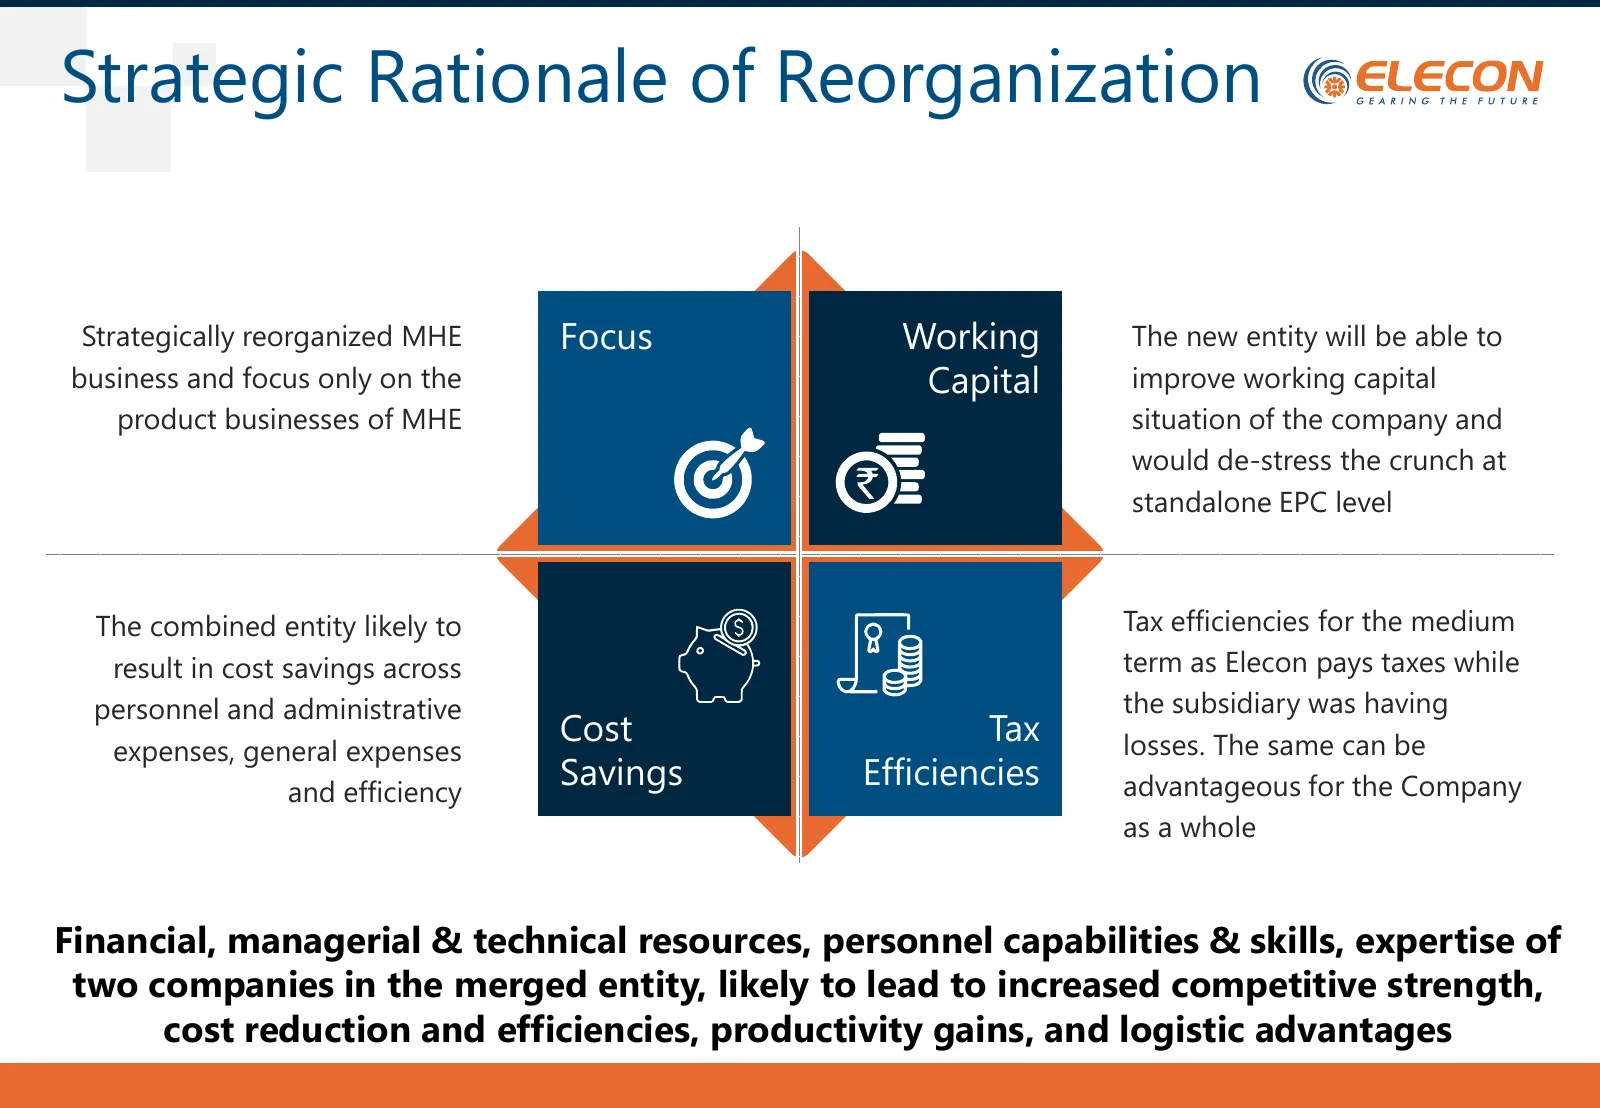
Slide 21: Strategic Rationale of Reorganization
Strategic Rationale of Reorganization Strategically reorganized MHE Focus Working The new entity will be able to business and focus only on the Capital improve working capital product businesses of MHE situation of the company and would de-stress the crunch at standalone EPC level The combined entit

Slide 22: Outlook
GEARING THE FUTURE
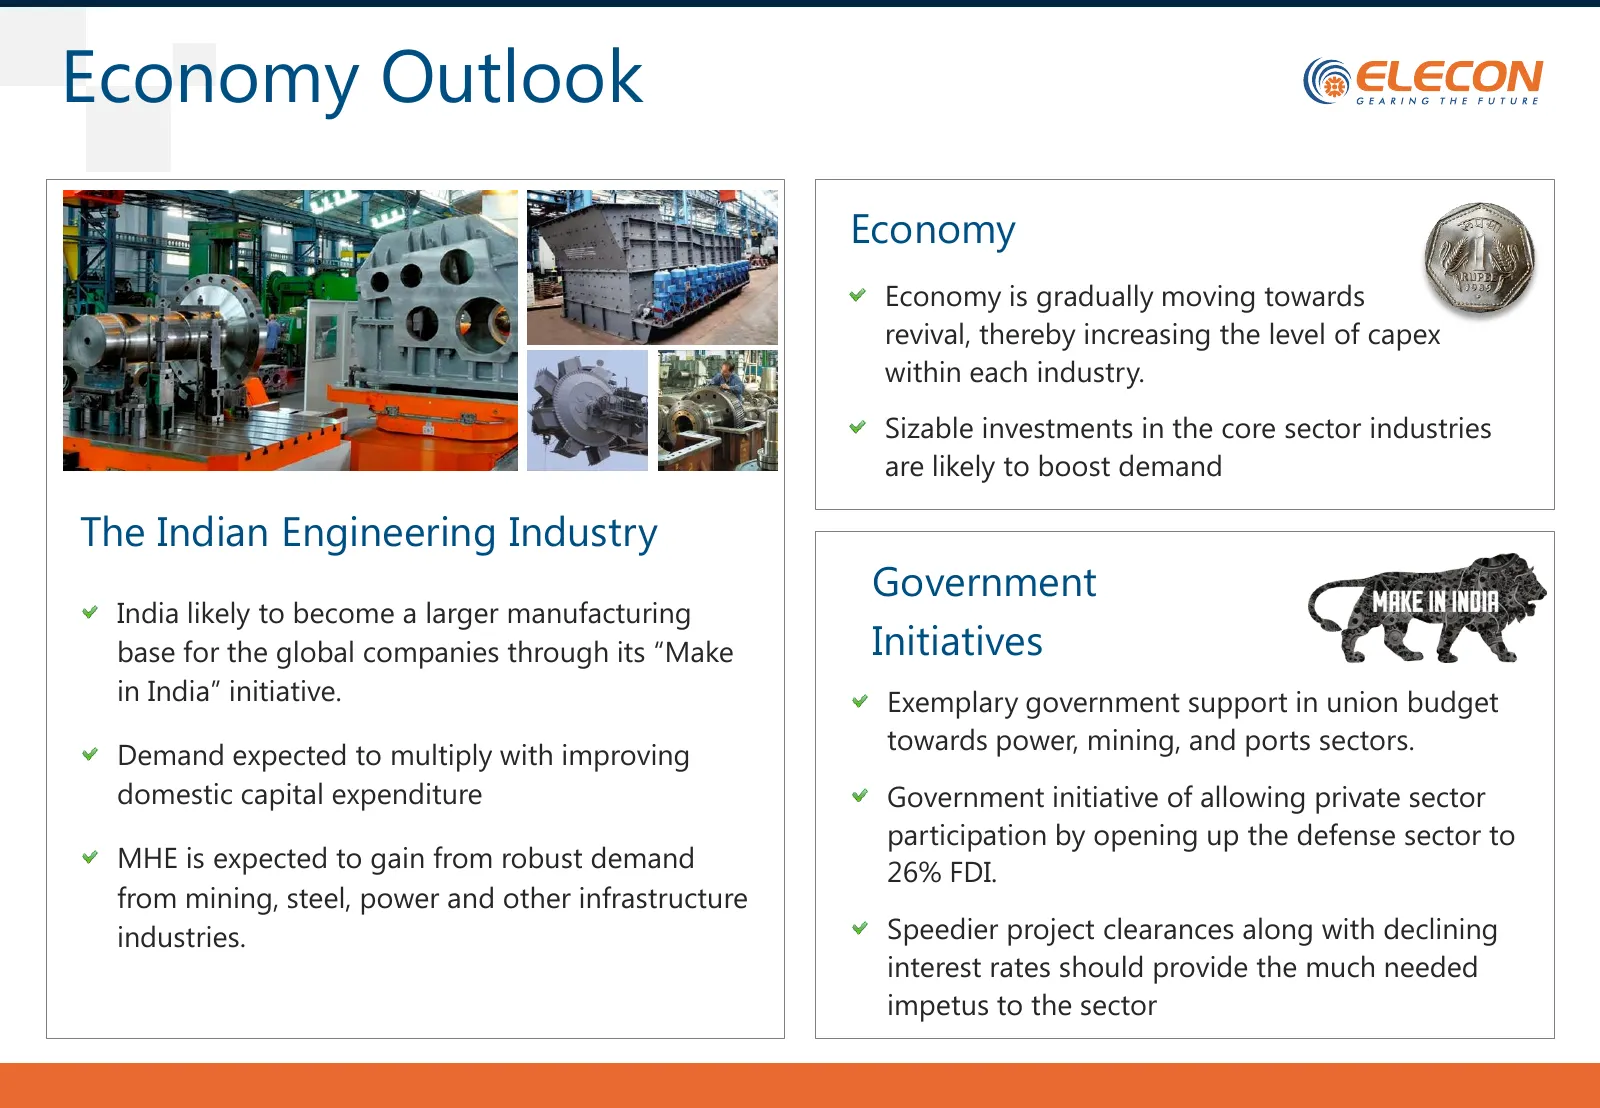
Slide 23: Economy Outlook
Economy Outlook Economy Economy is gradually moving towards revival, thereby increasing the level of capex within each industry. Sizable investments in the core sector industries are likely to boost demand The Indian Engineering Industry Government India likely to become a larger manufacturing base
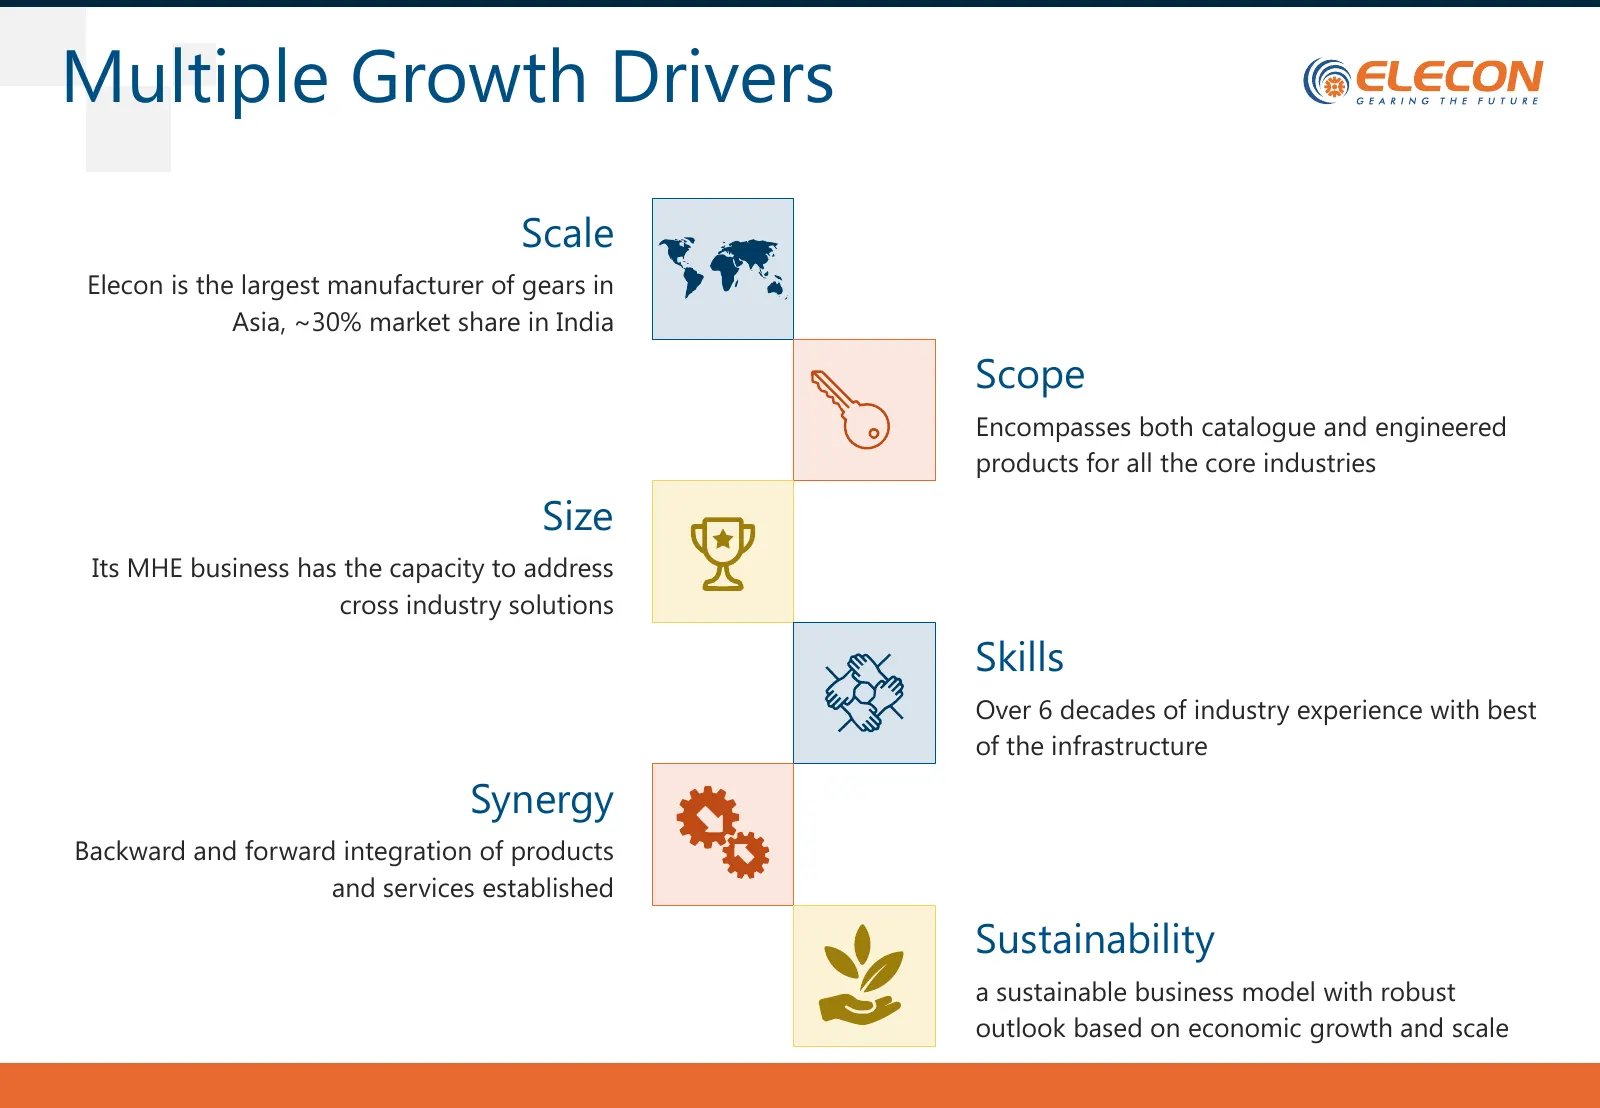
Slide 24: Multiple Growth Drivers
Multiple Growth Drivers Scale Elecon is the largest manufacturer of gears in Asia, ~30% market share in India Scope Encompasses both catalogue and engineered products for all the core industries Size Its MHE business has the capacity to address cross industry solutions Skills Over 6 decades of indus
Slide 25: Elecon - Gearing the Future
@€ELECON GEARING THE FUTURE www.elecon.com | BSE: 505700 | NSE: ELECON | Bloomberg: ELCN:IN | Reuters: ELCN.NS © 2016 Elecon Engineering Company Limited, All Rights Reserved. Elecon logo is trademarks of Elecon Engineering Company Limited In addition to Company data, data from market research agenci
Source: Internet Archive copy of elecon.com
More decks from Elecon Engineering Co. Ltd.
 Q2 FY27 Earnings Presentation45 slides · Oct 14, 2026
 Q1 FY27 Earnings Presentation43 slides · Jul 10, 2026
 Q4 FY26 Earnings Presentation47 slides · Apr 15, 2026
 Q3 FY26 Earnings Presentation45 slides · Jan 8, 2026
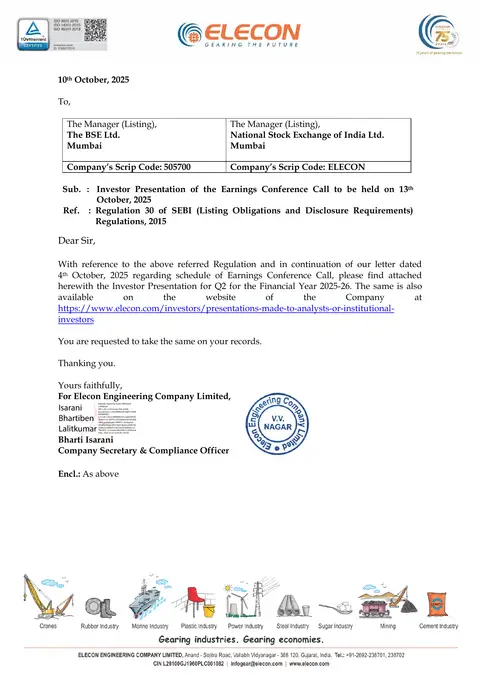 Q2 FY26 Earnings Presentation44 slides · Oct 10, 2025
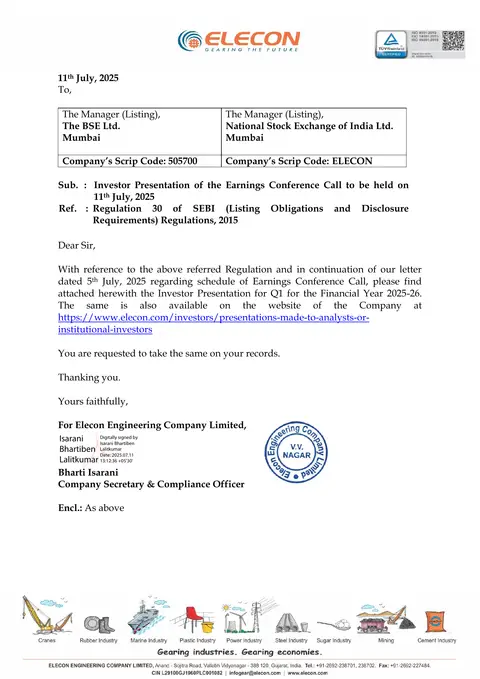 Q1 FY26 Earnings Presentation41 slides · Jul 11, 2025