Dobson Communications — Investor Day (February 2004)
124 slides from Dobson Communications's investor day presentation, Feb 18, 2004

Slide 1: Dobson Communications 2004 Investors' Conference
Dobson Communications 2004 Investors' Conference February 18, 2004
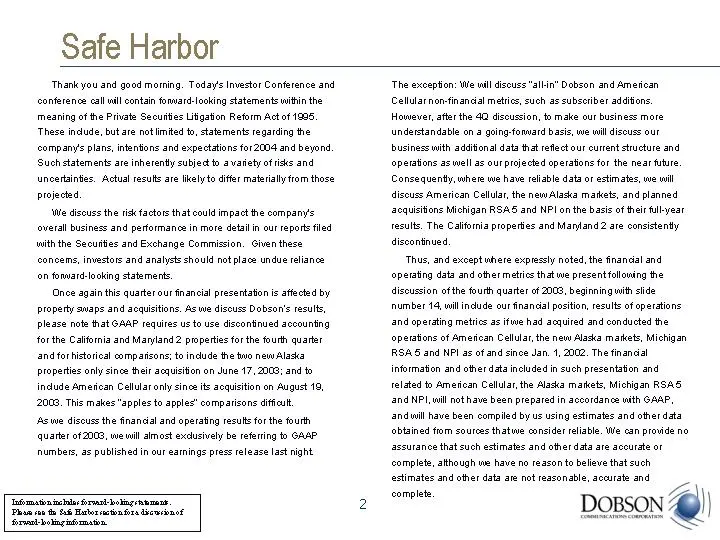
Slide 2: Forward-looking statements and presentation basis
Thank you and good morning. Today's Investor Conference and conference call will contain forward-looking statements within the meaning of the Private Securities Litigation Reform Act of 1995. These include, but are not limited to, statements regarding the company's plans, intentions and expectations
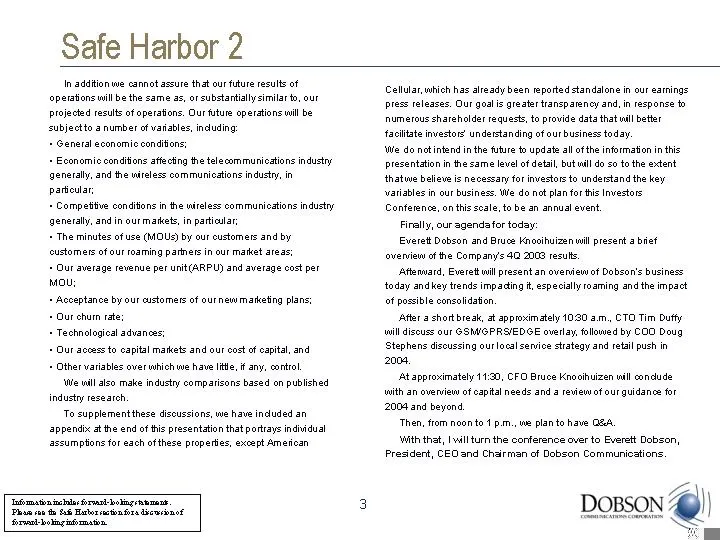
Slide 3: Safe Harbor and agenda
Safe Harbor 2 In addition we cannot assure that our future results of operations will be the same as, or substantially similar to, our projected results of operations. Our future operations will be subject to a number of variables, including: General economic conditions; Economic conditions affectin
Slide 4: Fourth Quarter 2003 Results
Fourth Quarter 2003 Results
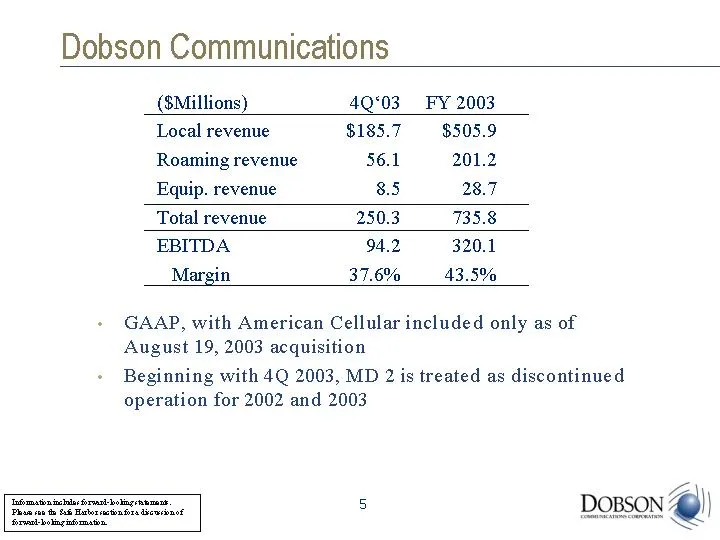
Slide 5: Dobson Communications GAAP results
Dobson Communications GAAP, with American Cellular included only as of August 19, 2003 acquisition Beginning with 4Q 2003, MD 2 is treated as discontinued operation for 2002 and 2003 ($Millions) Local revenue Roaming revenue Equip. revenue Total revenue EBITDA Margin 4Q'03 $185.7 56.1 8.5 250.3 94.2
Slide 6: 4Q Subscriber statistics
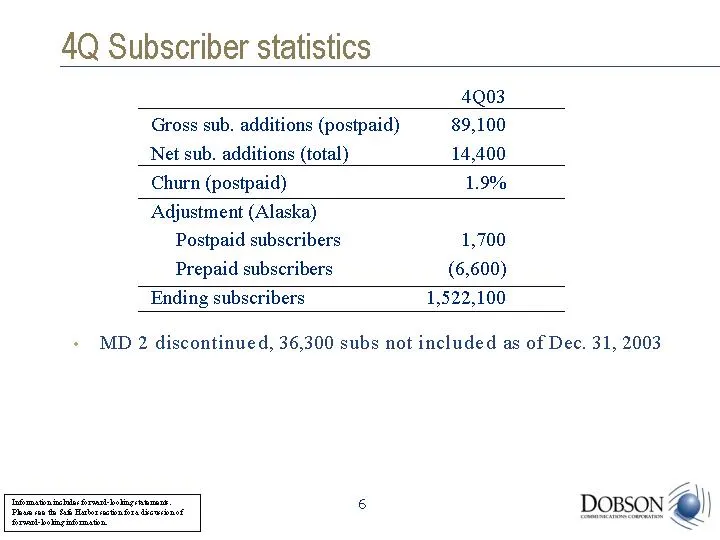
4Q Subscriber statistics MD 2 discontinued, 36,300 subs not included as of Dec. 31, 2003 Gross sub. additions (postpaid) Net sub. additions (total) Churn (postpaid) Adjustment (Alaska) Postpaid subscribers Prepaid subscribers Ending subscribers 4Q03 89,100 14,400 1.9% 1,700 (6,600) 1,522,100
Slide 7: 4Q events
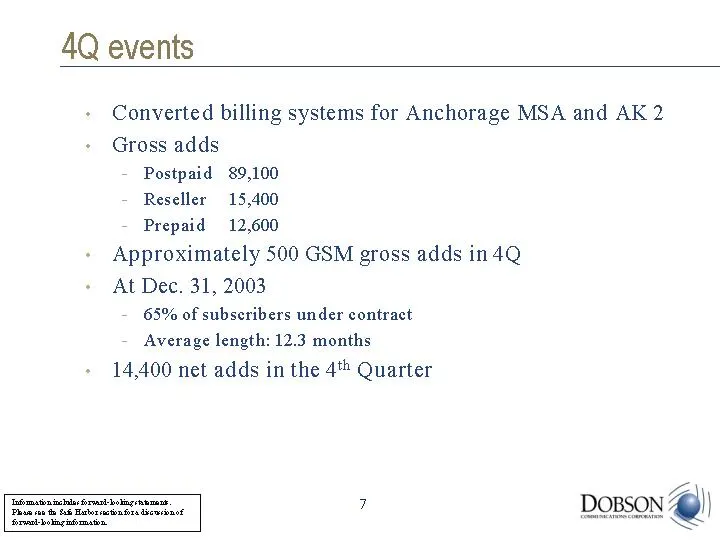
4Q events Converted billing systems for Anchorage MSA and AK 2 Gross adds Postpaid 89,100 Reseller 15,400 Prepaid 12,600 Approximately 500 GSM gross adds in 4Q At Dec. 31, 2003 65% of subscribers under contract Average length: 12.3 months 14,400 net adds in the 4th Quarter
Slide 8: 4Q net profit per subscriber
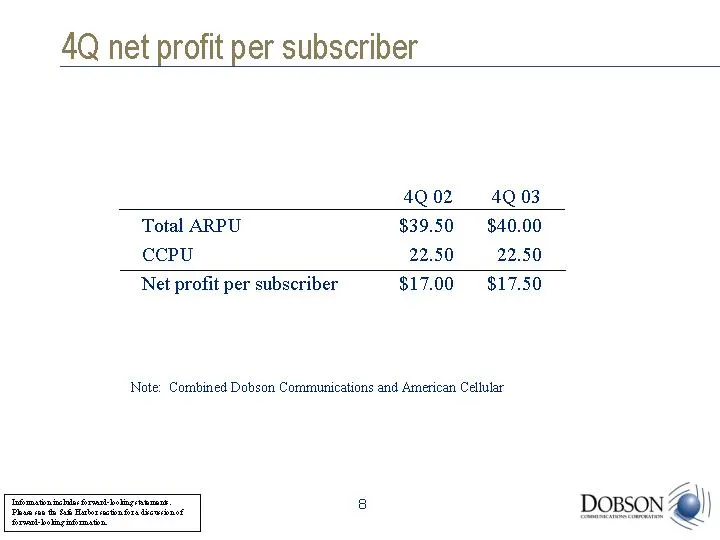
4Q net profit per subscriber Total ARPU CCPU Net profit per subscriber 4Q 02 $39.50 22.50 $17.00 4Q 03 $40.00 22.50 $17.50 Note: Combined Dobson Communications and American Cellular
Slide 9: 4Q events -- LNP
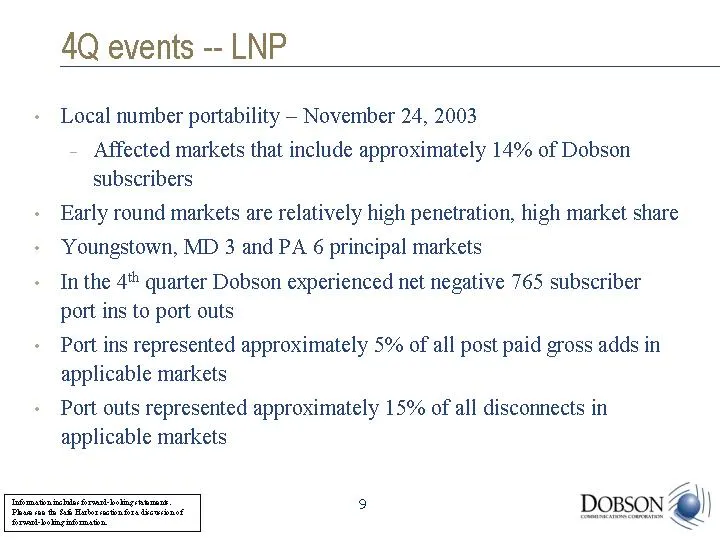
4Q events -- LNP Local number portability - November 24, 2003 Affected markets that include approximately 14% of Dobson subscribers Early round markets are relatively high penetration, high market share Youngstown, MD 3 and PA 6 principal markets In the 4th quarter Dobson experienced net negative 76
Slide 10: Q4 2003 results - balance sheet
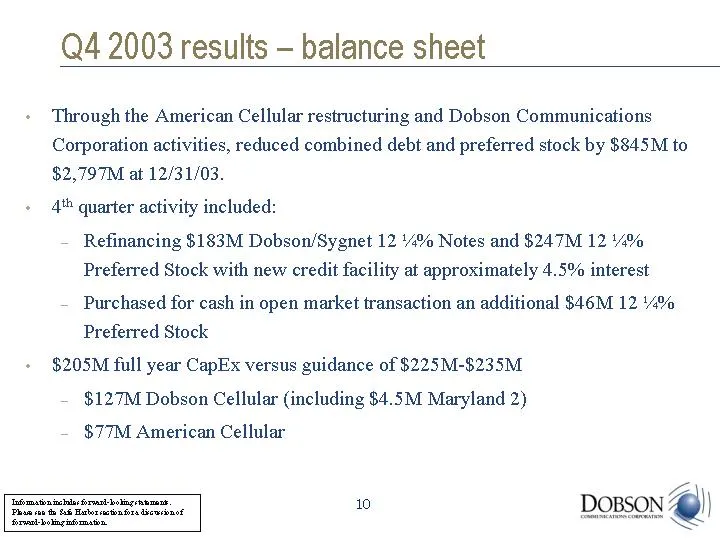
Q4 2003 results - balance sheet Through the American Cellular restructuring and Dobson Communications Corporation activities, reduced combined debt and preferred stock by $845M to $2,797M at 12/31/03. 4th quarter activity included: Refinancing $183M Dobson/Sygnet 12 1/4% Notes and $247M 12 1/4% Pref
Slide 11: Q4 2003 results - EBITDA
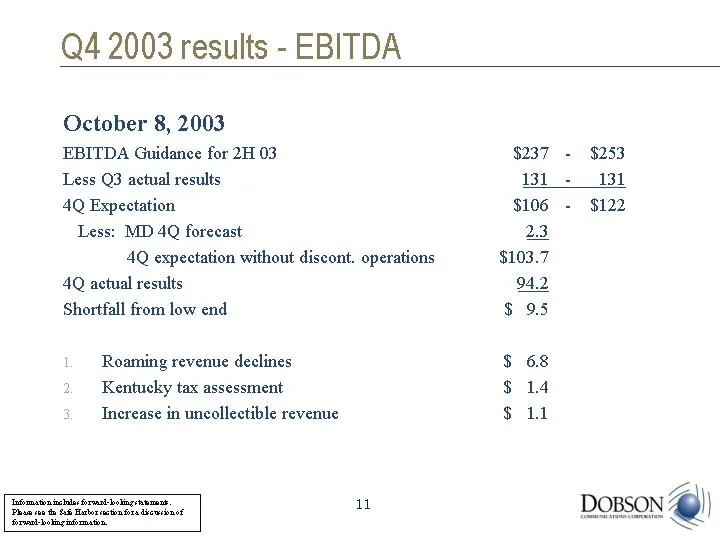
Q4 2003 results - EBITDA October 8, 2003 EBITDA Guidance for 2H 03 $237 - $253 Less Q3 actual results 131 - 131 4Q Expectation $106 - $122 Less: MD 4Q forecast 2.3 4Q expectation without discont. operations $103.7 4Q actual results 94.2 Shortfall from low end $ 9.5 Roaming revenue declines $ 6.8 Ken
Slide 12: Q4 2003 results -- roaming
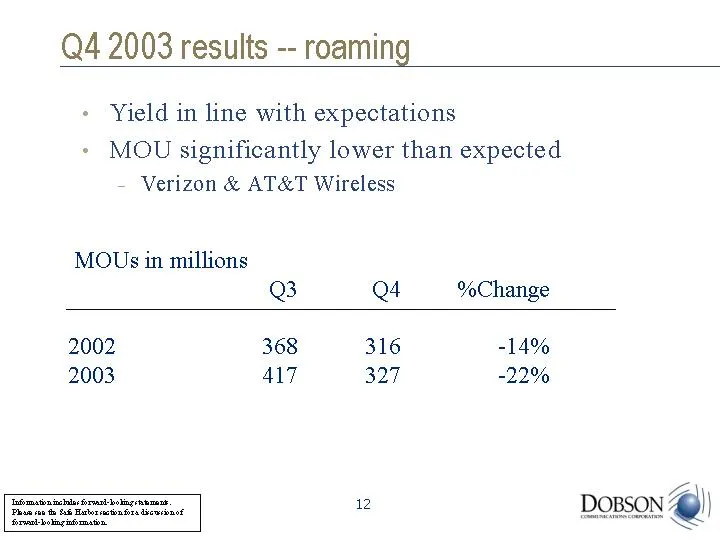
Q4 2003 results -- roaming Yield in line with expectations MOU significantly lower than expected Verizon & AT&T Wireless MOUs in millions Q3 Q4 %Change 2002 368 316 -14% 2003 417 327 -22%
Slide 13: Q4 2003 results - roaming percentage change
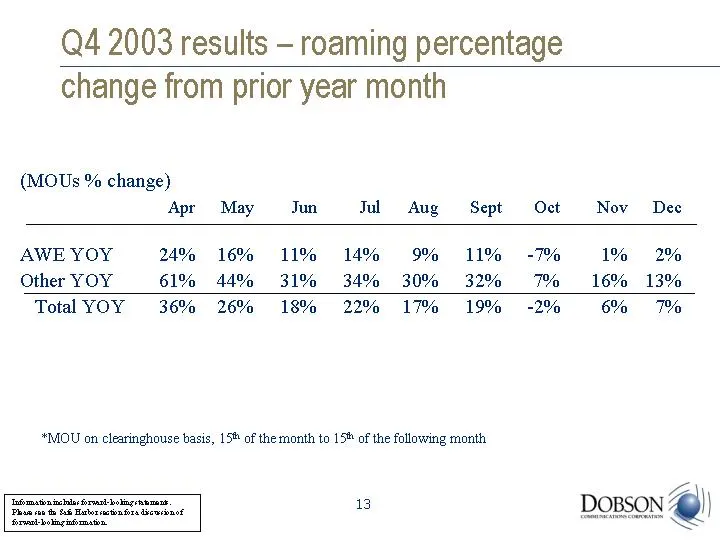
Q4 2003 results - roaming percentage change from prior year month (MOUs % change) Apr May Jun Jul Aug Sept Oct Nov Dec AWE YOY 24% 16% 11% 14% 9% 11% -7% 1% 2% Other YOY 61% 44% 31% 34% 30% 32% 7% 16% 13% Total YOY 36% 26% 18% 22% 17% 19% -2% 6% 7% *MOU on clearinghouse basis, 15th of the month to 1
Slide 14: Dobson Communications 2004: Positioned for Long-Term Growth
Dobson Communications 2004 : Positioned for Long-Term Growth
Slide 15: Basis of today's presentation
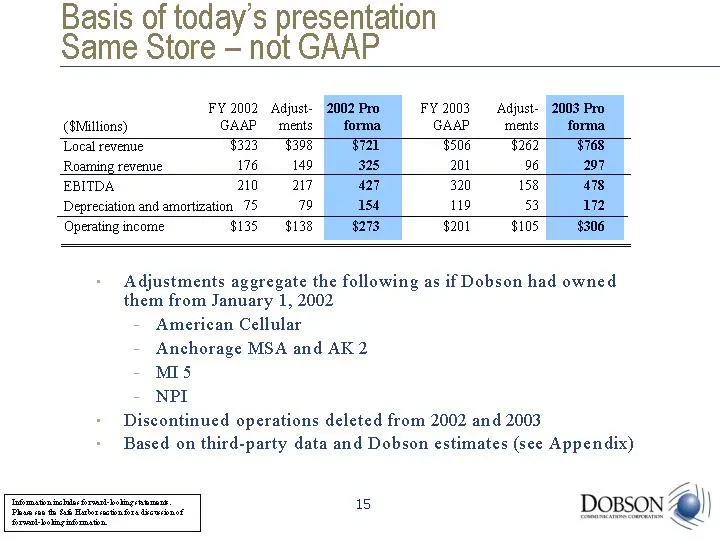
Basis of today's presentation Same Store - not GAAP Adjustments aggregate the following as if Dobson had owned them from January 1, 2002 American Cellular Anchorage MSA and AK 2 MI 5 NPI Discontinued operations deleted from 2002 and 2003 Based on third-party data and Dobson estimates (see Appendix)
Slide 16: Everett R. Dobson, Chairman, CEO and President
Dobson Communications Everett R. Dobson Chairman, CEO and President
Slide 17: Overview -- Dobson today
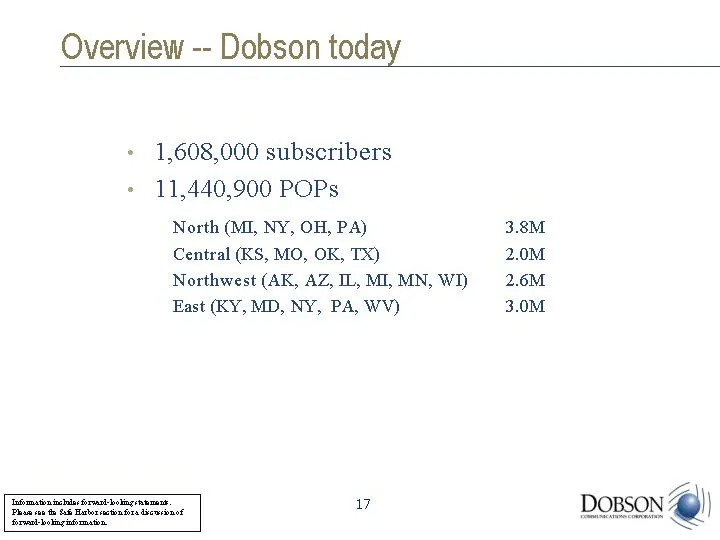
Overview -- Dobson today 1,608,000 subscribers 11,440,900 POPs North (MI, NY, OH, PA) 3.8M Central (KS, MO, OK, TX) 2.0M Northwest (AK, AZ, IL, MI, MN, WI) 2.6M East (KY, MD, NY, PA, WV) 3.0M
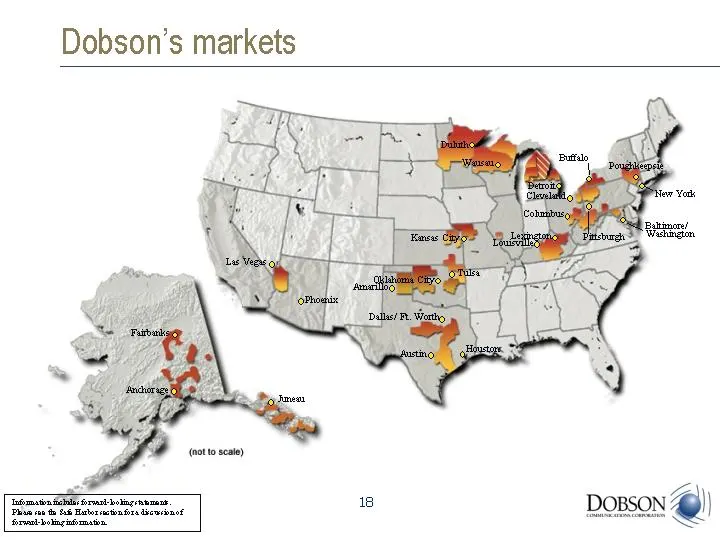
Slide 18: Dobson's markets
Dobson's markets 18 Duluth New York Washington Baltimore/ Fairbanks Wausau Las Vegas Phoenix Dallas/ Ft. Worth Oklahoma City Tulsa Kansas City Lexington Columbus Cleveland Austin Houston Pittsburgh Anchorage Louisville Poughkeepsie Amarillo Buffalo Detroit Information includes forward-looking statem
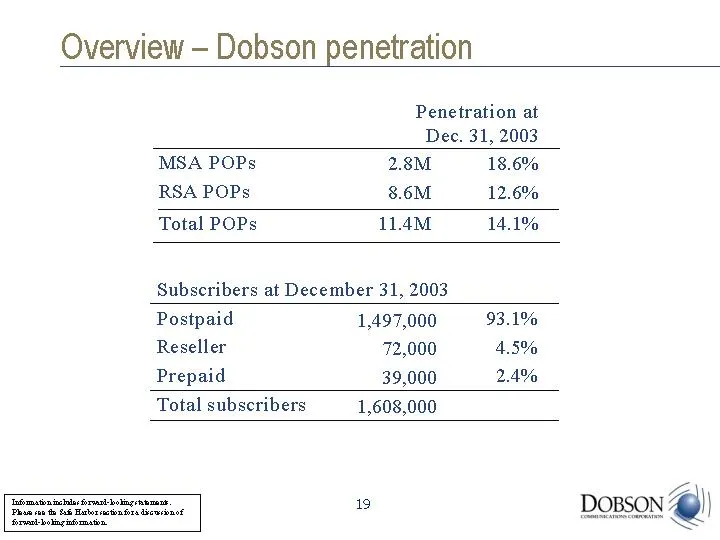
Slide 19: Overview - Dobson penetration
Overview - Dobson penetration MSA POPs RSA POPs Total POPs Penetration at Dec. 31, 2003 18.6% 12.6% 14.1% 2.8M 8.6M 11.4M Subscribers at December 31, 2003 Postpaid Reseller Prepaid Total subscribers 1,497,000 72,000 39,000 1,608,000 93.1% 4.5% 2.4%
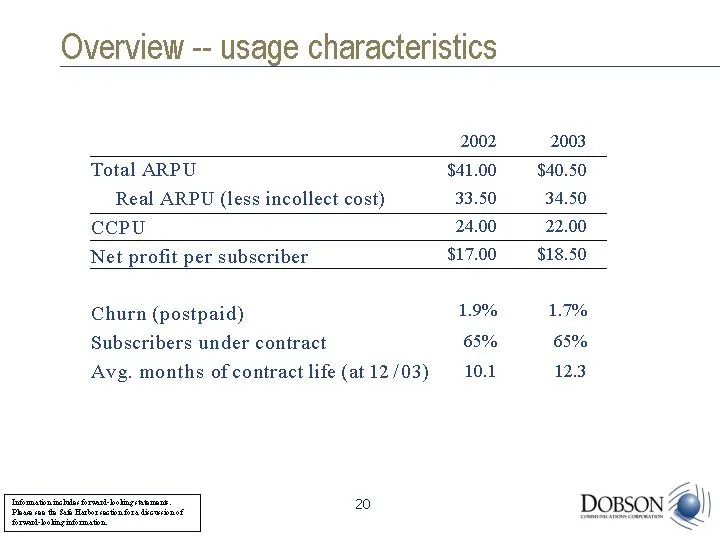
Slide 20: Overview -- usage characteristics
Overview -- usage characteristics Total ARPU Real ARPU (less incollect cost) CCPU Net profit per subscriber Churn (postpaid) Subscribers under contract Avg. months of contract life (at 12/03) 2003 $40.50 34.50 22.00 $18.50 1.7% 65% 12.3 2002 $41.00 33.50 24.00 $17.00 1.9% 65% 10.1
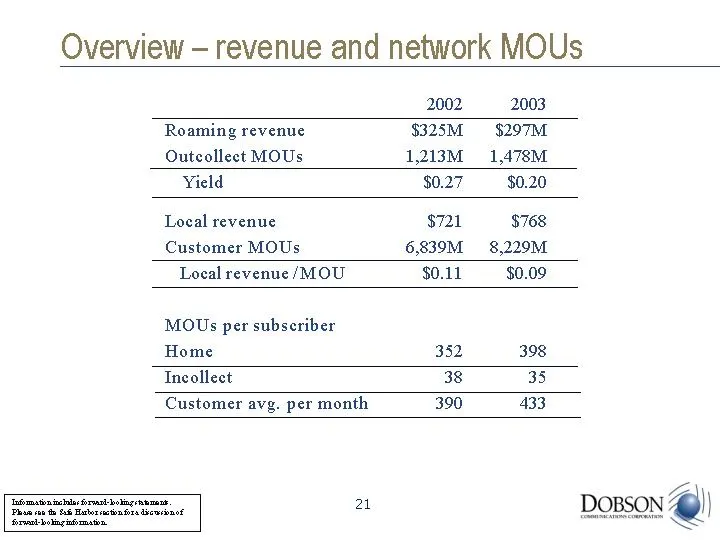
Slide 21: Overview - revenue and network MOUs
Overview - revenue and network MOUs Roaming revenue Outcollect MOUs Yield Local revenue Customer MOUs Local revenue/MOU MOUs per subscriber Home Incollect Customer avg. per month 2003 $297M 1,478M $0.20 $768 8,229M $0.09 398 35 433 2002 $325M 1,213M $0.27 $721 6,839M $0.11 352 38 390
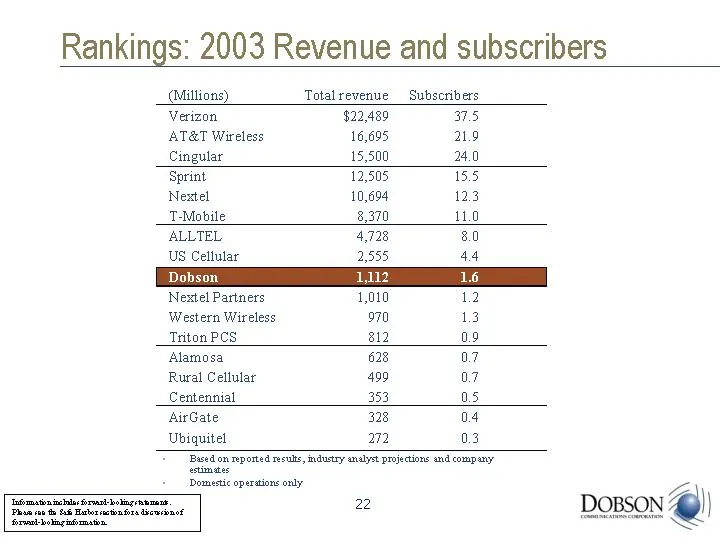
Slide 22: Rankings: 2003 Revenue and subscribers
Rankings: 2003 Revenue and subscribers (Millions) Verizon AT&T Wireless Cingular Sprint Nextel T-Mobile ALLTEL US Cellular Dobson Nextel Partners Western Wireless Triton PCS Alamosa Rural Cellular Centennial AirGate Ubiquitel Total revenue $22,489 16,695 15,500 12,505 10,694 8,370 4,728 2,555 1,112
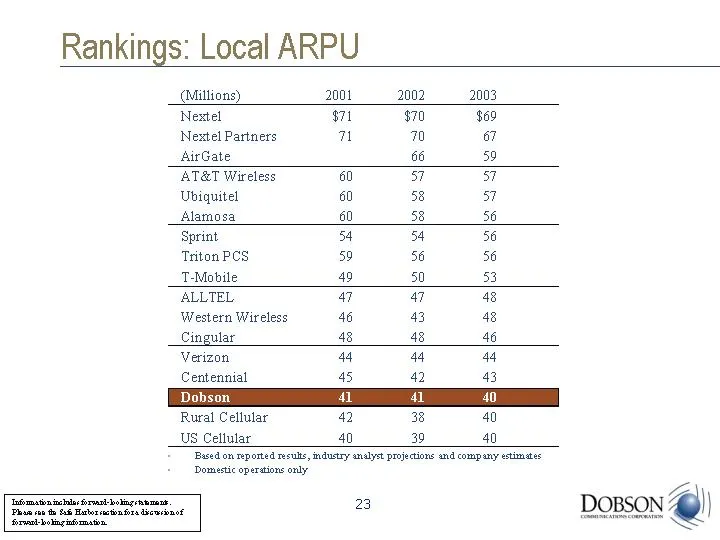
Slide 23: Rankings: Local ARPU
Rankings: Local ARPU (Millions) Nextel Nextel Partners AirGate AT&T Wireless Ubiquitel Alamosa Sprint Triton PCS T-Mobile ALLTEL Western Wireless Cingular Verizon Centennial Dobson Rural Cellular US Cellular 2003 $69 67 59 57 57 56 56 56 53 48 48 46 44 43 40 40 40 2002 $70 70 66 57 58 58 54 56 50 47
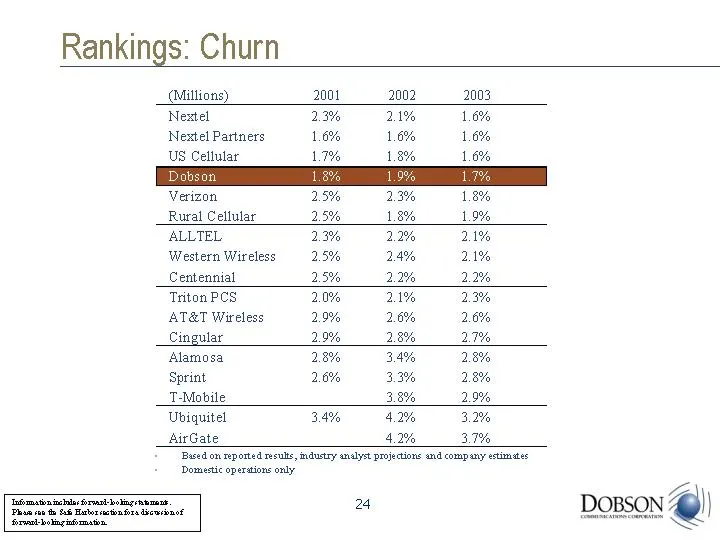
Slide 24: Rankings: Churn
Rankings: Churn (Millions) Nextel Nextel Partners US Cellular Dobson Verizon Rural Cellular ALLTEL Western Wireless Centennial Triton PCS AT&T Wireless Cingular Alamosa Sprint T-Mobile Ubiquitel AirGate 2003 1.6% 1.6% 1.6% 1.7% 1.8% 1.9% 2.1% 2.1% 2.2% 2.3% 2.6% 2.7% 2.8% 2.8% 2.9% 3.2% 3.7% 2002 2.
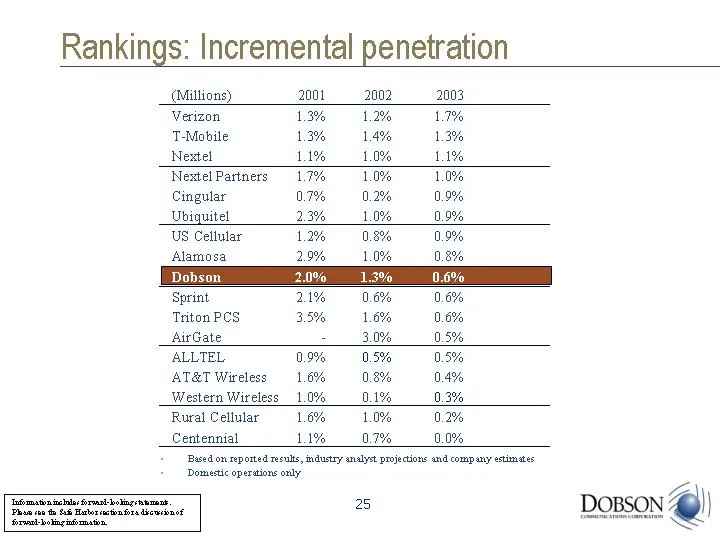
Slide 25: Rankings: Incremental penetration
Rankings: Incremental penetration (Millions) Verizon T-Mobile Nextel Nextel Partners Cingular Ubiquitel US Cellular Alamosa Dobson Sprint Triton PCS AirGate ALLTEL AT&T Wireless Western Wireless Rural Cellular Centennial 2003 1.7% 1.3% 1.1% 1.0% 0.9% 0.9% 0.9% 0.8% 0.6% 0.6% 0.6% 0.5% 0.5% 0.4% 0.3%
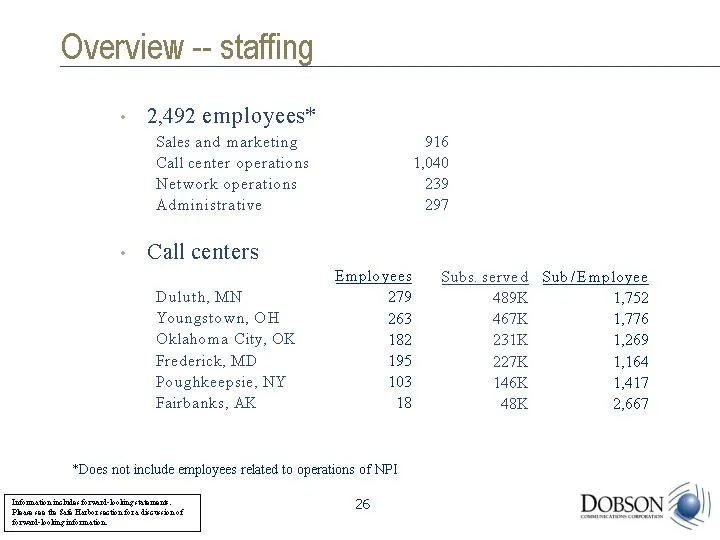
Slide 26: Overview -- staffing
Overview -- staffing 2,492 employees* Sales and marketing 916 Call center operations 1,040 Network operations 239 Administrative 297 Call centers Duluth, MN Youngstown, OH Oklahoma City, OK Frederick, MD Poughkeepsie, NY Fairbanks, AK Employees 279 263 182 195 103 18 Subs. served 489K 467K 231K 227K
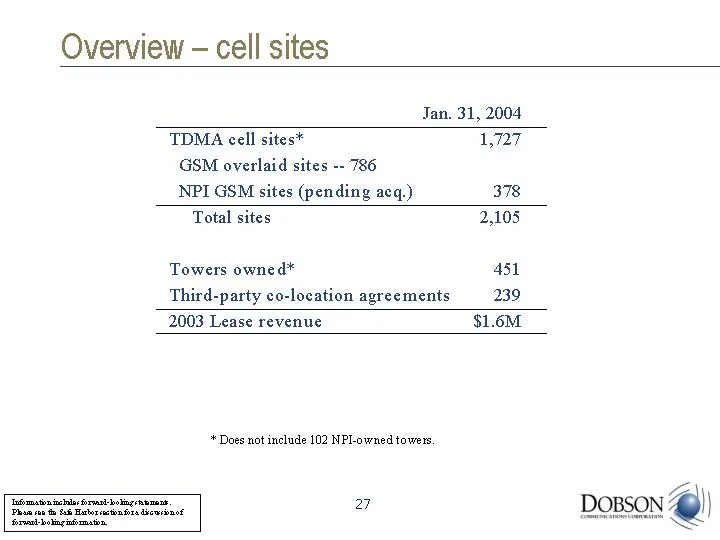
Slide 27: Overview - cell sites
Overview - cell sites TDMA cell sites* GSM overlaid sites -- 786 NPI GSM sites (pending acq.) Total sites Towers owned* Third-party co-location agreements 2003 Lease revenue * Does not include 102 NPI-owned towers. Jan. 31, 2004 1,727 378 2,105 451 239 $1.6M
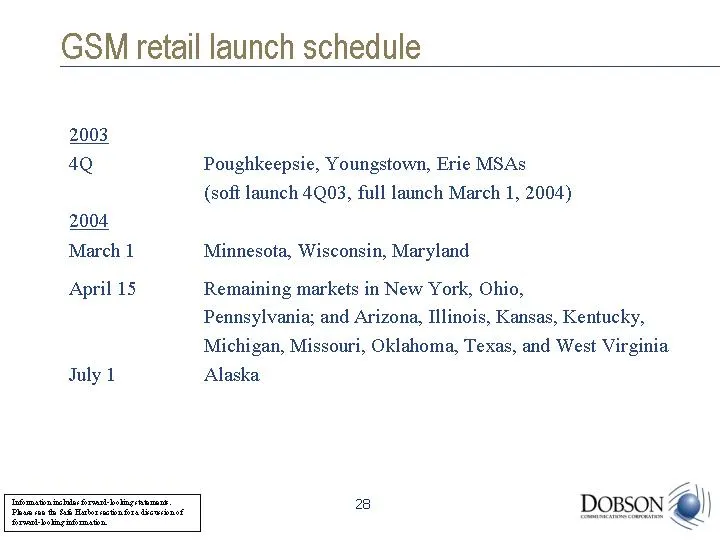
Slide 28: GSM retail launch schedule
GSM retail launch schedule 2003 4Q Poughkeepsie, Youngstown, Erie MSAs (soft launch 4Q03, full launch March 1, 2004) 2004 March 1 Minnesota, Wisconsin, Maryland April 15 Remaining markets in New York, Ohio, Pennsylvania; and Arizona, Illinois, Kansas, Kentucky, Michigan, Missouri, Oklahoma, Texas, a
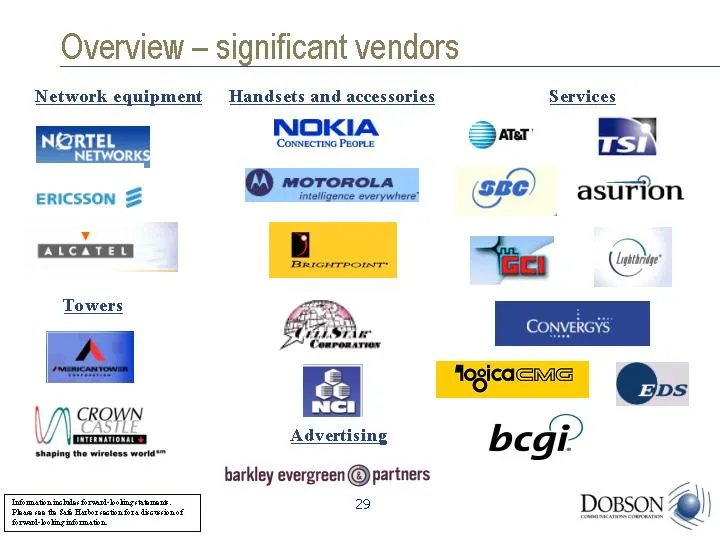
Slide 29: Overview - significant vendors
Overview - significant vendors Network equipment Handsets and accessories Towers Advertising Services
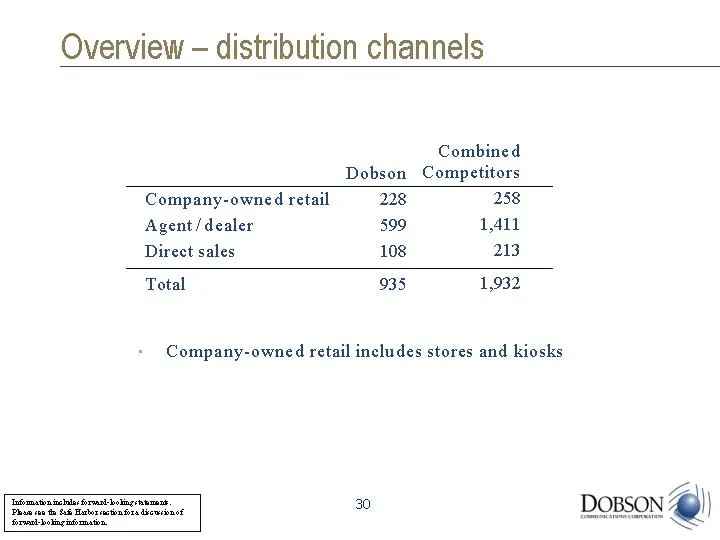
Slide 30: Overview - distribution channels
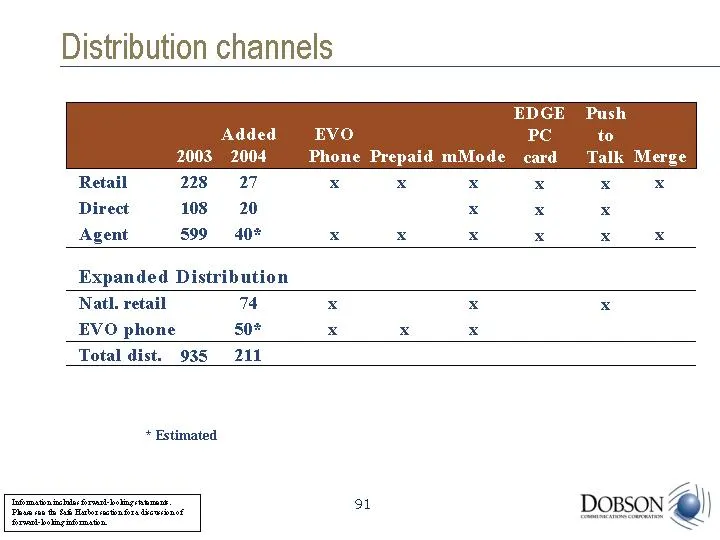
Overview - distribution channels Company-owned retail Agent/dealer Direct sales Total Dobson 228 599 108 935 Combined Competitors 258 1,411 213 1,932 Company-owned retail includes stores and kiosks
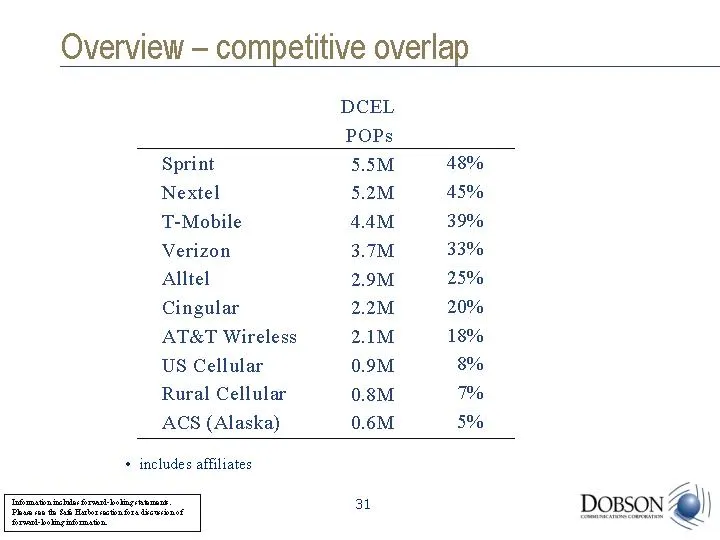
Slide 31: Overview - competitive overlap
Overview - competitive overlap DCEL POPs 5.5M 5.2M 4.4M 3.7M 2.9M 2.2M 2.1M 0.9M 0.8M 0.6M 48% 45% 39% 33% 25% 20% 18% 8% 7% 5% Sprint Nextel T-Mobile Verizon Alltel Cingular AT&T Wireless US Cellular Rural Cellular ACS (Alaska) includes affiliates
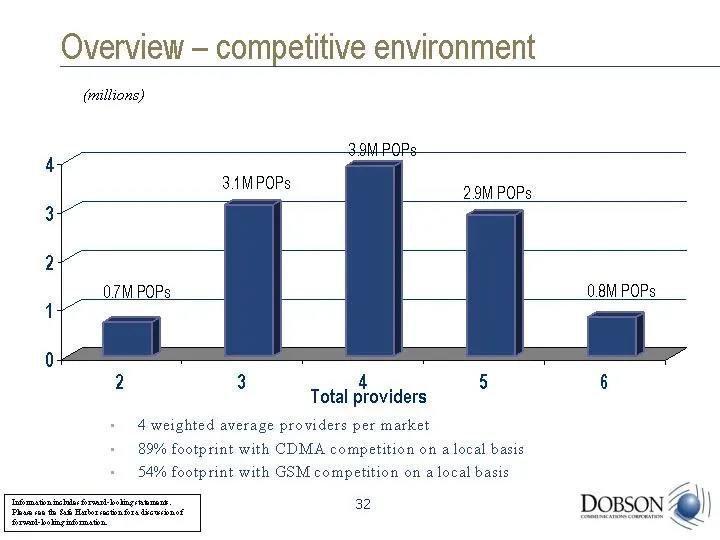
Slide 32: Overview - competitive environment
Overview - competitive environment 2 3 4 5 6 0.7 3.1 3.9 2.9 0.8 Total providers (millions) 4 weighted average providers per market 89% footprint with CDMA competition on a local basis 54% footprint with GSM competition on a local basis
Slide 33: Roaming strategy
Roaming strategy Long-term contracts Exclusivity and preference where possible Lower off-network (incollect) cost for Dobson's subscribers
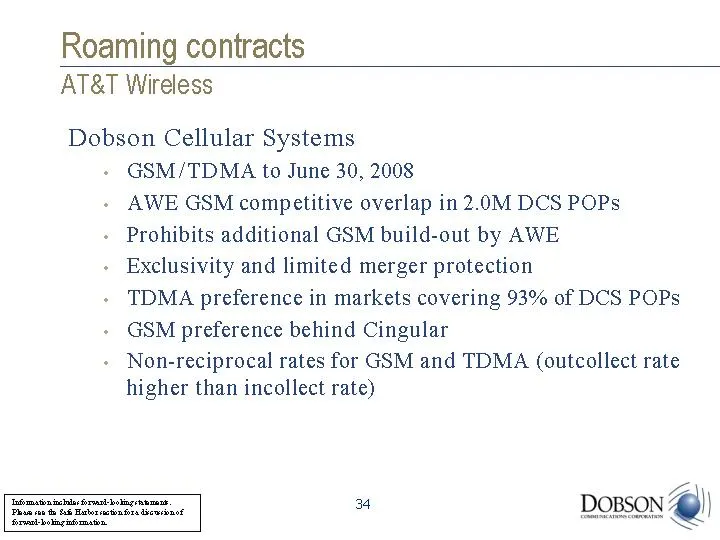
Slide 34: Roaming contracts AT&T Wireless Dobson Cellular Systems
Roaming contracts AT&T Wireless Dobson Cellular Systems GSM/TDMA to June 30, 2008 AWE GSM competitive overlap in 2.0M DCS POPs Prohibits additional GSM build-out by AWE Exclusivity and limited merger protection TDMA preference in markets covering 93% of DCS POPs GSM preference behind Cingular Non-re
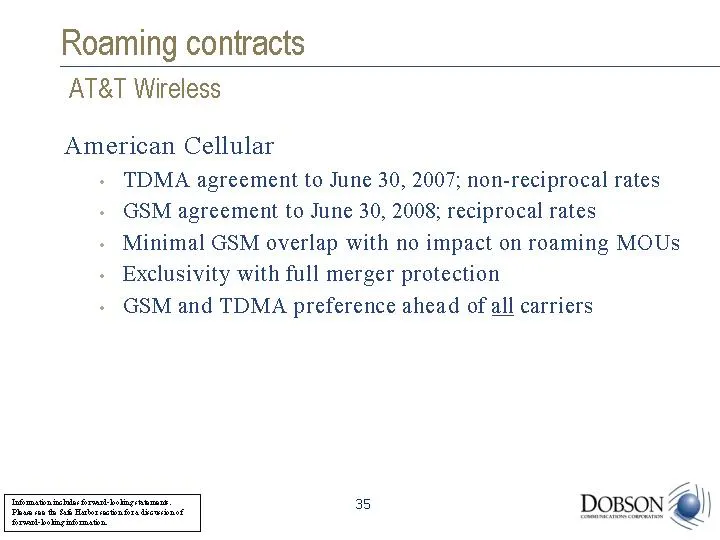
Slide 35: Roaming contracts AT&T Wireless American Cellular
Roaming contracts AT&T Wireless American Cellular TDMA agreement to June 30, 2007; non-reciprocal rates GSM agreement to June 30, 2008; reciprocal rates Minimal GSM overlap with no impact on roaming MOUs Exclusivity with full merger protection GSM and TDMA preference ahead of all carriers
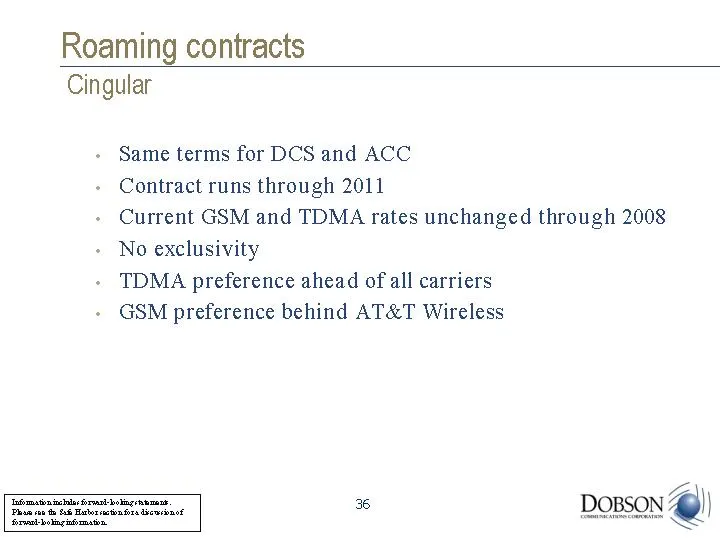
Slide 36: Roaming contracts Cingular
Roaming contracts Cingular Same terms for DCS and ACC Contract runs through 2011 Current GSM and TDMA rates unchanged through 2008 No exclusivity TDMA preference ahead of all carriers GSM preference behind AT&T Wireless
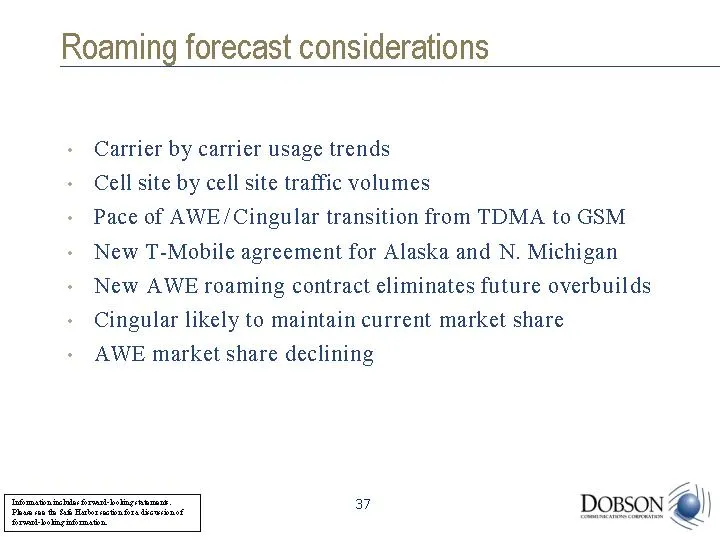
Slide 37: Roaming forecast considerations
Roaming forecast considerations Carrier by carrier usage trends Cell site by cell site traffic volumes Pace of AWE/Cingular transition from TDMA to GSM New T-Mobile agreement for Alaska and N. Michigan New AWE roaming contract eliminates future overbuilds Cingular likely to maintain current market s
Slide 38: Roaming forecast considerations
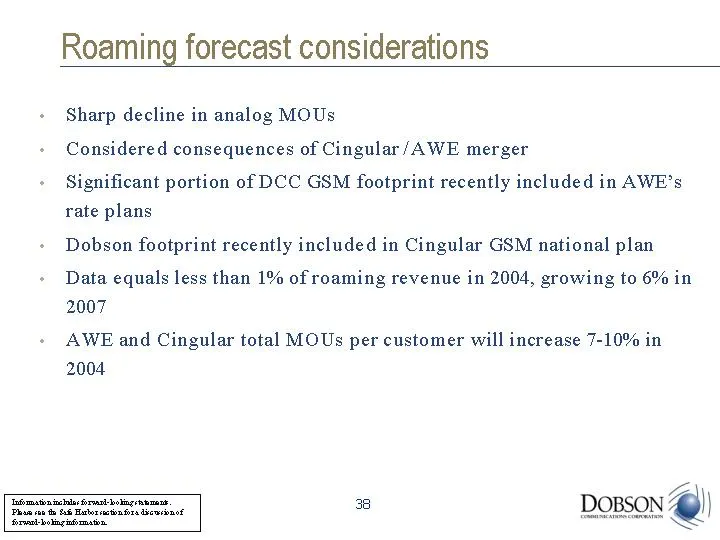
Roaming forecast considerations Sharp decline in analog MOUs Considered consequences of Cingular/AWE merger Significant portion of DCC GSM footprint recently included in AWE's rate plans Dobson footprint recently included in Cingular GSM national plan Data equals less than 1% of roaming revenue in 2
Slide 39: Roaming outlook for yield
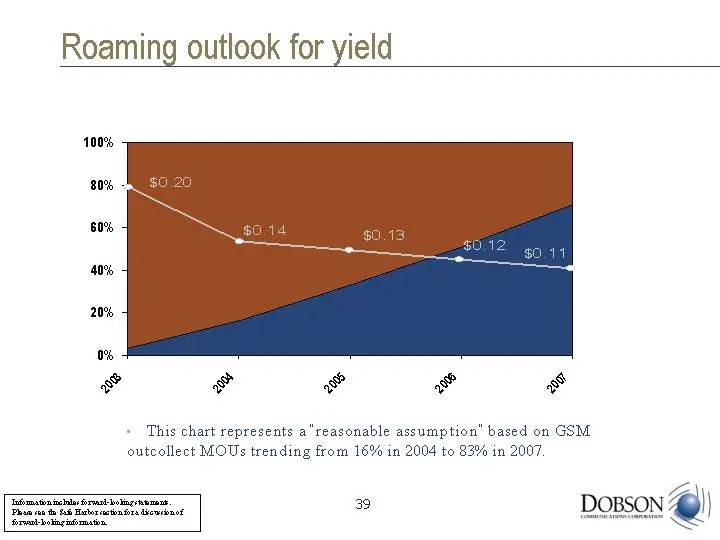
Roaming outlook for yield 2003 2004 2005 2006 2007 GSM 0.03 0.16 0.33 0.51 0.71 TDMA 0.97 0.84 0.67 0.49 0.29 This chart represents a "reasonable assumption" based on GSM outcollect MOUs trending from 16% in 2004 to 83% in 2007. 2003 2004 2005 2006 2007 Yield 0.2 0.14 0.13 0.12 0.11
Slide 40: Roaming revenue outlook
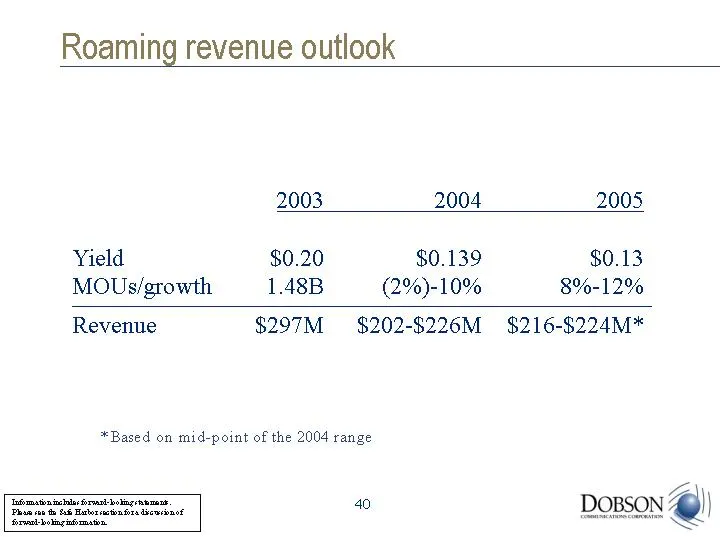
Roaming revenue outlook * Based on mid-point of the 2004 range 2003 2004 2005 Yield $0.20 $0.139 $0.13 MOUs/growth 1.48B (2%)-10% 8%-12% Revenue $297M $202-$226M $216-$224M*
Slide 41: Incollect usage per subscriber
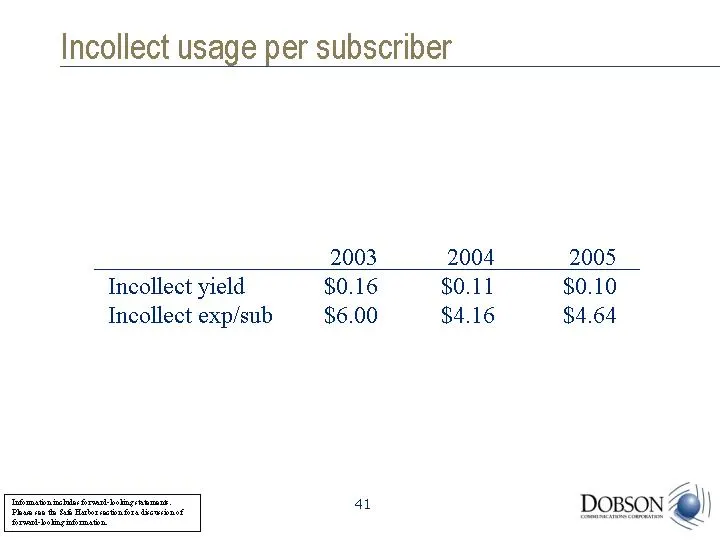
Incollect usage per subscriber 2003 2004 2005 Incollect yield $0.16 $0.11 $0.10 Incollect exp/sub $6.00 $4.16 $4.64
Slide 42: Consolidation - AWE/Cingular
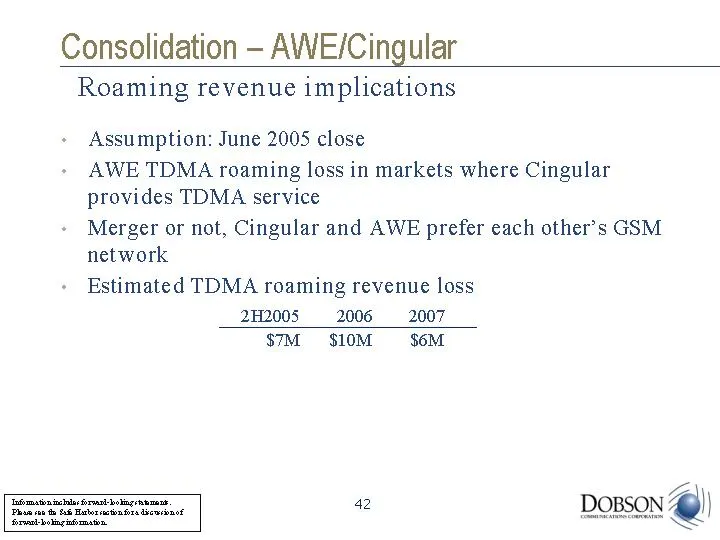
Consolidation - AWE/Cingular Assumption: June 2005 close AWE TDMA roaming loss in markets where Cingular provides TDMA service Merger or not, Cingular and AWE prefer each other's GSM network Estimated TDMA roaming revenue loss 2H2005 $7M 2006 $10M 2007 $6M Roaming revenue implications
Slide 43: Intentionally Left Blank
Intentionally Left Blank 4a
Slide 44: New additions to the Board of Directors
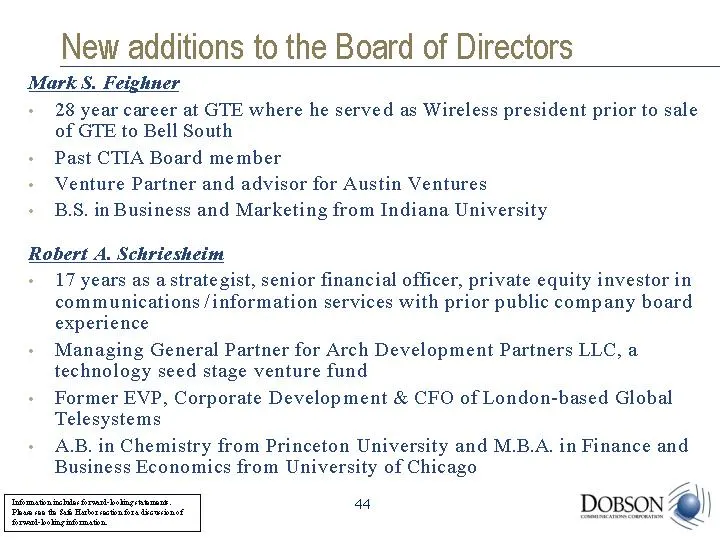
New additions to the Board of Directors Mark S. Feighner 28 year career at GTE where he served as Wireless president prior to sale of GTE to Bell South Past CTIA Board member Venture Partner and advisor for Austin Ventures B.S. in Business and Marketing from Indiana University Robert A. Schriesheim
Slide 45: Corporate governance
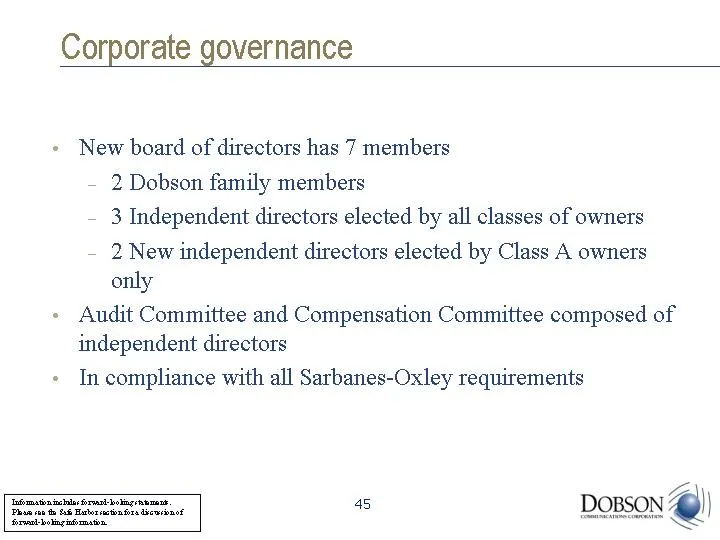
Corporate governance New board of directors has 7 members 2 Dobson family members 3 Independent directors elected by all classes of owners 2 New independent directors elected by Class A owners only Audit Committee and Compensation Committee composed of independent directors In compliance with all Sa
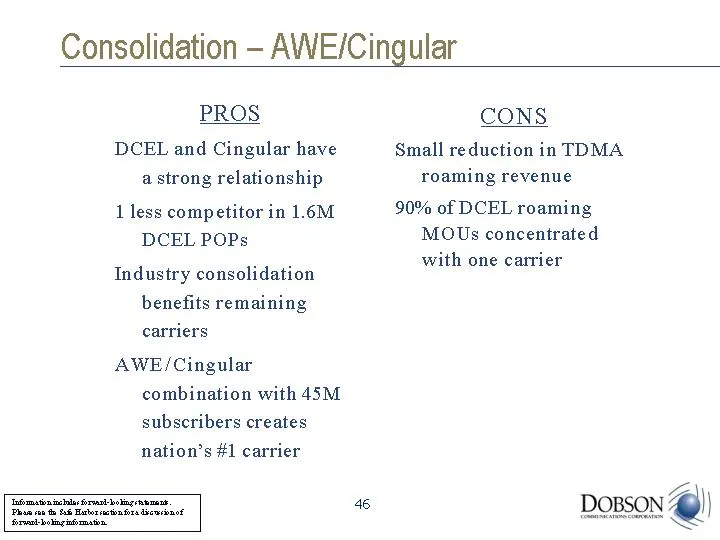
Slide 46: Consolidation - AWE/Cingular pros and cons
Consolidation - AWE/Cingular PROS DCEL and Cingular have a strong relationship 1 less competitor in 1.6M DCEL POPs Industry consolidation benefits remaining carriers AWE/Cingular combination with 45M subscribers creates nation's #1 carrier CONS Small reduction in TDMA roaming revenue 90% of DCEL roa
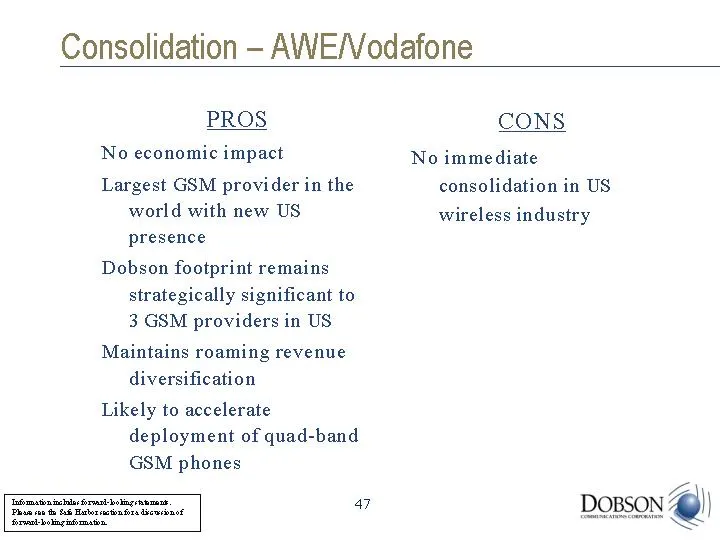
Slide 47: Consolidation - AWE/Vodafone
Consolidation - AWE/Vodafone PROS No economic impact Largest GSM provider in the world with new US presence Dobson footprint remains strategically significant to 3 GSM providers in US Maintains roaming revenue diversification Likely to accelerate deployment of quad-band GSM phones CONS No immediate
Slide 48: Consolidation pros and cons
PROS No discernable economic impact Industry consolidation One less competitor over 2.0M POPs CONS Clouds the technology evolution path for AWE for merged company Intentionally Left Blank
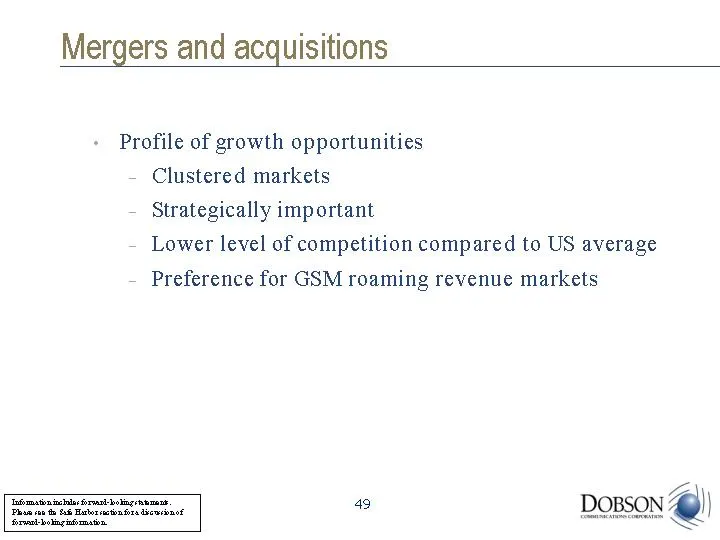
Slide 49: Mergers and acquisitions
Mergers and acquisitions Profile of growth opportunities Clustered markets Strategically important Lower level of competition compared to US average Preference for GSM roaming revenue markets
Slide 50: Dobson Communications: 2004 to 2008
Dobson Communications: 2004 to 2008 Grow subscribers within top 1/3 of industry average Grow ARPU towards midpoint of industry average Continue to improve customer profitability Continue to improve roaming revenue risk profile Continue to improve balance sheet Grow free cash flow
Slide 51: Timothy J. Duffy, Chief Technical Officer
Timothy J. Duffy Chief Technical Officer Senior Vice President Dobson Communications
Slide 52: 2003 Site growth
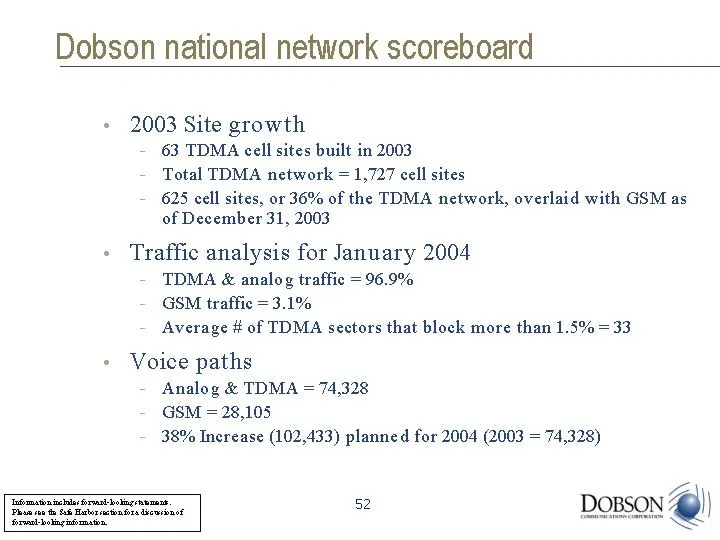
2003 Site growth 63 TDMA cell sites built in 2003 Total TDMA network = 1,727 cell sites 625 cell sites, or 36% of the TDMA network, overlaid with GSM as of December 31, 2003 Traffic analysis for January 2004 TDMA & analog traffic = 96.9% GSM traffic = 3.1% Average # of TDMA sectors that block more t
Slide 53: What is coverage?
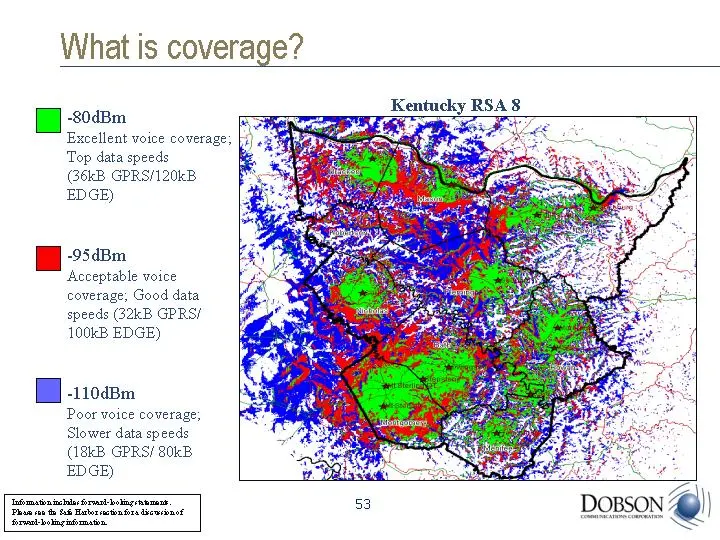
What is coverage? - -80dBm Excellent voice coverage; Top data speeds (36kB GPRS/120kB EDGE) - -95dBm Acceptable voice coverage; Good data speeds (32kB GPRS/ 100kB EDGE) - -110dBm Poor voice coverage; Slower data speeds (18kB GPRS/ 80kB EDGE) Kentucky RSA 8
Slide 54: Competitive network - superior quality
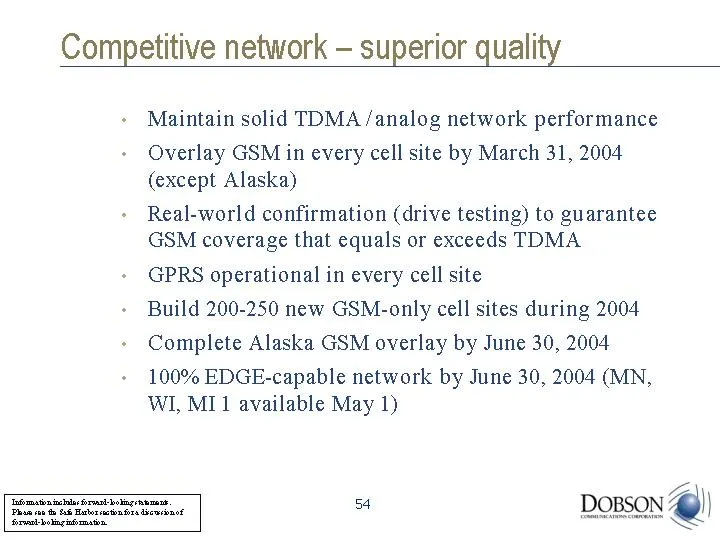
Competitive network - superior quality Maintain solid TDMA/analog network performance Overlay GSM in every cell site by March 31, 2004 (except Alaska) Real-world confirmation (drive testing) to guarantee GSM coverage that equals or exceeds TDMA GPRS operational in every cell site Build 200-250 new G
Slide 55: GSM vs. TDMA capital expense
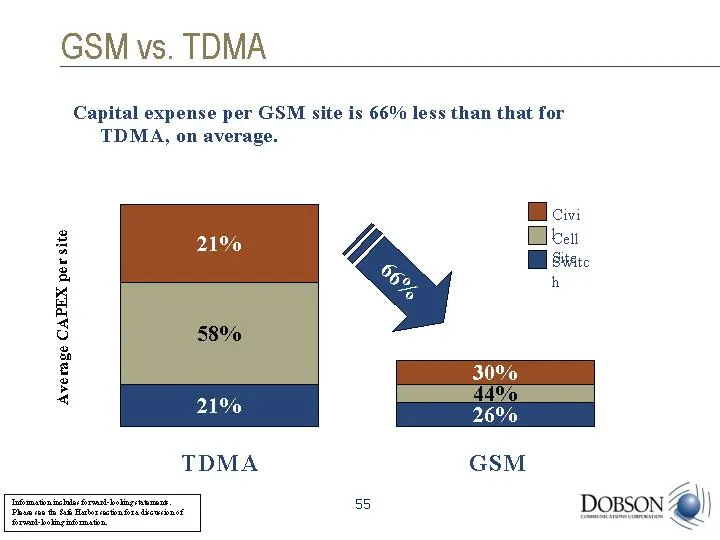
GSM vs. TDMA Capital expense per GSM site is 66% less than that for TDMA, on average. 21% 58% 21% TDMA 44% 26% 30% GSM 66% Average CAPEX per site Civi l Cell Site Switc h
Slide 56: GSM vs. TDMA operating expense
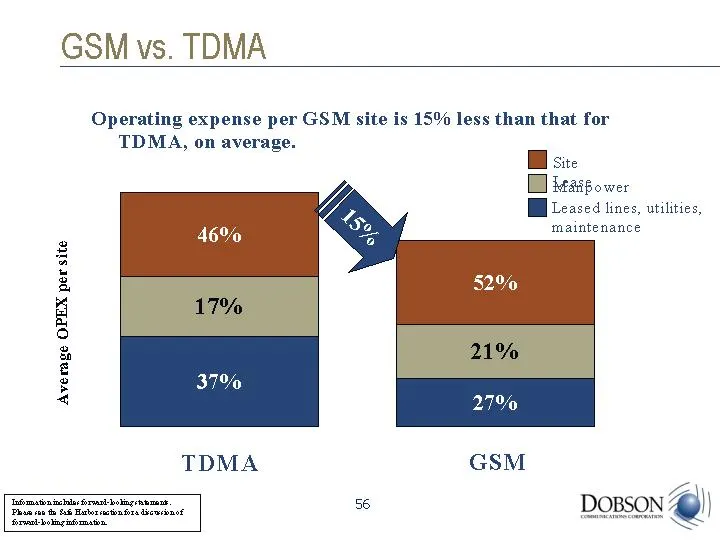
GSM vs. TDMA 46% 17% 37% TDMA 21% 27% 52% GSM 15% Average OPEX per site Site Lease Manpower Leased lines, utilities, maintenance Operating expense per GSM site is 15% less than that for TDMA, on average.
Slide 57: 200-250 new GSM-only sites
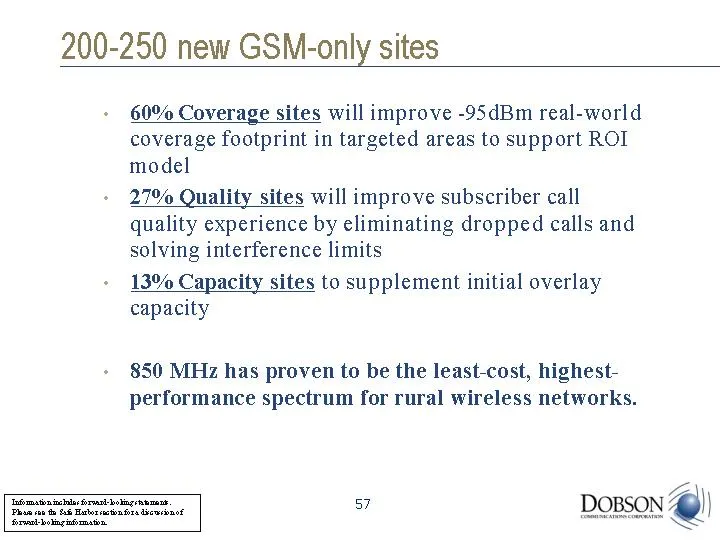
200-250 new GSM-only sites 60% Coverage sites will improve -95dBm real-world coverage footprint in targeted areas to support ROI model 27% Quality sites will improve subscriber call quality experience by eliminating dropped calls and solving interference limits 13% Capacity sites to supplement initi
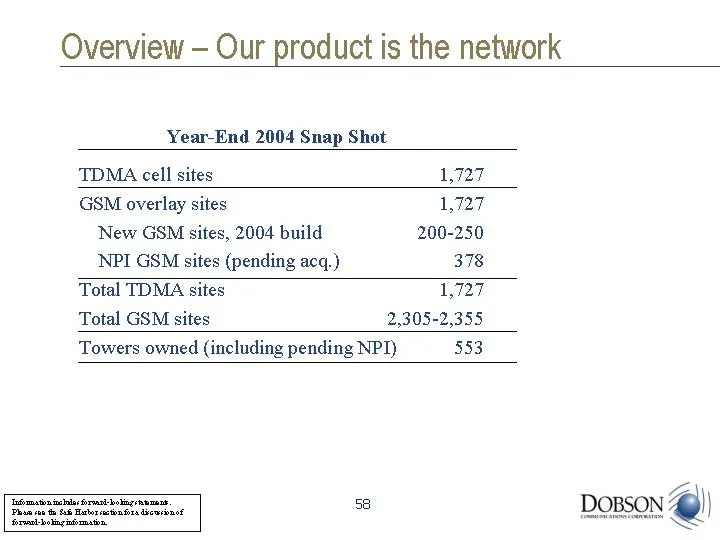
Slide 58: Overview - Our product is the network
Overview - Our product is the network Year-End 2004 Snap Shot TDMA cell sites 1,727 GSM overlay sites 1,727 New GSM sites, 2004 build 200-250 NPI GSM sites (pending acq.) 378 Total TDMA sites 1,727 Total GSM sites 2,305-2,355 Towers owned (including pending NPI) 553
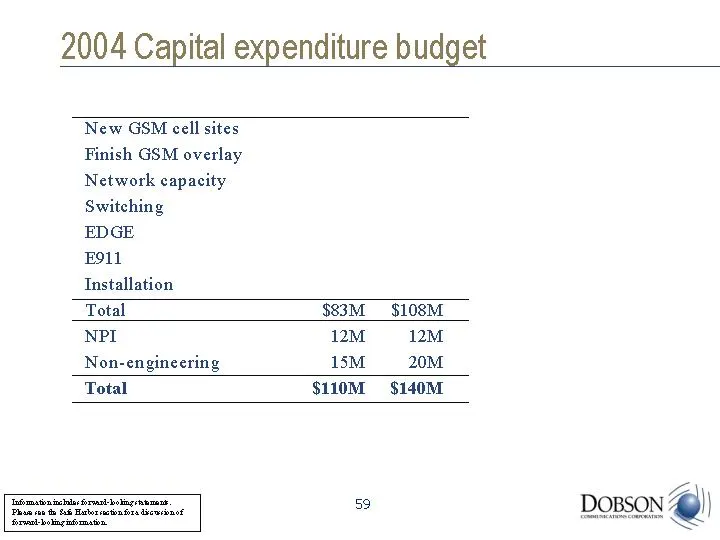
Slide 59: 2004 Capital expenditure budget
2004 Capital expenditure budget New GSM cell sites Finish GSM overlay Network capacity Switching EDGE E911 Installation Total NPI Non-engineering Total $83M 12M 15M $110M $108M 12M 20M $140M
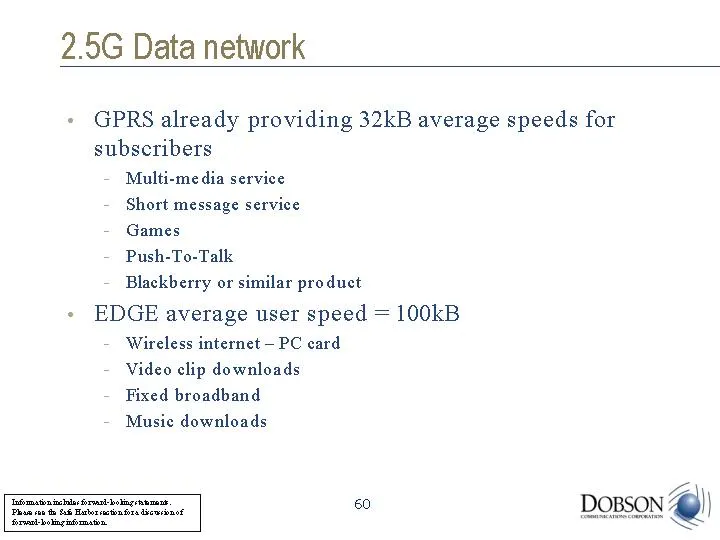
Slide 60: 2.5G Data network
2.5G Data network GPRS already providing 32kB average speeds for subscribers Multi-media service Short message service Games Push-To-Talk Blackberry or similar product EDGE average user speed = 100kB Wireless internet - PC card Video clip downloads Fixed broadband Music downloads
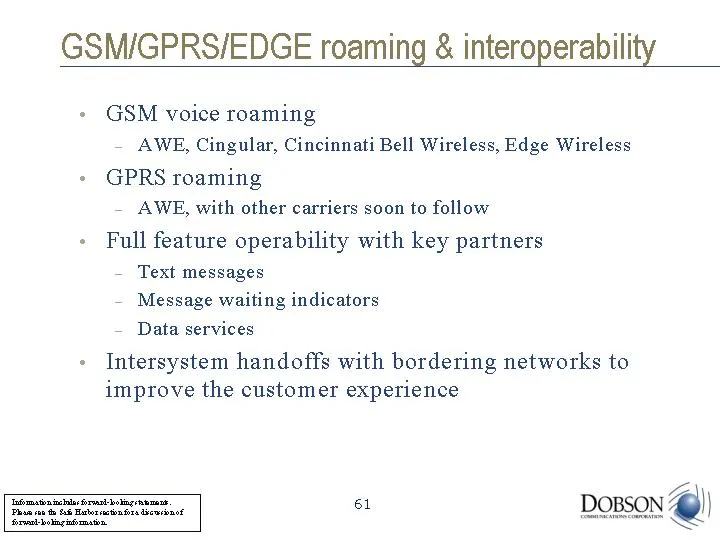
Slide 61: GSM/GPRS/EDGE roaming & interoperability
GSM/GPRS/EDGE roaming & interoperability GSM voice roaming AWE, Cingular, Cincinnati Bell Wireless, Edge Wireless GPRS roaming AWE, with other carriers soon to follow Full feature operability with key partners Text messages Message waiting indicators Data services Intersystem handoffs with bordering
Slide 62: Key Initiatives - Alaska
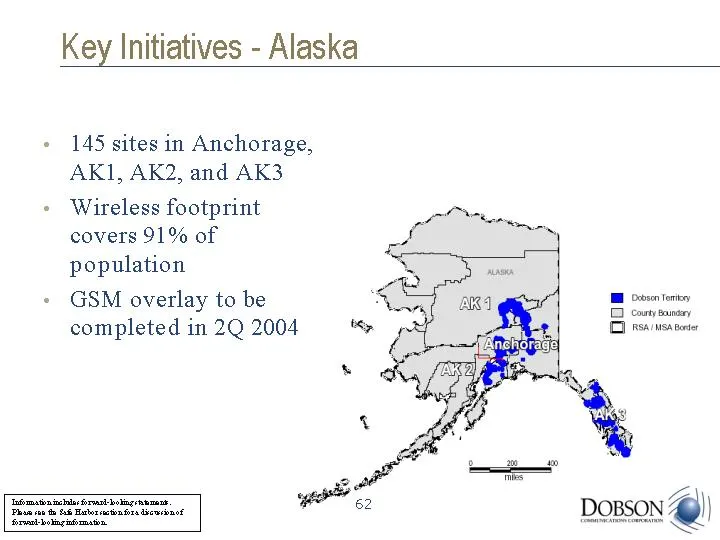
Key Initiatives - Alaska 145 sites in Anchorage, AK1, AK2, and AK3 Wireless footprint covers 91% of population GSM overlay to be completed in 2Q 2004 62
Slide 63: Key Initiatives - NPI
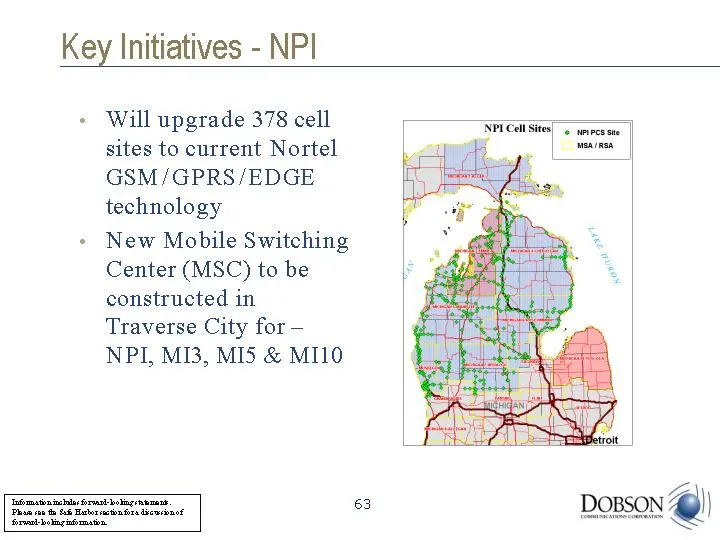
Will upgrade 378 cell sites to current Nortel GSM/GPRS/EDGE technology New Mobile Switching Center (MSC) to be constructed in Traverse City for - NPI, MI3, MI5 & MI10 Key Initiatives - NPI
Slide 64: Push-To-Talk
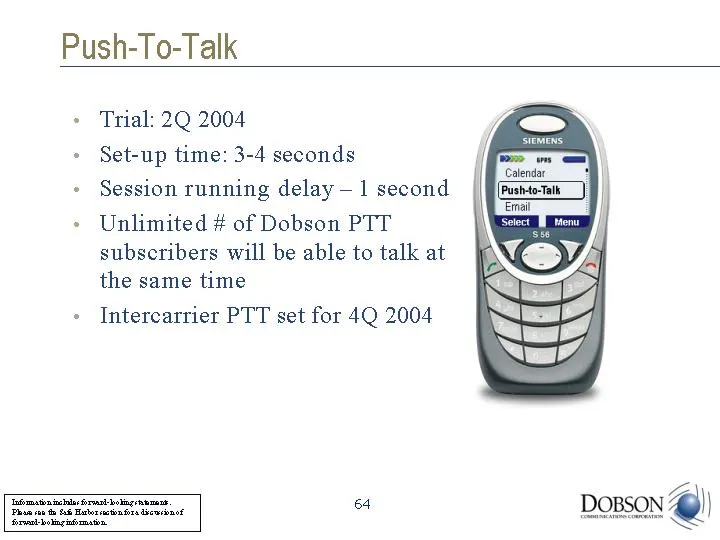
Trial: 2Q 2004 Set-up time: 3-4 seconds Session running delay - 1 second Unlimited # of Dobson PTT subscribers will be able to talk at the same time Intercarrier PTT set for 4Q 2004 Push-To-Talk
Slide 65: What About 3G?
What About 3G? Monitoring carriers and partners May participate in future trials to stay current with technology and equipment Plan to deploy 3G only in response to market demand 3G upgrade would re-use portions of current GSM switching platforms
Slide 66: Doug Stephens, Chief Operating Officer
Dobson Communications Doug Stephens Chief Operating Officer
Slide 67: Wireless growth
Wireless growth Expected 2004 growth of 15M subscribers in the U.S. Approx. 5.1% penetration increase Dobson markets are less penetrated than industry average (35%-40% vs. 55%) We have less competition (4.0 service providers vs. 6.5 industrywide) Dobson positioned to get our fair share
Slide 68: 2004 key objectives
2004 key objectives Launch GSM/GPRS/EDGE Maintain low churn - under 2% postpaid Increase postpaid/prepaid gross adds 12%- 15% over 398K 2003 gross adds Increase ARPU $1.25 - $1.75
Slide 69: GSM launch - Critical achievements to date
GSM launch - Critical achievements to date Network build-out Primarily 850 MHz -- better coverage, fewer towers Network validated and optimized prior to launch Footprint Roaming partners: AWE, Cingular, T-Mobile USA, Cincinnati Bell, Centennial, Highland Cellular & Corr Wireless Comm. Billing and po
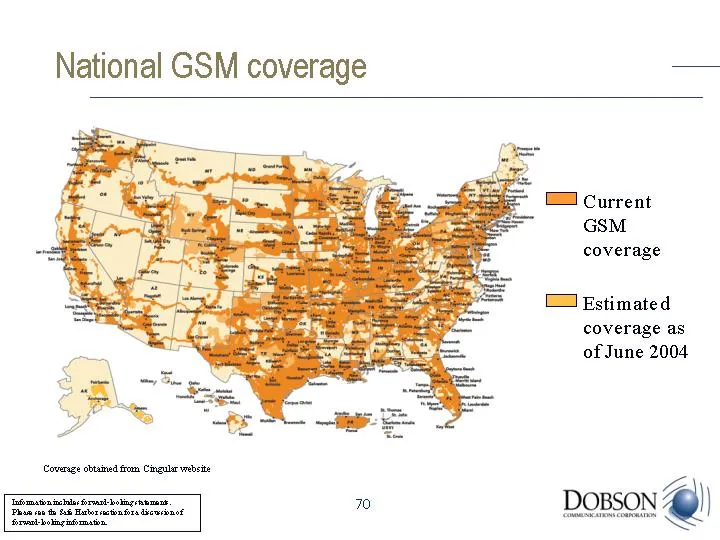
Slide 70: National GSM coverage
National GSM coverage Estimated coverage as of June 2004 Current GSM coverage Coverage obtained from Cingular website
Slide 71: Maintain low churn
Maintain low churn Superior customer service Superior network Competitive products GSM Handsets Data Competitive rate plans Subs under contract 2004 65% of our customers are currently under contract with an average of 12.3 months remaining Aggressive "save" campaigns
Slide 72: Market research
Market research Profiling using a nationally compiled database Counts based on targetable households from a 180M-household database Markets based on Dobson customer zip codes
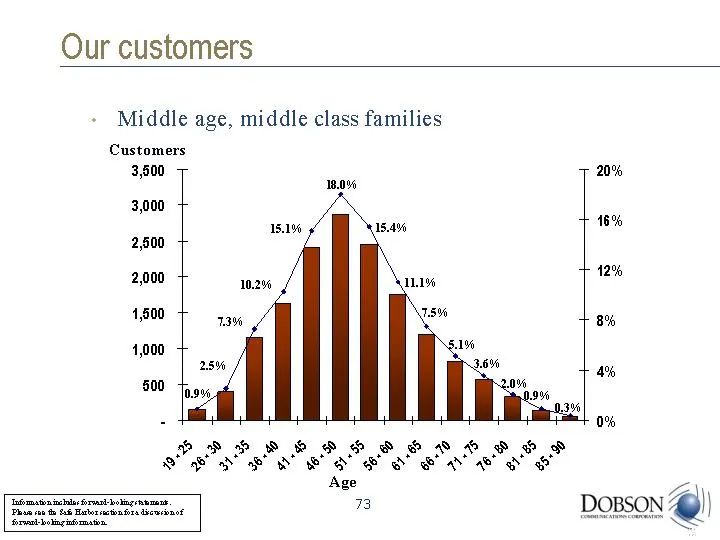
Slide 73: Our customers
Our customers Middle age, middle class families Customers Age
Slide 74: Opportunity customer segments - Maintain
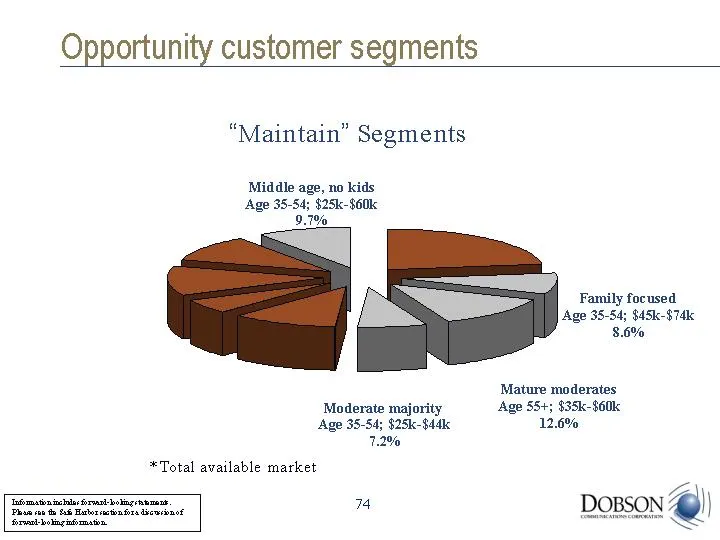
Opportunity customer segments "Maintain" Segments Middle age, no kids Age 35-54; $25k-$60k 9.7% Moderate majority Age 35-54; $25k-$44k 7.2% Mature moderates Age 55+; $35k-$60k 12.6% Family focused Age 35-54; $45k-$74k 8.6% * Total available market
Slide 75: Opportunity customer segments - Growth
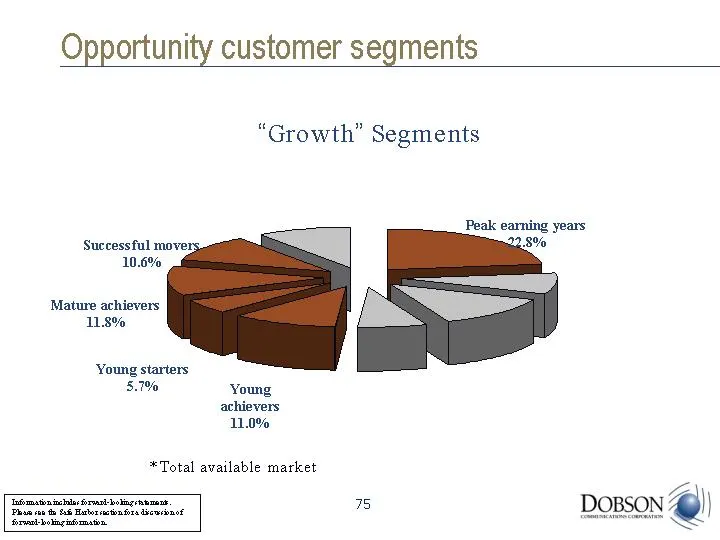
Opportunity customer segments "Growth" Segments Successful movers 10.6% Peak earning years 22.8% Mature achievers 11.8% Young starters 5.7% Young achievers 11.0% * Total available market
Slide 76: Young customers
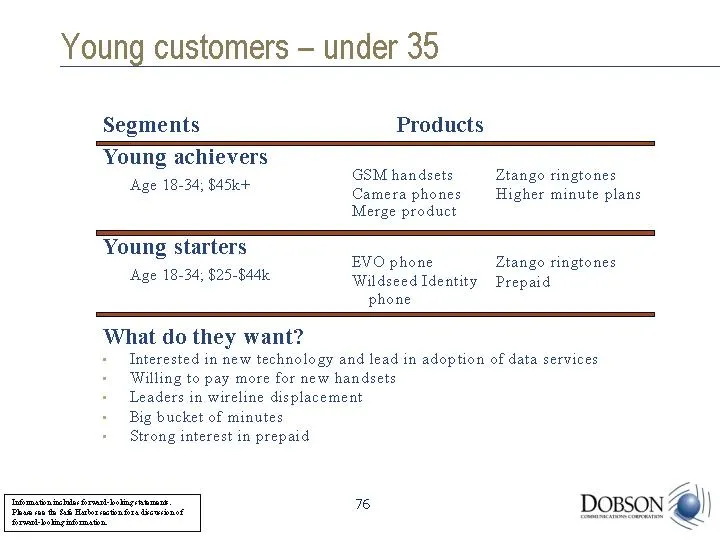
Young customers - under 35 Segments Young achievers Age 18-34; $45k+ Products GSM handsets Camera phones Merge product Ztango ringtones Higher minute plans Young starters Age 18-34; $25-$44k EVO phone Wildseed Identity phone Ztango ringtones Prepaid What do they want? Interested in new technology an
Slide 77: Target: Youth - Wildseed Identity handset
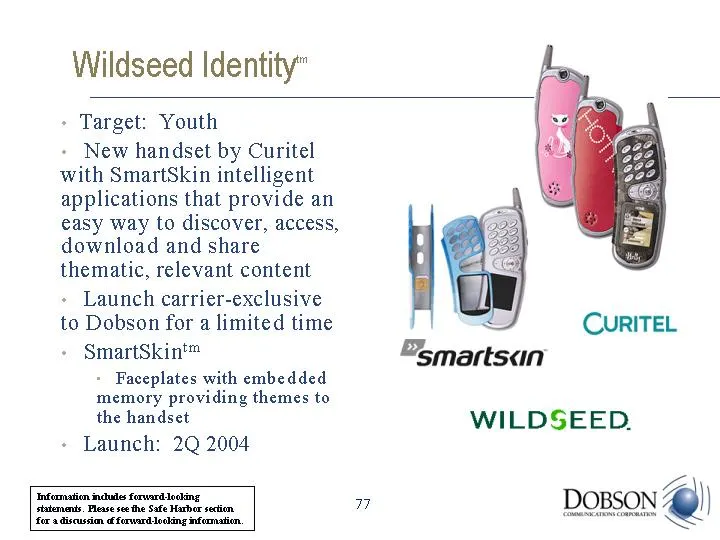
Target: Youth New handset by Curitel with SmartSkin intelligent applications that provide an easy way to discover, access, download and share thematic, relevant content Launch carrier-exclusive to Dobson for a limited time SmartSkintm Faceplates with embedded memory providing themes to the handset L
Slide 78: Target: Youth - EVO Phone
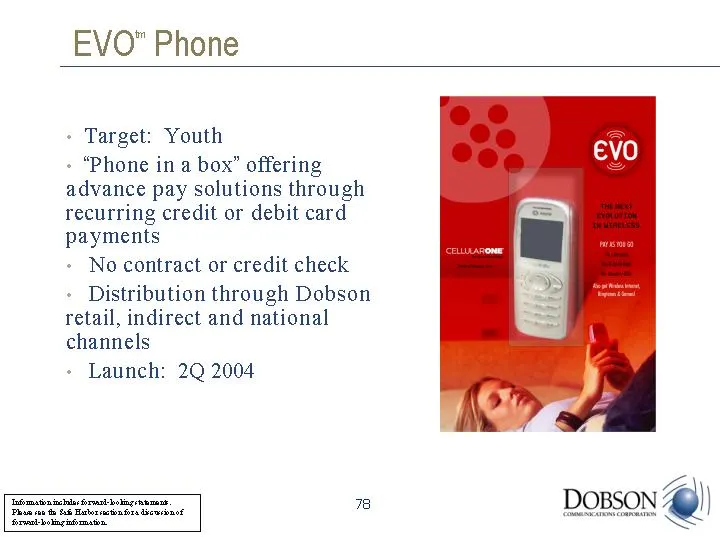
Target: Youth "Phone in a box" offering advance pay solutions through recurring credit or debit card payments No contract or credit check Distribution through Dobson retail, indirect and national channels Launch: 2Q 2004 EVOtm Phone
Slide 79: Prepaid -- Simply Speaking
Prepaid -- Simply Speaking Current TDMA offer Cost: $99 Includes handset and $30 airtime credit 8% of 2003 gross adds $25 ARPU GSM/GPRS offer Scheduled launch June 1, 2004 Cost: $89 (est.) Includes handset and $10 airtime credit Projected to be 10% of 2004 gross adds $29 ARPU (est.)
Slide 80: Target: Youth - Ztango
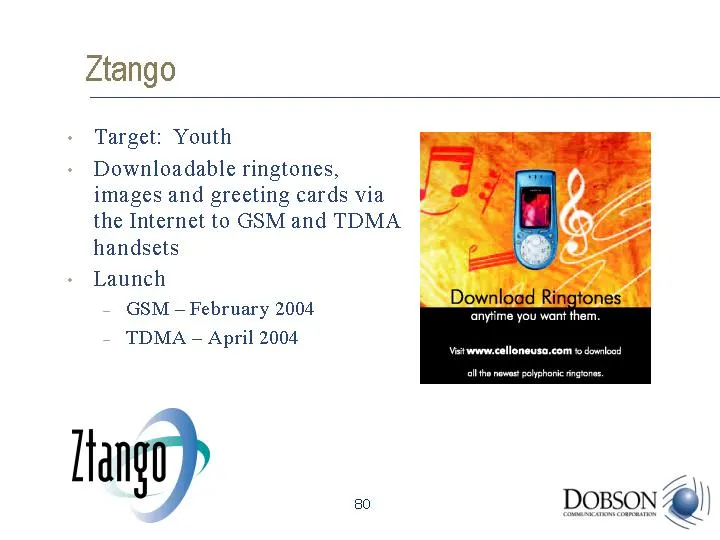
Target: Youth Downloadable ringtones, images and greeting cards via the Internet to GSM and TDMA handsets Launch GSM - February 2004 TDMA - April 2004 Ztango 159
Slide 81: Target: Landline replacement - Merge
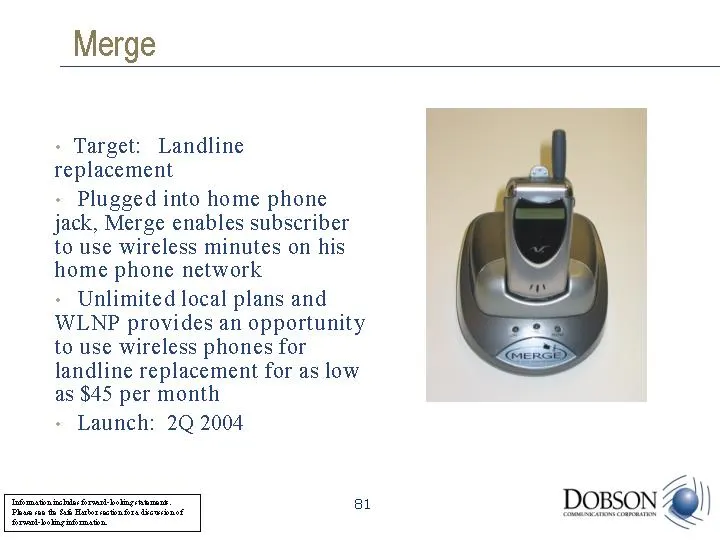
Target: Landline replacement Plugged into home phone jack, Merge enables subscriber to use wireless minutes on his home phone network Unlimited local plans and WLNP provides an opportunity to use wireless phones for landline replacement for as low as $45 per month Launch: 2Q 2004 Merge 161
Slide 82: Higher income customers
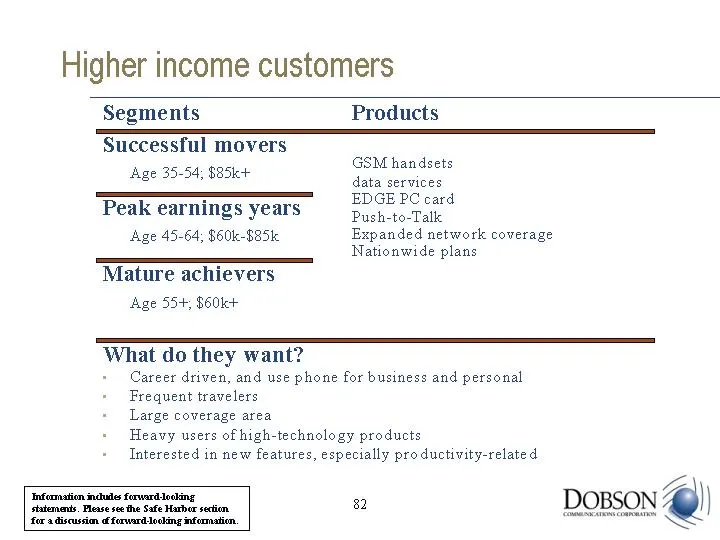
Higher income customers Segments Successful movers Age 35-54; $85k+ Products GSM handsets data services EDGE PC card Push-to-Talk Expanded network coverage Nationwide plans Peak earnings years Age 45-64; $60k-$85k What do they want? Career driven, and use phone for business and personal Frequent tra

Slide 83: Intentionally Left Blank
Intentionally Left Blank Tnfurmatin nudes ferwardlocking ‘statemens. Please see the Safe Harbor section 83 fer a decussin of forward loking ifermatin.
Slide 84: Wireless Internet - current GPRS offering
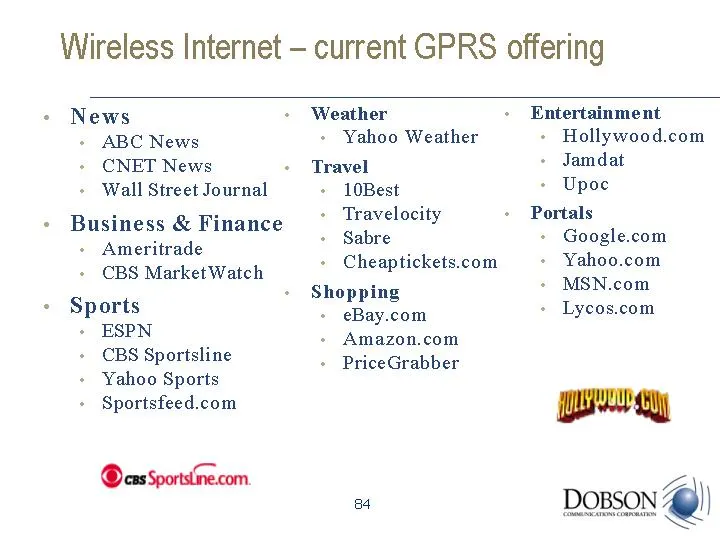
Wireless Internet - current GPRS offering News ABC News CNET News Wall Street Journal Business & Finance Ameritrade CBS MarketWatch Sports ESPN CBS Sportsline Yahoo Sports Sportsfeed.com Weather Yahoo Weather Travel 10Best Travelocity Sabre Cheaptickets.com Shopping eBay.com Amazon.com PriceGrabber
Slide 85: EDGE PC cards
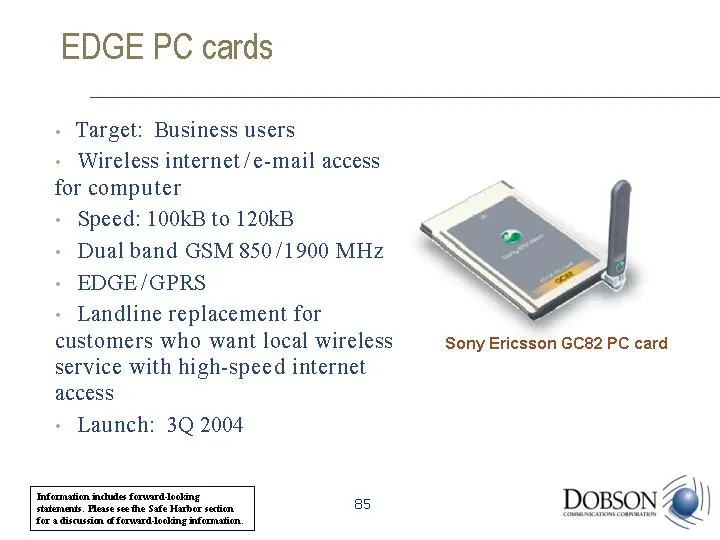
EDGE PC cards Target: Business users Wireless internet/e-mail access for computer Speed: 100kB to 120kB Dual band GSM 850/1900 MHz EDGE/GPRS Landline replacement for customers who want local wireless service with high-speed internet access Launch: 3Q 2004 Sony Ericsson GC82 PC card 169 Information i
Slide 86: Push-to-Talk
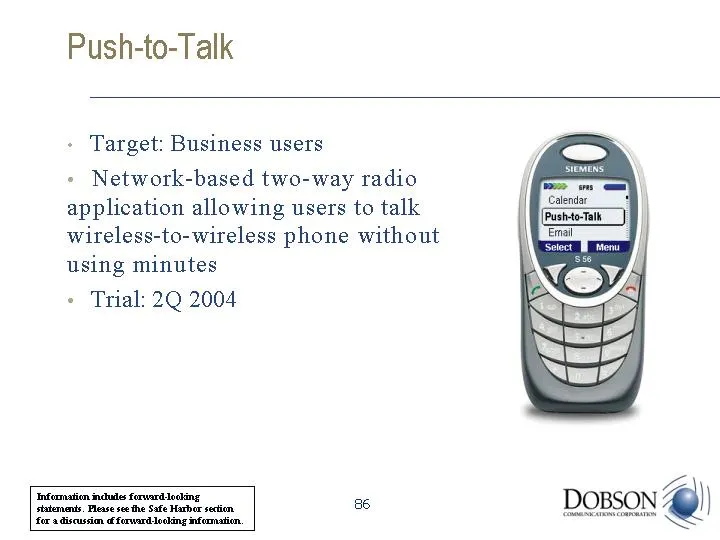
Push-to-Talk Target: Business users Network-based two-way radio application allowing users to talk wireless-to-wireless phone without using minutes Trial: 2Q 2004 171 Information includes forward-looking statements. Please see the Safe Harbor section for a discussion of forward-looking information.
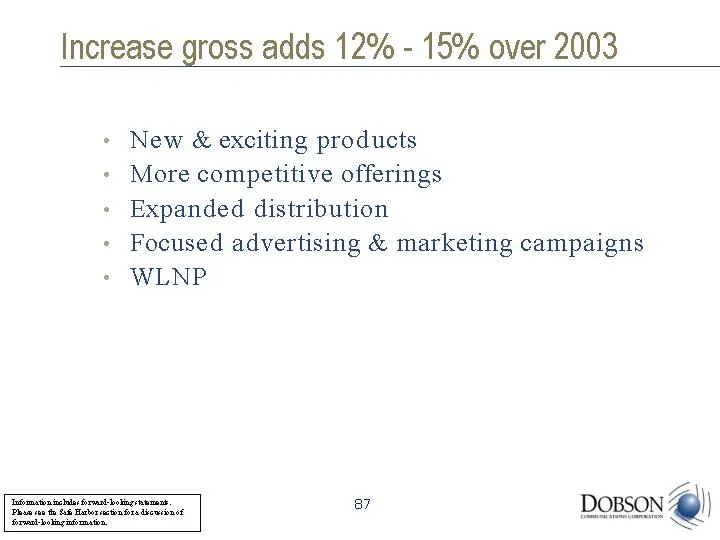
Slide 87: Increase gross adds
Increase gross adds 12% - 15% over 2003 New & exciting products More competitive offerings Expanded distribution Focused advertising & marketing campaigns WLNP
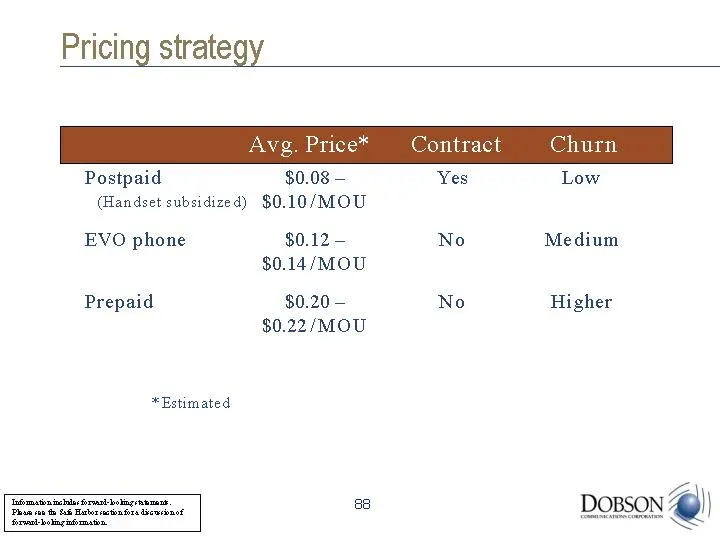
Slide 88: Pricing strategy
Pricing strategy Avg. Price* Contract Churn (Handset subsidized) $0.08 - $0.10/MOU $0.12 - $0.14/MOU $0.20 - $0.22/MOU Postpaid EVO phone Prepaid Yes No No Low Medium Higher Yes No No * Estimated
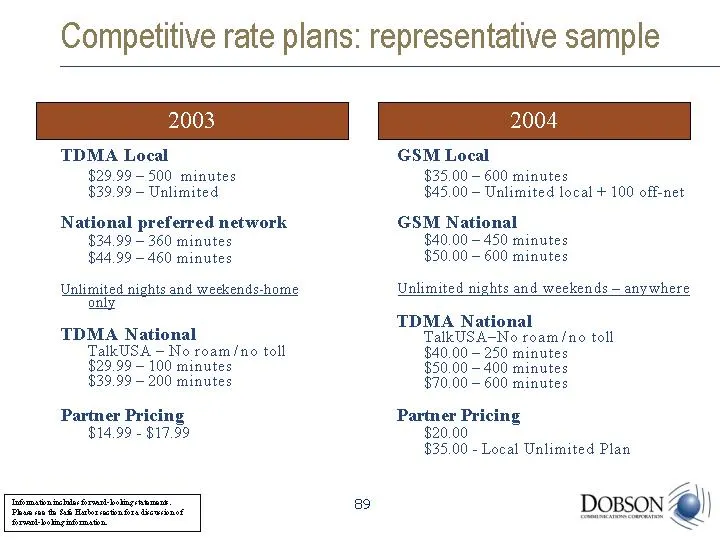
Slide 89: Competitive rate plans: representative sample
Competitive rate plans: representative sample TDMA Local $29.99 - 500 minutes $39.99 - Unlimited National preferred network $34.99 - 360 minutes $44.99 - 460 minutes Unlimited nights and weekends-home only TDMA National TalkUSA - No roam/no toll $29.99 - 100 minutes $39.99 - 200 minutes Partner Pric
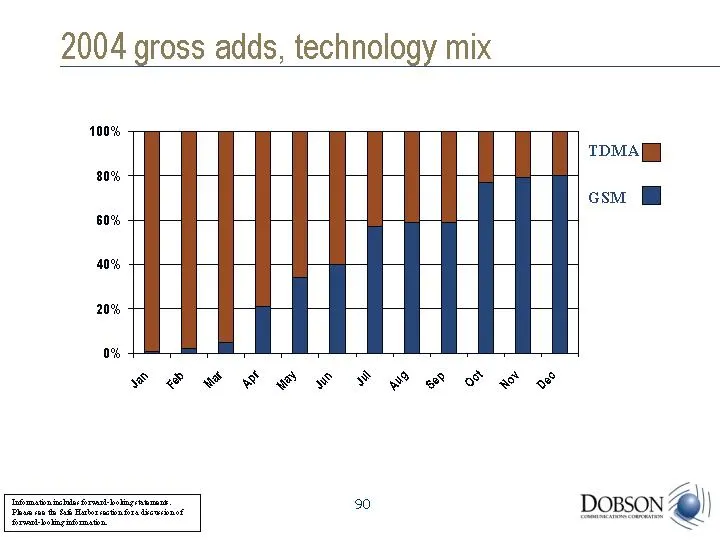
Slide 90: 2004 gross adds, technology mix
2004 gross adds, technology mix Jan Feb Mar Apr May Jun Jul Aug Sep Oct Nov Dec GSM 0.01 0.02 0.05 0.21 0.34 0.4 0.57 0.59 0.59 0.77 0.79 0.8 West 0.99 0.98 0.95 0.79 0.66 0.6 0.43 0.41 0.41 0.23 0.21 0.2 TDMA GSM
Slide 91: Distribution channels
Distribution channels Retail Direct Agent 2003 228 108 599 Added 2004 27 20 40* EVO Phone x x Prepaid x x mMode x x x EDGE PC card x x x Push to Talk x x x Merge x x Expanded Distribution Natl. retail EVO phone Total dist. 74 50* 211 x x x x x x 935 * Estimated
Slide 92: AT&T national account program
AT&T national account program December 2003 launch Dobson and AT&T Wireless are leveraging their networks to benefit corporate customers Typically higher-ARPU, lower-churn customers Consolidated billing is handled by AT&T Wireless
Slide 93: Acquisition cost
Acquisition cost 2004 CPGA in line with 2003 (approx. $328 per add) Increased equipment subsidy and advertising... Off-set by increased gross adds, which should reduce fixed cost per add
Slide 94: WLNP
WLNP Limited gross add and churn impact so far Preparing for May 2004 deadline New technology New products New rates Increased distribution Incremental advertising Targeted advertising behind WLNP Opportunity to increase gross adds with wireless and wireline port-ins
Slide 95: Advertising and marketing strategies
Advertising and marketing strategies 21% increase in media spend Higher concentration on television More cable More primetime Increased weekly frequency in radio and television Print: Enhanced ad sizes and more color
Slide 96: Key customer needs
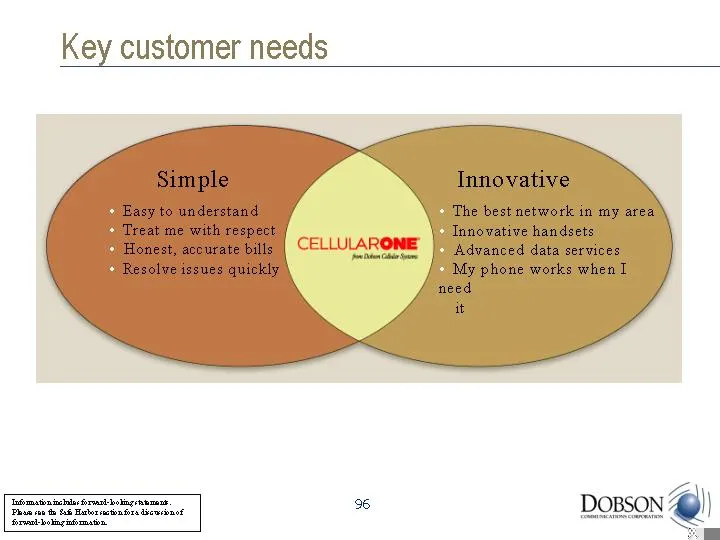
Key customer needs Simple Innovative Easy to understand Treat me with respect Honest, accurate bills Resolve issues quickly The best network in my area Innovative handsets Advanced data services My phone works when I need it
Slide 97: Key marketing initiatives
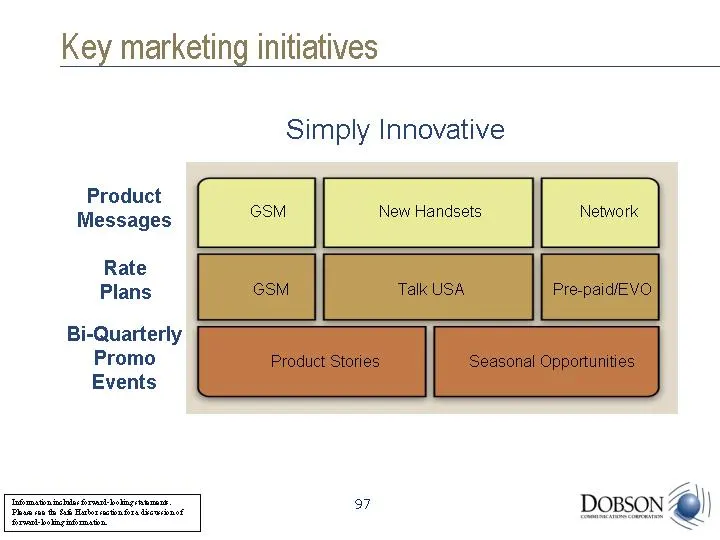
Key marketing initiatives Key marketing initiatives GSM New Handsets Network Talk USA GSM Pre-paid/EVO Seasonal Opportunities Product Stories Rate Plans Product Messages Bi-Quarterly Promo Events Simply Innovative
Slide 98: Joe Nemecheck NASCAR sponsorship
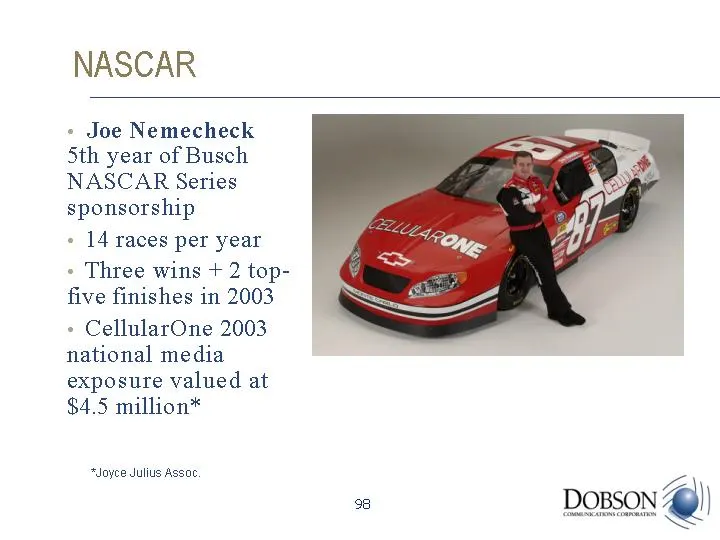
Joe Nemecheck 5th year of Busch NASCAR Series sponsorship 14 races per year Three wins + 2 top- five finishes in 2003 CellularOne 2003 national media exposure valued at $4.5 million* NASCAR *Joyce Julius Assoc. 195
Slide 99: Objective: Increase ARPU by $1.25 - $1.75
Objective: Increase ARPU by $1.25 - $1.75 GSM targeted for 80% of gross adds by December 2004 Data sales Ringtones Roadside assistance & handset insurance
Slide 100: ARPU comparison
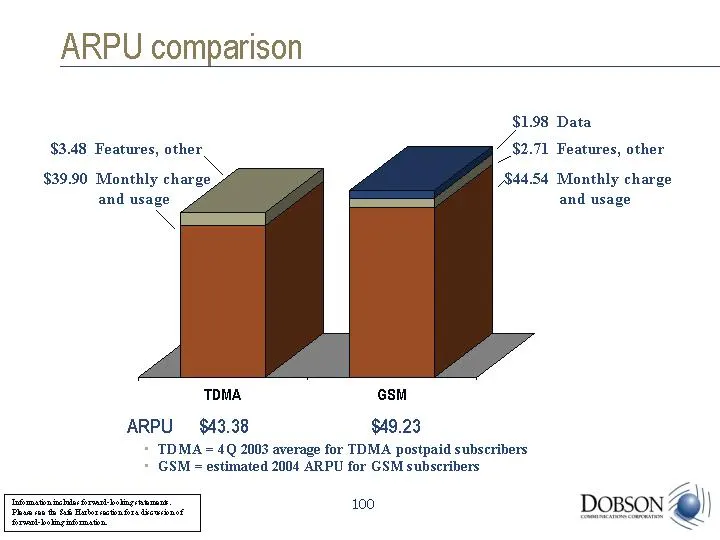
ARPU comparison TDMA GSM MRC 39.9 44.54 Features 3.48 2.71 Data 0 1.98 0 0 ARPU $43.38 $49.23 $1.98 Data $2.71 Features, other $44.54 Monthly charge and usage $3.48 Features, other $39.90 Monthly charge and usage TDMA = 4Q 2003 average for TDMA postpaid subscribers GSM = estimated 2004 ARPU for GSM
Slide 101: Bruce R. Knooihuizen, Chief Financial Officer
Dobson Communications Bruce R. Knooihuizen Chief Financial Officer
Slide 102: Focused on creating shareholder value
Focused on creating: Create an environment for sustainable growth at reasonable growth rates Shareholder Value
Slide 103: Goals of creating value
Goals of creating value Manage exposure to market risk Accelerate growth in business Continue to control costs and invest in margin enhancing technologies
Slide 104: Free cash flow as a measure of value
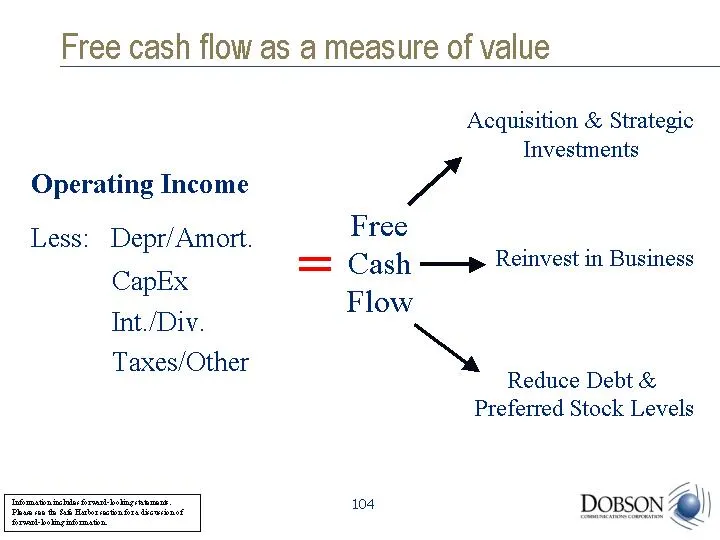
Free cash flow as a measure of value Operating Income Less: Depr/Amort. CapEx Int./Div. Taxes/Other Acquisition & Strategic Investments Reinvest in Business Reduce Debt & Preferred Stock Levels = Free Cash Flow
Slide 105: Local profits replace roaming profits
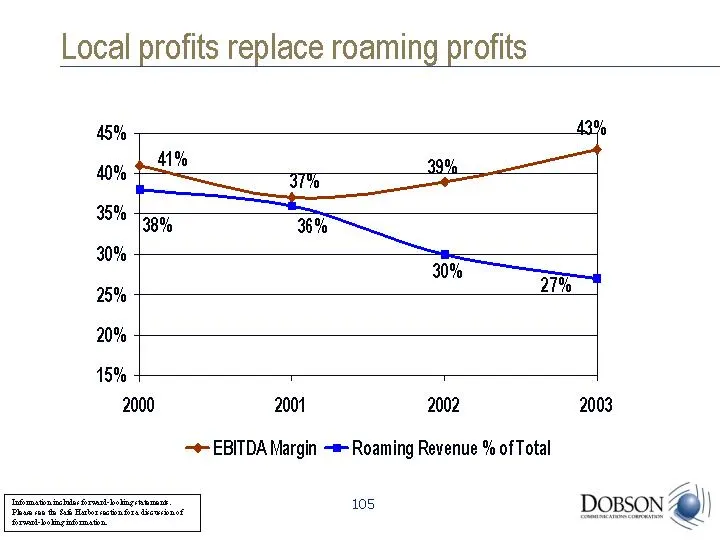
Local profits replace roaming profits 2000 2001 2002 2003 EBITDA Margin 0.41 0.37 0.39 0.43 Roaming Revenue % of Total 0.38 0.36 0.3 0.27
Slide 106: Expense components
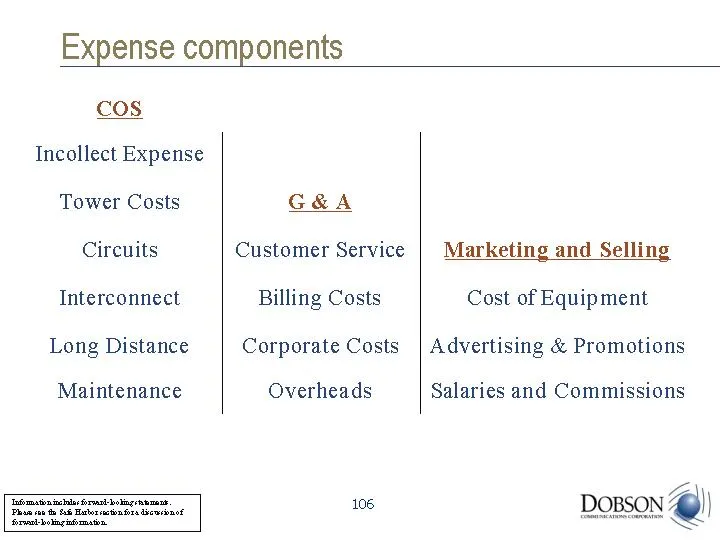
Expense components COS Incollect Expense Tower Costs G & A Circuits Customer Service Marketing and Selling Interconnect Billing Costs Cost of Equipment Long Distance Corporate Costs Advertising & Promotions Maintenance Overheads Salaries and Commissions
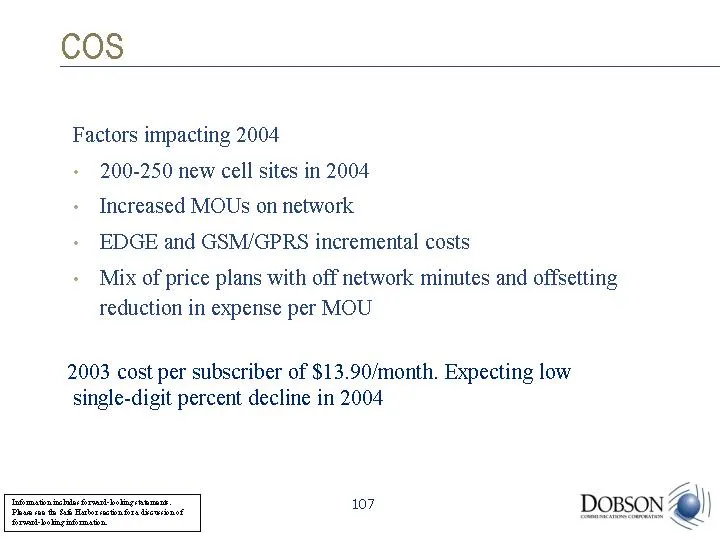
Slide 107: COS Factors impacting 2004
COS Factors impacting 2004 200-250 new cell sites in 2004 Increased MOUs on network EDGE and GSM/GPRS incremental costs Mix of price plans with off network minutes and offsetting reduction in expense per MOU 2003 cost per subscriber of $13.90/month. Expecting low single-digit percent decline in 2004
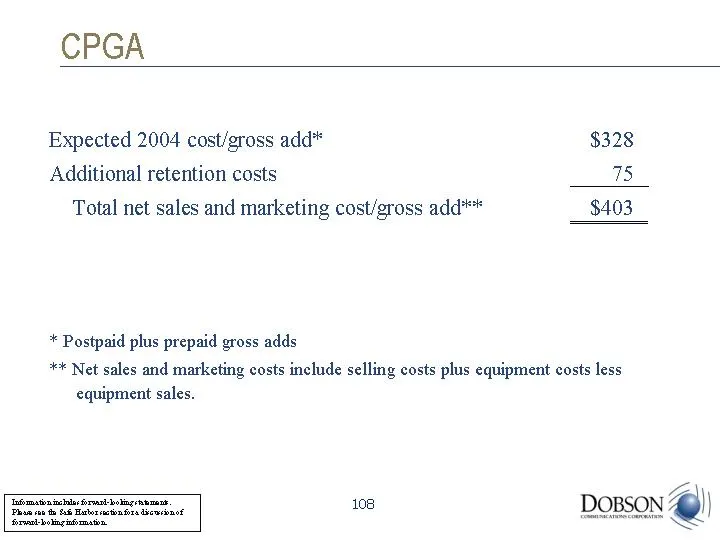
Slide 108: CPGA
CPGA Expected 2004 cost/gross add* $328 Additional retention costs 75 Total net sales and marketing cost/gross add** $403 * Postpaid plus prepaid gross adds ** Net sales and marketing costs include selling costs plus equipment costs less equipment sales.
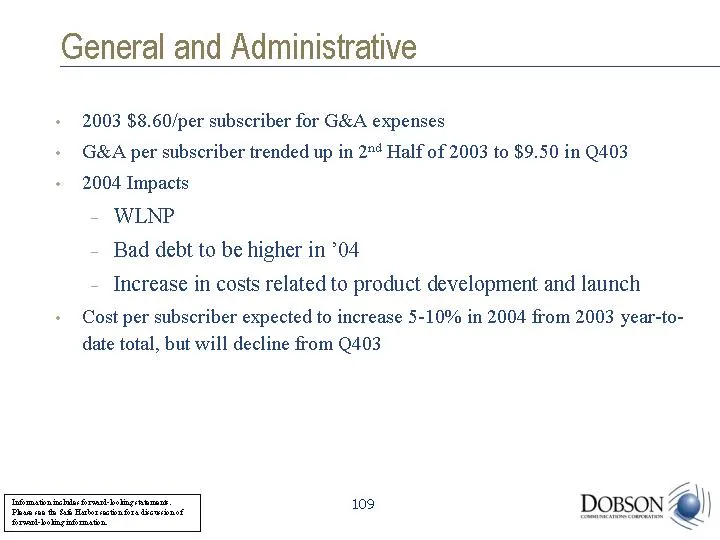
Slide 109: General and Administrative
General and Administrative 2003 $8.60/per subscriber for G&A expenses G&A per subscriber trended up in 2nd Half of 2003 to $9.50 in Q403 2004 Impacts WLNP Bad debt to be higher in '04 Increase in costs related to product development and launch Cost per subscriber expected to increase 5-10% in 2004 f
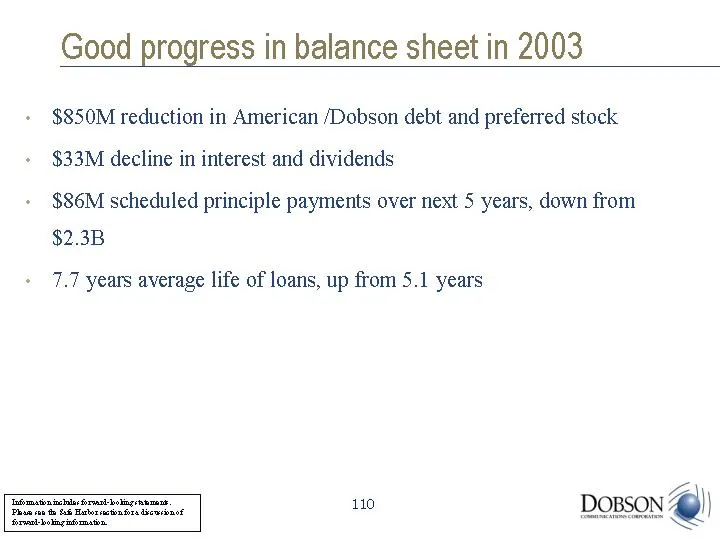
Slide 110: Good progress in balance sheet in 2003
Good progress in balance sheet in 2003 $850M reduction in American /Dobson debt and preferred stock $33M decline in interest and dividends $86M scheduled principle payments over next 5 years, down from $2.3B 7.7 years average life of loans, up from 5.1 years
Slide 111: Expect to continue improvements in 2004 and beyond
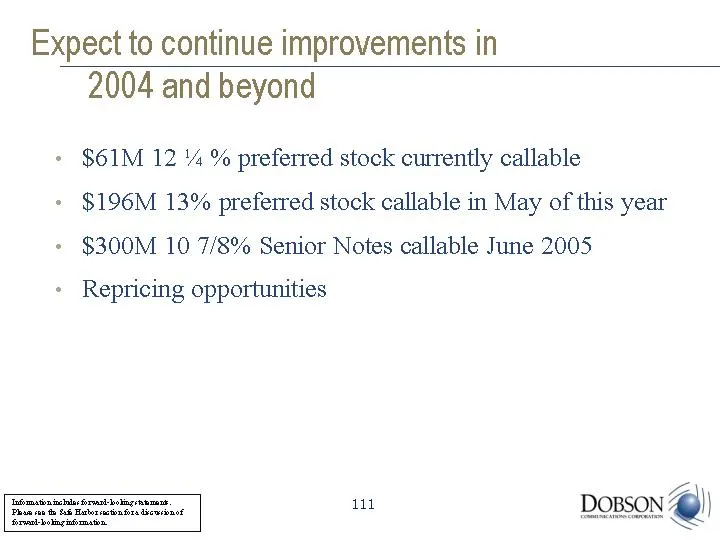
Expect to continue improvements in 2004 and beyond $61M 12 1/4 % preferred stock currently callable $196M 13% preferred stock callable in May of this year $300M 10 7/8% Senior Notes callable June 2005 Repricing opportunities
Slide 112: Cash Taxes
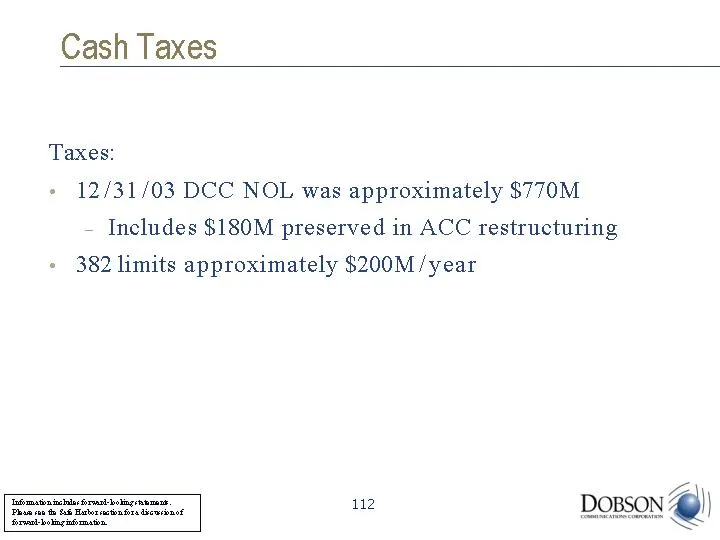
Cash Taxes Taxes: 12/31/03 DCC NOL was approximately $770M Includes $180M preserved in ACC restructuring 382 limits approximately $200M/year
Slide 113: 2004 Guidance
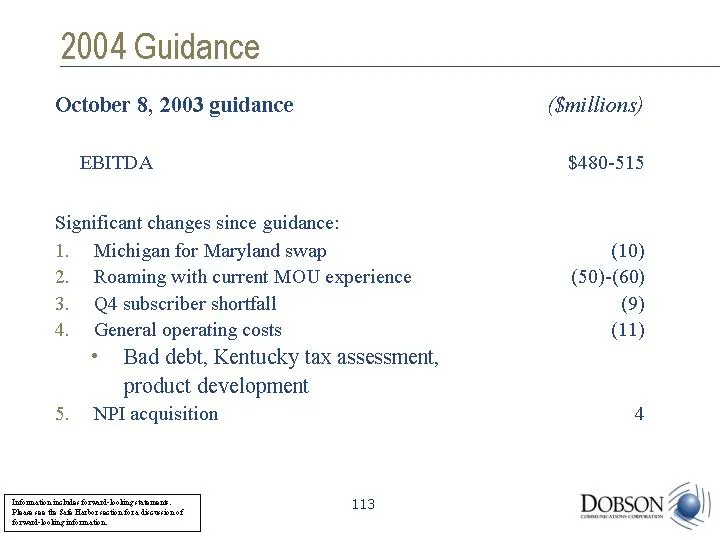
2004 Guidance October 8, 2003 guidance ($millions) EBITDA $480-515 Significant changes since guidance: Michigan for Maryland swap (10) Roaming with current MOU experience (50)-(60) Q4 subscriber shortfall (9) General operating costs (11) Bad debt, Kentucky tax assessment, product development NPI acq
Slide 114: Free Cash Flow Expectations
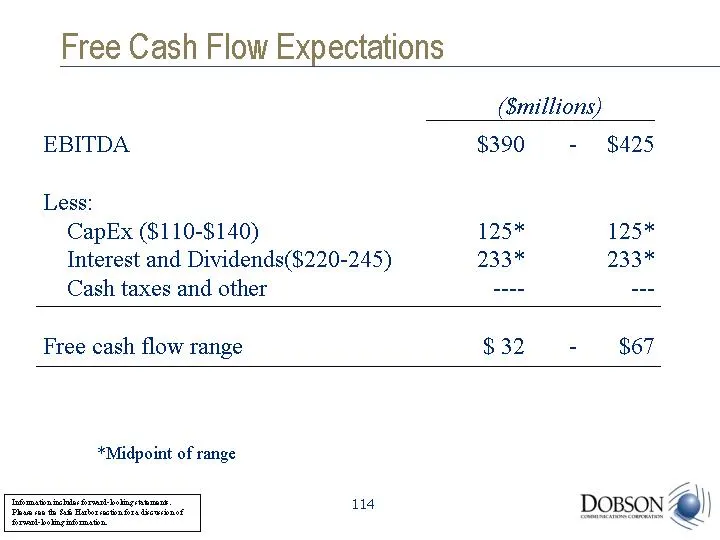
Free Cash Flow Expectations EBITDA $390 - $425 Less: CapEx ($110-$140) 125* 125* Interest and Dividends($220-245) 233* 233* Cash taxes and other ---- --- Free cash flow range $ 32 - $67 ($millions) *Midpoint of range
Slide 115: us DOBSON @))
L us DOBSON @))
Slide 116: Appendix
Appendix Dowson @ ))
Slide 117: 2002 pro forma adjustments
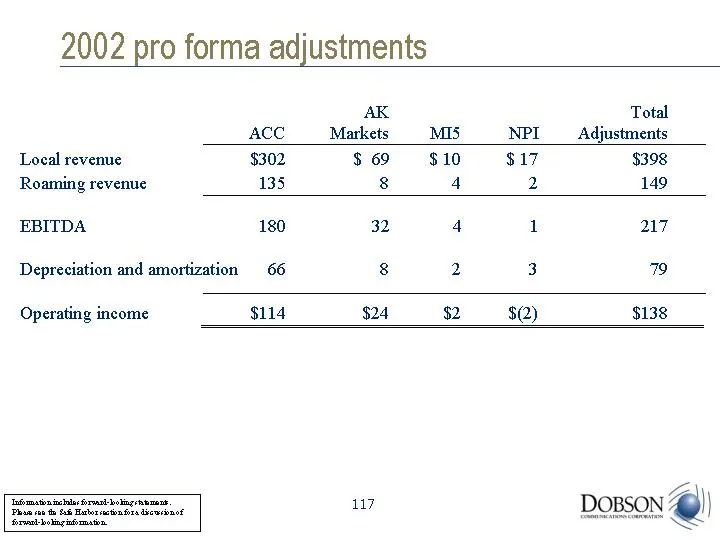
2002 pro forma adjustments AK Total ACC Markets MI5 NPI Adjustments Local revenue $302 $ 69 $ 10 $ 17 $398 Roaming revenue 135 8 4 2 149 EBITDA 180 32 4 1 217 Depreciation and amortization 66 8 2 3 79 Operating income $114 $24 $2 $(2) $138
Slide 118: 2003 pro forma adjustments
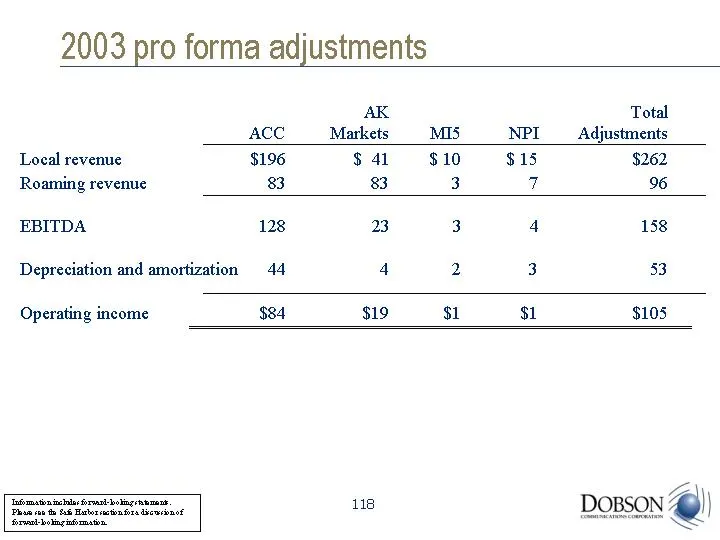
2003 pro forma adjustments AK Total ACC Markets MI5 NPI Adjustments Local revenue $196 $ 41 $ 10 $ 15 $262 Roaming revenue 83 83 3 7 96 EBITDA 128 23 3 4 158 Depreciation and amortization 44 4 2 3 53 Operating income $84 $19 $1 $1 $105
Slide 119: Pro forma adjustments - ACC
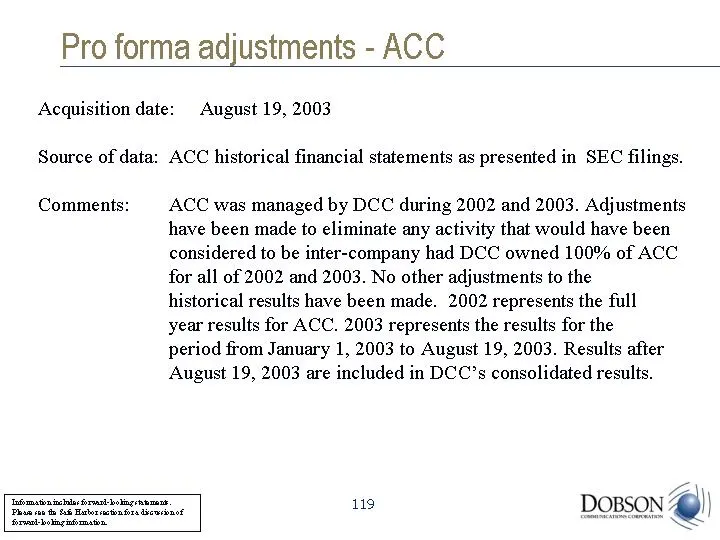
Pro forma adjustments - ACC Acquisition date: August 19, 2003 Source of data: ACC historical financial statements as presented in SEC filings. Comments: ACC was managed by DCC during 2002 and 2003. Adjustments have been made to eliminate any activity that would have been considered to be inter-compa
Slide 120: Pro forma adjustments - Anchorage MSA and AK
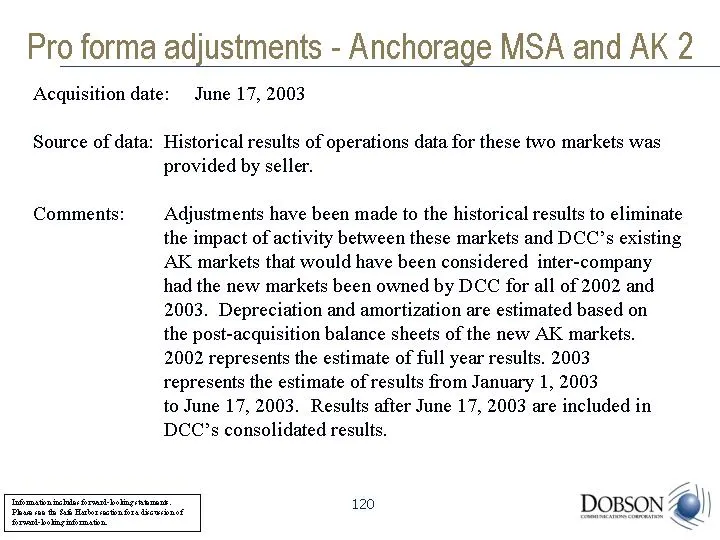
Pro forma adjustments - Anchorage MSA and AK 2 Acquisition date: June 17, 2003 Source of data: Historical results of operations data for these two markets was provided by seller. Comments: Adjustments have been made to the historical results to eliminate the impact of activity between these markets
Slide 121: Pro forma adjustments - Michigan
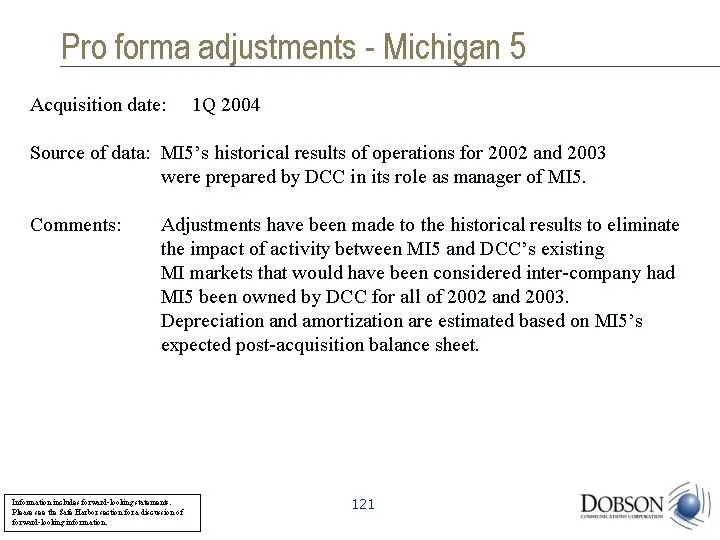
Pro forma adjustments - Michigan 5 Acquisition date: 1Q 2004 Source of data: MI5's historical results of operations for 2002 and 2003 were prepared by DCC in its role as manager of MI5. Comments: Adjustments have been made to the historical results to eliminate the impact of activity between MI5 and
Slide 122: Pro forma adjustments - NPI
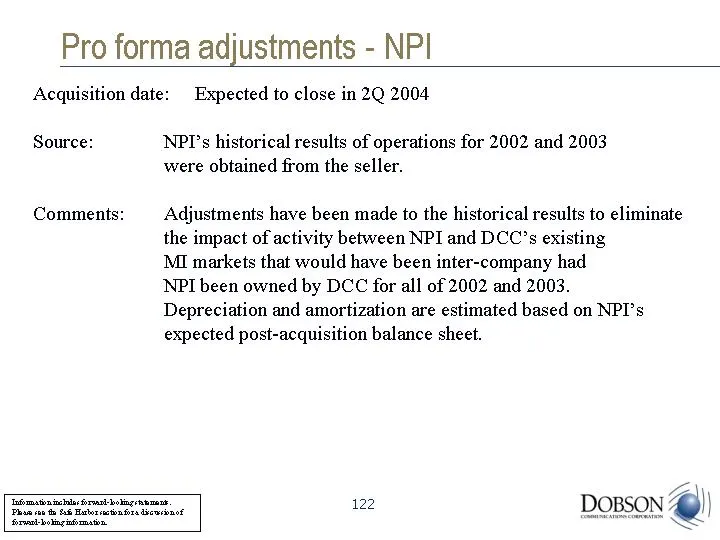
Pro forma adjustments - NPI Acquisition date: Expected to close in 2Q 2004 Source: NPI's historical results of operations for 2002 and 2003 were obtained from the seller. Comments: Adjustments have been made to the historical results to eliminate the impact of activity between NPI and DCC's existing
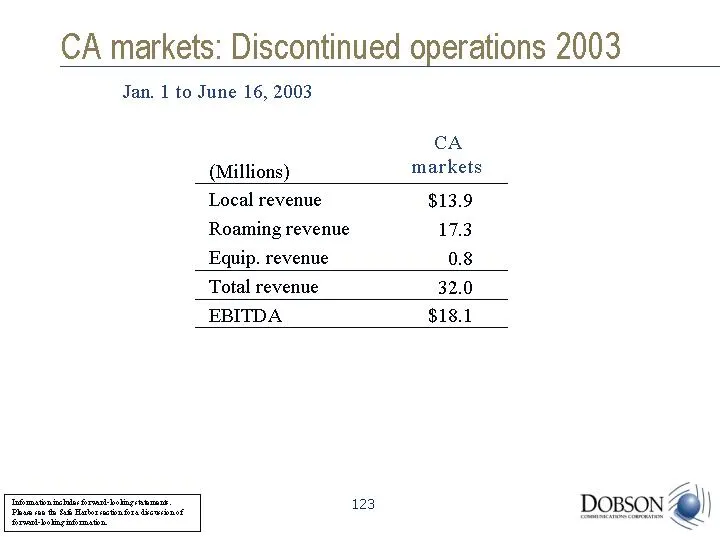
Slide 123: CA markets: Discontinued operations 2003
CA markets: Discontinued operations 2003 (Millions) Local revenue Roaming revenue Equip. revenue Total revenue EBITDA $13.9 17.3 0.8 32.0 $18.1 CA markets Jan. 1 to June 16, 2003
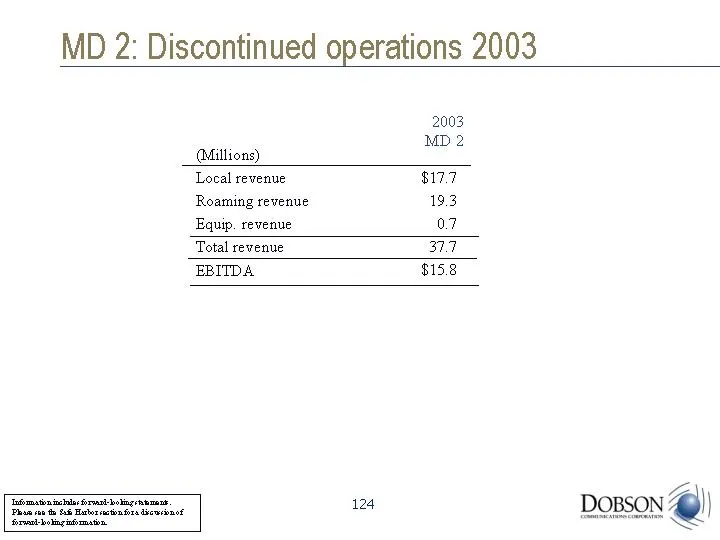
Slide 124: MD 2: Discontinued operations 2003
MD 2: Discontinued operations 2003 (Millions) Local revenue Roaming revenue Equip. revenue Total revenue EBITDA $17.7 19.3 0.7 37.7 $15.8 2003 MD 2
Source: SEC EDGAR · 8-K filed Feb 18, 2004