National Financial Partners Corp
National Financial Partners — Q3 2009 Earnings Presentation
21 slides from National Financial Partners's earnings presentation, Nov 4, 2009

Slide 1: Third Quarter Earnings Call Presentation
THIRD QUARTER EARNINGS CALL PRESENTATION November 4 th , Exhibit 99.1

Slide 2: Reconciliation: Net Income to Cash Earnings
RECONCILIATION: NET INCOME TO CASH EARNINGS (Dollars in thousands, except per share data) $1.67 $1.75 $0.61 $0.56 Cash earnings per share - diluted (2)(4) 0.42 — — — Impact of diluted shares on cash earnings not reflected in GAAP net loss per share - diluted (3) 0.12 0.11 0.05 0.04 Non-cash interest

Slide 3: NFP: Third Quarter Earnings Conference Call - Jessica Bibliowicz
NFP: THIRD QUARTER EARNINGS CONFERENCE CALL JESSICA BIBLIOWICZ Chief Executive Officer

Slide 4: Q3 2009 Highlights: Executing on Key 2009 Initiatives
Q3 2009 HIGHLIGHTS: EXECUTING ON KEY 2009 INITIATIVES Solid gross margin percentage improvement 19.1% in Q3 2009 vs. 17.5% in Q3 2008 Cash flow from operations increase of 40% compared with Q3 Operating expenses declined 14.0% compared with Q3 General & administrative expense declined 21.7% compared

Slide 5: Third Quarter 2009 Highlights
THIRD QUARTER 2009 HIGHLIGHTS Improvement in net income and cash earnings per share from prior year period Net income per share of $0.24 in Q3 2009 vs. $0.08 in Q3 2009 Normalized cash earnings per share of $0.58 in Q3 2009 vs. $0.56 in Q3 2008 Excludes $0.03 benefit from settlement of an NFP-owned
Slide 6: Firm Performance Relative to Base & Target
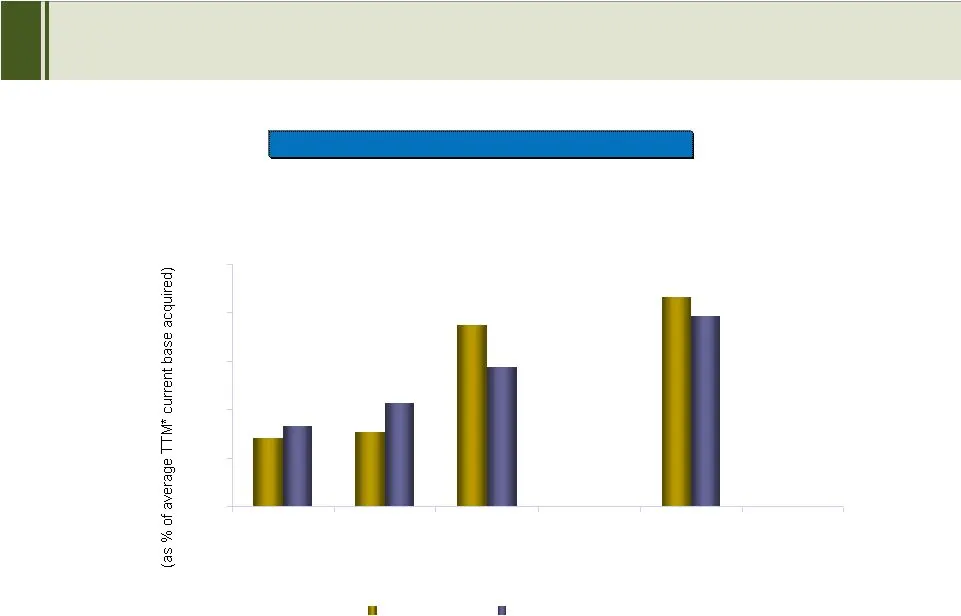
Performance Relative to Base & Target FIRM PERFORMANCE RELATIVE TO BASE & TARGET (only includes firms that were part of NFP for more than 12 months) * Trailing twelve months 23% 21% 56% 65% 25% 32% 43% 59% 0% 15% 30% 45% 60% 75% Base Deficit Gap Bonus Within 85% or above Target Q3 2008 Q3 2009
Slide 7: Third Quarter & YTD 2009 Business Mix
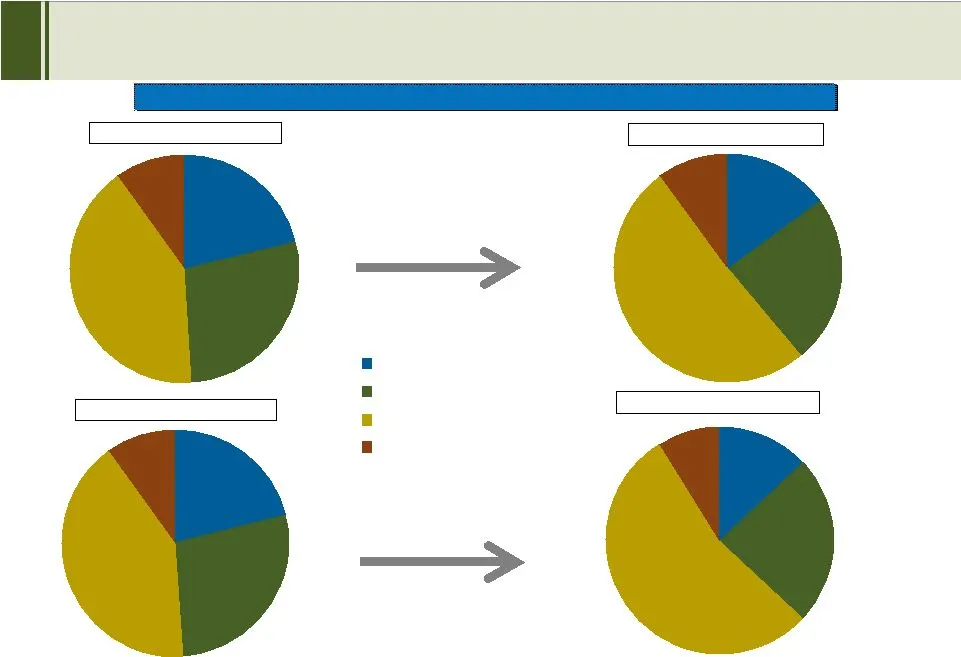
21% 28% 10% 41% 24% 54% 9% 13% 21% 28% 10% 41% 24% 51% 10% 15% THIRD QUARTER & YTD 2009 BUSINESS MIX BUSINESS MIX Note: A firm is considered within a product line if at least 70% of its total trailing four full quarters revenue is derived from that product. Firms that did not have at least 70% of th

Slide 8: NFP: Third Quarter Earnings Conference Call - Donna Blank
NFP: THIRD QUARTER EARNINGS CONFERENCE CALL DONNA BLANK Chief Financial Officer
Slide 9: Solid Cash Flow
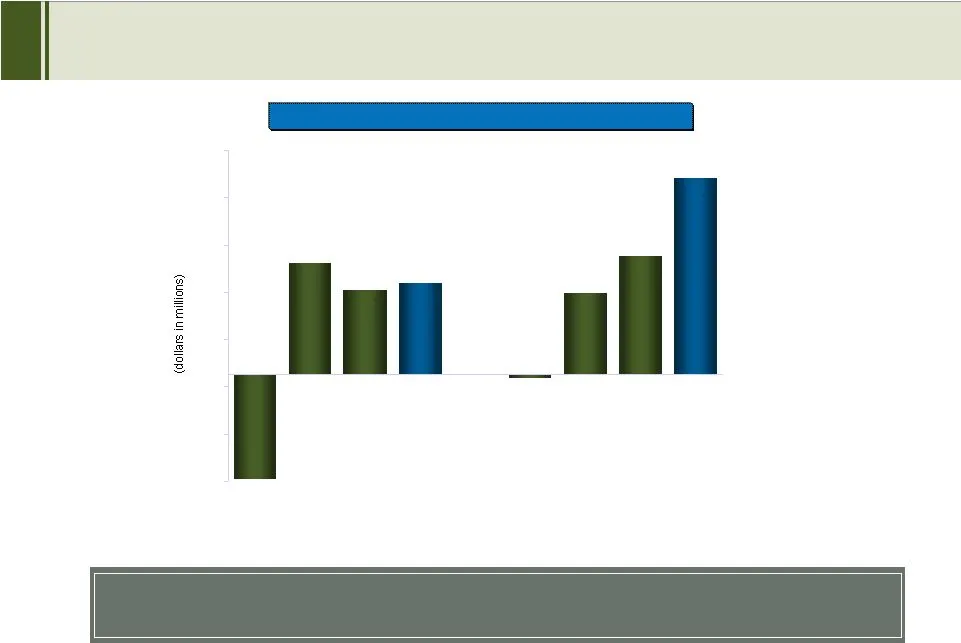
Operating cash flow is up 40% from prior year period and has more than doubled year-to-dat e Operating Cash Flow -$44.4 $47.1 $36.0 $38.7 $50.4 $83.0 $34.1 SOLID CASH FLOW Note: Q1 ’08 and YTD ’08 are adjusted for the exclusion of a $14.4 million outflow for the purchase of an increased economic own
Slide 10: Credit Facility
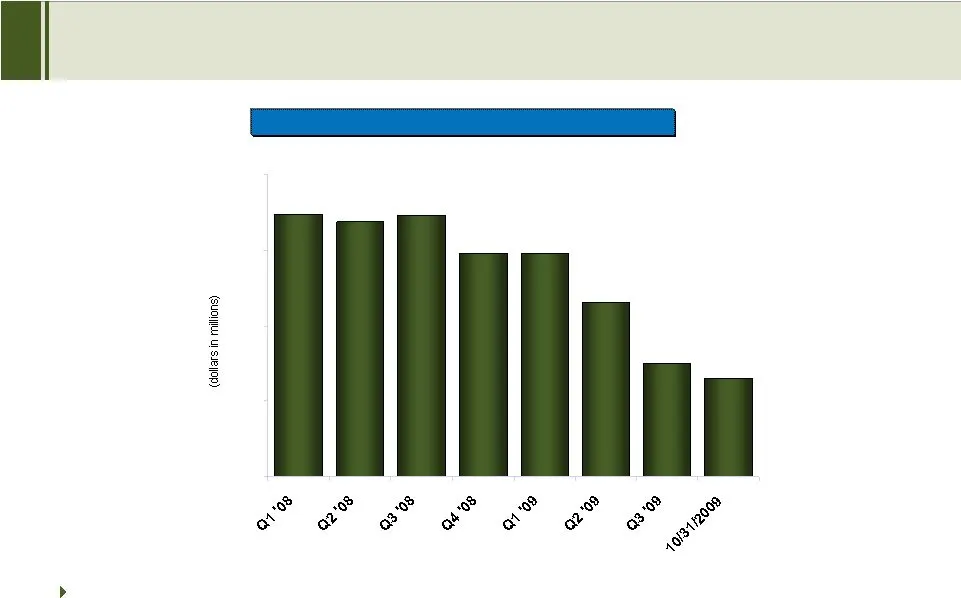
Total Credit Facility Outstanding CREDIT FACILITY Consolidated leverage ratio of 2.2x at the end of the third quarter $169 $173 $148 $148 $65 $174 $75 $115 $0 $50 $100 $150 $200
Slide 11: Improving Gross Margin Percentage
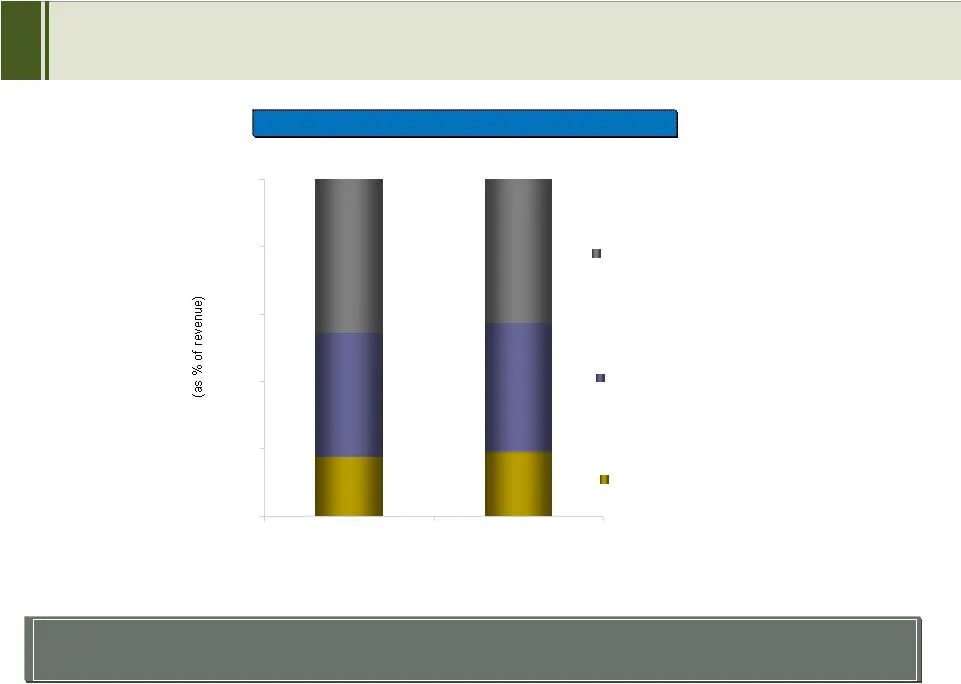
Variable components of cost structure & operating expense decline drove the increase in gross margin % 17.5% 19.1% 37.0% 38.3% 45.5% 42.6% Components of Revenue IMPROVING GROSS MARGIN PERCENTAGE 0% 20% 40% 60% 80% 100% Q3 2008 Q3 2009 Operating Expenses Gross Margin Variable Costs (Commission Expens
Slide 12: Management Fee Structure
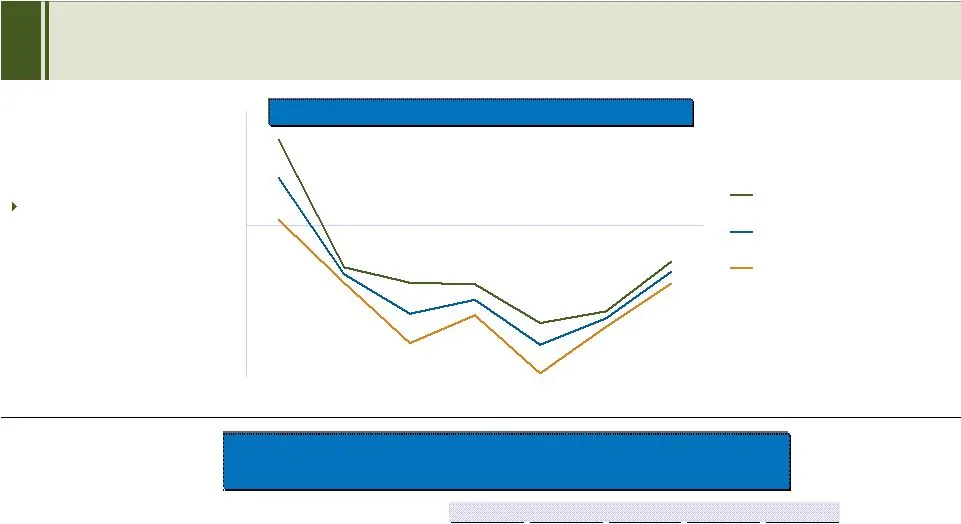
Downside Protection Example: As Performance of Firms Increases Above Base, Management Fee % Increases MANAGEMENT FEE STRUCTURE -40% -30% -20% -10% 0% 10% 20% 30% Q1 2008 Q2 2008 Q3 2008 Q4 2008 Q1 2009 Q2 2009 Q3 2009 Gross Margin Income Before Mgmt. Fees Management Fees (paid to firm principal) Man
Slide 13: Q3 2009 Operating Leverage
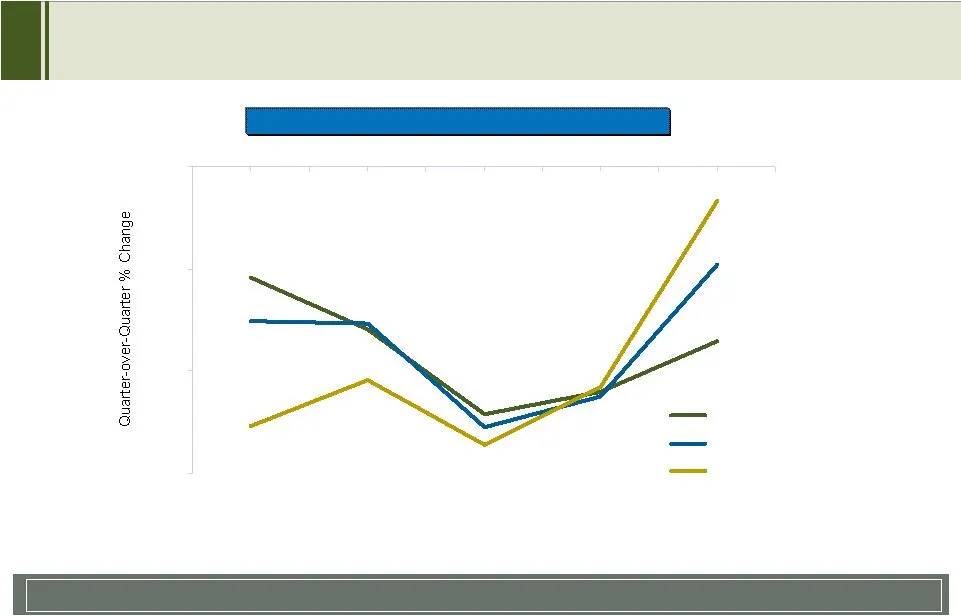
Operating margin decline of 4% vs. revenue decline of 17% % Change in Key Metrics Q3 2009 OPERATING LEVERAGE (1) Operating margin is gross margin less general and administrative expense -30% -20% -10% 0% Q3 2008 Q4 2008 Q1 2009 Q2 2009 Q3 2009 Revenue Gross Margin Operating Margin (1)

Slide 14: NFP: Third Quarter Earnings Conference Call - Doug Hammond
NFP: THIRD QUARTER EARNINGS CONFERENCE CALL DOUG HAMMOND Chief Operating Officer
Slide 15: Strong Progress in Reducing Expenses
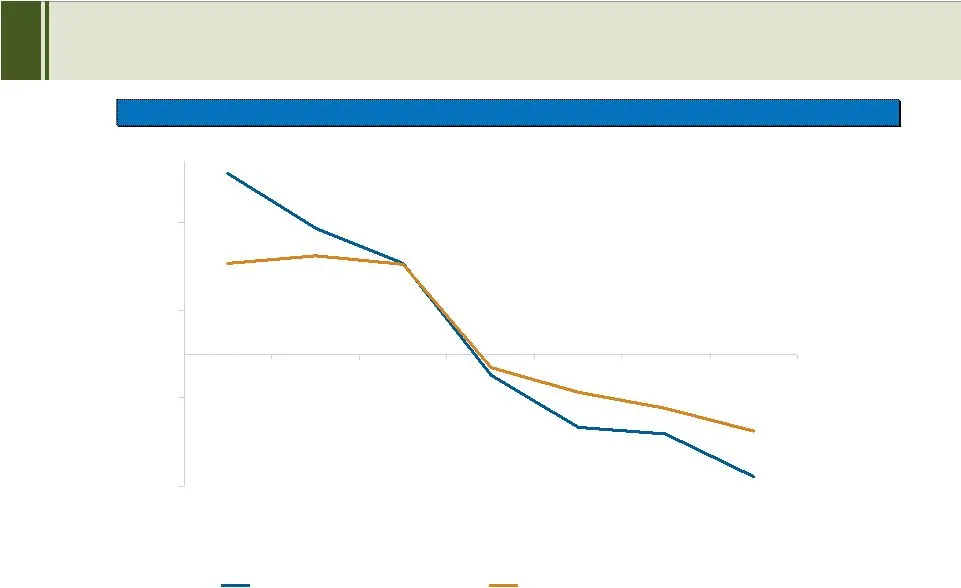
Percentage Growth/Decline in Operating Expenses vs. Prior Year Period STRONG PROGRESS IN REDUCING EXPENSES -15% -5% 5% 15% Q1 2008 Q2 2008 Q3 2008 Q4 2008 Q1 2009 Q2 2009 Q3 2009 Total Operating Expenses Organic Operating Expenses
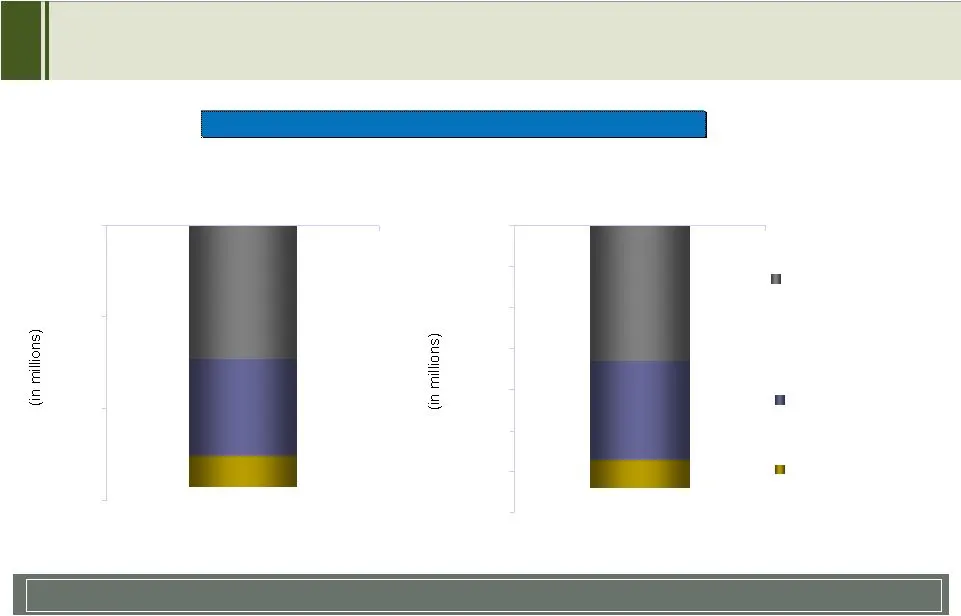
Slide 16: Operating Expense Decline
($7.3) ($5.3) ($1.7) ($16.5) ($3.4) ($12.1) Half of operating expense cuts were at organic firms Components of Operating Expense Decline OPERATING EXPENSE DECLINE -$15.0 -$10.0 -$5.0 $0.0 Q3 2009 -$35.0 -$30.0 -$25.0 -$20.0 -$15.0 -$10.0 -$5.0 $0.0 YTD 2009 ($14.3) ($32.0) (1) Includes NFPISI, NFPSI

Slide 17: Restructured Principal Incentive Plan
RESTRUCTURED PRINCIPAL INCENTIVE PLAN 1. Individual Firm Annual Cash Component To receive a payment firms must: 1. Perform in excess of Target earnings under each firm’s management agreement 2. Have earnings that exceed a revised earnings benchmark Incentive plan does not impact NFP’s priority posit

Slide 18: Appendix: Revenue by Product Performance
NFP: THIRD QUARTER EARNINGS CONFERENCE CALL REVENUE BY PRODUCT PERFORMANCE Appendix
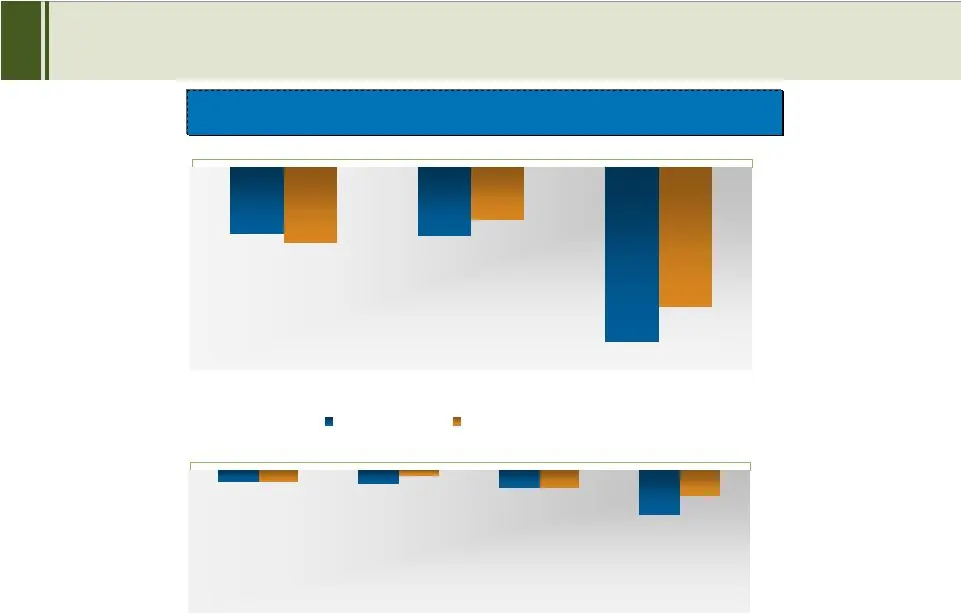
Slide 19: Q3 2009: Revenue by Product Performance
Organic Revenue & Net Revenue Growth By Product: Q3 2009 vs. Q3 2008 Q3 2009: REVENUE BY PRODUCT PERFORMANCE -23% -24% -60% -48% -18% -26% Retail Life Insurance Life Brokerage Settlements Brokerage Organic Revenue Organic Net Revenue -6% -7% -9% -22% -6% -3% -9% -13% Group Benefits Executive Benefit
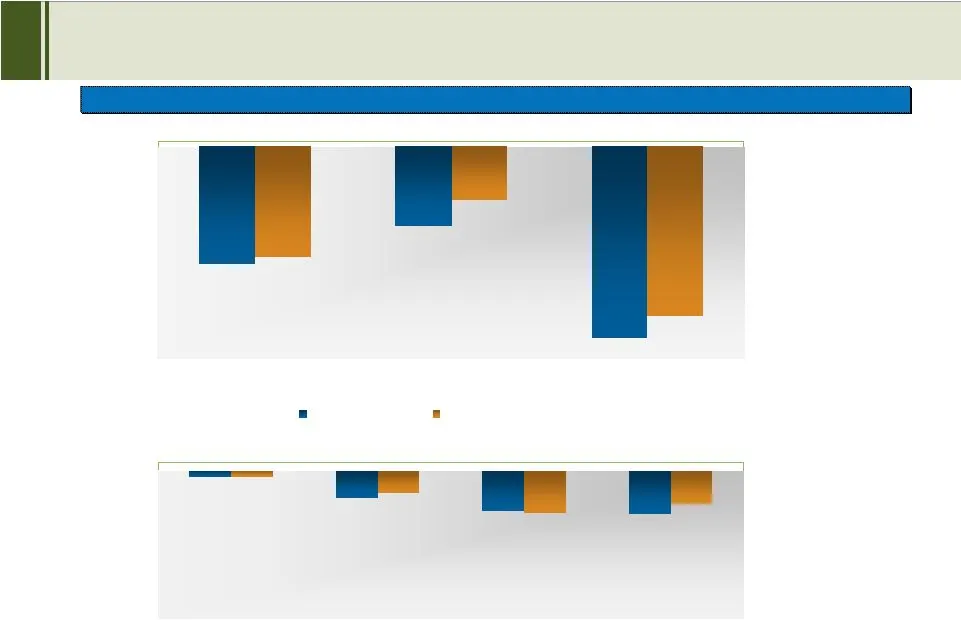
Slide 20: YTD 2009: Revenue by Product Performance
Organic Revenue & Net Revenue Growth By Product: YTD 2009 vs. YTD 2008 YTD 2009: REVENUE BY PRODUCT PERFORMANCE -3% -13% -19% -20% -3% -11% -20% -16% Group Benefits Executive Benefits Financial Advisory Diversified Non-Life Insurance Life Insurance Note: A firm is considered within a product line if

Slide 21
Source: SEC EDGAR · 8-K filed Nov 4, 2009
More decks from National Financial Partners Corp
 Q4 2012 Earnings Presentation19 slides · Feb 15, 2013
 Q3 2012 Earnings Presentation18 slides · Oct 31, 2012
 Q2 2012 Earnings Presentation19 slides · Jul 31, 2012
 Q1 2012 Earnings Presentation19 slides · Apr 27, 2012
 Q4 2011 Earnings Presentation18 slides · Feb 8, 2012
 Q3 2011 Earnings Presentation19 slides · Oct 28, 2011