Capital Bank Financial — Investor Presentation (June 2013)
27 slides from Capital Bank Financial's investor presentation, Jun 11, 2013

Slide 1: Transforming the Franchise
Transforming the Franchise June 2013 Exhibit 99.1

Slide 2: Safe Harbor Statement
Safe Harbor Statement Forward-Looking Statements Information in this presentation contains forward-looking statements. Any statements about our expectations, beliefs, plans, predictions, forecasts, objectives, assumptions or future events or performance are not historical facts and may be forward-lo
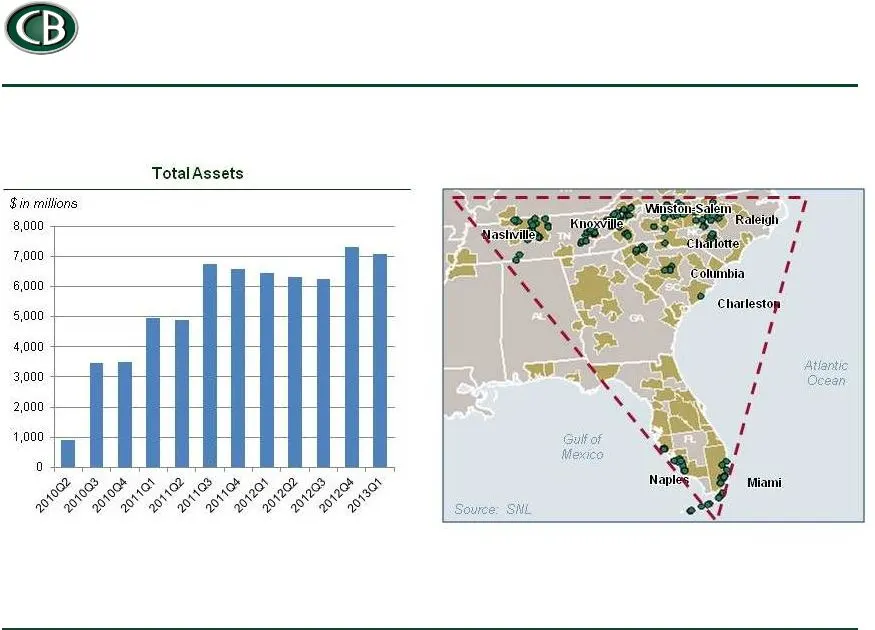
Slide 3: The Capital Bank Story
The Capital Bank Story From ‘blind pool’ to $7.1 billion bank in less than three years
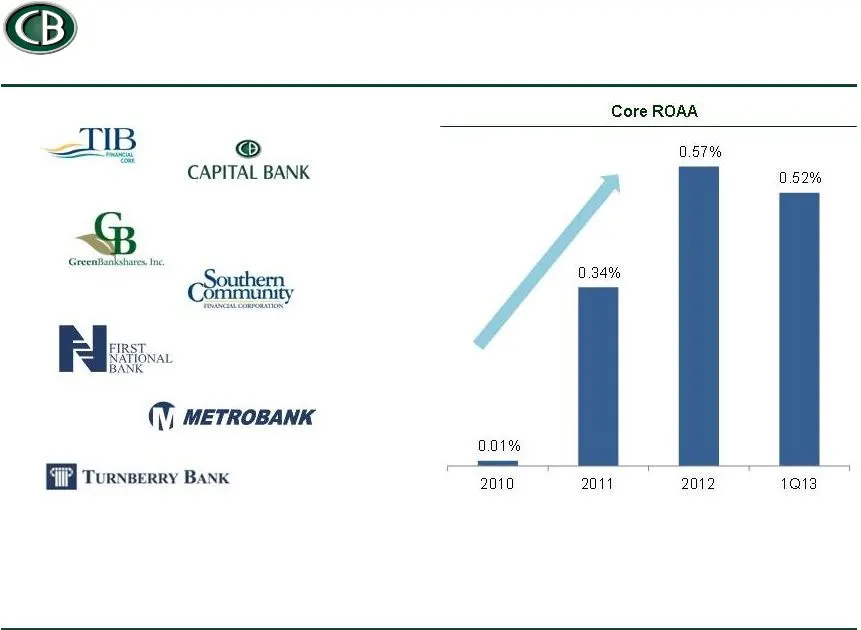
Slide 4: Significant Improvement in Returns
Significant Improvement in Returns See reconciliation of non-GAAP measures in appendix.
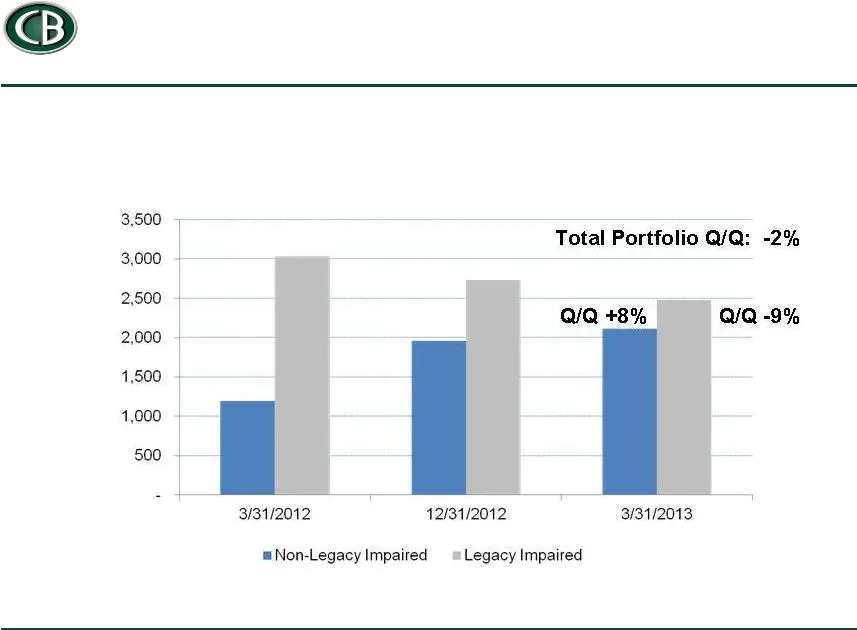
Slide 5: Transforming the Loan Portfolio
Transforming the Loan Portfolio $ in millions Legacy Impaired = accounted for as Purchase Credit Impaired
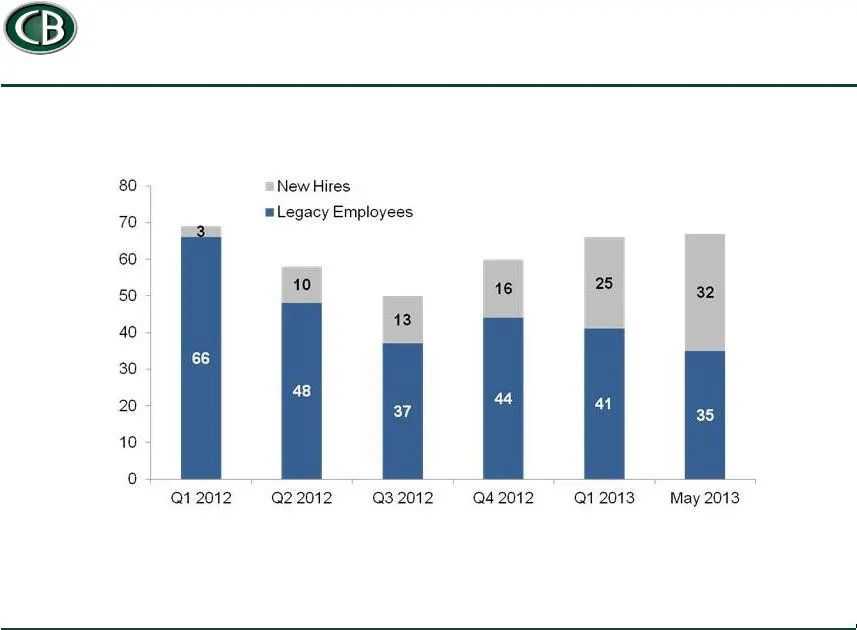
Slide 6: Topgrading the Commercial Salesforce
Topgrading the Commercial Salesforce Number of salespersons
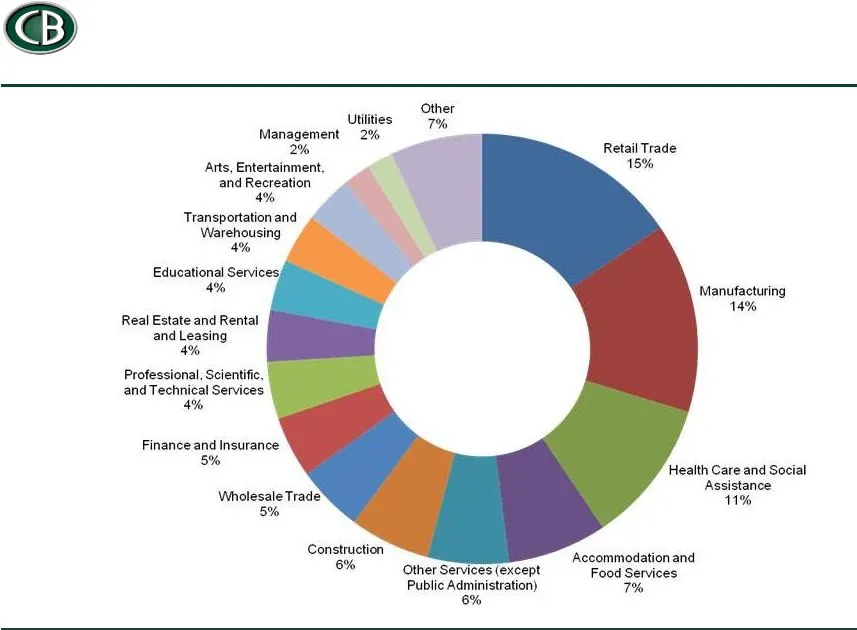
Slide 7: Commercial Book Starts with Customer Selection
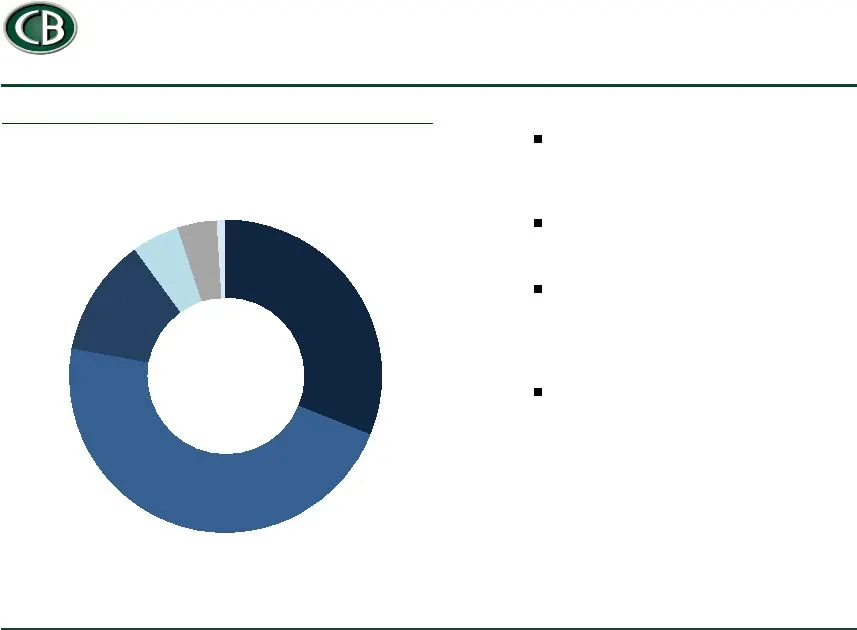
Commercial Book Starts with Customer Selection Originated commercial loan portfolio as of 3/31/2013, by borrower industry Excludes all acquired loans.
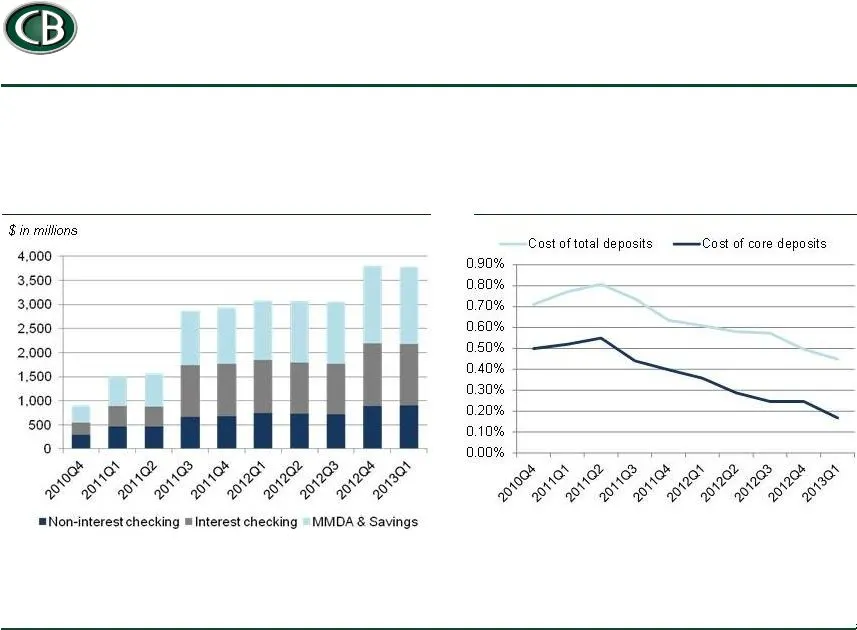
Slide 8: Transforming the Deposit Franchise
Transforming the Deposit Franchise Growing Core Deposits And Lowering Deposit Costs
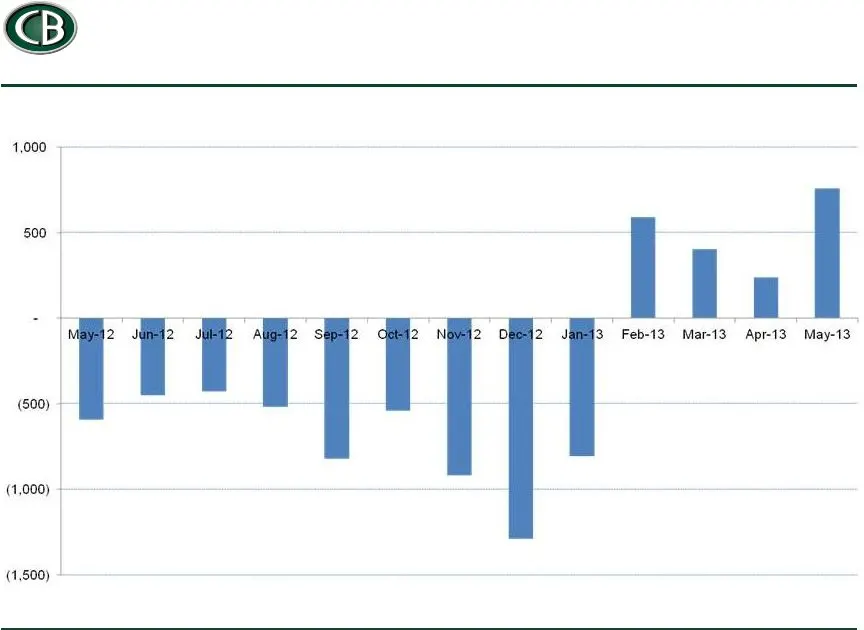
Slide 9: Checking Accounts Now Growing after Integrations
Checking Accounts Now Growing after Integrations Sequential change in total checking accounts Excludes addition of checking accounts from Southern Community in October

Slide 10: Transforming the Team with Promotions/New Hires
Transforming the Team with Promotions/New Hires General Counsel BSA/AML Executive Enterprise Risk Executive Head of Loan Operations Head of Small Business Lending Wealth Management Executive

Slide 11: First Quarter Highlights
First Quarter Highlights See reconciliation of non-GAAP measures in appendix. Reported GAAP net income of $5.6 million, or $0.10 per diluted share Reported core net income of $9.4 million, or $0.17 per diluted share TBV per share of $17.89 Originations steady at $251 million Deposit costs down 3 bps
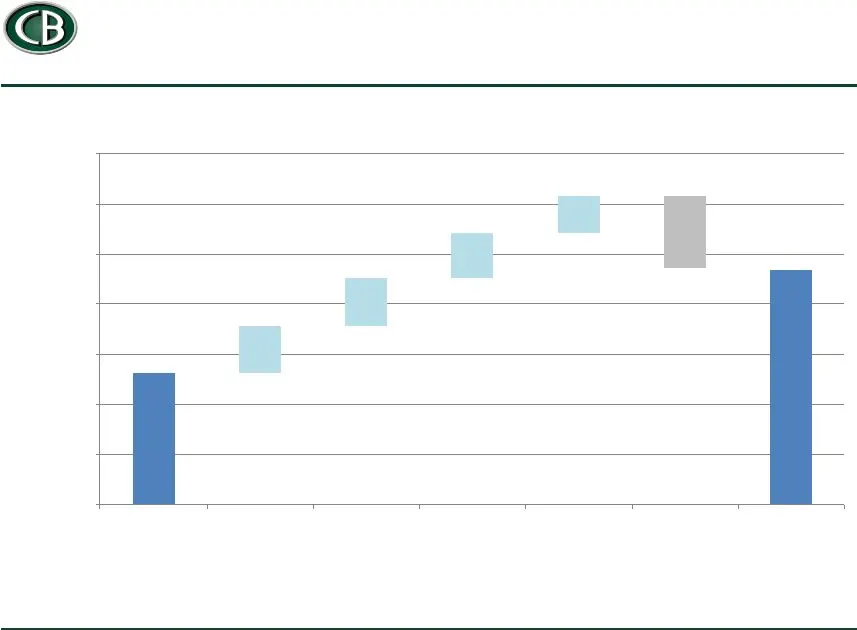
Slide 12: Illustrative Path to Target Returns
Illustrative Path to Target Returns Core ROAA 0.19% 0.19% 0.18% 0.15% 0.29% 0.0% 0.2% 0.4% 0.6% 0.8% 1.0% 1.2% 1.4% 1Q13 Loan growth, net Legacy credit expense normalization Fee income initiatives, net Other initiatives Normalization of NIM Target ROAA = Return on average assets. See reconciliation
Slide 13: 1Q13 Portfolio Growth Impacted by Resolutions
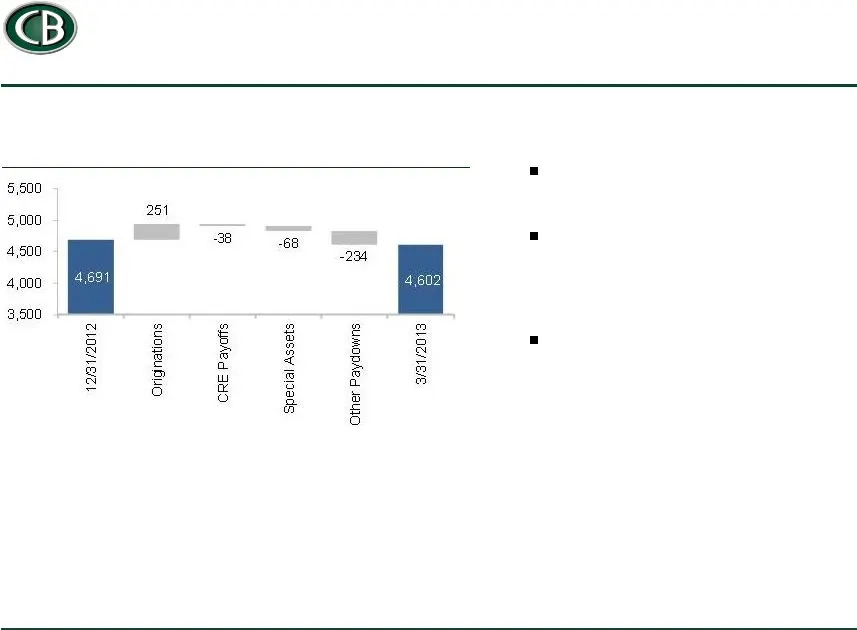
1Q13 Portfolio Growth Impacted by Resolutions Loan Portfolio Loan portfolio growth was -2% in 1Q13, an improvement from -3% in 4Q As expected, paydowns of commercial real estate slowed significantly from $138 mm in 4Q to $38 mm in 1Q as we have significantly reduced CRE concentrations Resolution act
Slide 14: Legacy Credit Expenses Improved in 1Q13
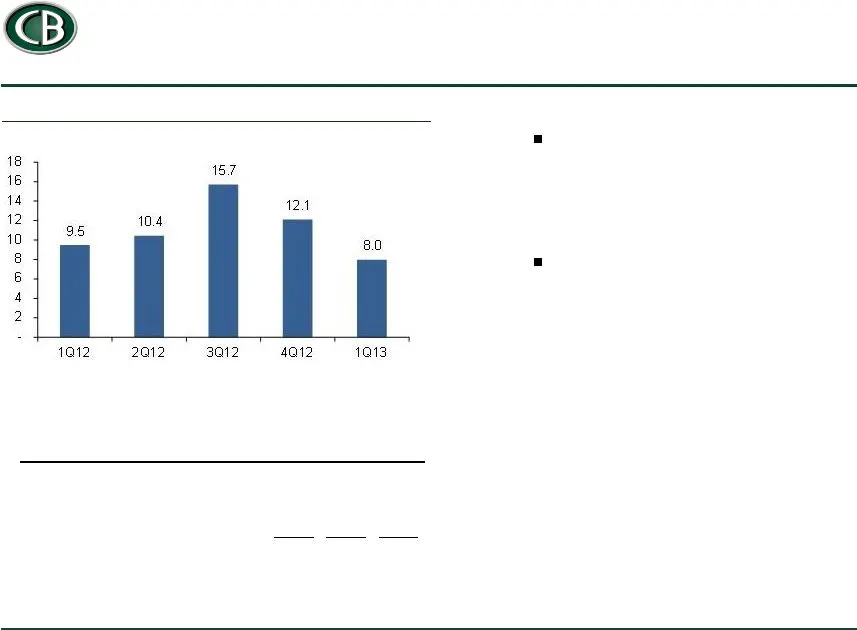
Legacy Credit Expenses Improved in 1Q13 Favorable performance on legacy covered loans in Florida and South Carolina drove the negative provision and the corresponding writedown on the FDIC asset REO write-downs improved slightly from 4Q and remain largely concentrated in non-urban land & lots Legacy
Slide 15: Liquidity and Capital Ratios Remain Strong
Liquidity and Capital Ratios Remain Strong We continue to run a conservative liquidity strategy as part of our asset sensitive position Effective duration of investments was 3.1 years at March 31, 2013 Our capital ratios remain strong with tier 1 leverage of 12.2% at the bank and 13.5% on a consolid
Slide 16: CBF and Peers: Price to Fully-marked TBV
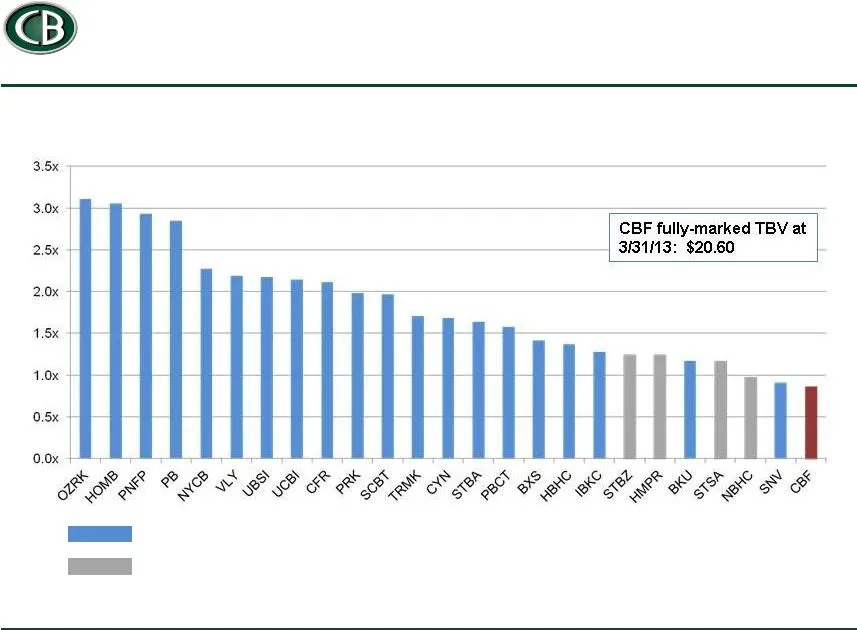
CBF and Peers: Price to Fully-marked TBV Note: Fully Marked TBV as of 3/31/2013, stock prices as of 6/3/2013. Fully-marked TBV equals net assets, adjusted for fair value of financial instruments, less goodwill and intangibles net of tax effect. See appendix for additional discussion of estimated fai

Slide 17: Capital Bank: Transforming the Franchise
Capital Bank: Transforming the Franchise Building high-quality loan portfolio Building low-cost deposit franchise Consistent progress in resolving legacy assets Deploying capital to drive investor returns Positioned in attractive growth markets Committed to organic growth and higher returns

Slide 18: Appendix
Appendix
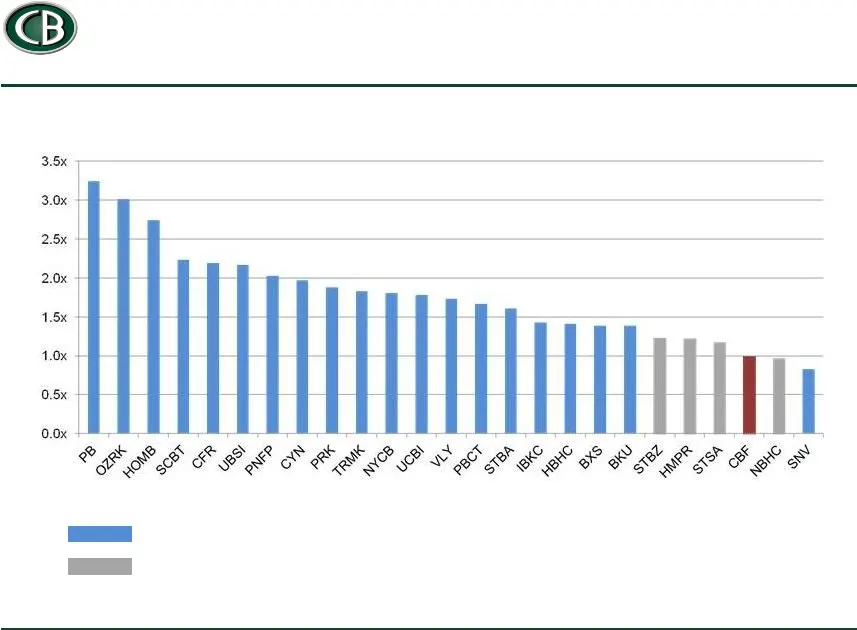
Slide 19: CBF and Peers: Price to Tangible Book Value
CBF and Peers: Price to Tangible Book Value Note: TBV as of most recent quarter available, stock prices as of 6/3/2013. Peer Blind Pools / Recap

Slide 20: Tangible and Fully-marked Tangible Book Value
Tangible and Fully-marked Tangible Book Value Fair Value = Carrying Value adjusted for the fair value of financial instruments. See explanatory note on following page. $ in millions December 31, 2012 March 31, 2013 Total common shareholders' equity $1,156 $1,161 Intangibles, net of taxes (165) (165)

Slide 21: Tangible and Fully-marked Tangible Book Value
Tangible and Fully-marked Tangible Book Value The methods and assumptions used to estimate fair value of financial instruments are described as follows: Carrying amount is the estimated fair value for cash and cash equivalents, receivable from FDIC, derivatives, noncontractual demand deposits and ce

Slide 22: First Quarter Core Earnings Summary
First Quarter Core Earnings Summary ($ millions except per share data) 1Q13 4Q12 1Q12 Q/Q Y/Y Net interest income 67.8 66.0 63.9 3% 6% Provision 6.9 4.4 5.4 -57% -28% Core non-interest income 10.9 15.4 12.1 -29% -10% Core non-interest expense 56.4 61.9 54.0 9% -4% Pretax income 15.4 15.1 16.6 2% -7%
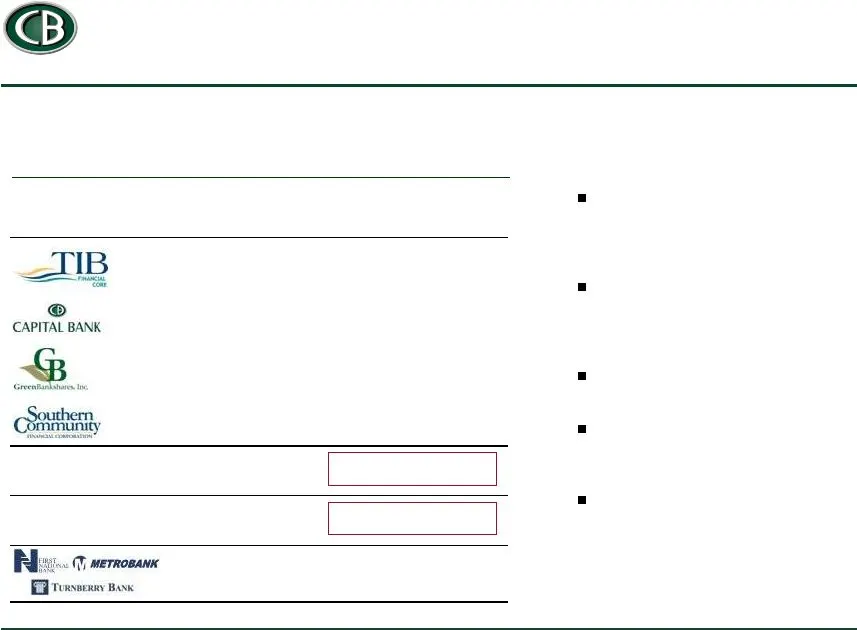
Slide 23: Disciplined and Thoughtful Acquiror
Disciplined and Thoughtful Acquiror Announce Premium Price / Price / Target Date to Market TBV Adj. TBV (77%) 0.25x 1.25x 59% 0.45x 1.25x (20%) 0.41x 1.17x 59% 0.95x 1.42x Capital Bank Average 5% 0.51x 1.27x Comparables Average 59% 1.28x 1.85x NA NA 0.93x (1) (2) Extensive local market knowledge, in

Slide 24: Reconciliation of Core Net Income
Reconciliation of Core Net Income $ in millions Core non Interest Income 1Q12 2Q12 3Q12 4Q12 1Q13 Net interest income $63.9 $63.3 $60.3 $66.0 $67.8 Reported non interest income 14.8 12.2 20.3 15.4 10.9 (-)Securities / Purchase Gains 2.7 0.9 4.9 0.0 – (-)Insurance settlement gain – – 1.8 – – Core non

Slide 25: Reconciliation of Core Net Income and Core ROAA
Reconciliation of Core Net Income and Core ROAA $ in millions Pre-Tax After-Tax Pre-tax After-Tax Pre-tax After-Tax For the Quarter For the Quarter For the Quarter For the Quarter For the Quarter For the Quarter Ended Ended Ended Ended Ended Ended 1Q13 1Q13 4Q12 4Q12 1Q12 1Q12 $5.6 $5.6 $5.3 $5.3 $6

Slide 26: Core ROAA
Core ROAA $ in millions Pre -Tax After -Tax Pre -Tax After -Tax Pre -Tax After -Tax Pre -Tax After -Tax YTD 2010 YTD 2010 YTD 2011 YTD 2011 YTD 2012 YTD 2012 1Q13 1Q13 Net income $12.1 $12.1 $7.5 $7.5 $55.7 $55.7 $5.6 $5.6 Adjustments: Non-Interest Income Security gains – – ($4.7) ($2.9) ($8.6) ($5.
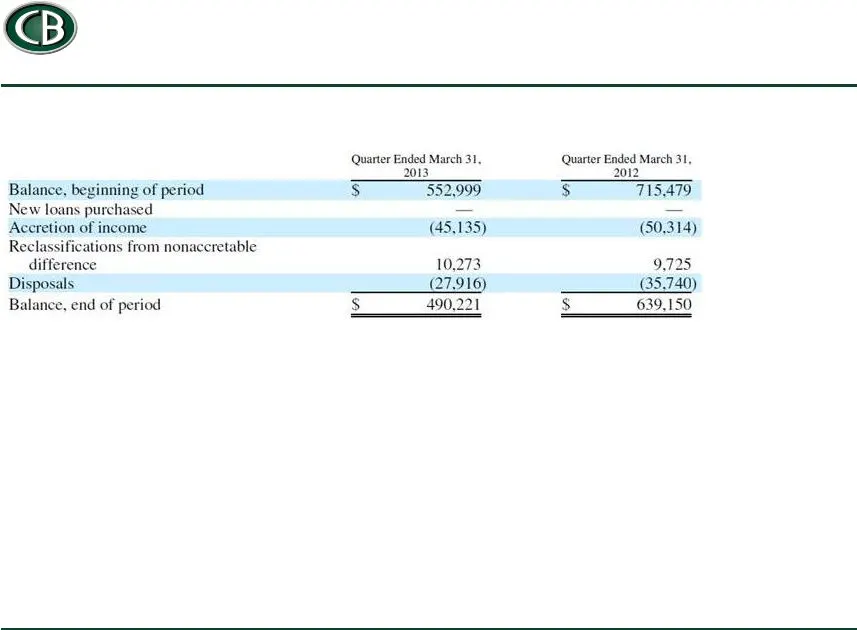
Slide 27: Accretable Yield Rollforward
Accretable Yield Rollforward Contractual yield on loan portfolio 1Q 2013: 5.1% $ in thousands
Source: SEC EDGAR · 8-K filed Jun 11, 2013
More decks from Capital Bank Financial Corp
 Q2 2017 Earnings Presentation22 slides · Jul 14, 2017
 Morgan Stanley Financial Services Conference 201715 slides · Jun 13, 2017
 Merger or Acquisition (June 2017)27 slides · Jun 6, 2017
 Merger or Acquisition (May 2017)17 slides · May 4, 2017
 Q1 2017 Earnings Presentation21 slides · Apr 21, 2017
 Q4 2016 Earnings Presentation25 slides · Jan 26, 2017