Health Grades — Investor Presentation (August 2007)
30 slides from Health Grades's investor presentation, Aug 9, 2007

Slide 1: HealthGrades August 2007
(NASDAQ: HGRD) www.healthgrades.com August 2007
Slide 2: Safe Harbor Statement
Safe Harbor Statement This presentation, both written and oral, contains certain “forward-looking statements” within the meaning of the U.S. Private Securities Litigation Reform Act of 1995. In particular, statements regarding planned growth in HealthGrades’ business, anticipated web traffic, and ad
Slide 3: Health Grades, Inc.
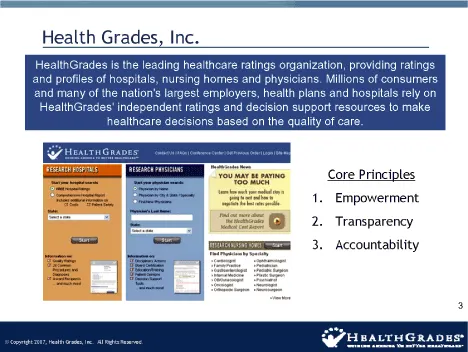
Health Grades, Inc. HealthGrades is the leading healthcare ratings organization, providing ratings and profiles of hospitals, nursing homes and physicians. Millions of consumers and many of the nation’s largest employers, health plans and hospitals rely on HealthGrades’ independent ratings and decis
Slide 4: Investment Highlights
Investment Highlights · Meeting a major market need – Growing demand for healthcare quality and cost data to make informed healthcare spending decisions · Recurring-revenue business model –Significant operating leverage –Increasing operating cash flows –High returns on invested capital · Solid reven
Slide 5: HealthGrades and its Methodology
HealthGrades and its Methodology · HealthGrades is much more than a ratings company · HealthGrades has nearly 500,000 discrete ratings (5,000 hospitals x 30 procedures/diagnoses x 3 discrete end points) -Hospital market size is not limited to one license for 750 hospitals (5,000 x 15% 5-star rated)
Slide 6: HealthGrades' Databases
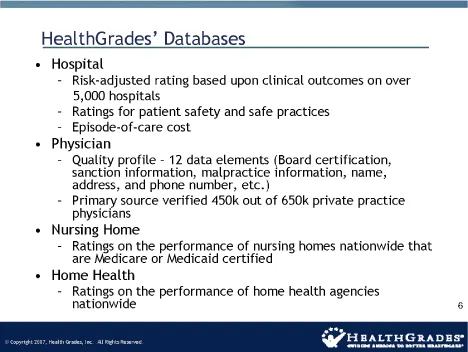
HealthGrades’ Databases · Hospital –Risk-adjusted rating based upon clinical outcomes on over 5,000 hospitals –Ratings for patient safety and safe practices –Episode-of-care cost · Physician – Quality profile – 12 data elements (Board certification, sanction information, malpractice information, nam
Slide 7: Business Case for Quality
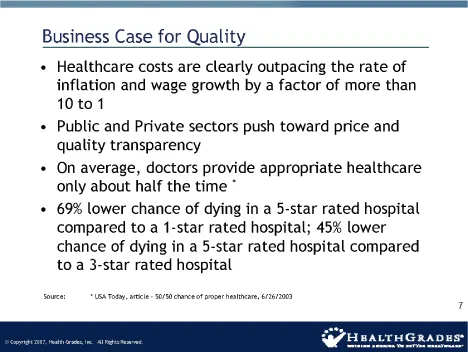
Business Case for Quality • Healthcare costs are clearly outpacing the rate of inflation and wage growth by a factor of more than 10 to 1 · Public and Private sectors push toward price and quality transparency · On average, doctors provide appropriate healthcare only about half the time * · 69% lowe
Slide 8: HealthGrades' Products and Services
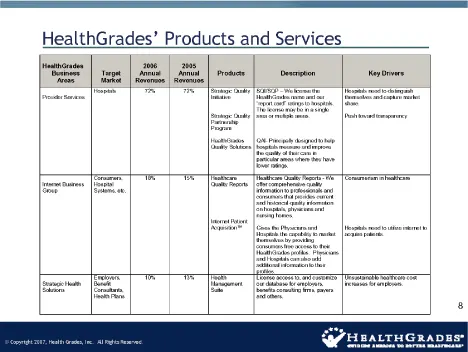
HealthGrades’ Products and Services HealthGrades 2006 2005 Business Target Annual Annual Products Description Key Drivers Areas Market Revenues Revenues Hospitals 72% 7 2 % Strategic Quality SQI/SQP – We license the Hospitals need to distinguish Provider Services Initiative HealthGrades name and our
Slide 9: Quality-Centric Healthcare Sphere of Influence
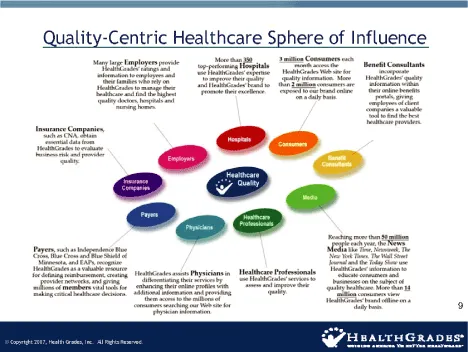
Quality-Centric Healthcare Sphere of Influence 9 ã Copyright 2007, Health Grades, Inc. All Rights Reserved.
Slide 10: Provider Services Group
Provider Services Group · Hospital marketing products (Since 1998) · Quality improvement products (Since 2002) 10
Slide 11: Market Opportunity
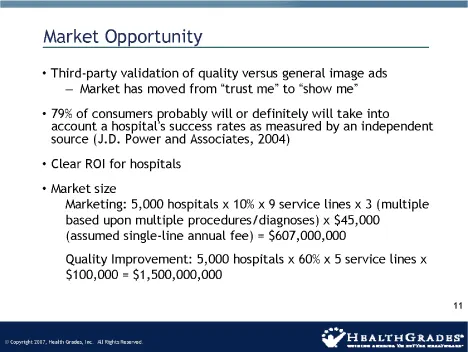
Market Opportunity · Third-party validation of quality versus general image ads – Market has moved from “trust me” to “show me” · 79% of consumers probably will or definitely will take into account a hospital’s success rates as measured by an independent source (J.D. Power and Associates, 2004) · Cl
Slide 12: Provider Services: Hospital Ratings
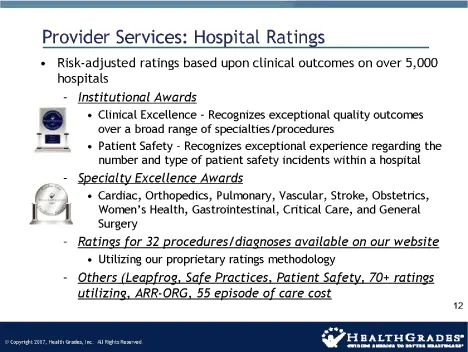
Provider Services: Hospital Ratings · Risk-adjusted ratings based upon clinical outcomes on over 5,000 hospitals – Institutional Awards • Clinical Excellence – Recognizes exceptional quality outcomes over a broad range of specialties/procedures · Patient Safety – Recognizes exceptional experience re
Slide 13: Internet Business Group
Internet Business Group • Quality reports to consumers (Since 2003) • Internet Patient Acquisition™ (Since 2006) • Advertising (Testing beginning Q2-07) 13 ã Copyright 2007, Health Grades, Inc. All Rights Reserved.
Slide 14: Healthcare Consumers Online
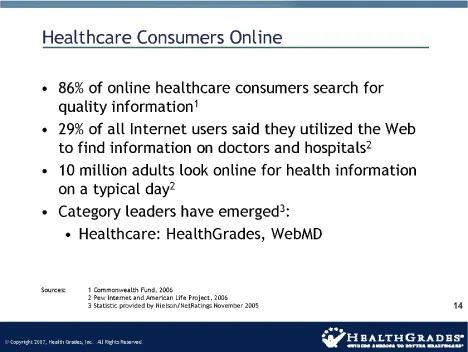
Healthcare Consumers Online • 86% of online healthcare consumers search for quality information 1 · 29% of all Internet users said they utilized the Web to find information on doctors and hospitals 2 · 10 million adults look online for health information on a typical day 2 · Category leaders have em
Slide 15: HealthGrades' Website — Total Unique Users
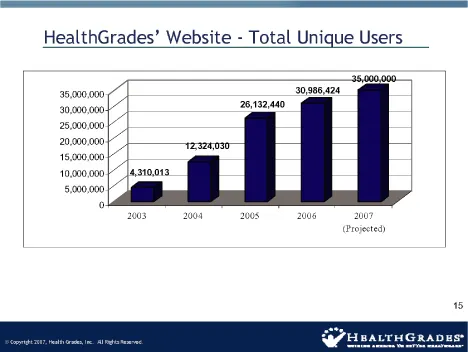
HealthGrades’ Website — Total Unique Users 35,000,000 30,986,424 35,000,000 26,132,440 30,000,000 25,000,000 20,000,000 12,324,030 15,000,000 10,000,000 4,310,013 5,000,000 0 2003 2004 2005 2006 2007 (Projected)
Slide 16: How Consumers Use HealthGrades to Search for Physicians Online
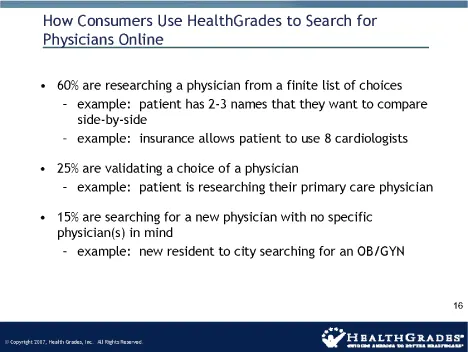
How Consumers Use HealthGrades to Search for Physicians Online • 60% are researching a physician from a finite list of choices – example: patient has 2-3 names that they want to compare side-by-side – example: insurance allows patient to use 8 cardiologists · 25% are validating a choice of a physici
Slide 17: Internet Patient Acquisition — How It Works
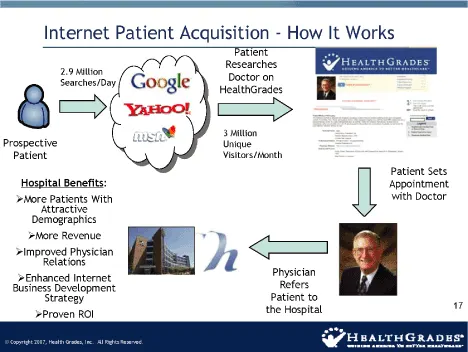
Internet Patient Acquisition — How It Works Patient Researches 2.9 Million Doctor on Searches/Day HealthGrades 3 Million Prospective Unique Patient Visitors/Month Patient Sets Hospital Benefits : Appointment · More Patients With with Doctor Attractive Demographics · More Revenue · Improved Physician
Slide 18: HealthGrades' Physician Reports - Free vs. Buy
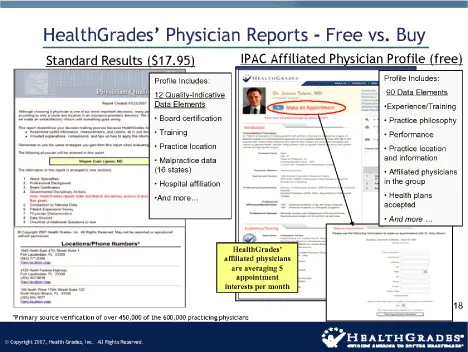
HealthGrades ’ Physician Reports - Free vs . Buy Standard Results ($17.95) IPAC Affiliated Physician Profile (free) Profile Includes: Profile Includes: 12 Quality-Indicative 90 Data Elements Data Elements ·Experience/Training · Board certification · Practice philosophy · Training · Performance · Pra
Slide 19: HealthGrades' Internet Patient Acquisition Results
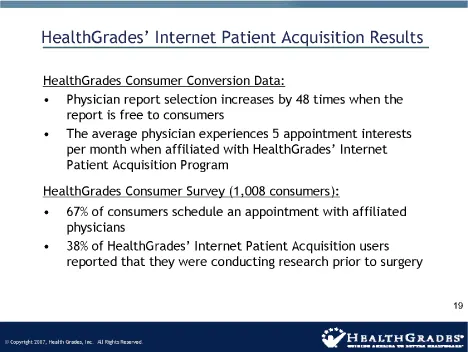
HealthGrades’ Internet Patient Acquisition Results HealthGrades Consumer Conversion Data: · Physician report selection increases by 48 times when the report is free to consumers · The average physician experiences 5 appointment interests per month when affiliated with HealthGrades’ Internet Patient
Slide 20: HealthGrades' Advertising
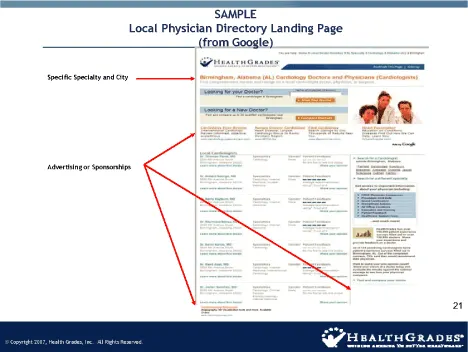
HealthGrades’ Advertising · Testing advertising through Google AdServe to gain intelligence · Very new program · Although the market opportunity is large, there is no assurance as to the amount of contribution to revenue in 2007 or beyond • Currently we are advertising on the majority of our physici
Slide 21: Sample Local Physician Directory Landing Page
SAMPLE Local Physician Directory Landing Page (from Google) Specific Specialty and City Advertising or Sponsorships 21 ã Copyright 2007, Health Grades, Inc. All Rights Reserved.
Slide 22: Strategic Health Solutions
Strategic Health Solutions • Health Management Suite (Since 2004) • Market Analytics Program (Created 2007) • Healthcare Credit Solutions (Expected to launch Q3-07) 22 ã Copyright 2007, Health Grades, Inc. All Rights Reserved.
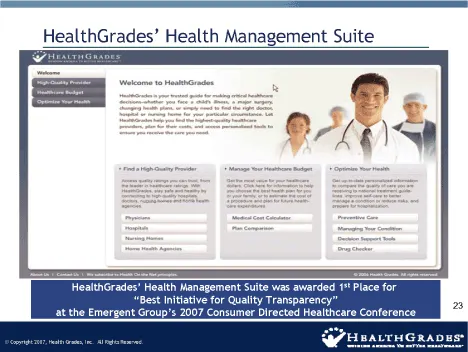
Slide 23: HealthGrades' Health Management Suite
HealthGrades’ Health Management Suite HealthGrades’ Health Management Suite was awarded 1 s t Place for “Best Initiative for Quality Transparency” 23 at the Emergent Group’s 2007 Consumer Directed Healthcare Conference ã Copyright 2007, Health Grades, Inc. All Rights Reserved.
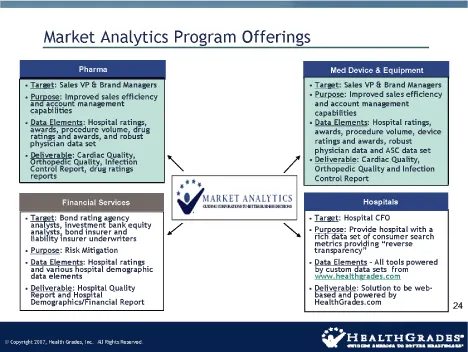
Slide 24: Market Analytics Program Offerings
Market Analytics Program Offerings Pharma Med Device & Equipment • Target: Sales VP & Brand Managers • Target: Sales VP & Brand Managers • Purpose: Improved sales efficiency • Purpose: Improved sales efficiency and account management and account management capabilities capabilities • Data Elements:
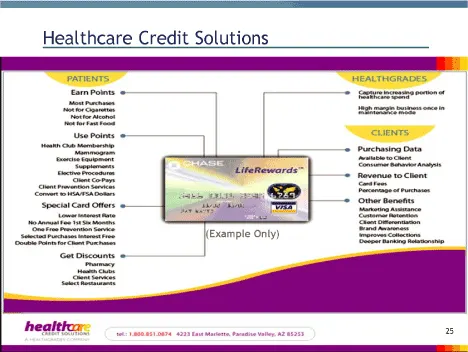
Slide 25: Healthcare Credit Solutions (Example Only)
Healthcare Credit Solutions (Example Only) 25
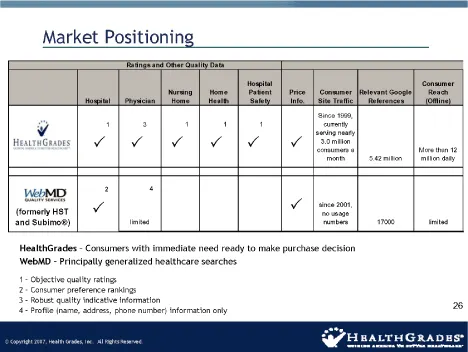
Slide 26: Market Positioning
Market Positioning Ratings and Other Quality Data Hospital Consumer Nursing Home Patient Price Consumer Relevant Google Reach Hospital Physician Home Health Safety Info. Site Traffic References (Offline) Since 1999, 1 311 1 currently serving nearly 3.0 million P P P P P P consumers a More than 12 mo
Slide 27: Appendix A Financial Information
Appendix A FINANCIAL INFORMATION 27 ã Copyright 2007, Health Grades, Inc. All Rights Reserved.
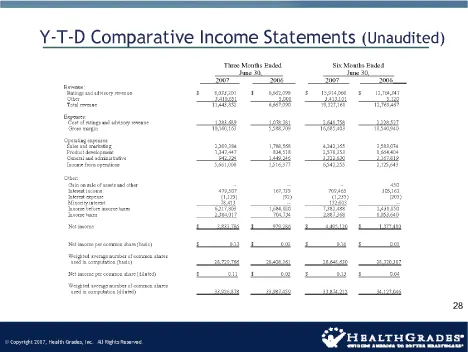
Slide 28: Y-T-D Comparative Income Statements (Unaudited)
Y-T-D Comparative Income Statements (Unaudited) Three Months Ended Six Months Ended June 30, June 30, 2007 2006 2007 2006 ___Revenue: Ratings and advisory revenue $ 8,033,2 01 $ 6,662,090 $ 15,914,060 $ 12,764,347 Other 3,4 10,651 5, 000 3,413,101 5,120 Total revenue 11,443,852 6,667,090 19,327,161
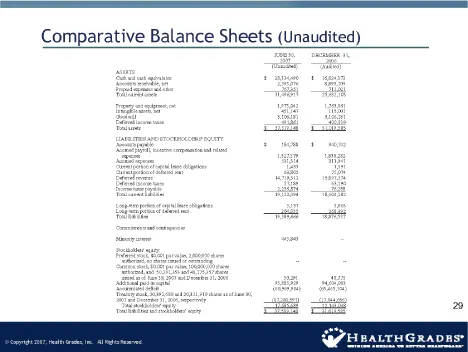
Slide 29: Comparative Balance Sheets (Unaudited)
Comparative Balance Sheets (Unaudited) JUNE 30, DECEMBER 31, 2007 2006 (Unaudited) (Audited) ASSETS Cash and cash equivalents $ 28,334,490 $ 16,024,373 Accounts receivable, net 2,395,076 8,8 95,709 Prepaid expenses and other 767,351 712,021 Total current assets 31,496,917 25,632,103 Property and equ

Slide 30: Guiding America to Better Healthcare
GUIDING AMERICA TO BETTER HEALTHCARE
Source: SEC EDGAR · 8-K filed Aug 9, 2007
More decks from Health Grades Inc
 Investor Presentation (May 2010)6 slides · May 12, 2010
 Investor Presentation (February 2010)21 slides · Feb 9, 2010
 Investor Presentation (July 2009)21 slides · Jul 28, 2009
 Investor Presentation (February 2009)21 slides · Feb 18, 2009
 Investor Presentation (June 2008)18 slides · Jun 17, 2008
 Investor Presentation (February 2008)39 slides · Feb 12, 2008