Ecosphere Technologies — Shareholder Meeting (December 2011)
62 slides from Ecosphere Technologies's shareholder meeting presentation, Dec 16, 2011
Slide 1: Solving the World's Water Challenges
Solving the World’s Water Challenges. © @COSPHERE TECHNOLOGIES INC.
Slide 2: Cautionary Statements Regarding Forward-Looking Information
Cautionary Statements Regarding (©) Forward-Looking Information ecosPHERE ‘This presentation contains forward-looking statements including statements regarding our financial outlook and projections for the fourth {quarter of 201 |,and 2012 including revenue, gross profit, cash flow and debt, increas
Slide 3
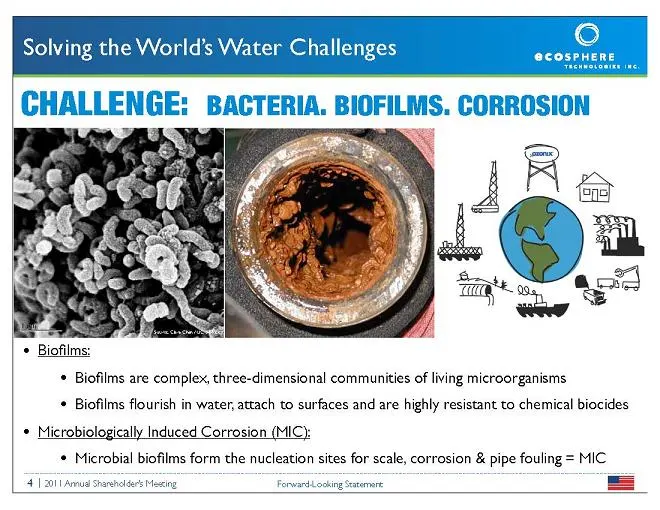
Slide 4: Biofilm and Microbiologically Induced Corrosion
“Solving the Wo * Biofilm: * Biofilms are complex, three-dimensional communities of living microorganisms * Biofilms flourish in water, attach to surfaces and are highly resistant to chemical biocides logically Induced Corrosion (MIC) * Microbial biofilms form the nucleation sites for scale, corrosi
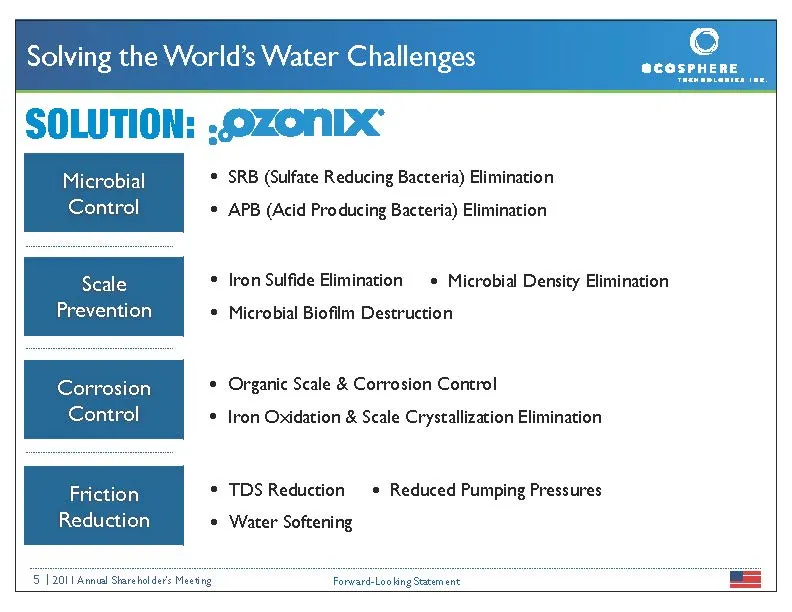
Slide 5: Solution: Microbial Control, Scale Prevention, Corrosion Control
SOLUTION: ; Microbial © Control . Scale Prevention . Corrosion Control . Friction Reduction . 5.1201 Arnal Shareholders Meeting SRB (Sulfate Reducing Bacteria) Elimination APB (Acid Producing Bacteria) Elimination Iron Sulfide Elimination» Microbial Density Elimination Microbial Biofilm Destruction
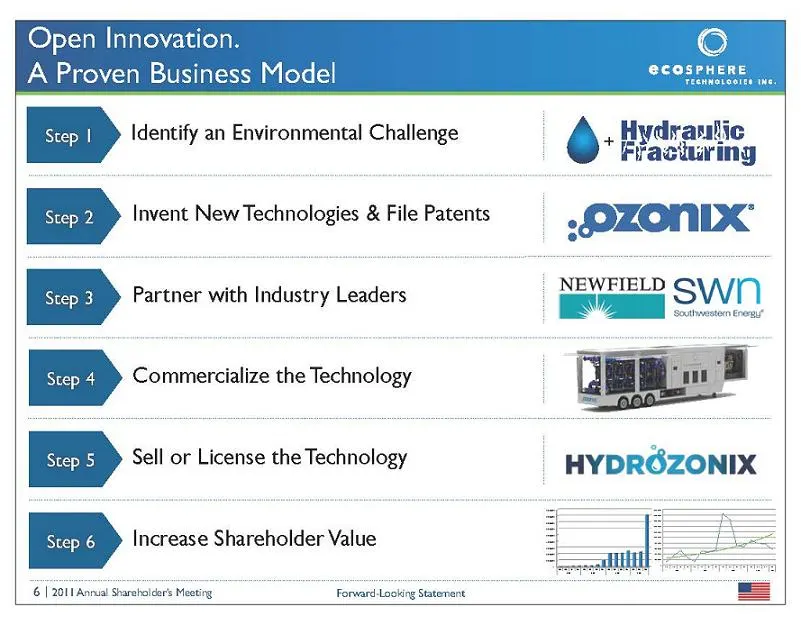
Slide 6: Open Innovation: A Proven Business Model
Open Innovation. A Proven Business Model Identify an Environmental Challenge Invent New Technologies & File Patents ;PZONDT Partner with Industry Leaders a FIELD OVI) VM os Commercialize the Technology P| Oia Sell or License the Technology i HYDRGZONIX Increase Shareholder Value 6 | 2011 Annual Shar
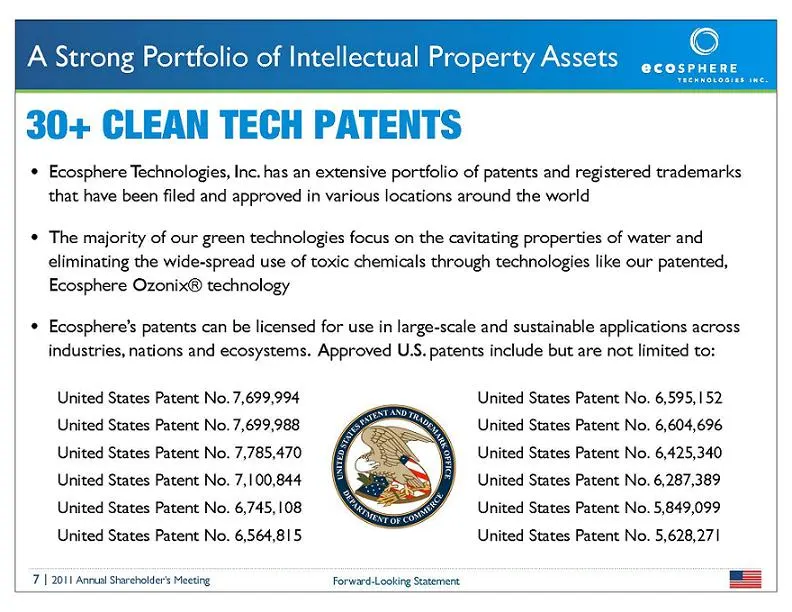
Slide 7: A Strong Portfolio of Intellectual Property Assets
e) @COSPHERE A Strong Portfolio of Intellectual Property Assets 30+ CLEAN TECH PATENTS * Ecosphere Technologies, Inc. has an extensive portfolio of patents and registered trademarks that have been filed and approved in various locations around the world ‘* The majority of our green technologies focu
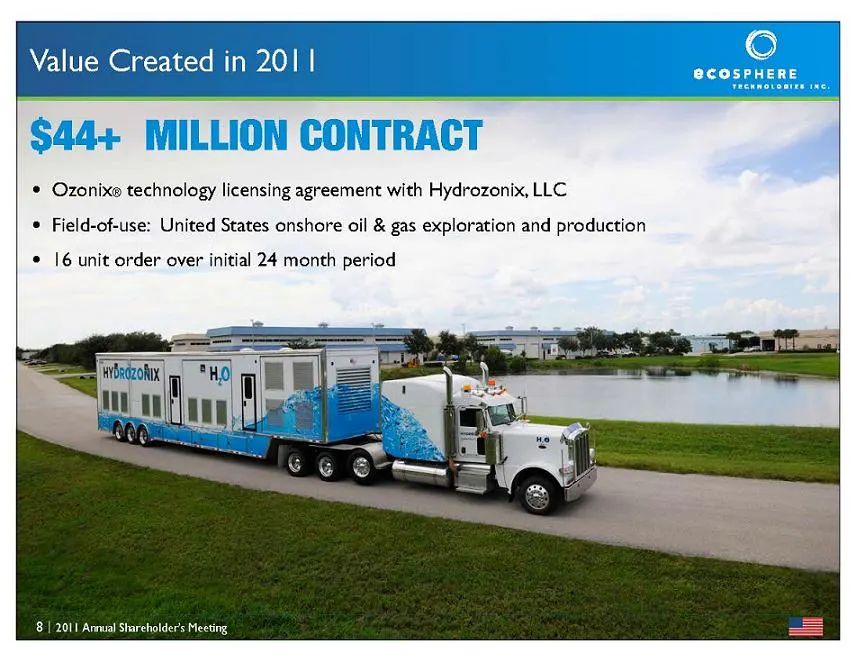
Slide 8: Ozonix technology licensing agreement with Hydrozonix, LLC
* Ozonixe technology licensing agreement with Hydrozonix, LLC © Field-of-use: United States onshore oil & gas exploration and production © 16 unit order over initial 24 month period 8 | 2011 Arma Shareholders Meeting
Slide 9: Value Created in 2011
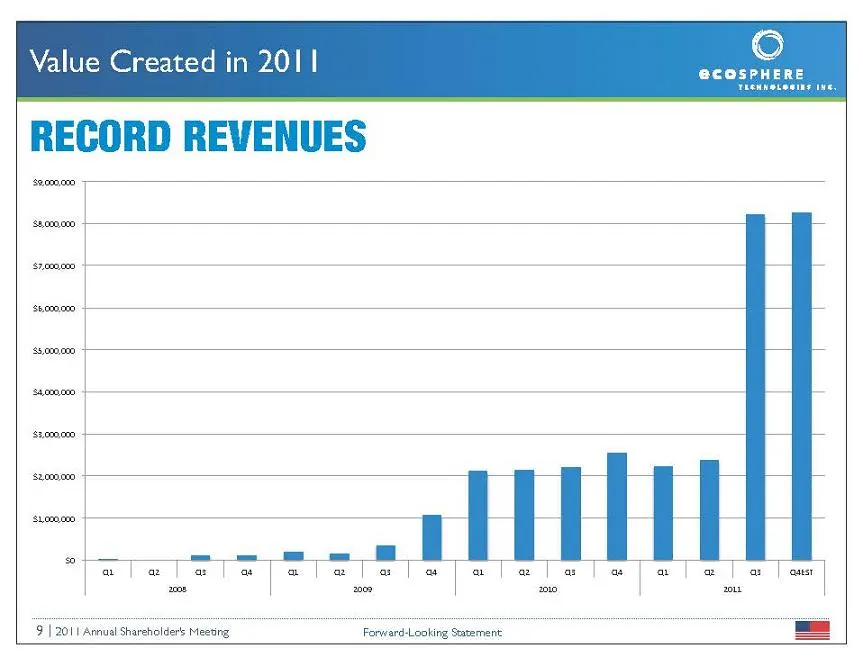
Value Created in 2011 RECORD REVENUES 9 | 2011 Annual Shareholder’ Meeting. Forward-Looking Statement
Slide 10: Value Created in 2011: Industry Acceptance, Public Recognition
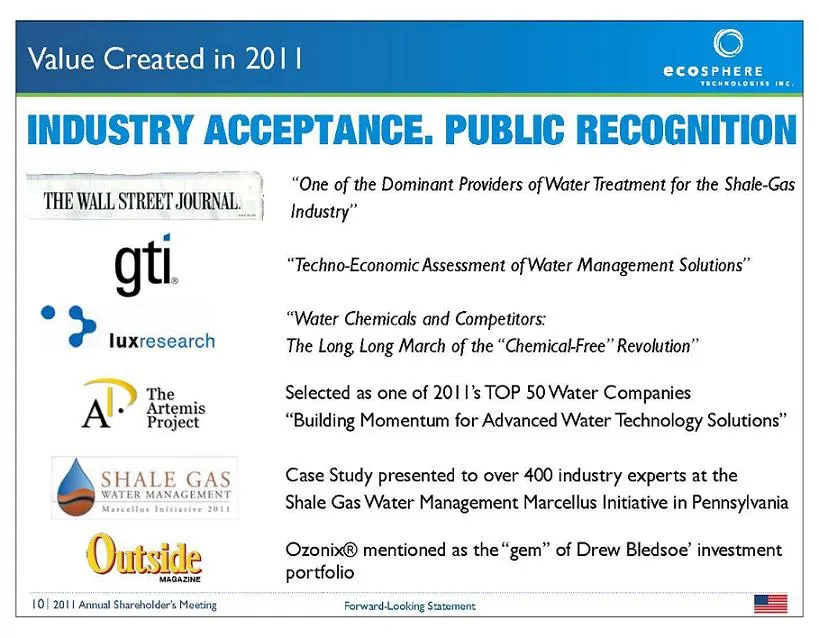
© Value Created in 201 | ecosPHene INDUSTRY ‘ACCEPTANCE. PUBLIC RECOGNITION THE WALLS STREET JOURNAL gti e > luxresearch SHALE GAS ATER MANAGEMENT 10| 2011 Annual Shareholders Mecting \ “One of the Dominant Providers of Water Treatment for the Shale-Gas -| Industry” “Techno-Economic Assessment of Wa
Slide 11: Fastest Growing Technology Companies
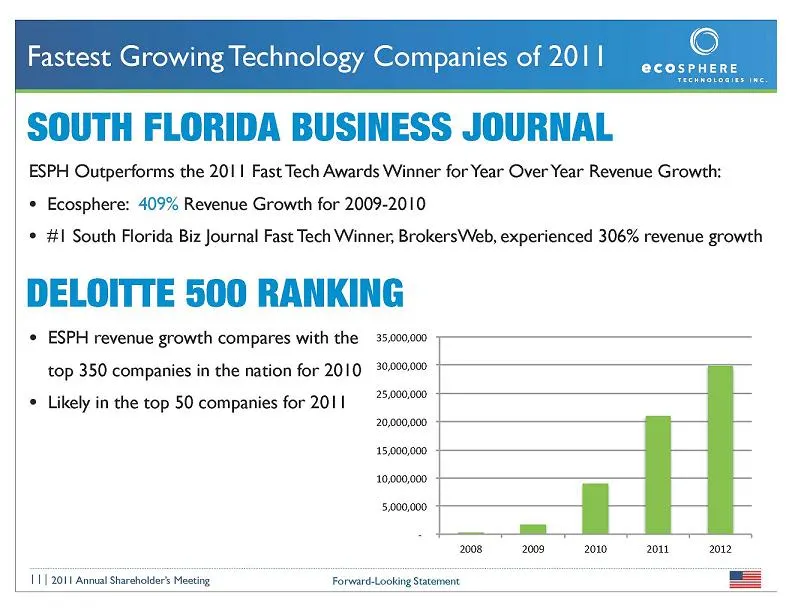
Fastest Growing Technology Companies of 201 | SOUTH FLORIDA BUSINESS JOURNAL ESPH Outperforms the 2011 Fast Tech Awards Winner for Year Over Year Revenue Growth: * Ecosphere: 409% Revenue Growth for 2009-2010 * #1 South Florida Biz Journal Fast Tech Winner, BrokersWeb, experienced 306% revenue growt
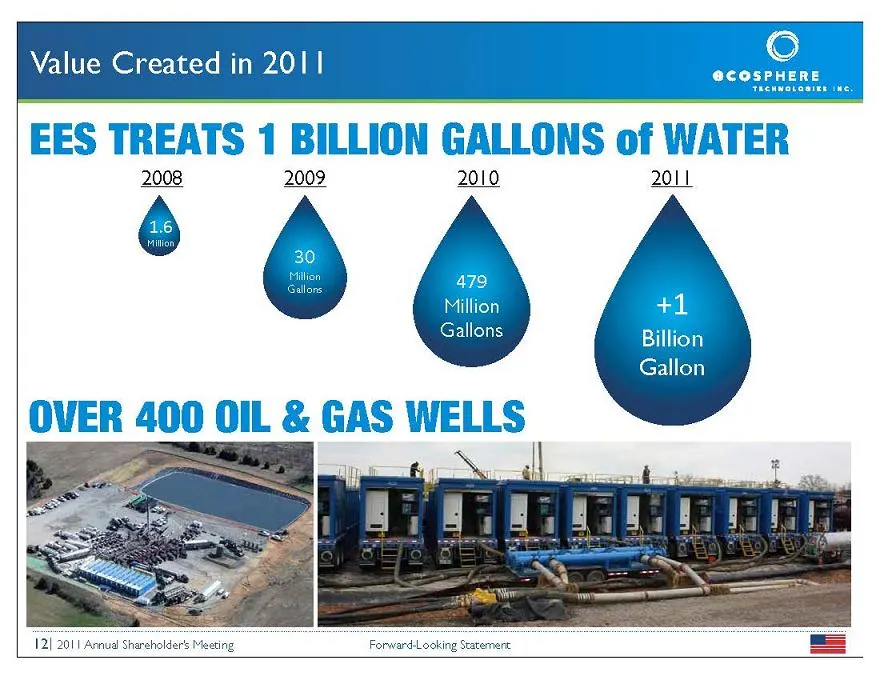
Slide 12: 12| 2011 Annual Shareholders Meeting Forward.Looking Sratemere
12| 2011 Annual Shareholders Meeting Forward.Looking Sratemere
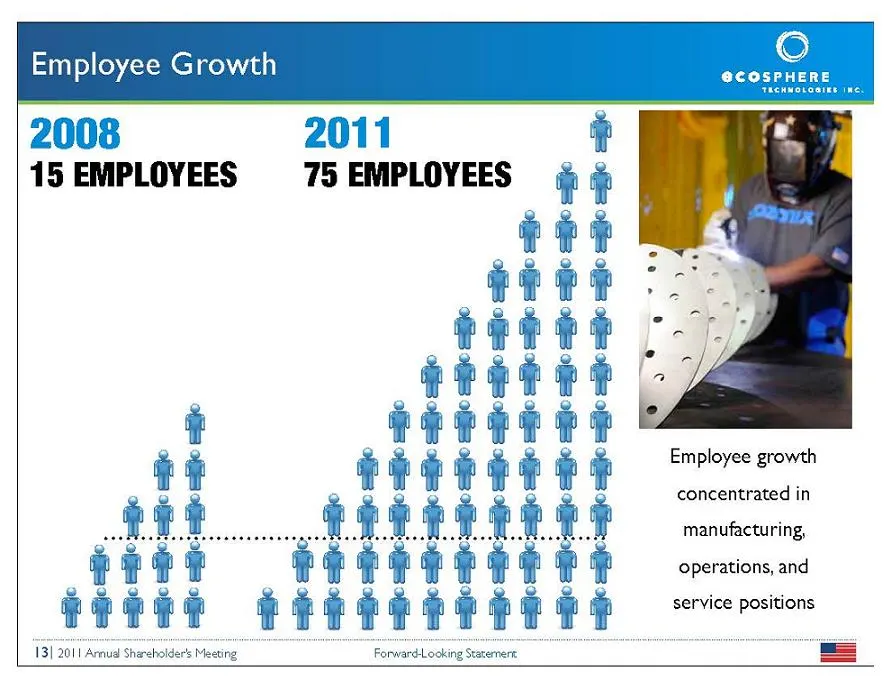
Slide 13: Employees
75 EMPLOYEES Employee growth concentrated in manufacturing, operations, and ae? sic me = K service positions ForwardLod
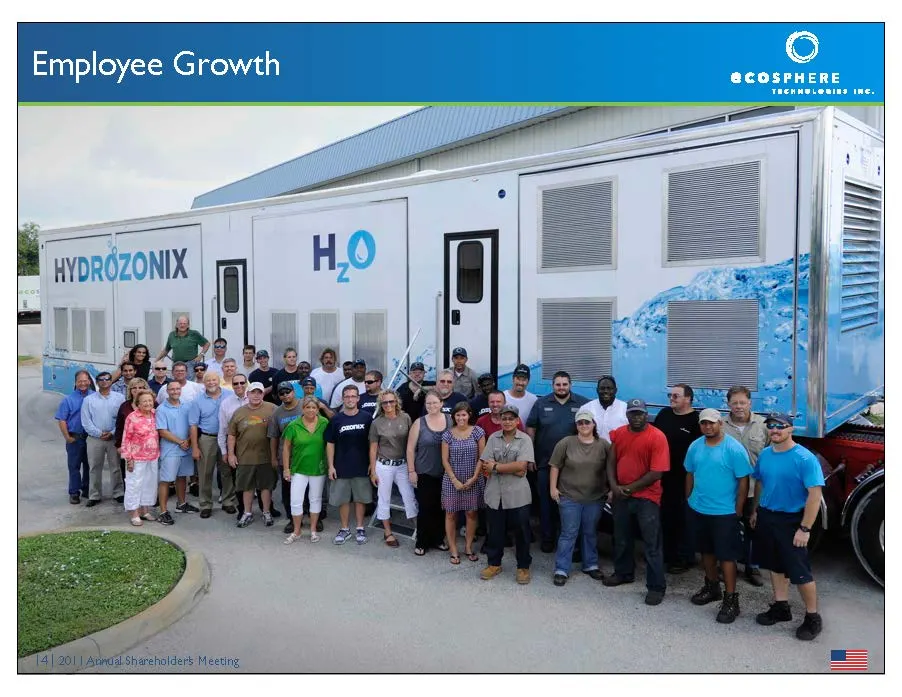
Slide 14: Employees
Empl
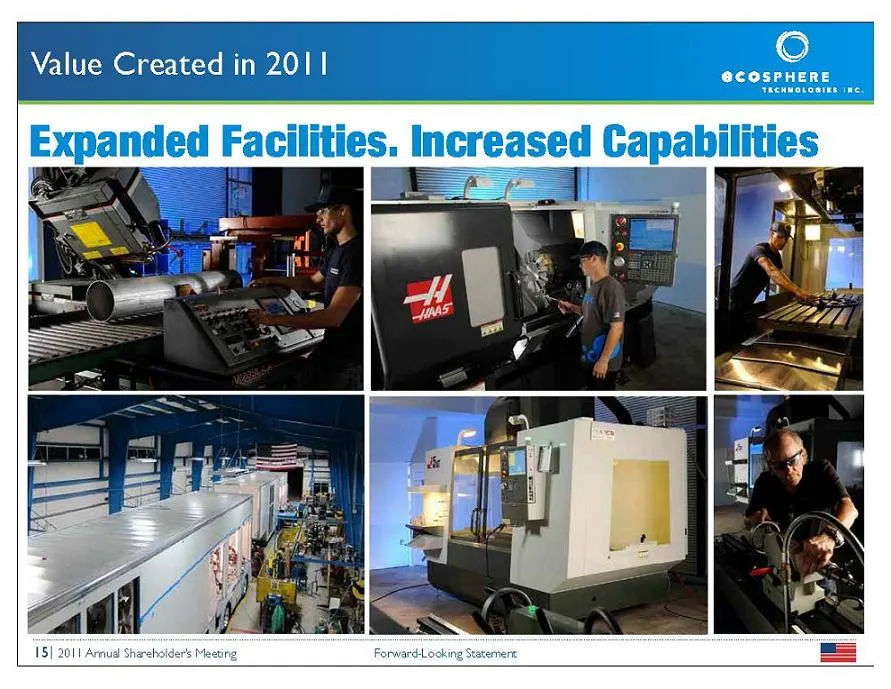
Slide 15
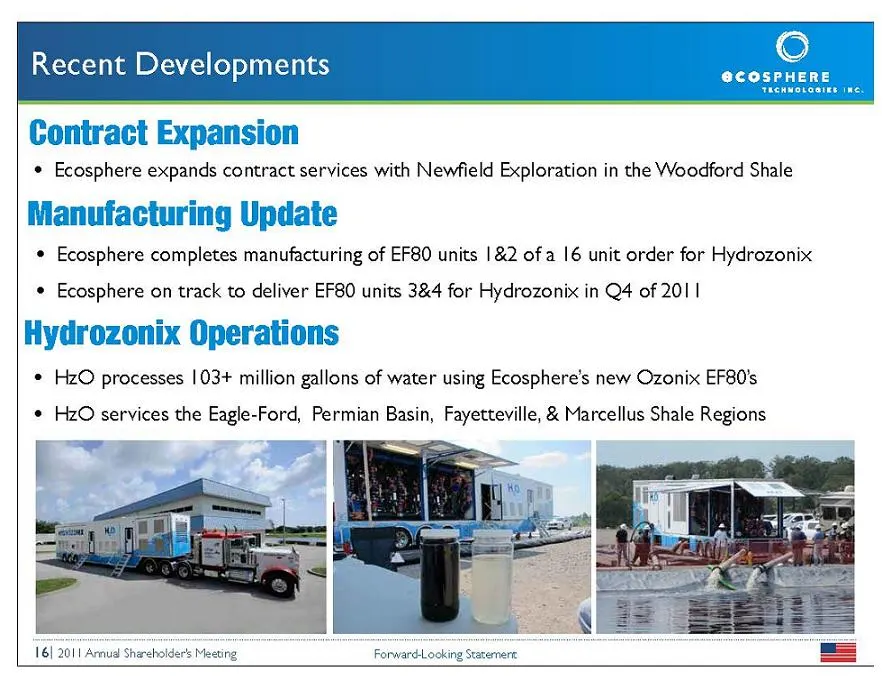
Slide 16: Recent Developments
Recent Developm * Ecosphere completes manufacturing of EF80 units | &2 of a 16 unit order for Hydrozonix * Ecosphere on track to deliver EF80 units 3&4 for Hydrozonix in Q4 of 2011 * HzO processes |03+ million gallons of water using Ecosphere’s new Ozonix EF80's ¢ HzO services the Eagle-Ford, Permia
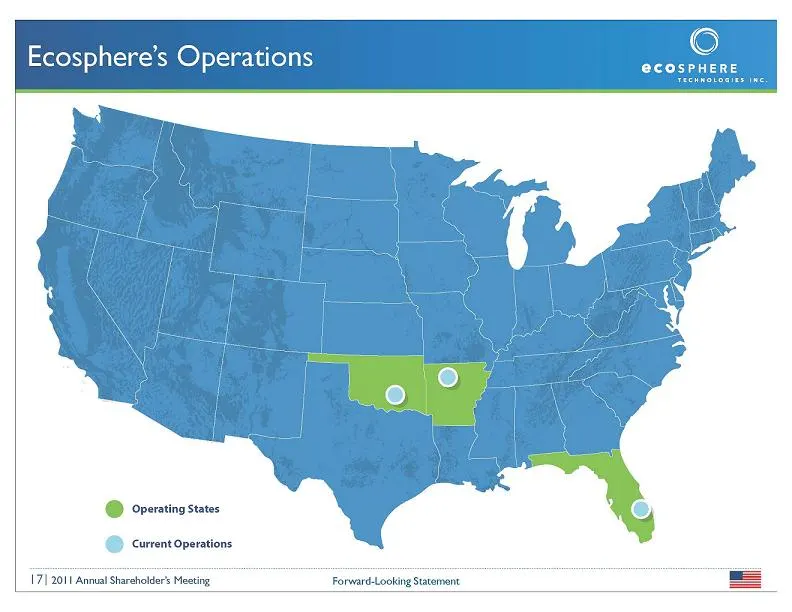
Slide 17: Ecosphere's Operations
© @COSPHERE Ecosphere’s Operations @© orerating states @ current operations 17| 2011 Anmual Shareholders Mesting Forward-Looking Statement
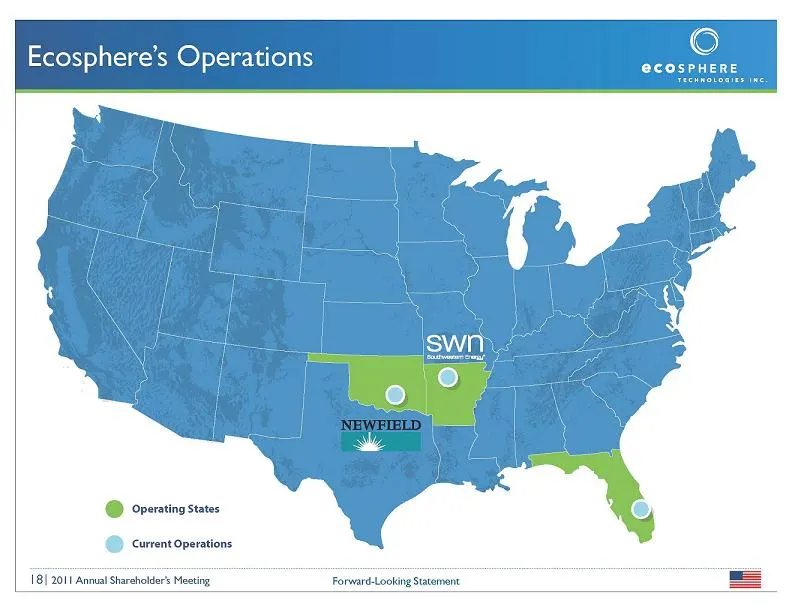
Slide 18: Ecosphere's Operations
© @COSPHERE Ecosphere’s Operations @© orerating states @ current operations 18| 2011 Annual Shareholders Meeting Forward-Looking Statement
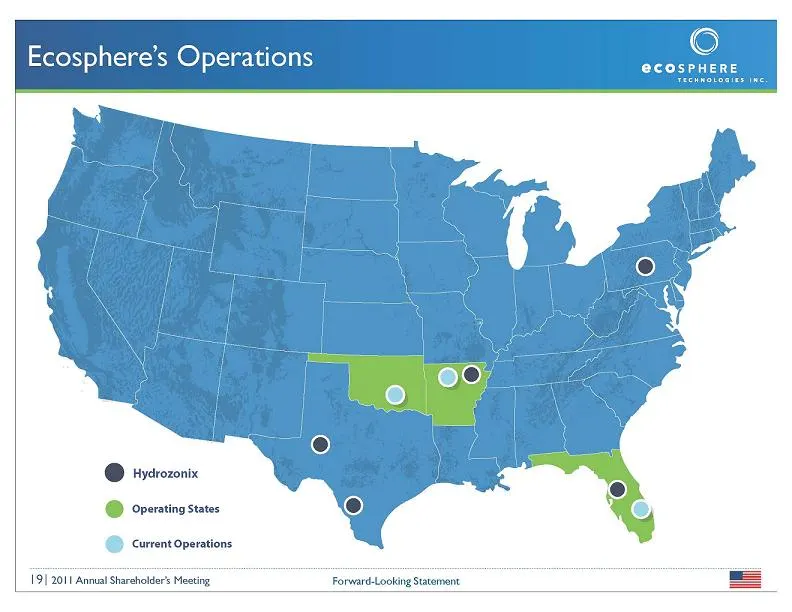
Slide 19: Ecosphere's Operations
Ecosphere’s Operations @ Hydrozonix @ operating states © current operations 19] 2011 Anmual Shareholders Mestng Forward-Looking Statement © @COSPHERE
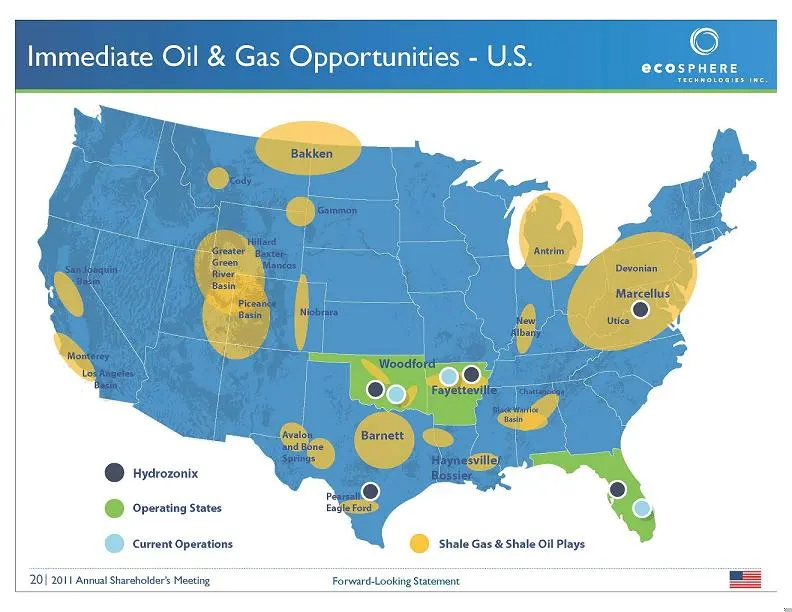
Slide 20: Immediate Oil & Gas Opportunities
© Immediate Oil & Gas Oppo @COSPHERE @ Hydrozonix @ operating states @ carent operations Shale Gas & Shale Oi Plays 20| 2011 Anmual Shareholders Mectng Forward-Looking Statement
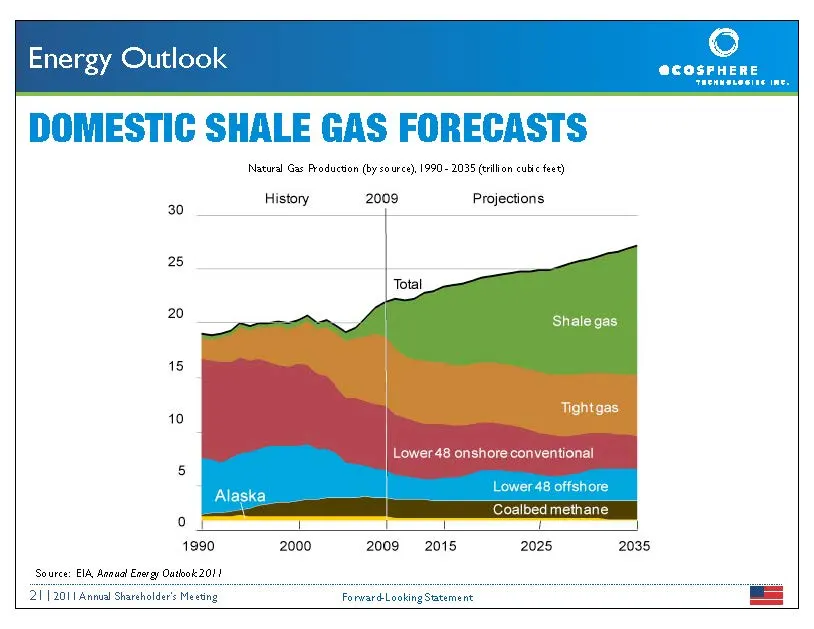
Slide 21: Energy Outlook: Domestic Shale Gas Forecasts
Energy Outlook DOMESTIC SHALE GAS FORECASTS Natural Gar Production (by soures) 1990-2035 (elon cule fees) History 2009 Projections 30 ; 25 20 Shale gas 15 Tightgas 10 aie Lower 48 onshore conventional 5 Lower 48 offshore Coalbed methane 0 1990 2000 2009 2015 2025 2035 Source: EIA Aanaal Energy Outho
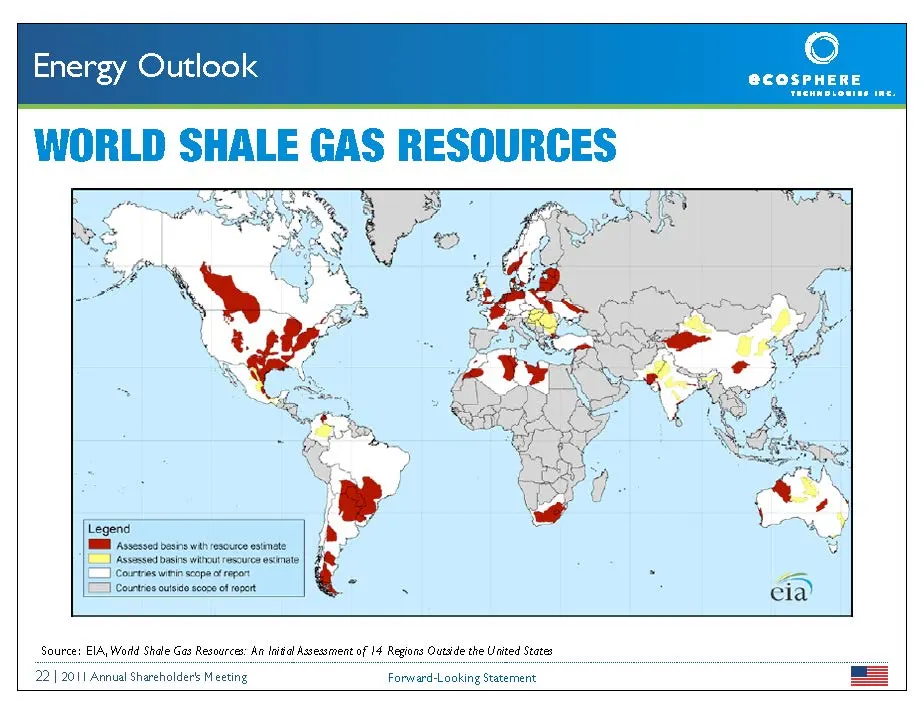
Slide 22: Energy Outlook: World Shale Gas
© Energy Outlook WORLD abALE daniel BESWIADES @COSPHERE Source: EIA, Wodld Shale Gas Resources: An Inital Assessment of 14 Regions Outside the United States 22 | 2011 Annual Shareholders Meeting Forward-Looking Statement
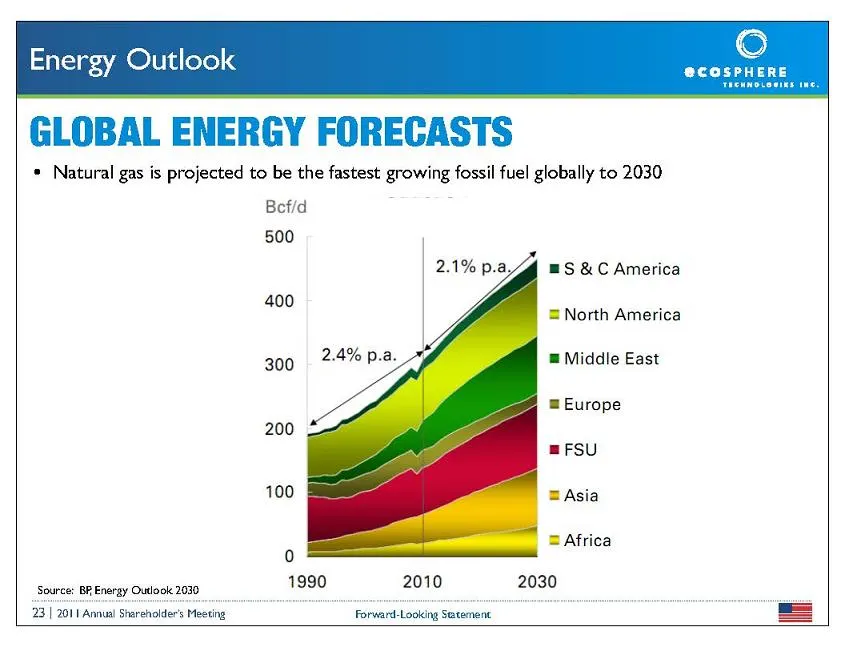
Slide 23: Energy Outlook: Global Energy Forecasts
Energy Outlook GLOBAL ENERGY FORECASTS * Natural gas is projected to be the fastest growing fossil fuel globally to 2030 Befld 500 mS &C America 400 ' = North America 300 = Middle East = Europe 200 =FSU 100 BAsia B Africa 0 1990 2010 2030 Source: BR Energy Outlook 2030 23 | 2011 Annus Shareholder's
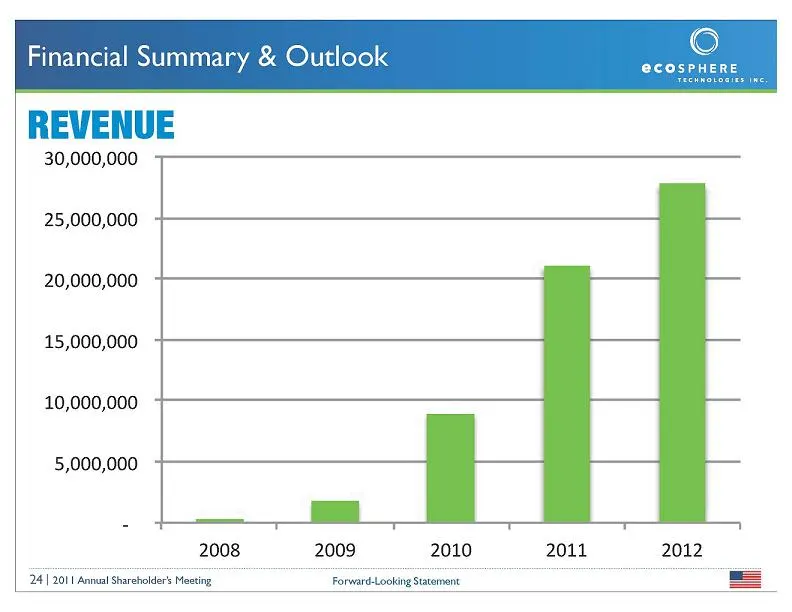
Slide 24: Financial Summary & Outlook: Revenue
© & Outlook ecosrHerE one 25,000,000 20,000,000 15,000,000 10,000,000 5,000,000 ! 2008 2009 2010 2011 2012 24 | 2011 Annual Shareholder’s Meeting. Forward-Looking Statement. =
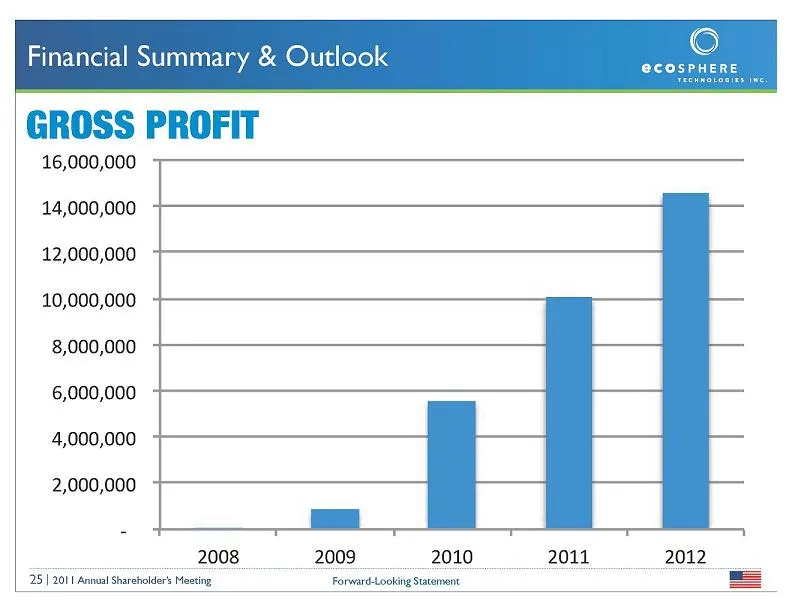
Slide 25: Financial Summary & Outlook: Gross Profit
re) Financial Summary & Outlook GROSS PROFIT 16,000,000 @COSPHERE 14,000,000 12,000,000 10,000,000 8,000,000 6,000,000 4,000,000 2,000,000 EA 2011 _2008 2009. 2010 2011 2012 25] 201| Annual Shareholders Mesting Forward-Looking Statement =
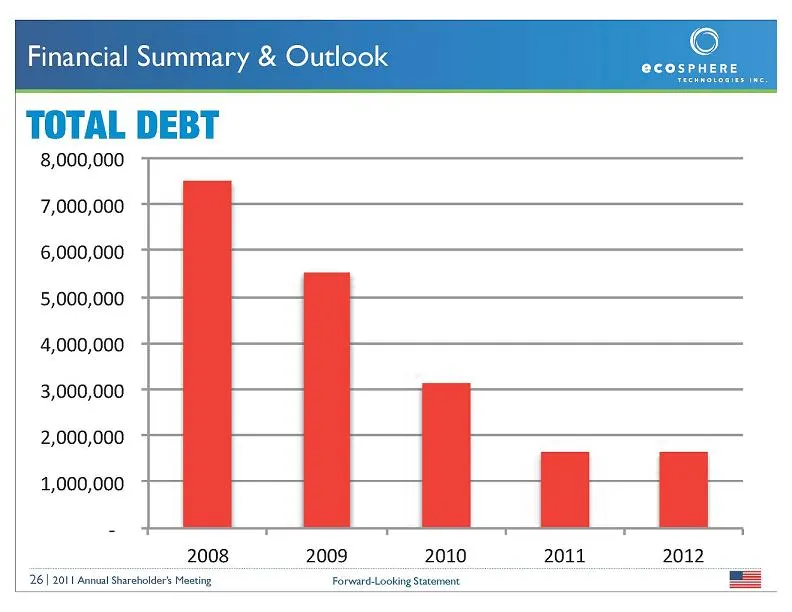
Slide 26: Total Debt
re) @COSPHERE TOTAL DEBT 8,000,000 7,000,000 6,000,000 5,000,000 4,000,000 3,000,000 2,000,000 1,000.00 7 | 2008 2009 2010 26 | 2011 Annual Shareholders Meeting Forward-Looking Statement
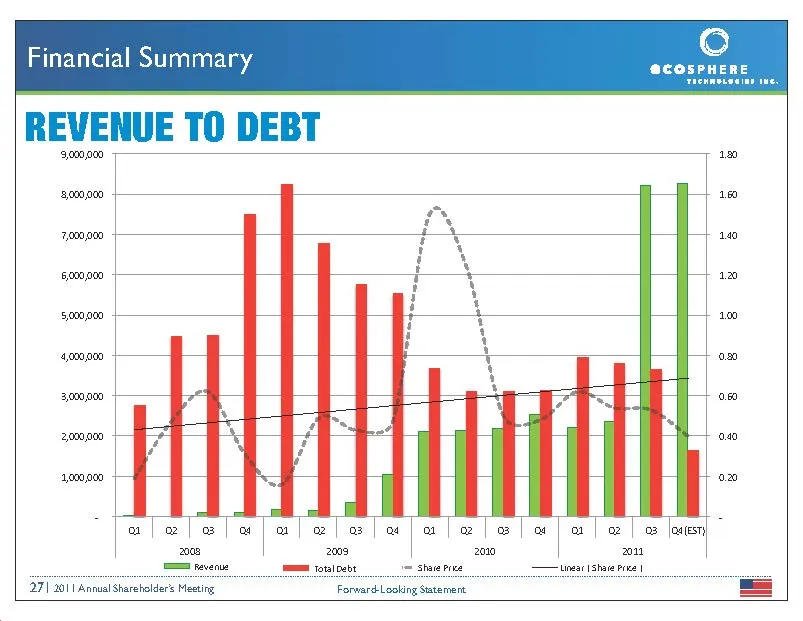
Slide 27: Financial Summary: Revenue to Debt
Financial Summary REVENUE TO DEBT 3.000 000 aa 3,000,000 zo0100 sox1000 soma «4,000,000 300000 2ooo00 4400000 a revenue mm otal ett ve shave rene twas |store Pena | 27 | 201 | Annual Shareholders Mestirg Forward-Looking Statement =
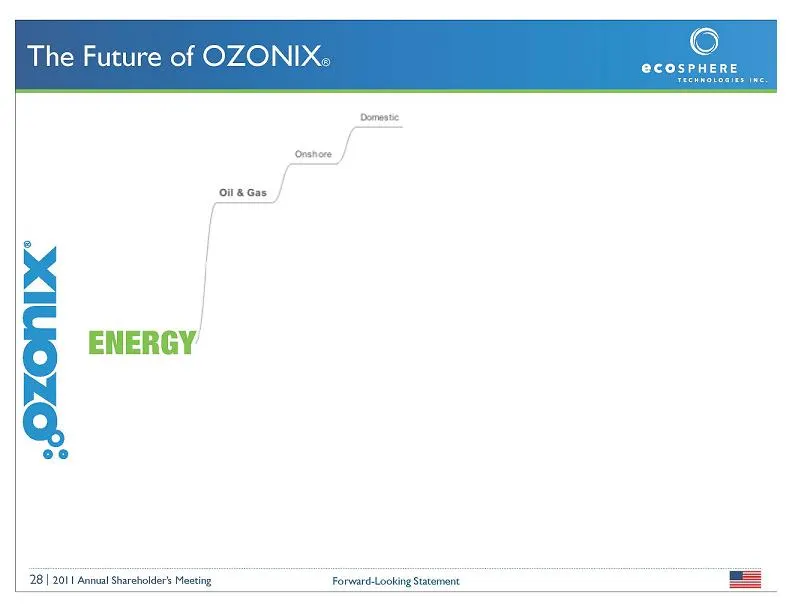
Slide 28: The Future of Ozonix
The Future of OZONIX. 28 | 201| Annual Shareholders Mesting Forward-Looking Statement =
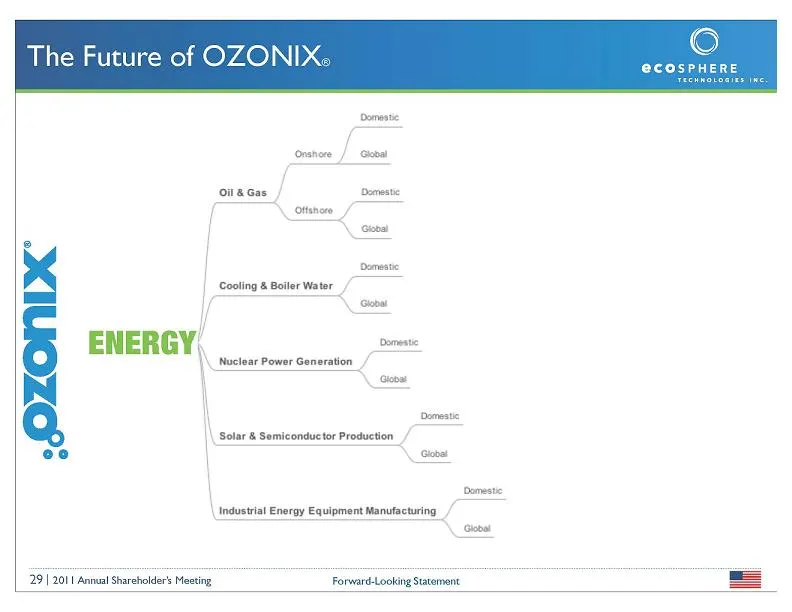
Slide 29: The Future of Ozonix: Applications
The Future of OZONI | | cooling & Boiler Water _/ —— Kee = 5 EMERY, ‘i | demesti \ Solar & Semiconductor Production / eo | < uta | \ umes Industrial Energy Equipment Manufacturing _/ \ _Giobat 29] 201| Annual Shareholders Mesting Forward-Looking Statement =
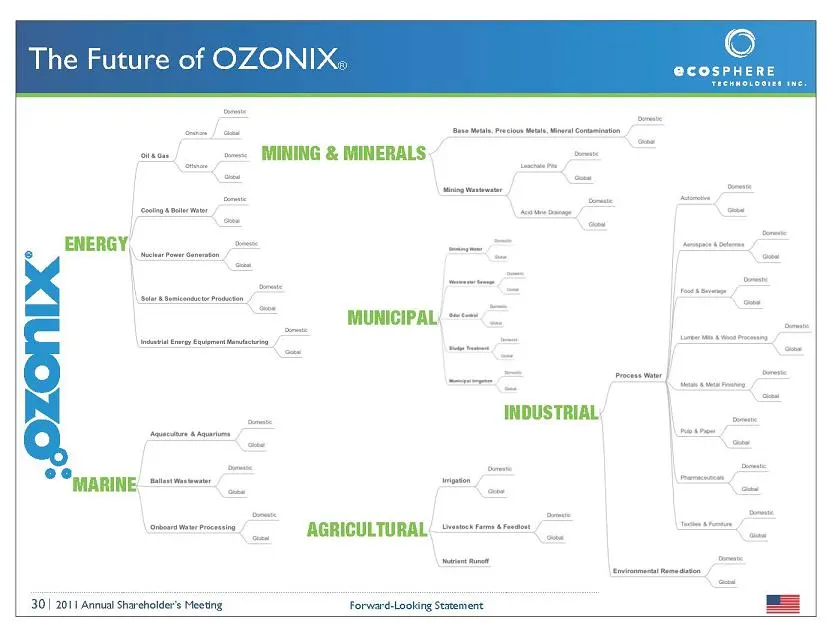
Slide 30: The Future of Ozonix
The Future of OZONIX: 30 | 2011 Annual Shareholder’s Meeting Forward-Looking Statement =
Slide 31
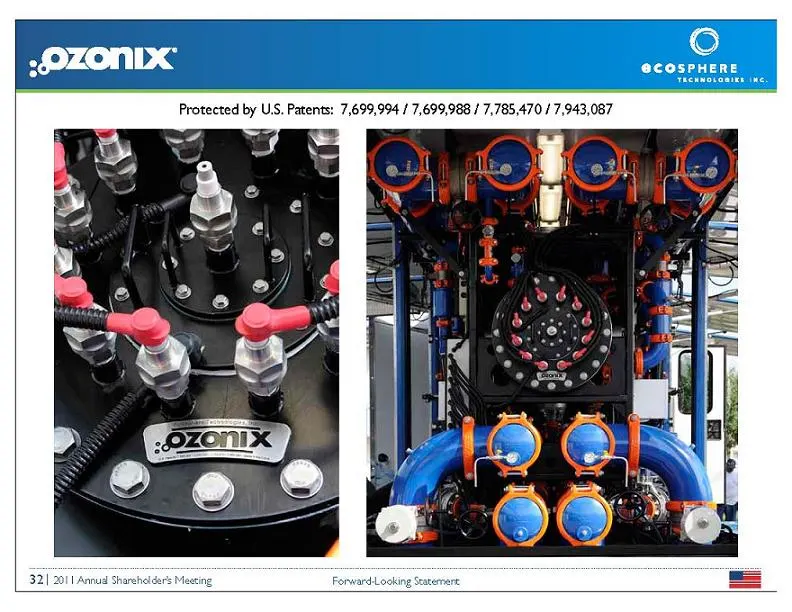
Slide 32
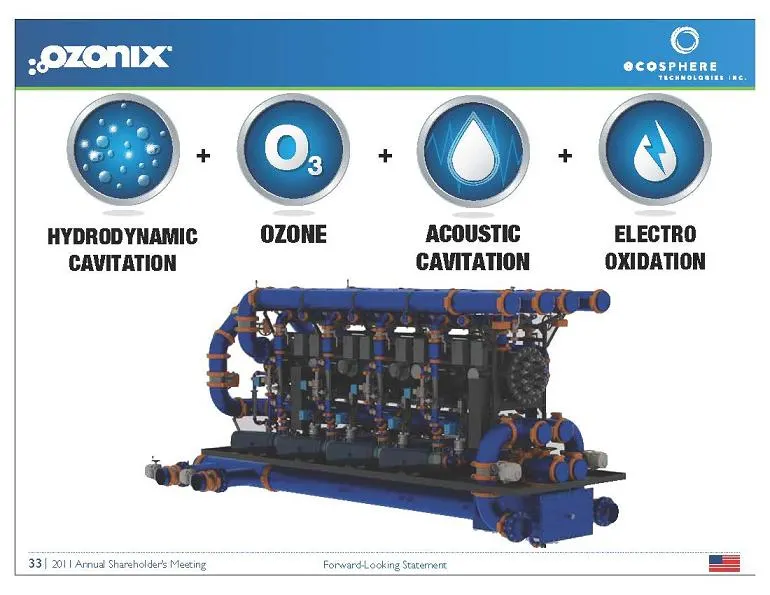
Slide 33: Hydrodynamic Cavitation, Ozone, Acoustic Cavitation, Electro Oxidation
HYDRODYNAMIC CAVITATION 33) 201 Arnud Shareholders Mesting p O + L 0] OZONE ACOUSTIC ELECTRO CAVITATION OXIDATION
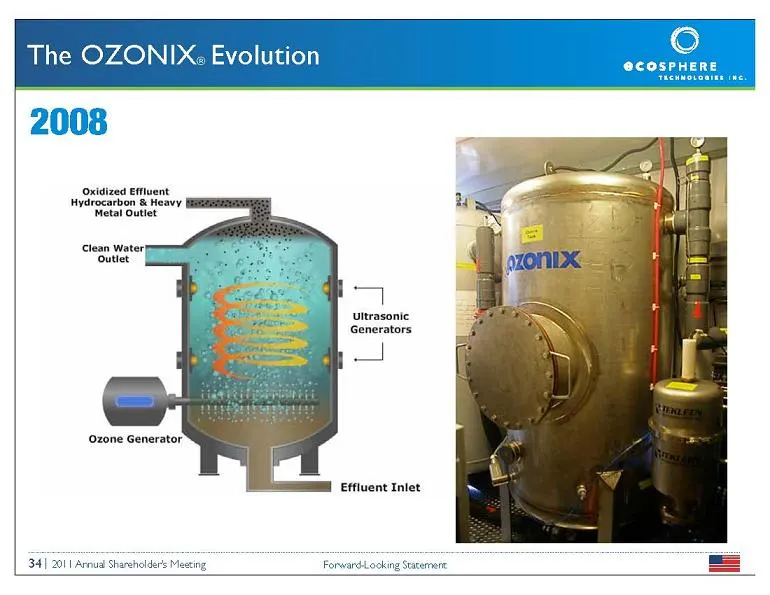
Slide 34: Oxidized Effluent Process Diagram
Oxidized Effluent Hydrocarbon & Heavy ‘Metal Outlet al uttrasonic Generators L ‘zone Generator Effluent Inlet 34 | 201 | Arrud Shareholders ard-Locking Statement.
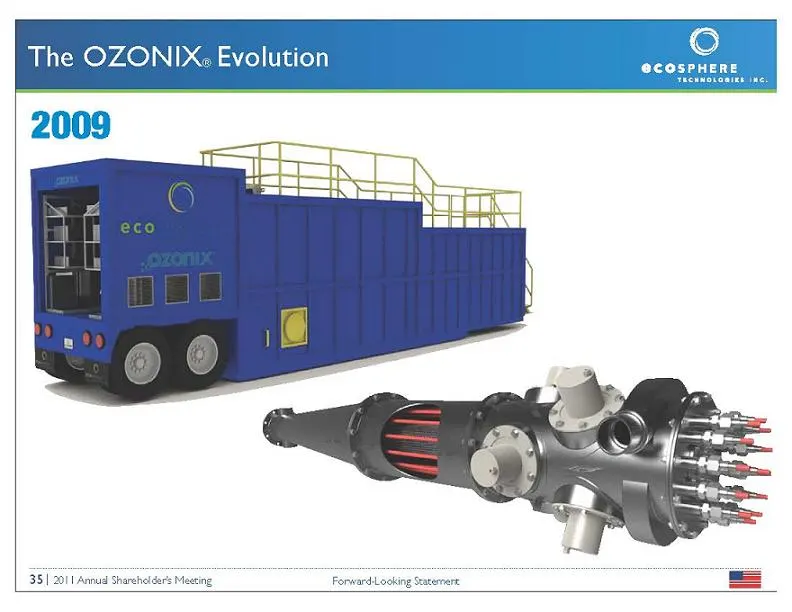
Slide 35: The Ozonix
The OZONIX: 35 | 2011 Annud Sharehelders Meeting Forward-Looking Seaternert =
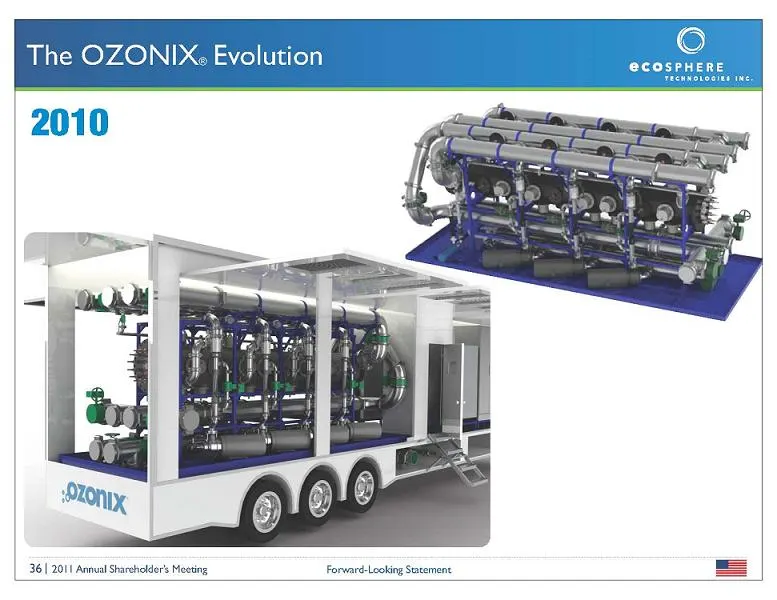
Slide 36: The Ozonix
The OZON 36 | 201 Annual Sharsholder’s Meeting Forward-Looking Satement
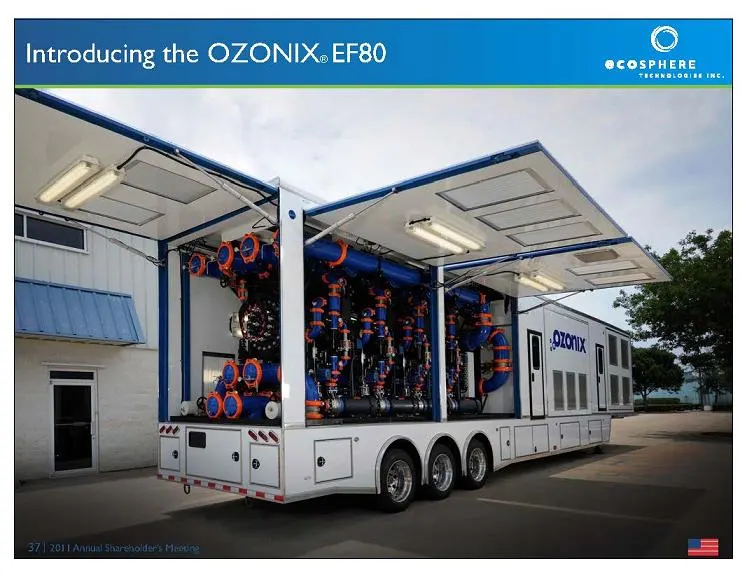
Slide 37
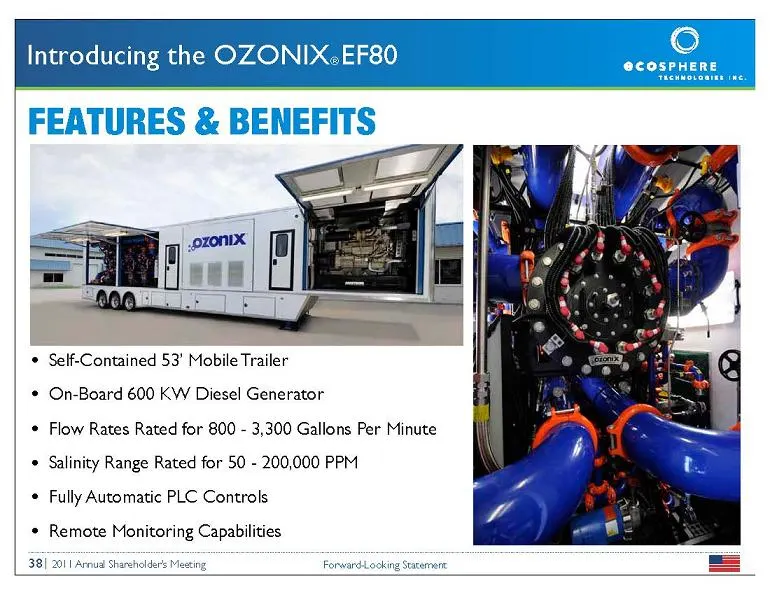
Slide 38: Self-Contained 53' Mobile Trailer
* Self-Contained 53' Mobile Trailer * On-Board 600 KW Diesel Generator * Flow Rates Rated for 800 - 3,300 Gallons Per Minute * Salinity Range Rated for 50 - 200,000 PPM * Fully Automatic PLC Controls * Remote Monitoring Capabilities 38| 201 | Arnud Shareholders Mesting Forward ooking Staernert
Slide 39: Ecosphere Energy Services, LLC
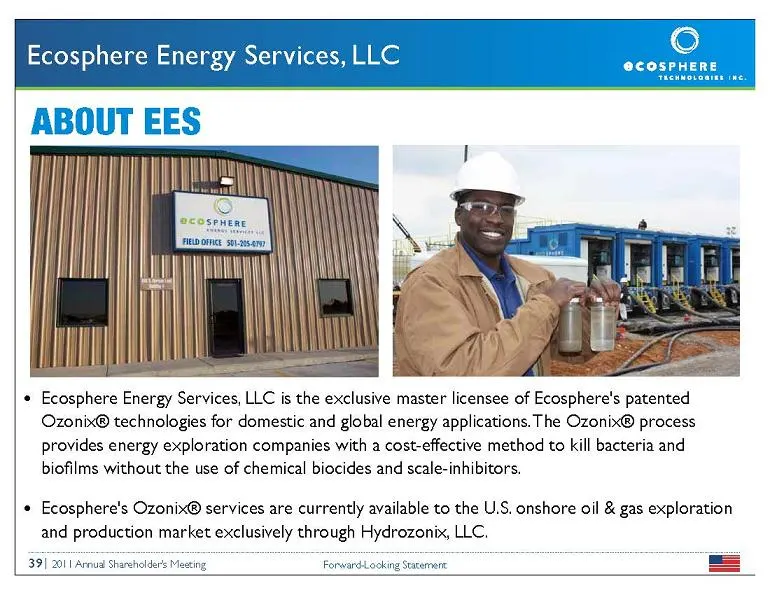
© Ecosphere Energy Services, LLC ABOUT EES Hl @COSPHERE * Ecosphere Energy Services, LLC is the exclusive master licensee of Ecosphere's patented Ozonix® technologies for domestic and global energy applications, The Ozonix® process provides energy exploration companies with a cost-effective method t
Slide 40: Hydraulic Fracturing - The Facts
(©) @COSPHERE Hydraulic Fracturing - The Facts Hydraulic Fracturing
Slide 41: Hydraulic Fracturing - The Facts
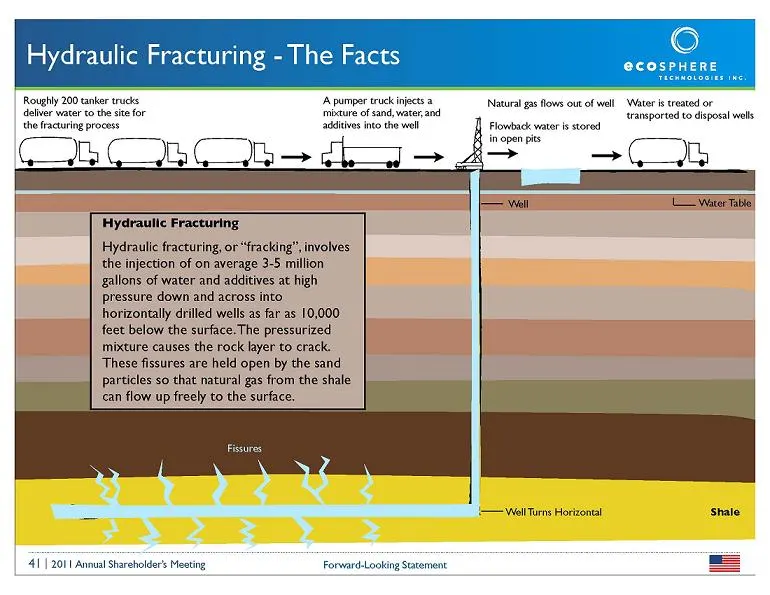
Hydraulic Fracturing - The Facts wee Roughly 200 tanker trucks ‘A pump truck injects 3 [Natural ga flown out of well Water treated or dalver water to the site for rmbaure of sand, water and traheportad to dspocal wos: the fracturing process additives inco the wel Flowback water i stored ee ee Hydrau
Slide 42: Hydraulic Fracturing - The Facts
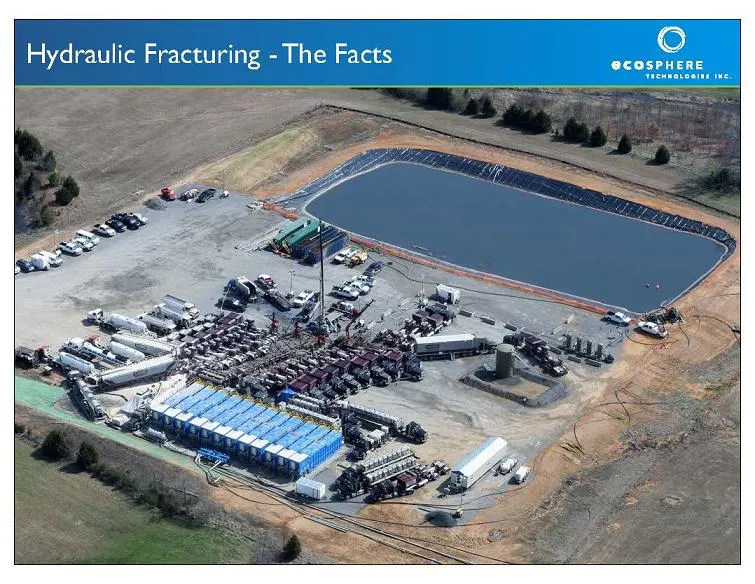
Hydraulic Fracturing - The Facts
Slide 43: Water Usage Demand in Arkansas
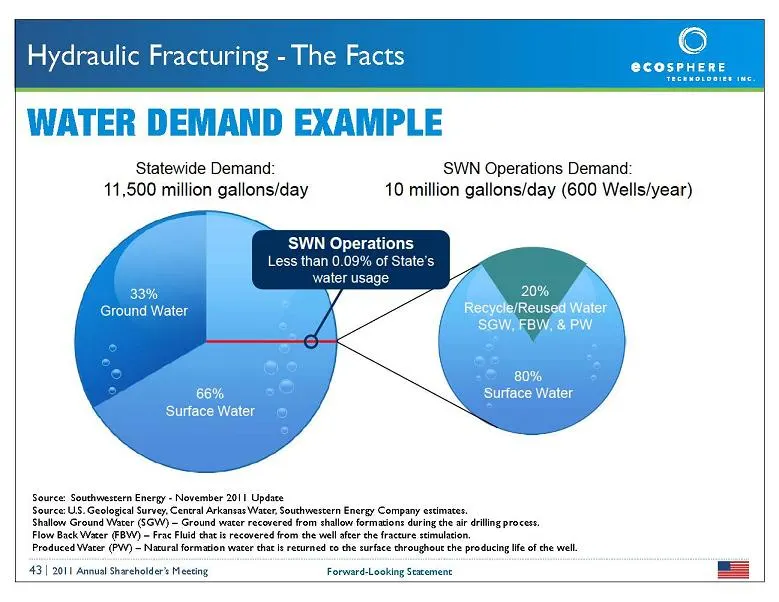
AND EXA Statewide Demand: ‘SWN Operations Demand: 11,500 million gallons/day 10 million gallons/day (600 Wells/year) WN Operations Less than 0.09% of State's water usage Source: Southwestern Energy = November 2011 Updace Source: US. Geological Survey. General Arkansas Water, Southwestern Energy Comp
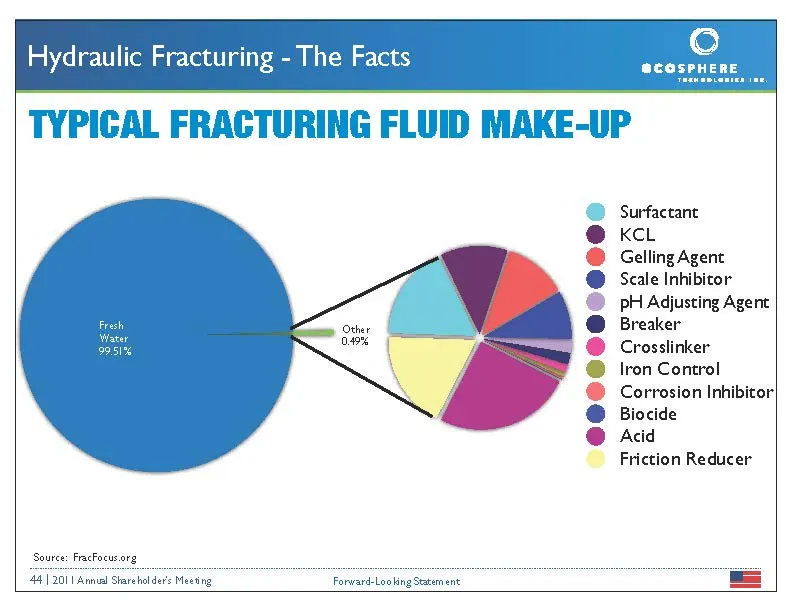
Slide 44: Typical Fracturing Fluid Make-Up
Hydraulic Fractu TYPICAL FRACTURING FLUID MAKE-UP Surfactant KCL Gelling Agent Scale Inhibitor pH Adjusting Agent Breaker Crosslinker @® Iron Control Corrosion Inhibitor| Biocide @ Acid Friction Reducer Source: FracFocur.org 44 | 2011 Annual Shareholders Meeting Forward-Looking Statement =
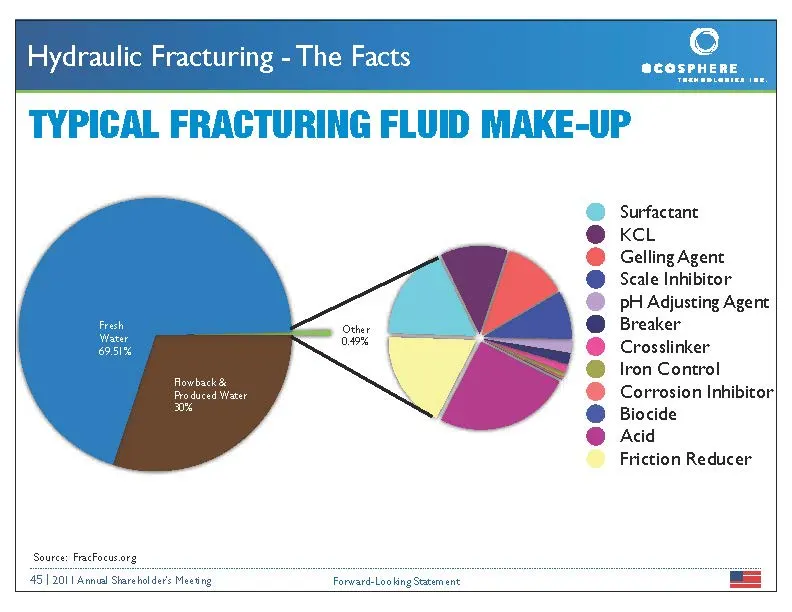
Slide 45: Typical Fracturing Fluid Make-Up
Surfactant KCL Gelling Agent Scale Inhibitor pH Adjusting Agent Breaker Crosslinker Iron Control Corrosion Inhibitor| Biocide Acid Friction Reducer Source: FracFocurorg 45 | 2011 Annual Shareholders Meeting Forward-Looking Statement
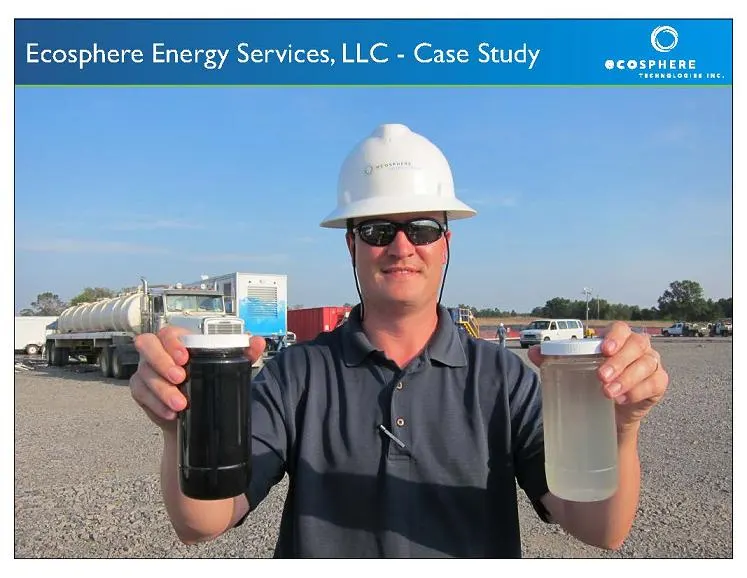
Slide 46: Ecosphere Energy Services, LLC - Case Study
Ecosphere Energy Services, LLC - Case Study
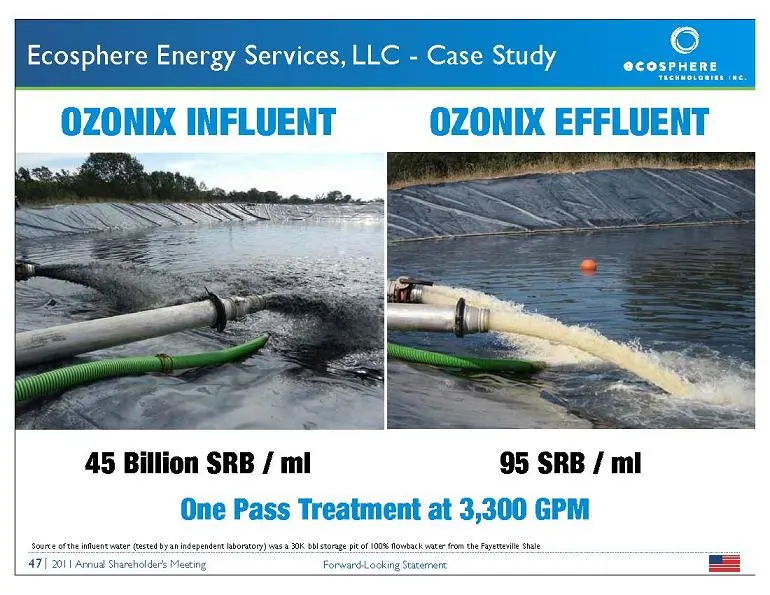
Slide 47: SRB per ml Case Study Results
45 Billion SRB / ml 95 SRB / ml Un Sov fie ine ve use nee roy 2K eg 1D tna me pee Se 47 2011 Arnuad Shareholders Meeting ForwardéLocking Seacerere
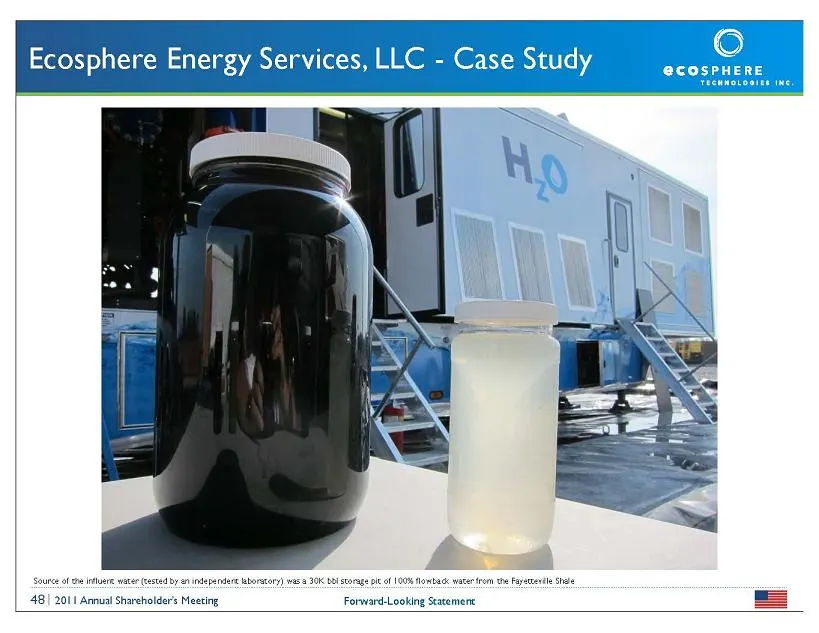
Slide 48
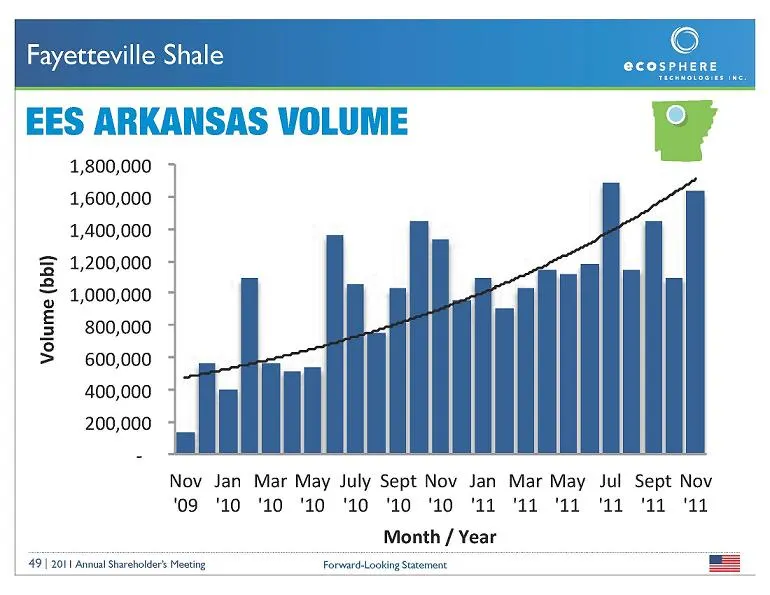
Slide 49: Fayetteville Shale
Fayetteville Shale EES ARKANSAS VOLUME ° 1,800,000 1,600,000 1,400,000 1,200,000 1,000,000 800,000 600,000 400,000 200,000 Volume (bbl) Nov Jan Mar May July Sept Nov Jan Mar May Jul Sept Nov ‘o9 '10 ‘10 '10 ‘10 '10 ‘10 ‘11 ‘11 ‘12 ‘11 ‘11 ‘11 Month / Year 49 | 201 | Anal Shareholders Mecting
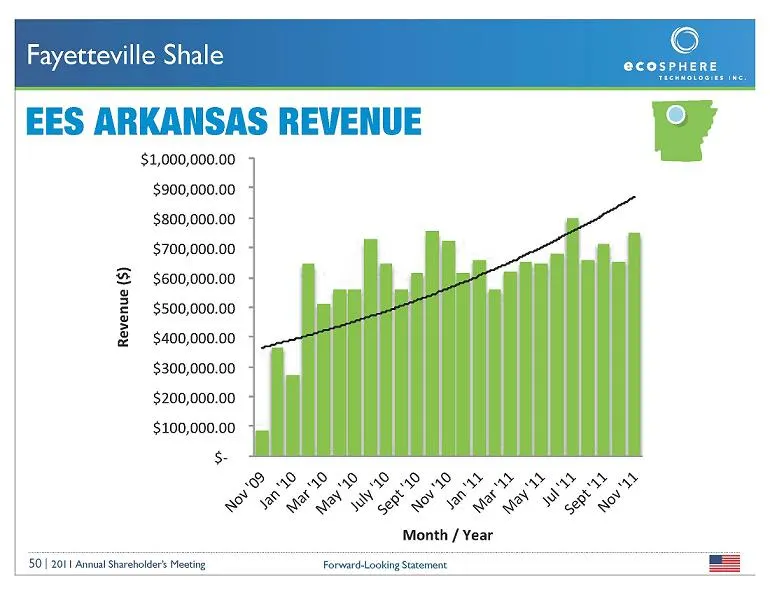
Slide 50: Fayetteville Shale Revenue
$1,000,000.00 $900,000.00 $800,000.00 $700,000.00 $600,000.00 $500,000.00 $400,000.00 $300,000.00 $200,000.00 $100,000.00 5 Revenue ($) [50 | 201 | Annual Shareholders Meeting ° Ei SFE PSF FE VFS Month / Year ~ S OP PW Forward-Looking Statement SY SYS »
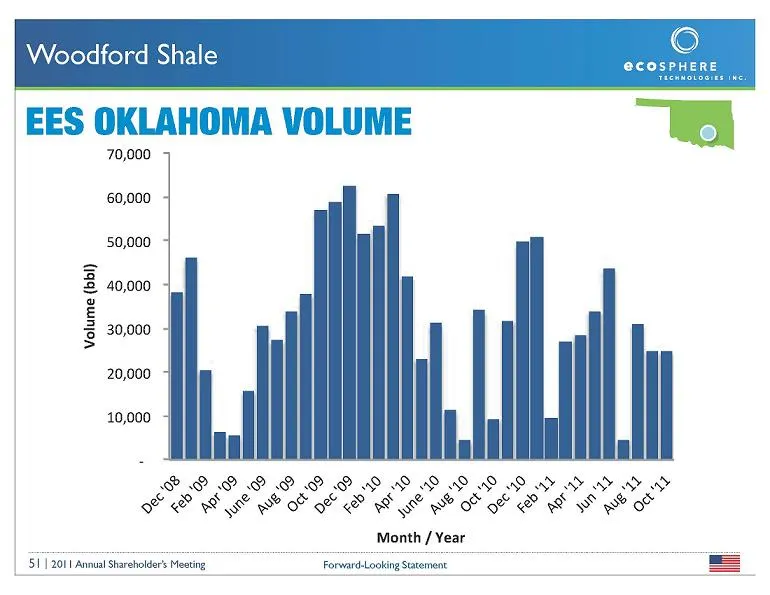
Slide 51: Woodford Shale
Woodford Shale EES OKLAHOMA VOLUME im | 70,000 60,000 50,000 40,000 30,000 Volume (bbl) 20,000 10,000 PP PPP PPD WS WG WP WP WP Wy WY WY WD ; . r FEE PF KE EMM KE EY Month / Year $1 [2011 Annual Shareholders Mecting ae ——|
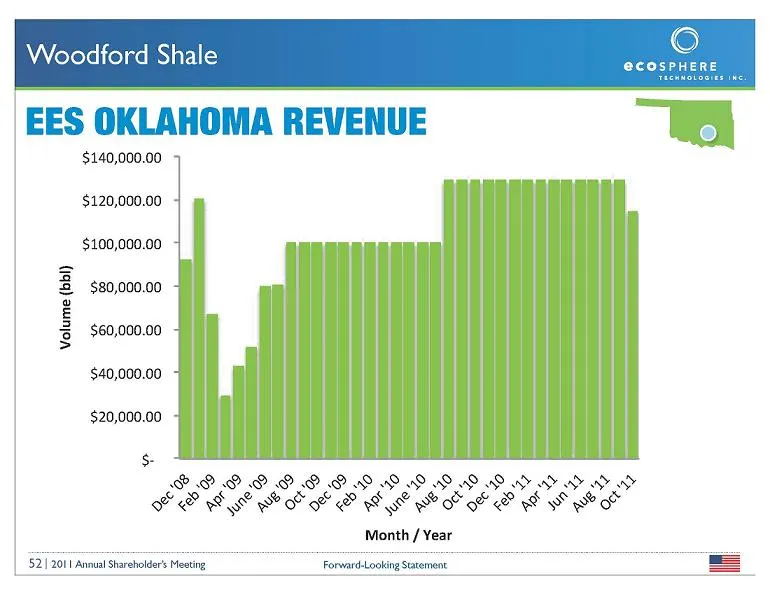
Slide 52: Woodford Shale Revenue
$140,000.00 $120,000.00 $100,000.00 $80,000.00 $60,000.00 Volume (bbl) $40,000.00 $20,000.00 $ SP BP BP QS 8S SOP LD ND FF FE PF HS Ce MIF KE ¥F $f woo Month / Year 52 2011 Annual Shareholders Meeting Forward-Looking Sacement
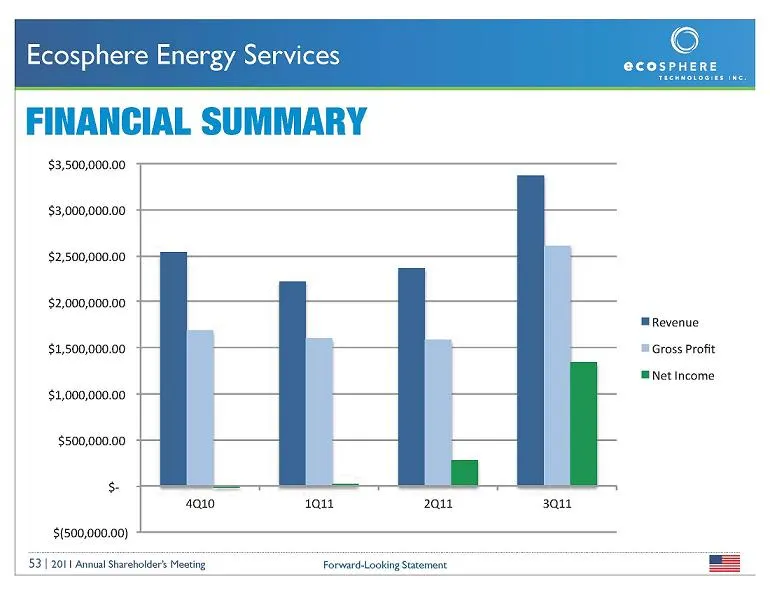
Slide 53: Ecosphere Energy Services: Financial Summary
Ecosphere Energy Services FINANCIAL SUMMARY $3,500,000.00 '$3,000,000.00 $2,500,000.00 $2,000,000.00. +} Revenue $1,500,000.00 * Gross Profit Net Income $1,000,000.00 $500,000.00 + + t 410 ta1t 2ait 3q11 $(500,000.00), 53 | 2011 Annual Shareholders Meeting Forward-Looking Statement =
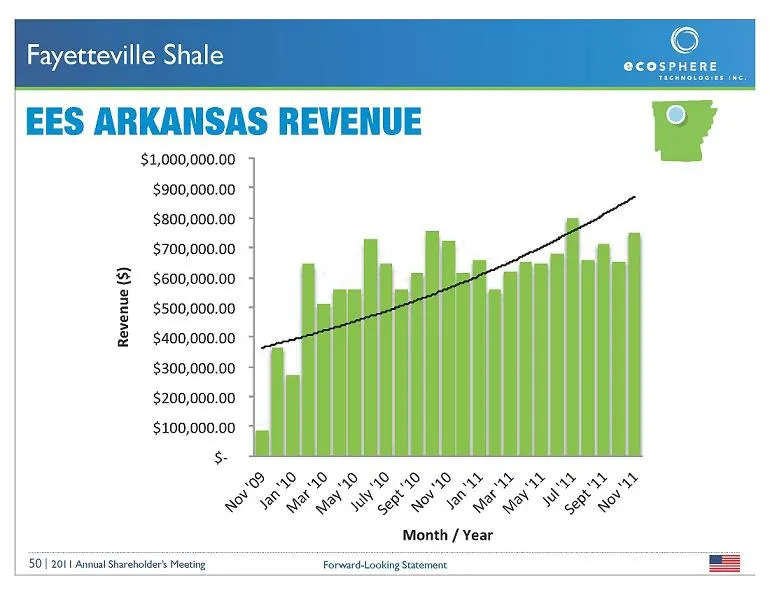
Slide 54: Revenue by Month
$1,000,000.00 $900,000.00 $800,000.00 $700,000.00 $600,000.00 $500,000.00 $400,000.00 $300,000.00 $200,000.00 $100,000.00 5 Revenue ($) [50 | 201 | Annual Shareholders Meeting ° Ei SFE PSF FE VFS Month / Year ~ S OP PW Forward-Looking Statement SY SYS »
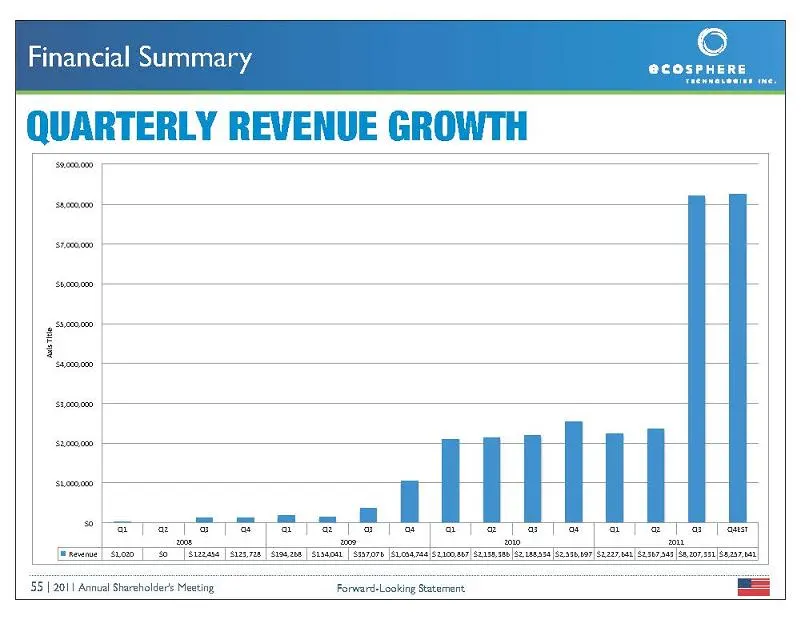
Slide 55: Financial Summary
Financial Summary semen sremen eo 3 scone stem ~ rl [ [ o_o eva Tete te) > > e >a >a > e >a >a ee | a pans (ecw) Ges | @ [times [Amrw dase [Sinan | savor [mans Samer Saami seman omer Suen Saroe sawraaliere 55 2011 Annual Shareholders Meeting ——==SSSSCiRorwariooking Statement. =
Slide 56: Financial Summary
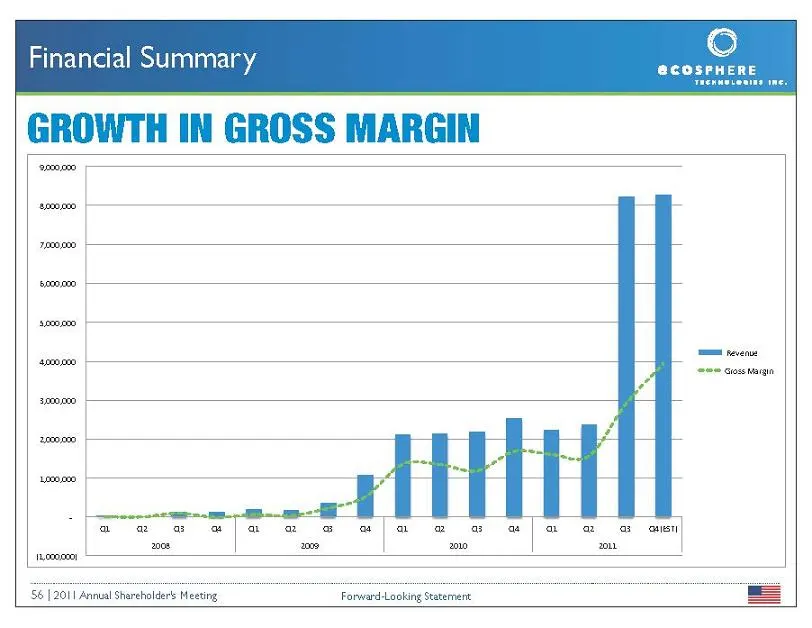
Financial Summary eee ciosewaiae ‘562011 Annual Shereholders Meeting Forward-Lacking Stetset
Slide 57: Financial Summary: Revenue / Debt Multiple
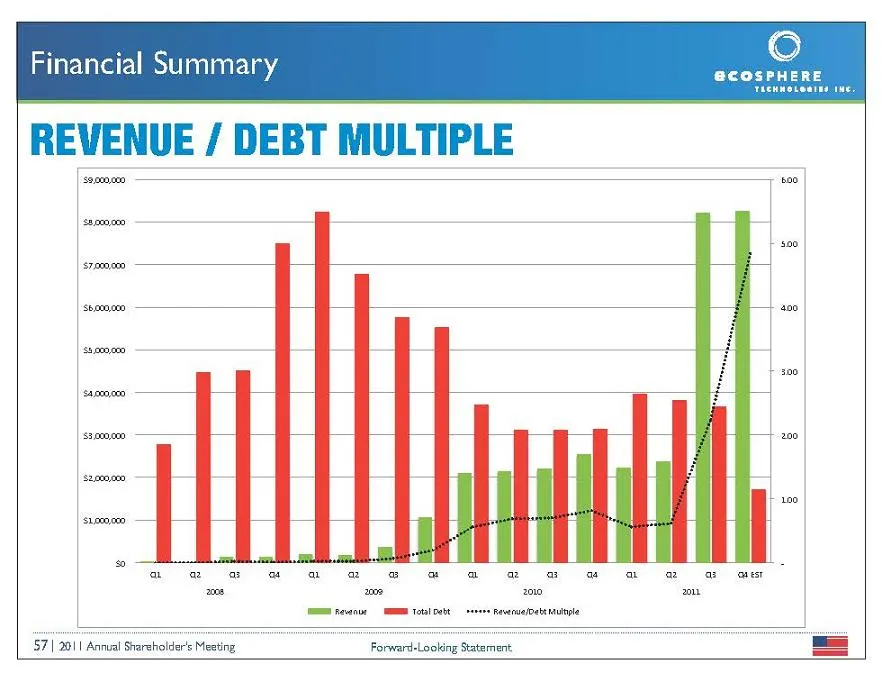
Financial Summary REVENUE / DEBT MULTIPLE 57 | 2011 Annual Starcholder's Meeting Forward-Looking Statement
Slide 58: Financial Summary: Improvement in Working Capital
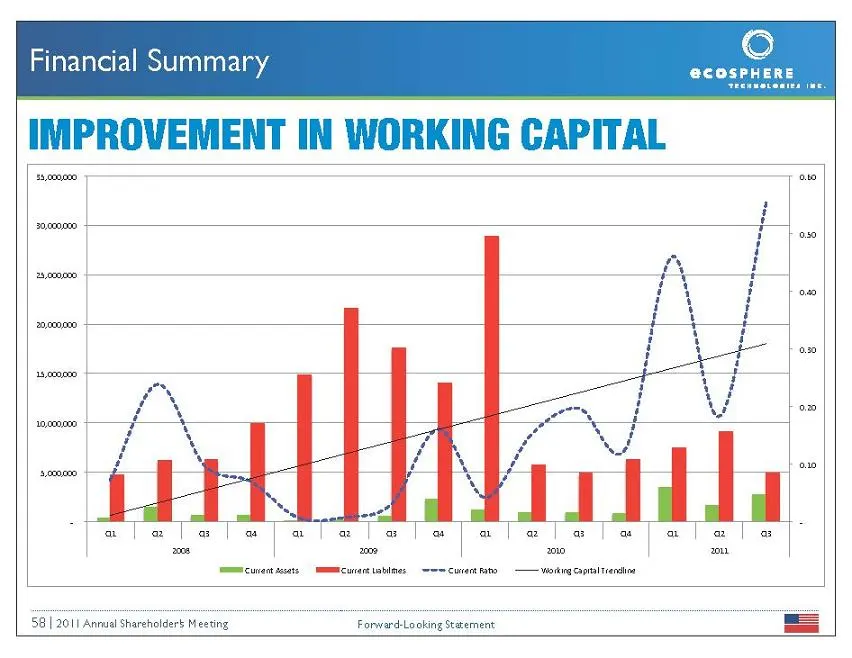
Financial Summary IMPROVEMENT IN WORKING CAPITAL soonnmn0 58 | 2011 Anmusl Shareholdert Meeting Forward-Looking Staternent
Slide 59: Financial Summary: Growing Cash from Operations
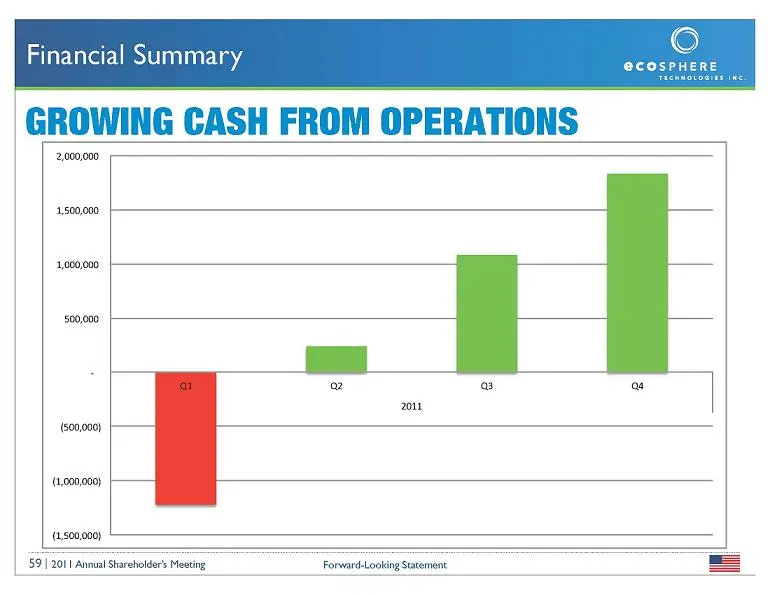
Financial Summary GROWING CASH FROM OPERATIONS 2,000,000 4,500,000 2,000,000 500,000, a 3 ae 1 201 (00,000) (2,000,000), (1,500,000), 59 | 201 | Anal Shareholders Meeting Forward-Looking Statement
Slide 60: Financial Summary and Outlook
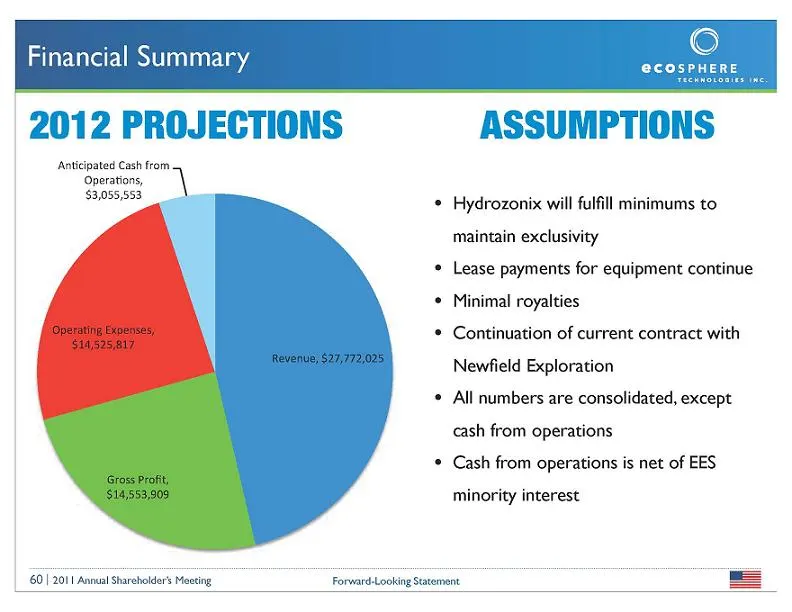
Foe Financial Su n nclal oun ee Saeeton,| sap si * Hydrozonix will fulfill minimums to maintain exclusivity * Lease payments for equipment continue * Minimal royalties * Continuation of current contract with Revenue, $27,772,025 Newfield Exploration * All numbers are consolidated, except cash from o
Slide 61: Corporate Information
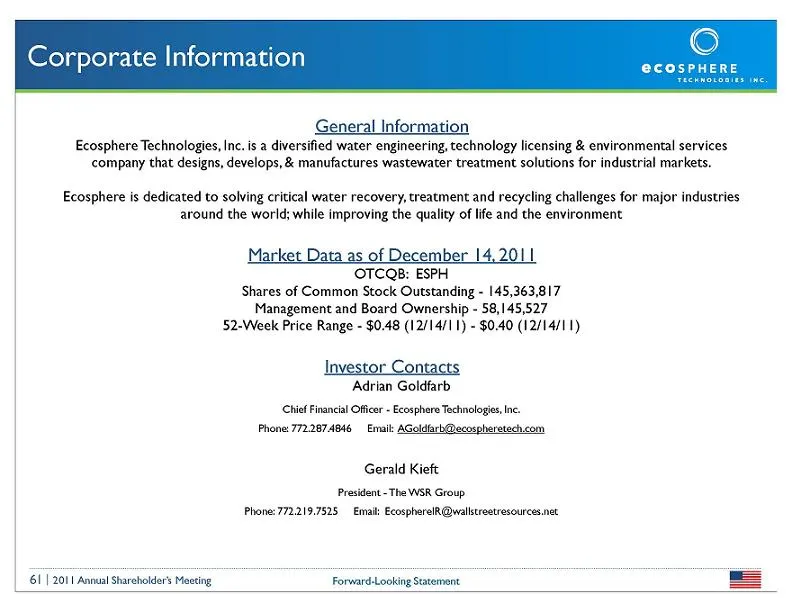
Corporate Information General Information Ecosphere Technologies, Inc. is a diversified water engineering, technology licensing & environmental services company that designs, develops, & manufactures wastewater treatment solutions for industrial markets. Ecosphere is dedicated to solving critical wa
Slide 62: Ecosphere Technologies Inc.
© @COSPHERE TECHNOLOGIES INC. 3515 SE. Lionel Terrace Stuart, FL 34997 P: 772.287.4846 F 7727814778 www.EcosphereTech.com Stock Symbol ESPH | ISO 9001 Certified
Source: SEC EDGAR · 8-K filed Dec 16, 2011