Componenta Oyj · OMXHEX:CTH1V
Componenta Oyj — FY2013 Earnings Presentation
43 slides from Componenta Oyj's earnings presentation, Feb 10, 2014
Slide 1: Casting Future Solutions
Casting Future SOLUTIONS COMPONENTA
Slide 2: Preliminary information on Componenta's Financial Statements
Preliminary information on Componenta’s Financial Statements 1 January - 31 December 2013 Heikki Lehtonen President and CEO 10 February 2014 © Componenta
Slide 3: Income statement
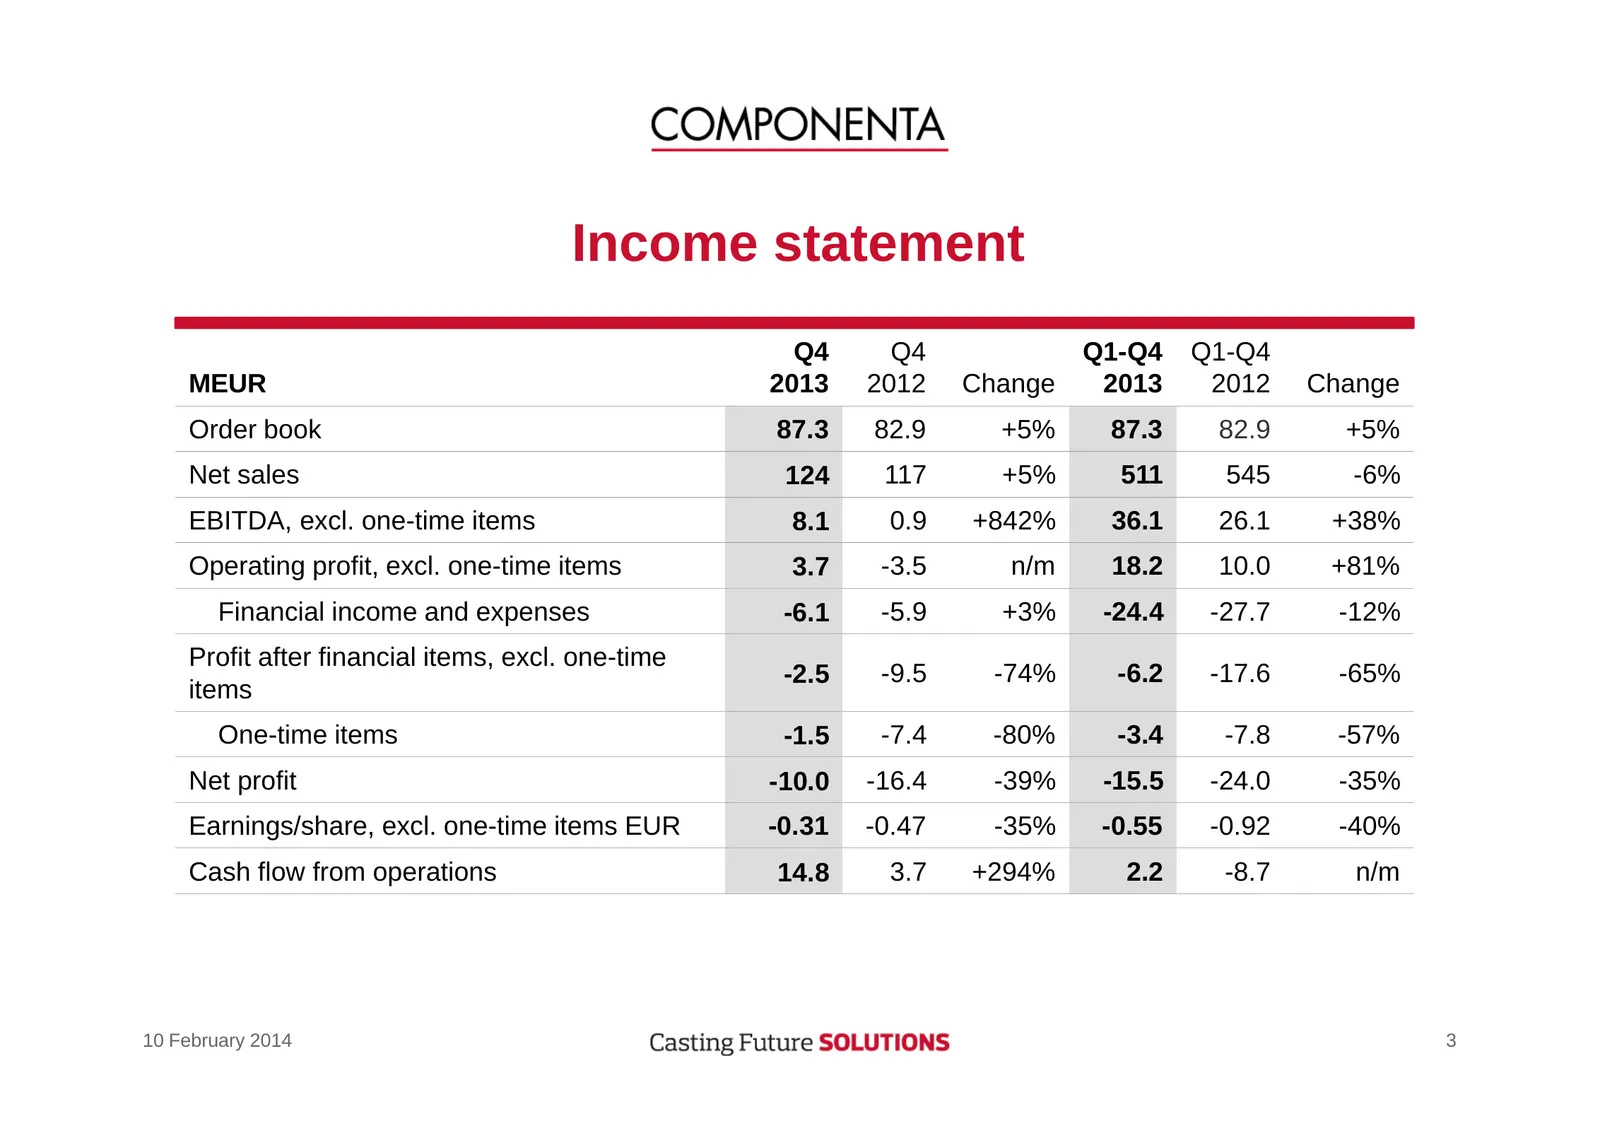
Income statement Q4 Q4 Q1-Q4 Q1-Q4 MEUR 2013 2012 Change 2013 2012 Change Order book 87.3 82.9 +5% 87.3 82.9 +5% Net sales 124 117 +5% 511 545 -6% EBITDA, excl. one-time items 8.1 0.9 +842% 36.1 26.1 +38% Operating profit, excl. one-time items 3.7 -3.5 n/m 18.2 10.0 +81% Financial income and expense
Slide 4: Quarterly development of order book
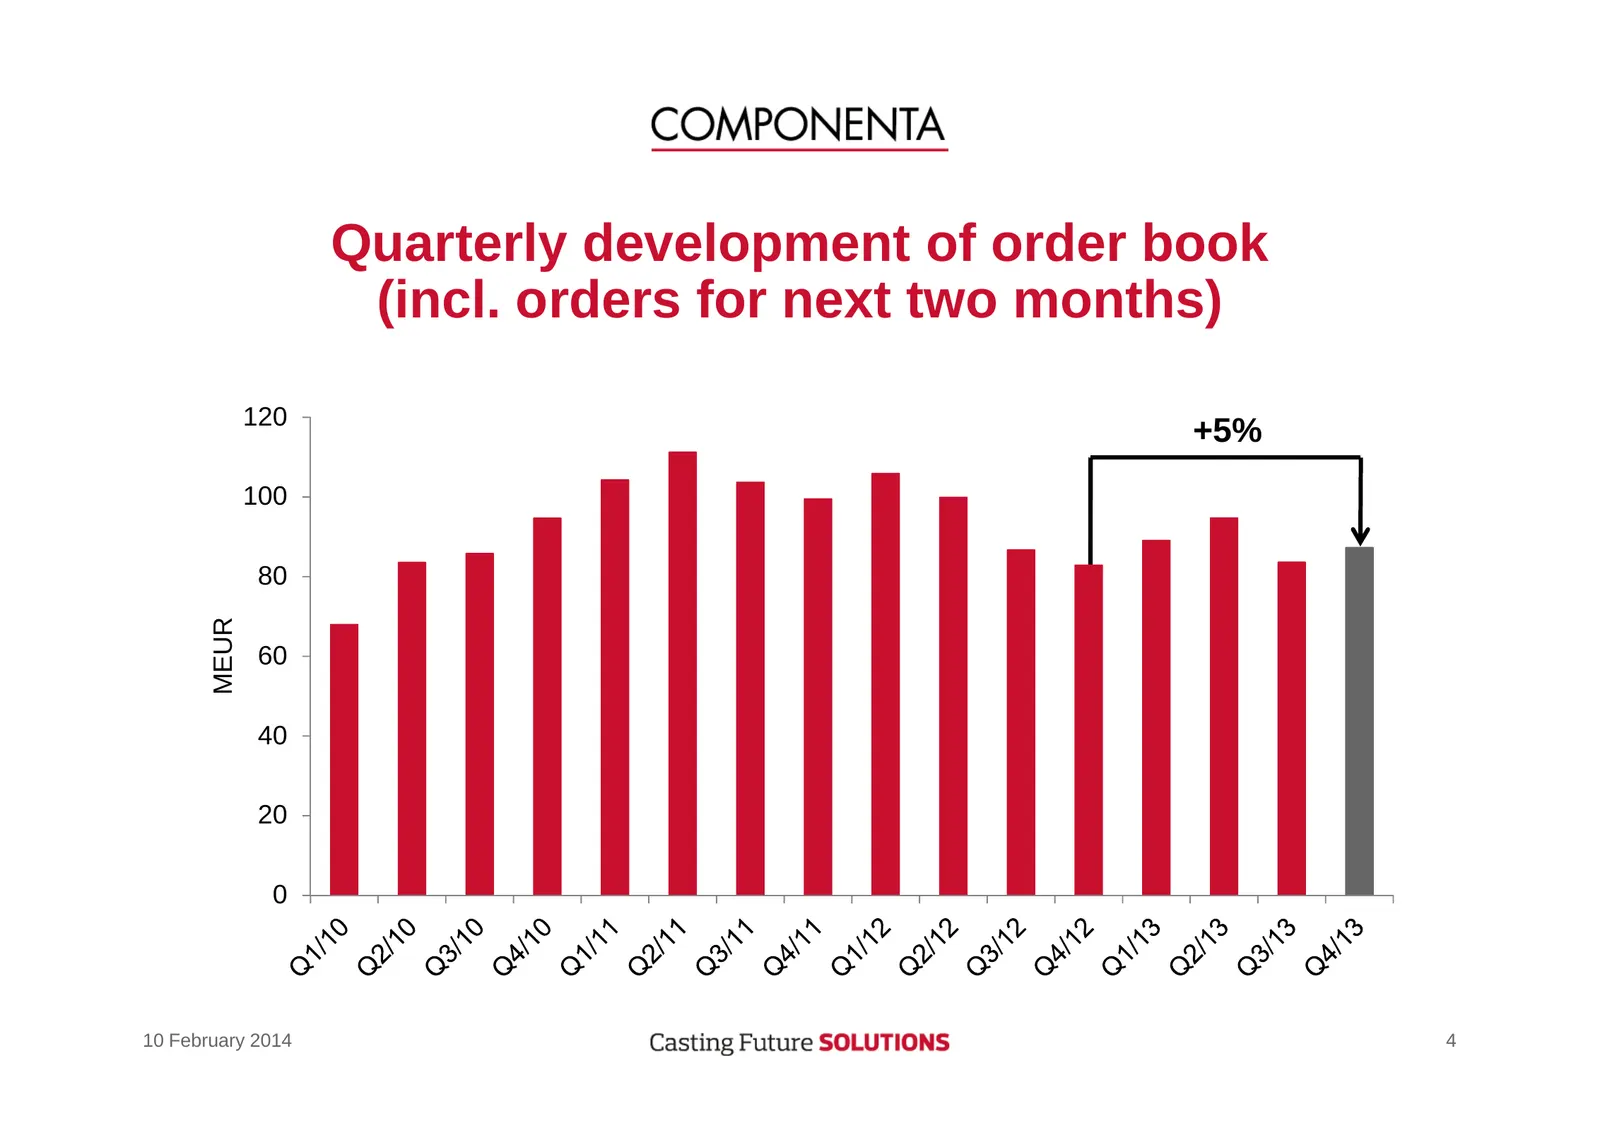
Quarterly development of order book (incl. orders for next two months) 120 +5% 100 80 MEUR 60 40 20 0 10 February 2014 4
Slide 5: Quarterly development of net sales
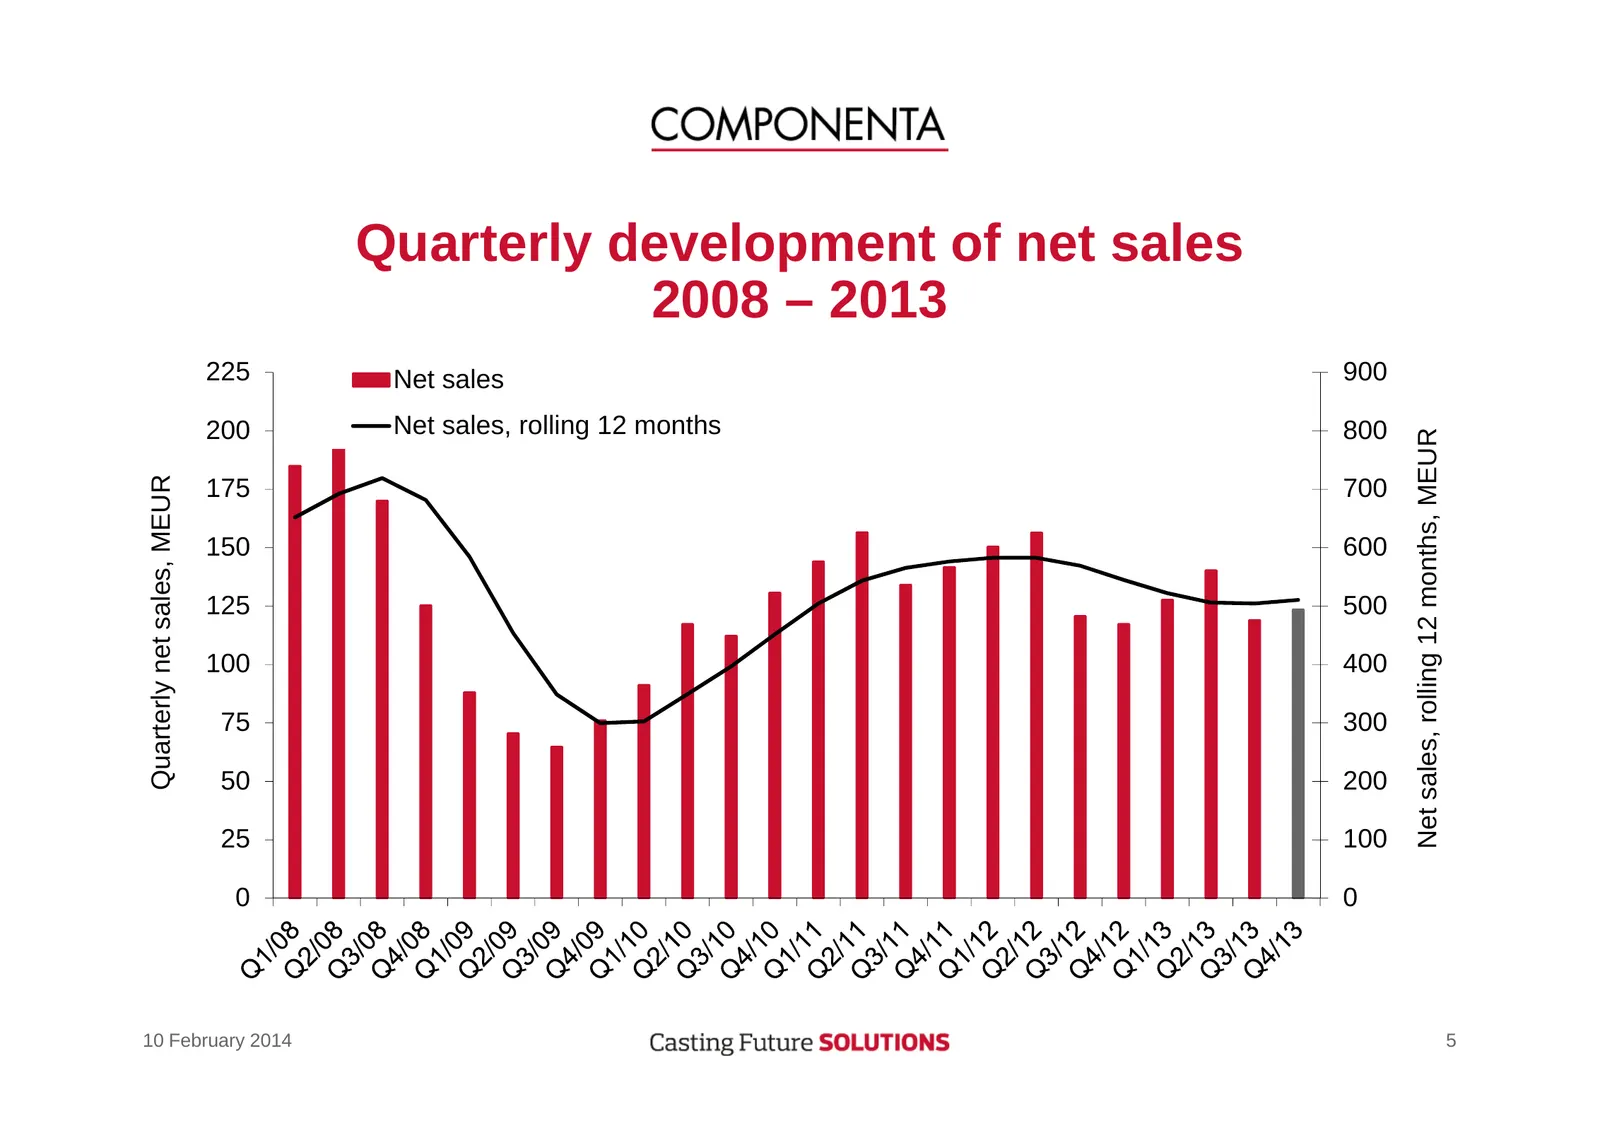
Quarterly development of net sales 2008 – 2013 225 Net sales 900 200 Net sales, rolling 12 months 800 Net sales, rolling 12 months, MEUR Quarterly net sales, MEUR 175 700 150 600 125 500 100 400 75 300 50 200 25 100 0 0 10 February 2014 5
Slide 6: Analysis of changes in income statements excluding one-time items
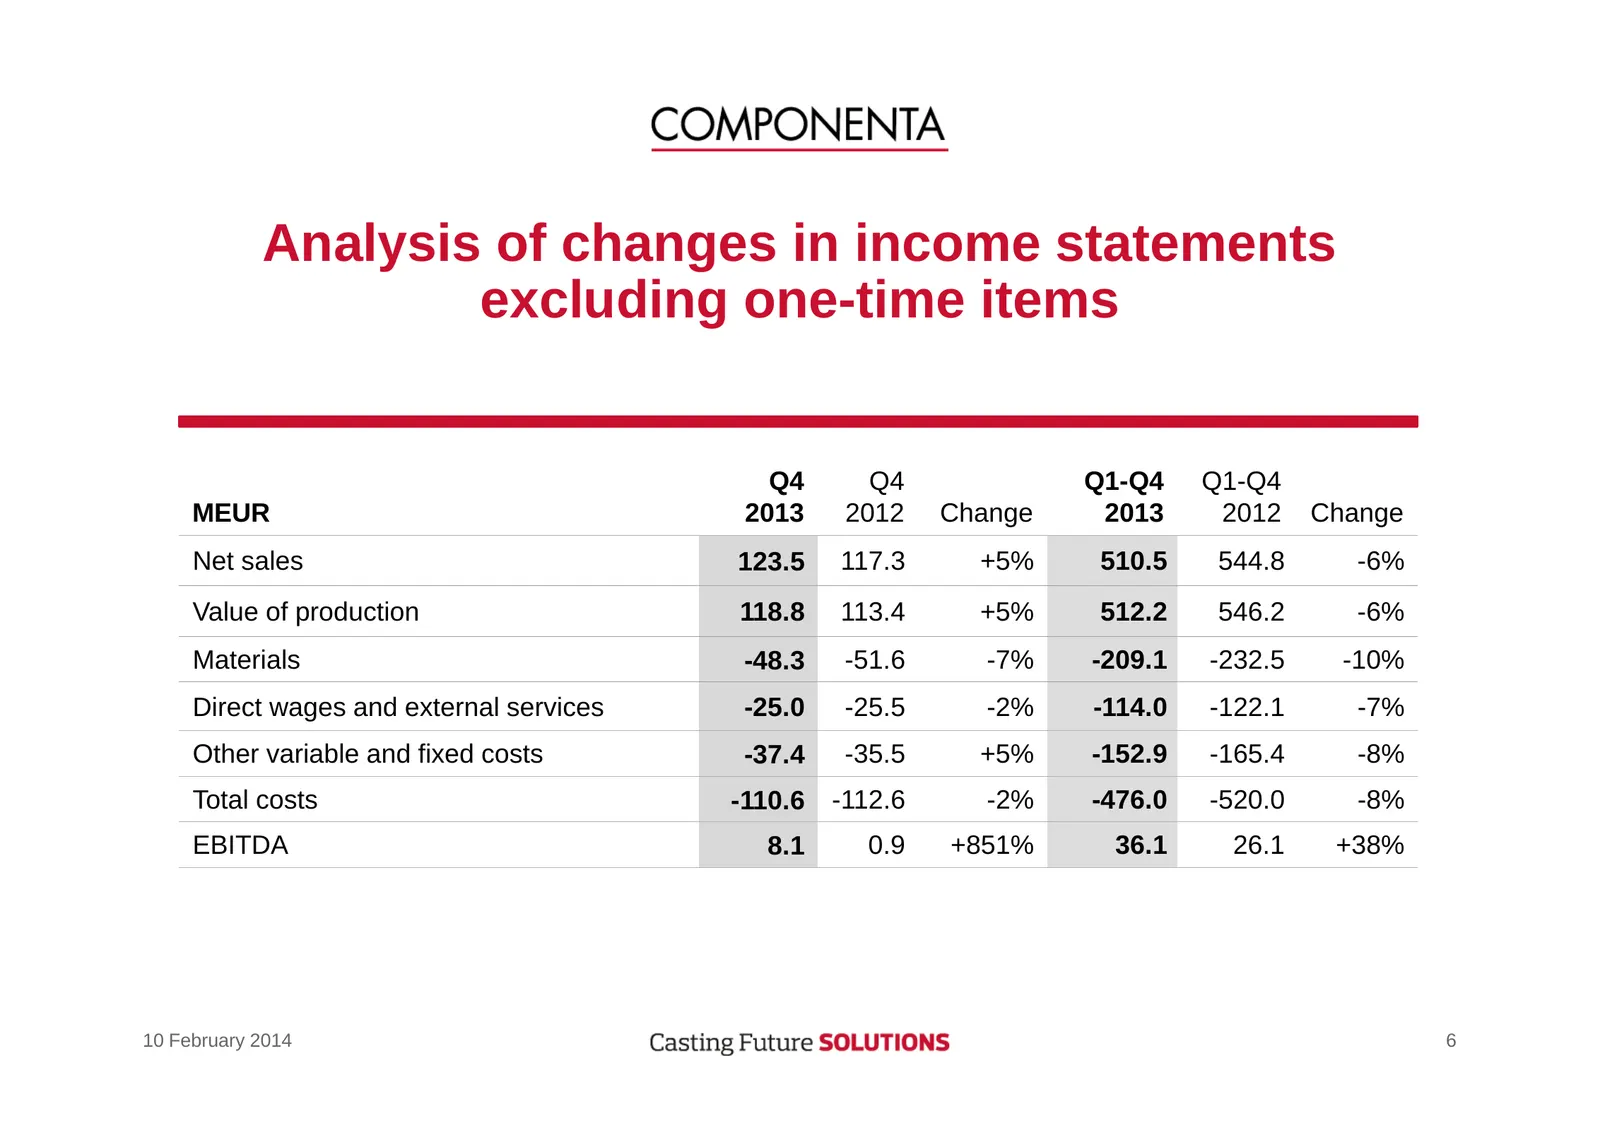
Analysis of changes in income statements excluding one-time items Q4 Q4 Q1-Q4 Q1-Q4 MEUR 2013 2012 Change 2013 2012 Change Net sales 123.5 117.3 +5% 510.5 544.8 -6% Value of production 118.8 113.4 +5% 512.2 546.2 -6% Materials -48.3 -51.6 -7% -209.1 -232.5 -10% Direct wages and external services -25
Slide 7: Quarterly operating profit and result after financial items
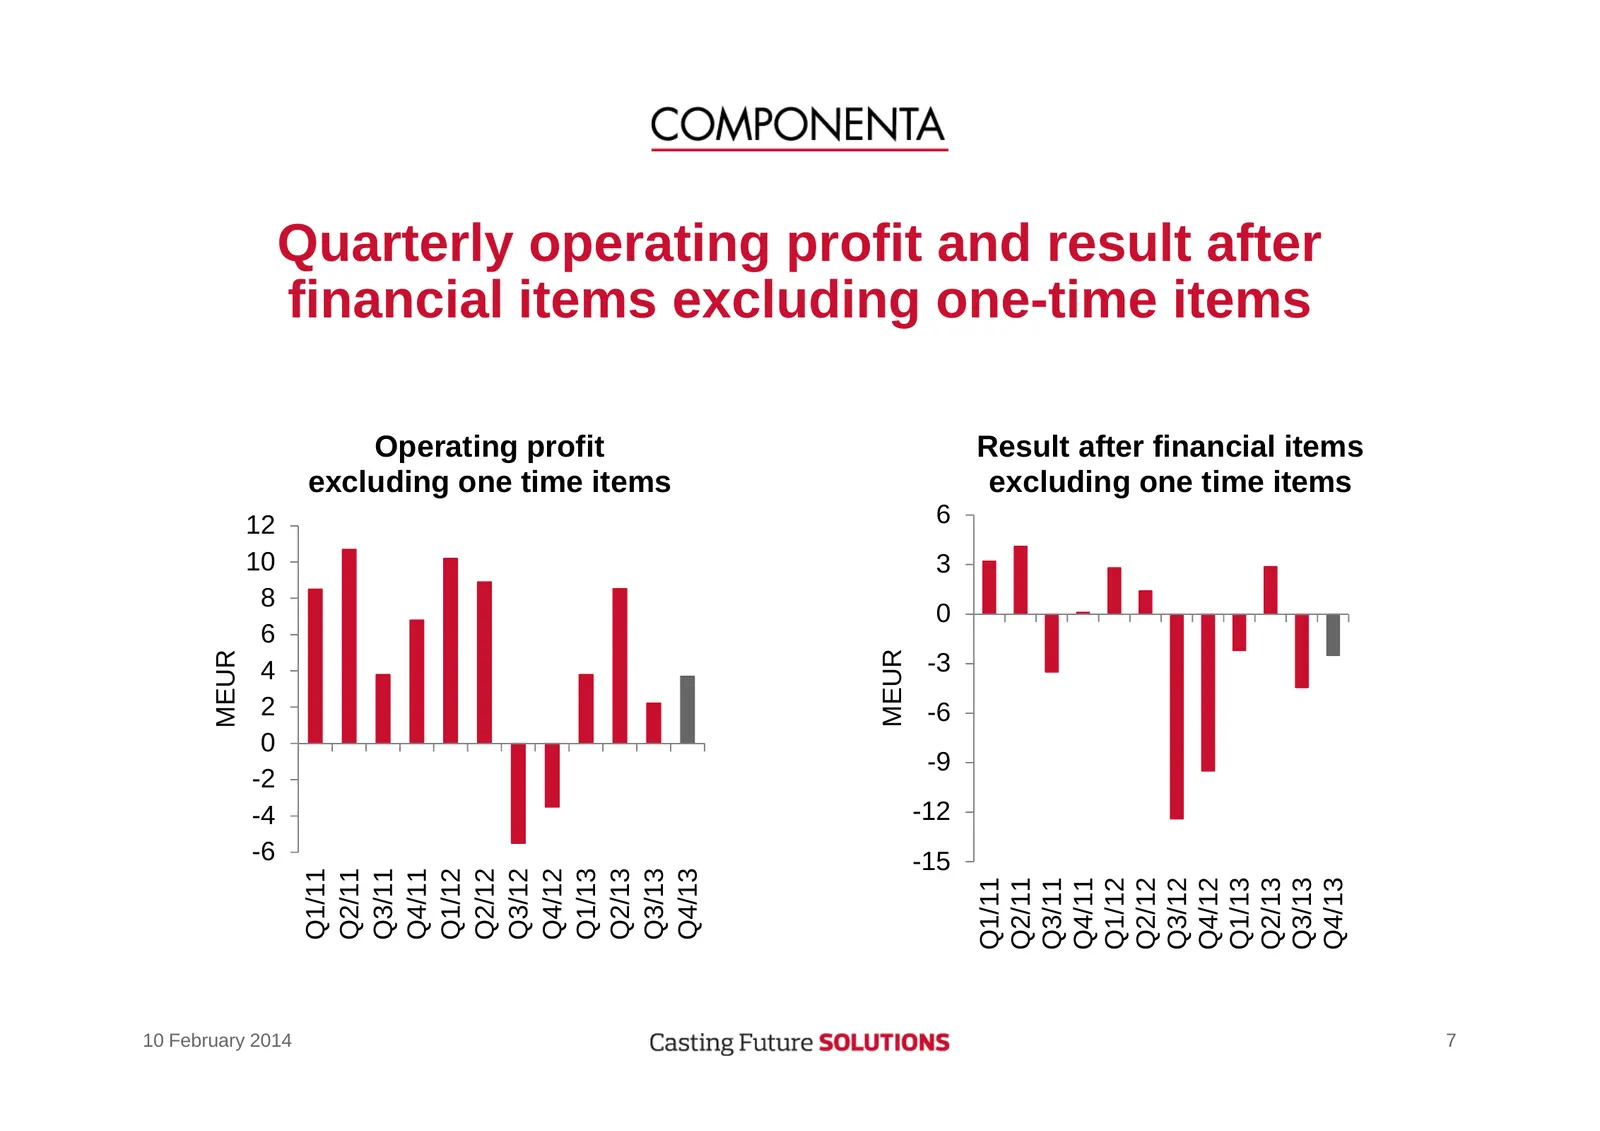
Quarterly operating profit and result after financial items excluding one-time items Operating profit Result after financial items excluding one time items excluding one time items 12 6 10 3 8 0 6 MEUR MEUR 4 -3 2 -6 0 -9 -2 -4 -12 -6 -15 Q1/11 Q2/11 Q3/11 Q4/11 Q1/12 Q2/12 Q3/12 Q4/12 Q1/13 Q2/13 Q
Slide 8: Key ratios
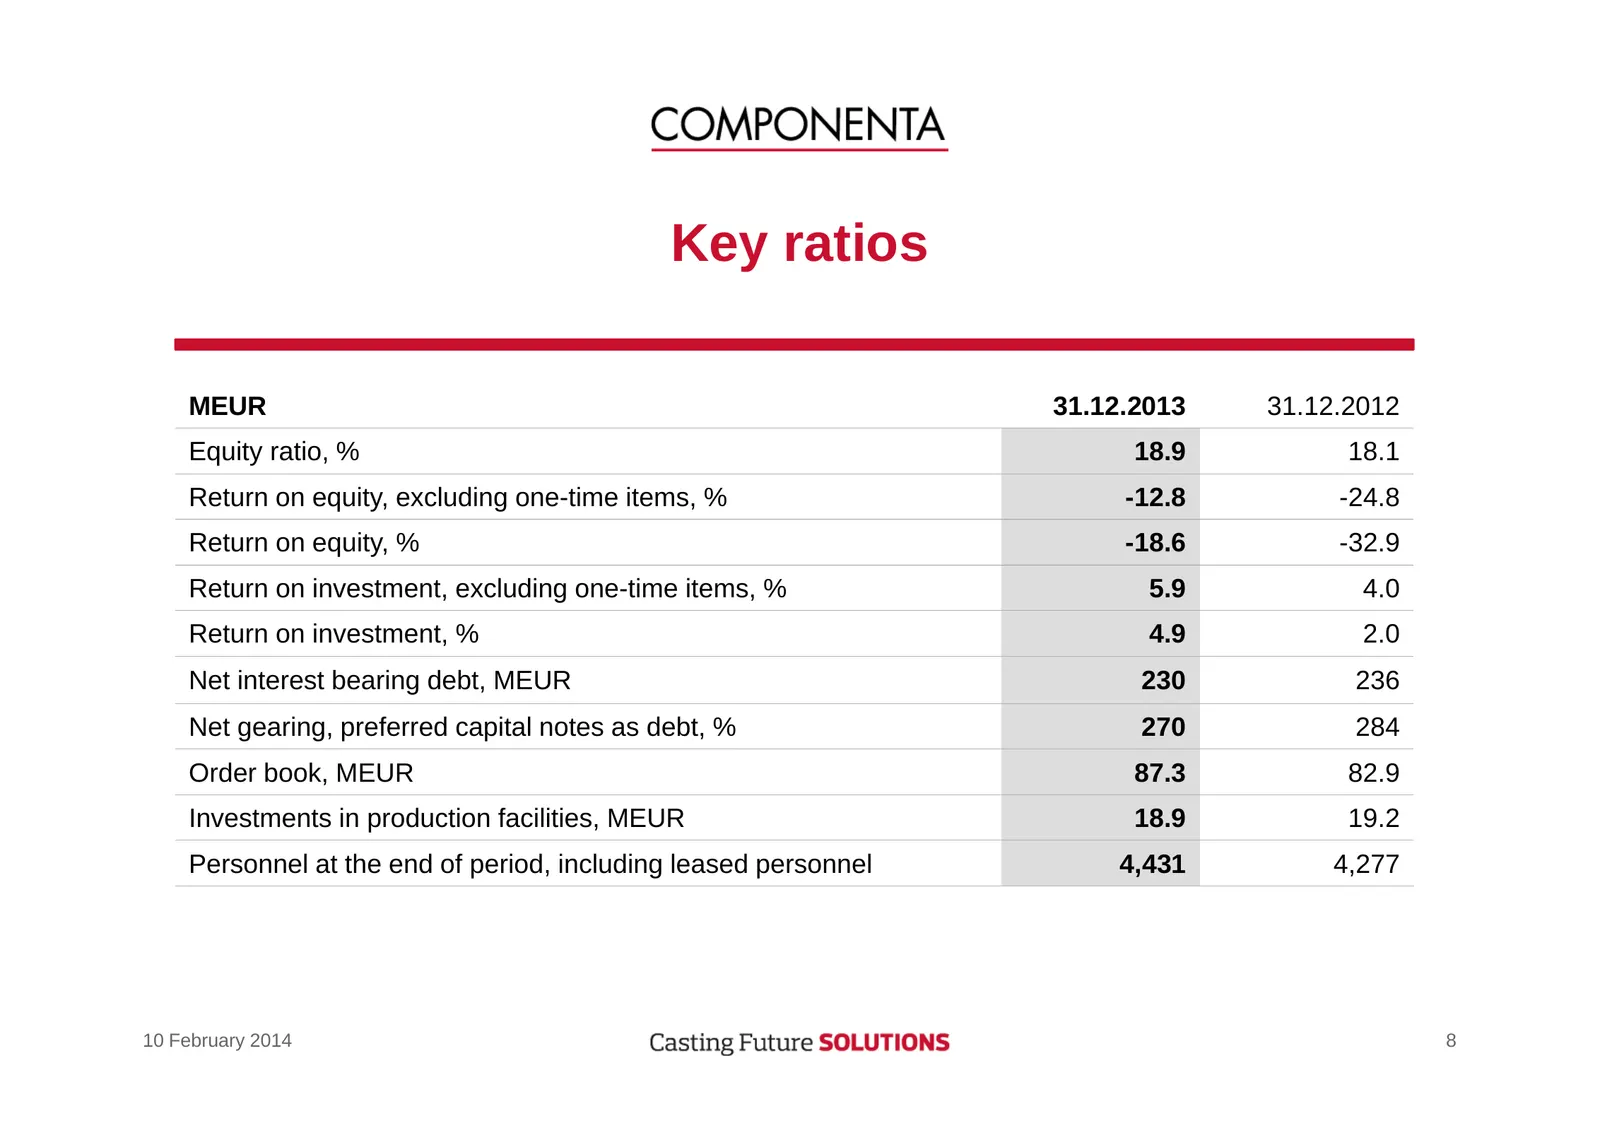
Key ratios MEUR 31.12.2013 31.12.2012 Equity ratio, % 18.9 18.1 Return on equity, excluding one-time items, % -12.8 -24.8 Return on equity, % -18.6 -32.9 Return on investment, excluding one-time items, % 5.9 4.0 Return on investment, % 4.9 2.0 Net interest bearing debt, MEUR 230 236 Net gearing, pre
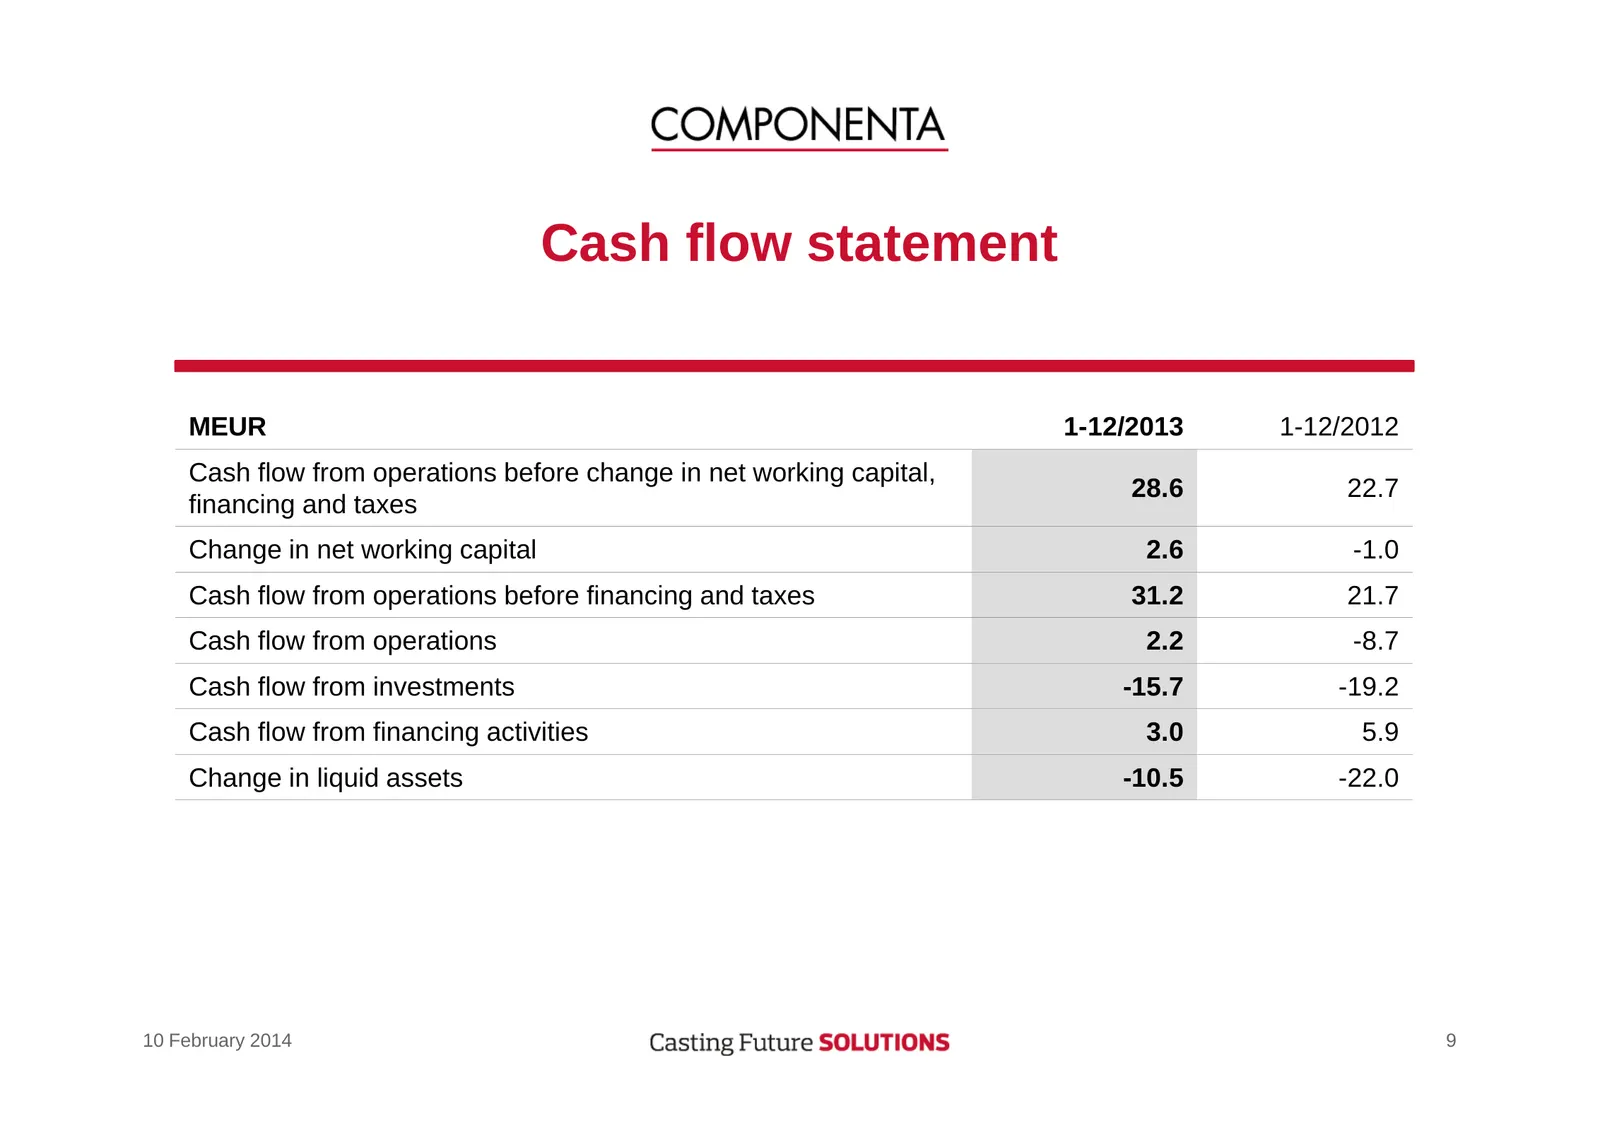
Slide 9: Cash flow statement
Cash flow statement MEUR 1-12/2013 1-12/2012 Cash flow from operations before change in net working capital, 28.6 22.7 financing and taxes Change in net working capital 2.6 -1.0 Cash flow from operations before financing and taxes 31.2 21.7 Cash flow from operations 2.2 -8.7 Cash flow from investmen
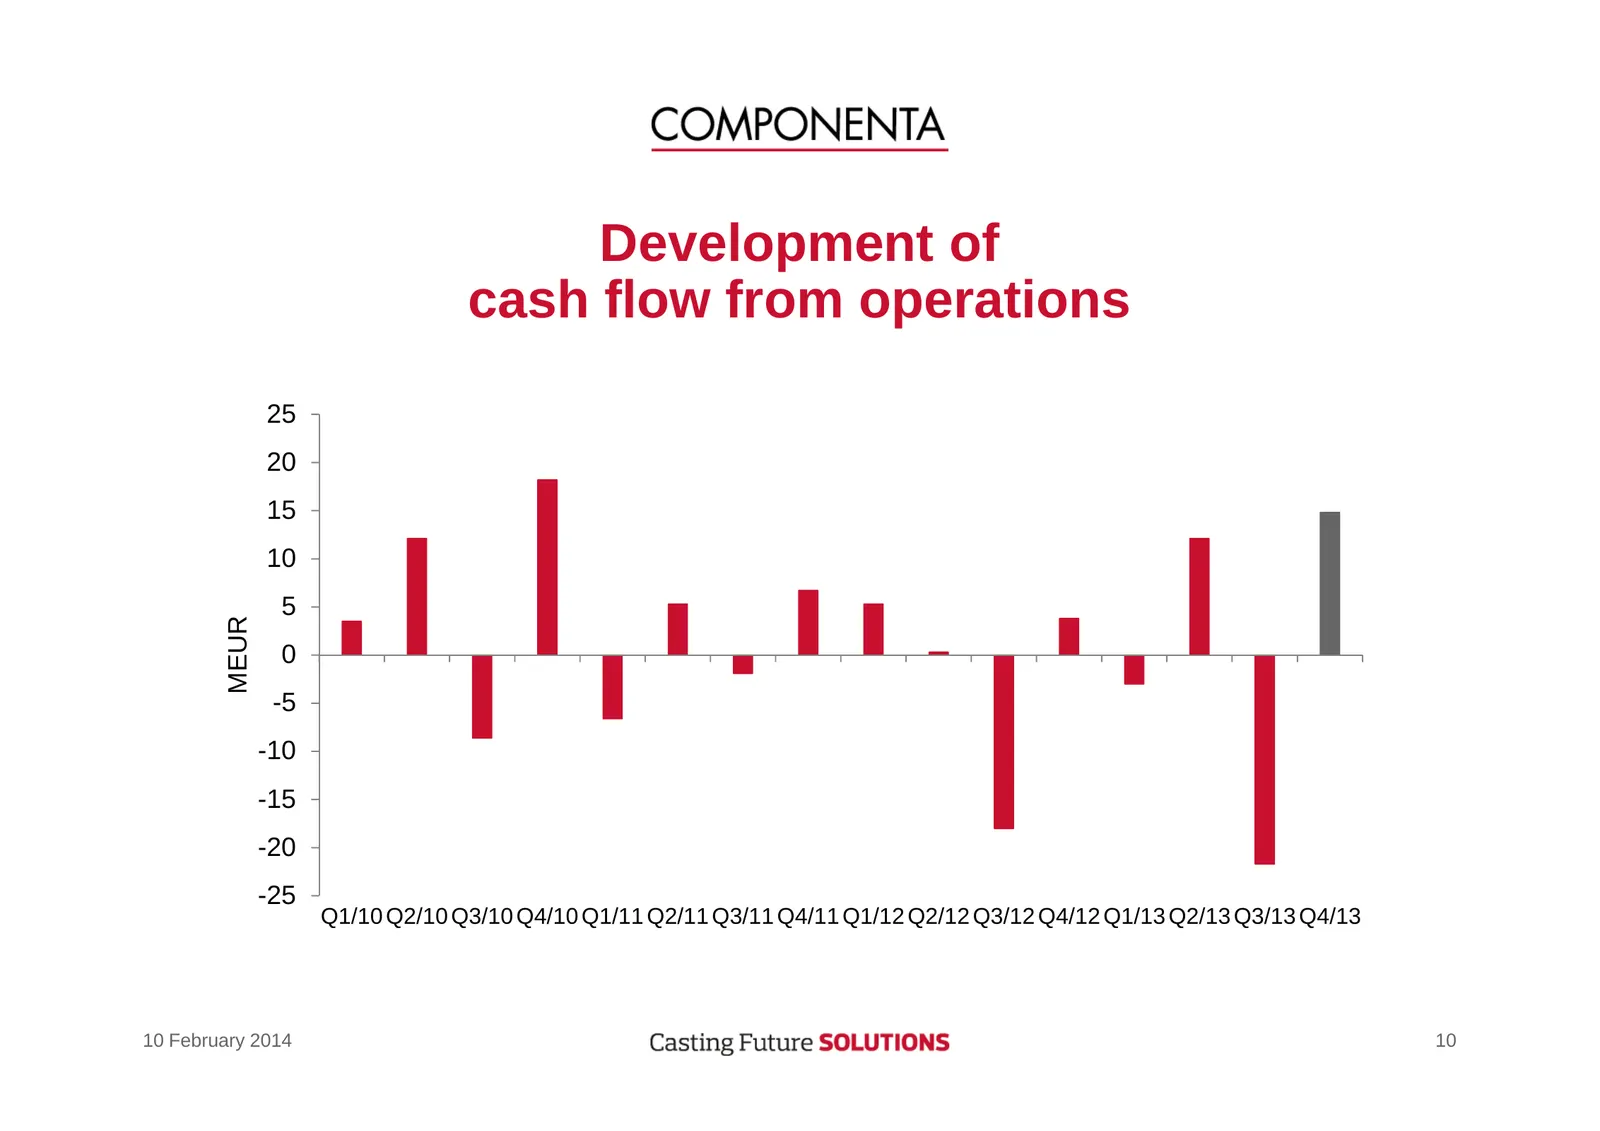
Slide 10: Development of cash flow from operations
Development of cash flow from operations 25 20 15 10 5 MEUR 0 -5 -10 -15 -20 -25 Q1/10 Q2/10 Q3/10 Q4/10 Q1/11 Q2/11 Q3/11 Q4/11 Q1/12 Q2/12 Q3/12 Q4/12 Q1/13 Q2/13 Q3/13 Q4/13 10 February 2014 10
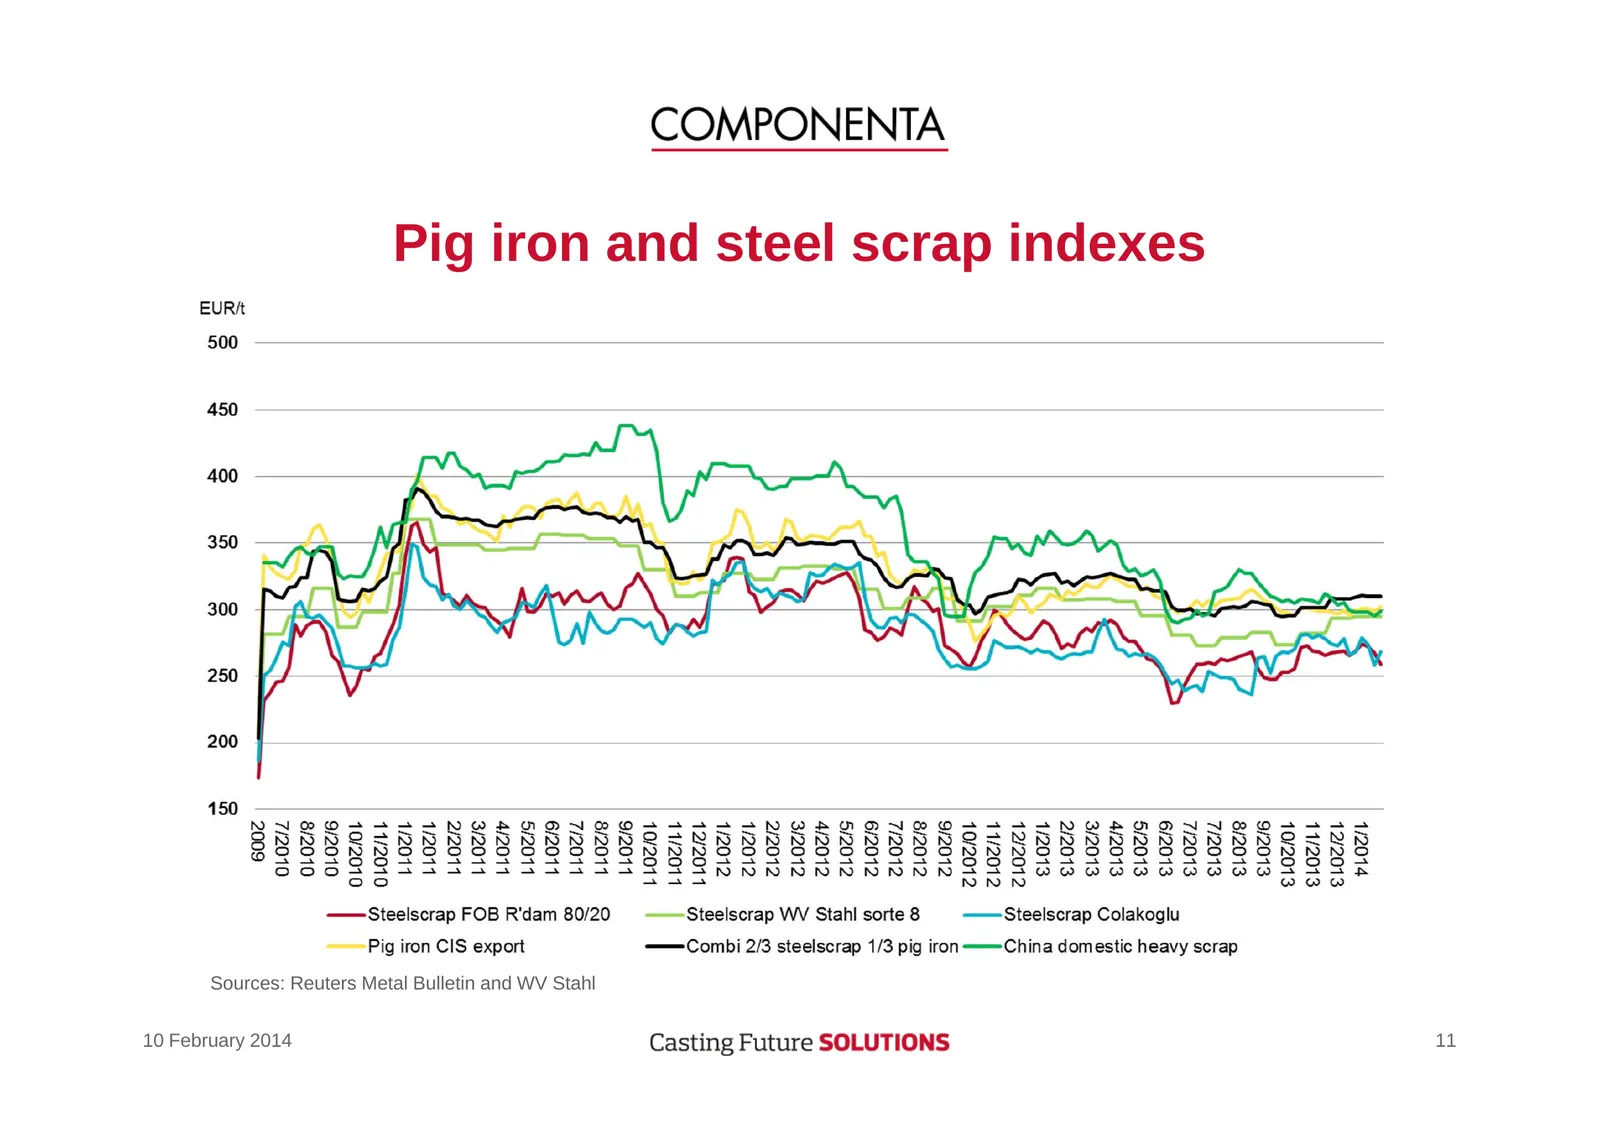
Slide 11: Pig iron and steel scrap indexes
Pig iron and steel scrap indexes Sources: Reuters Metal Bulletin and WV Stahl 10 February 2014 11
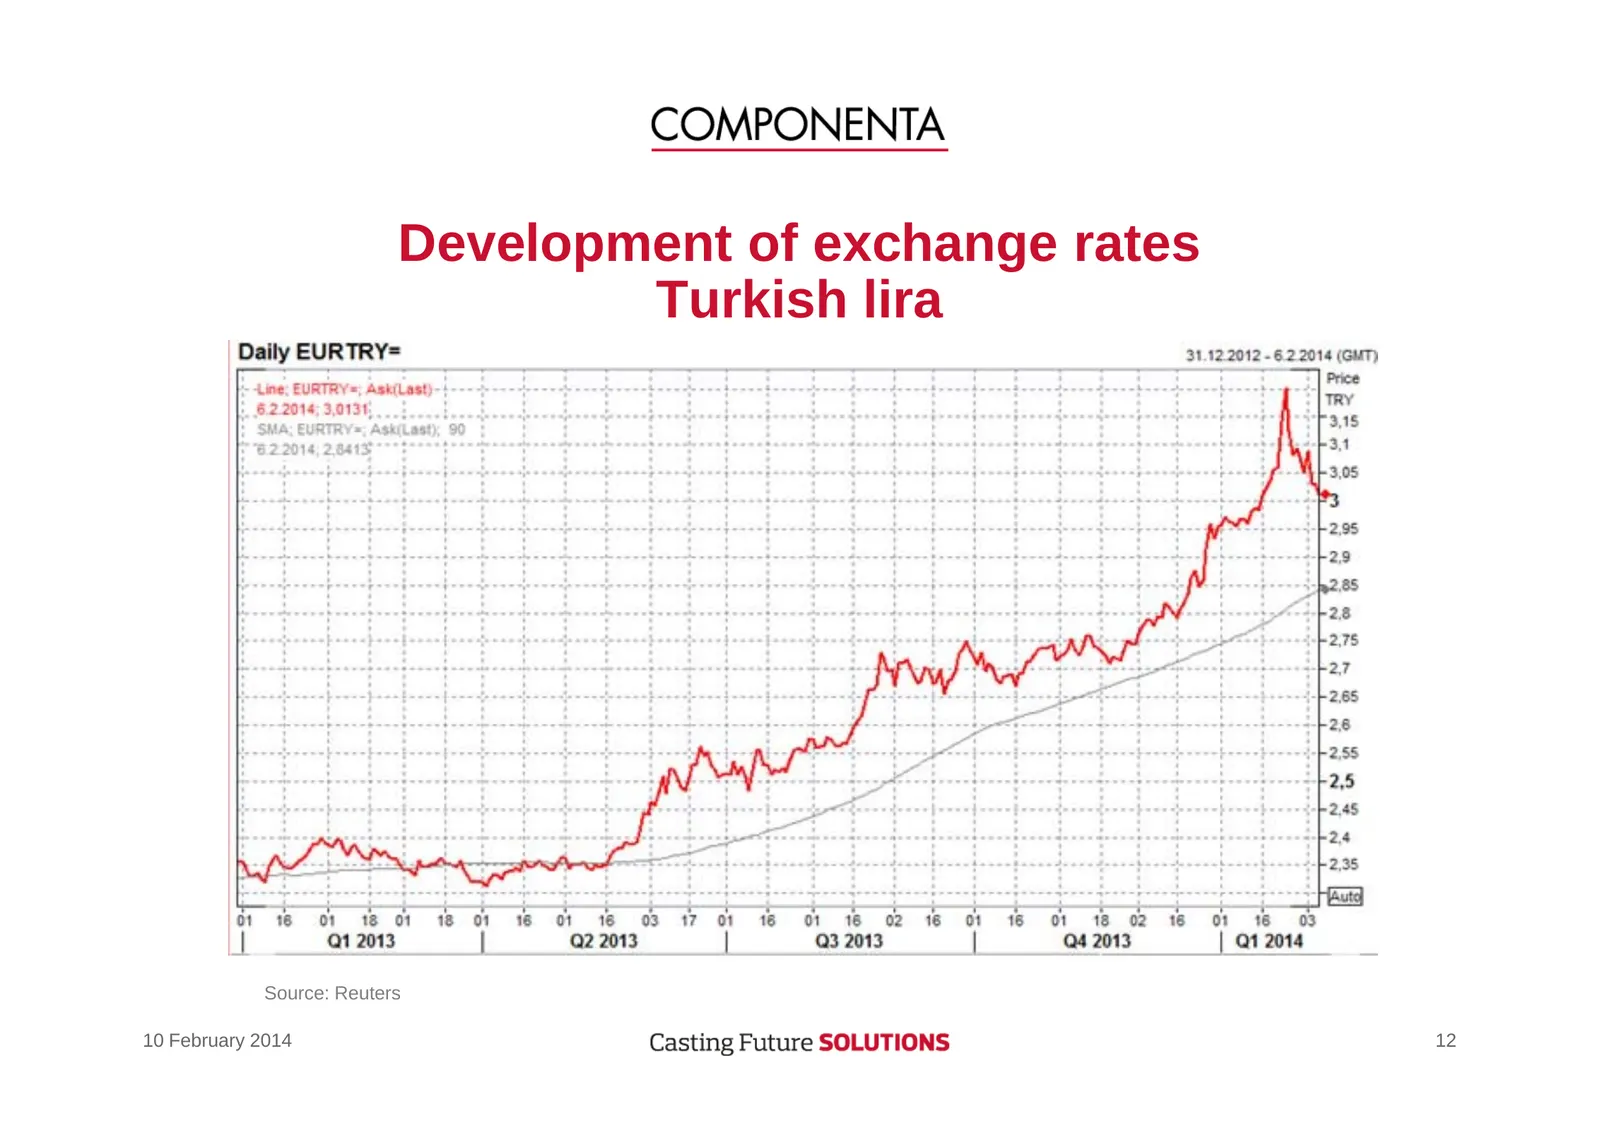
Slide 12: Development of exchange rates Turkish lira
Development of exchange rates Turkish lira Source: Reuters 10 February 2014 12
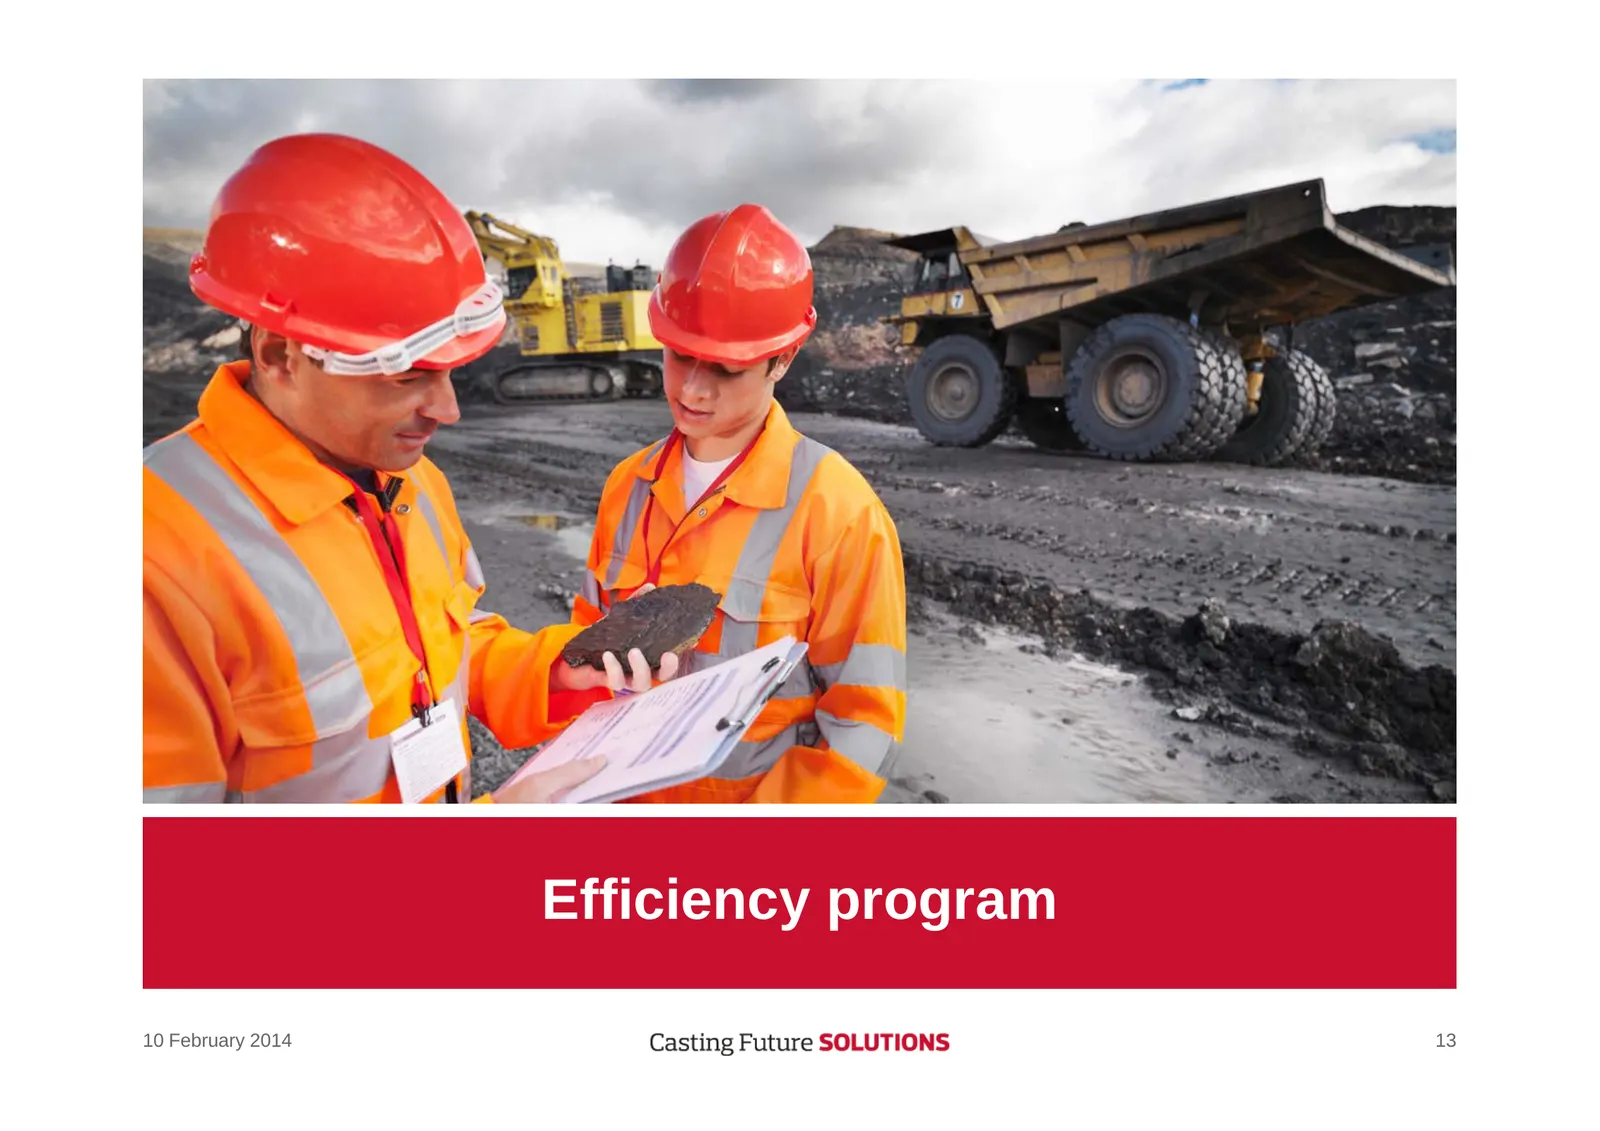
Slide 13: Efficiency program
Efficiency program 10 February 2014 13
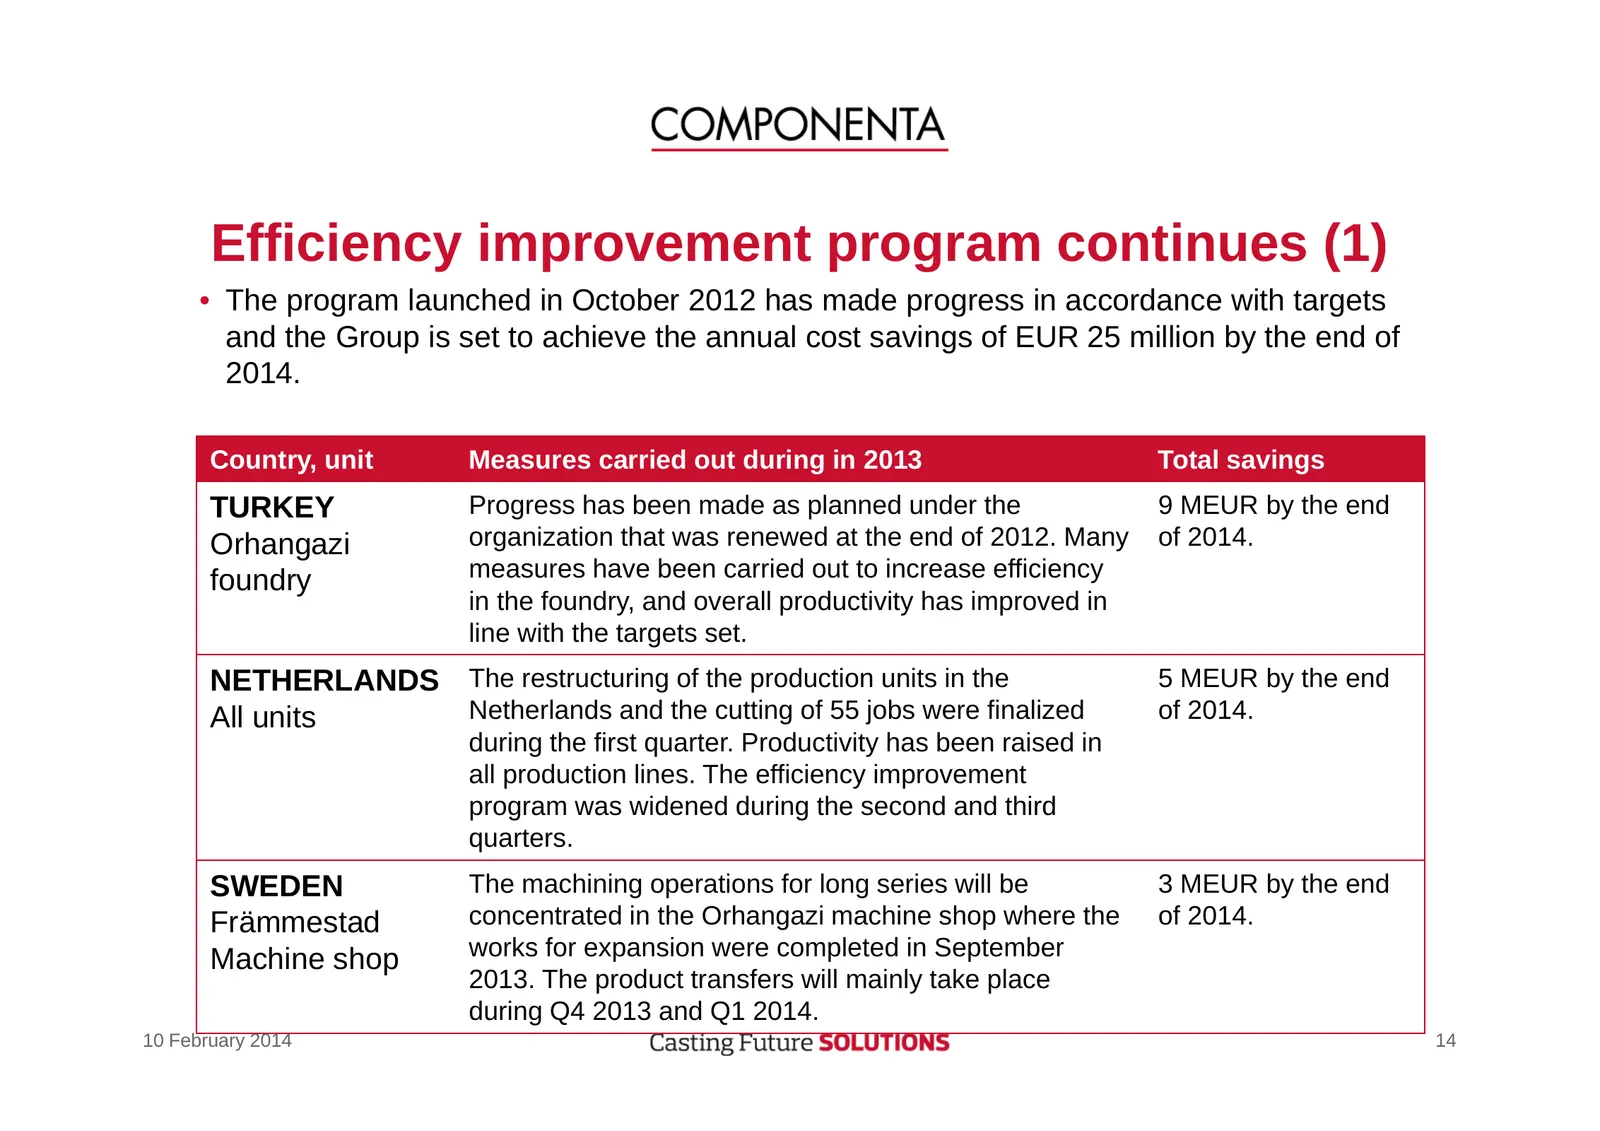
Slide 14: Efficiency improvement program continues (1)
Efficiency improvement program continues (1) • The program launched in October 2012 has made progress in accordance with targets and the Group is set to achieve the annual cost savings of EUR 25 million by the end of 2014. Country, unit Measures carried out during in 2013 Total savings TURKEY Progre
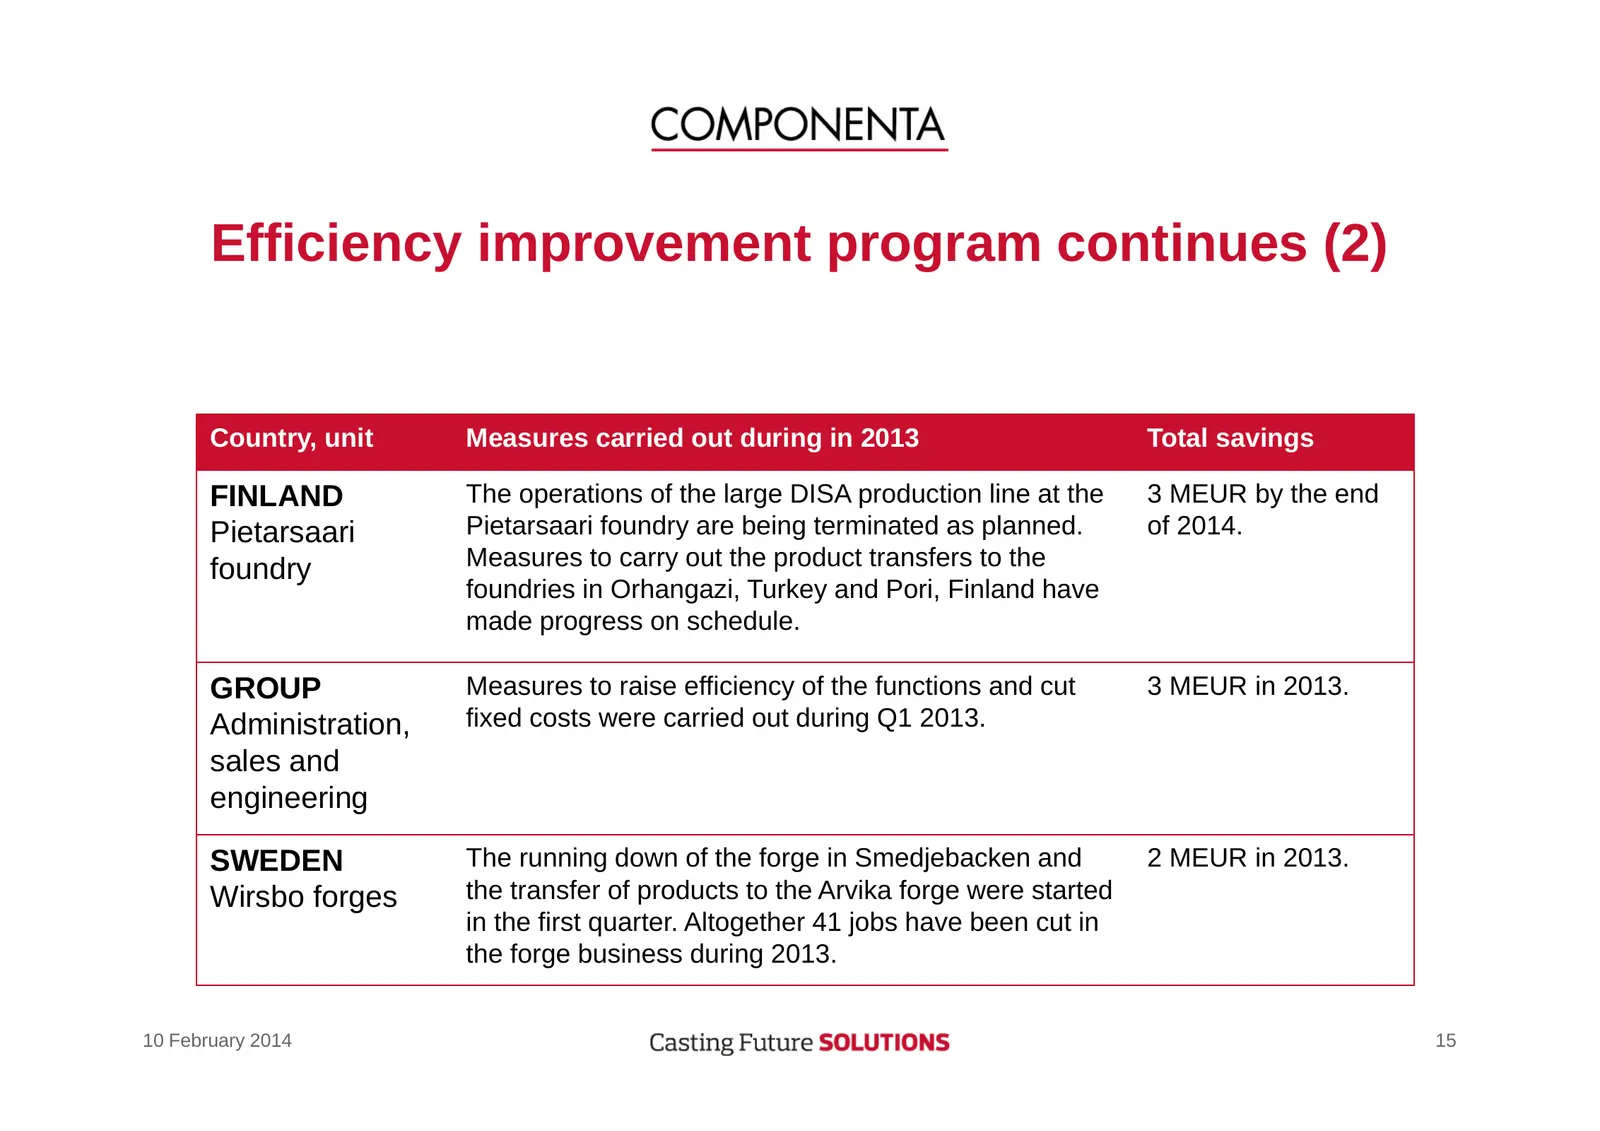
Slide 15: Efficiency improvement program continues (2)
Efficiency improvement program continues (2) Country, unit Measures carried out during in 2013 Total savings FINLAND The operations of the large DISA production line at the 3 MEUR by the end Pietarsaari Pietarsaari foundry are being terminated as planned. of 2014. foundry Measures to carry out the p
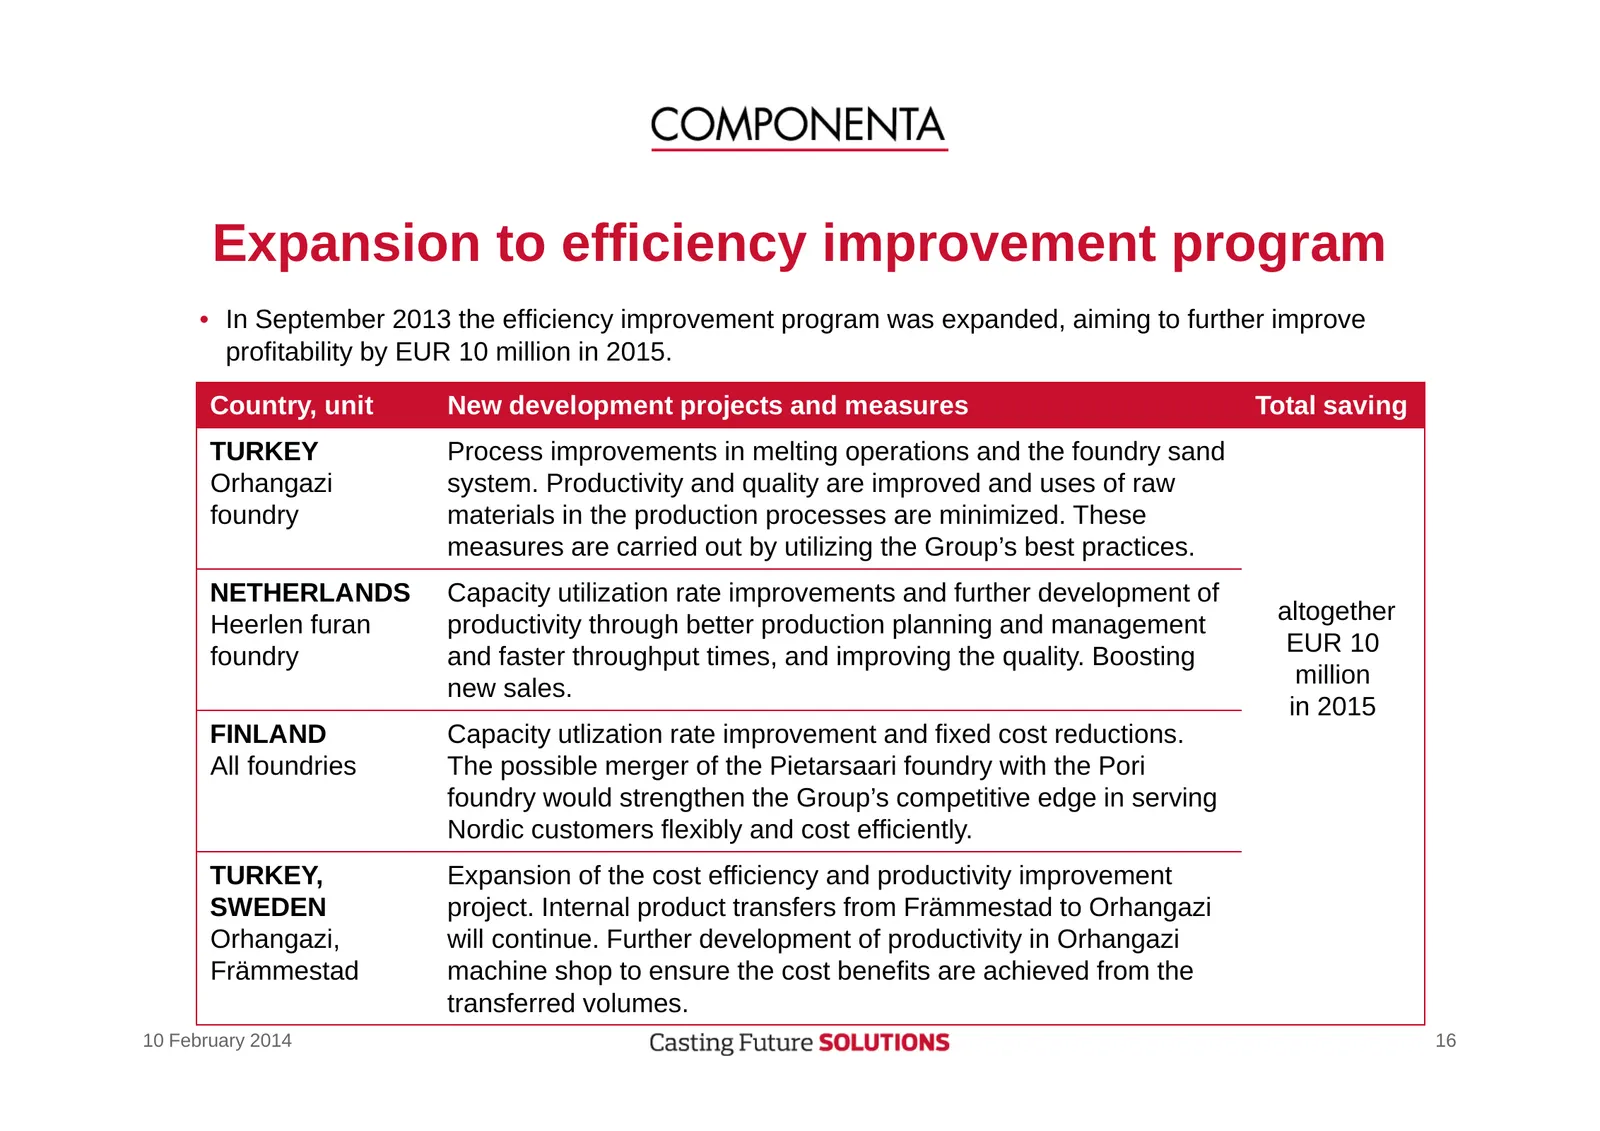
Slide 16: Expansion to efficiency improvement program
Expansion to efficiency improvement program • In September 2013 the efficiency improvement program was expanded, aiming to further improve profitability by EUR 10 million in 2015. Country, unit New development projects and measures Total saving TURKEY Process improvements in melting operations and t
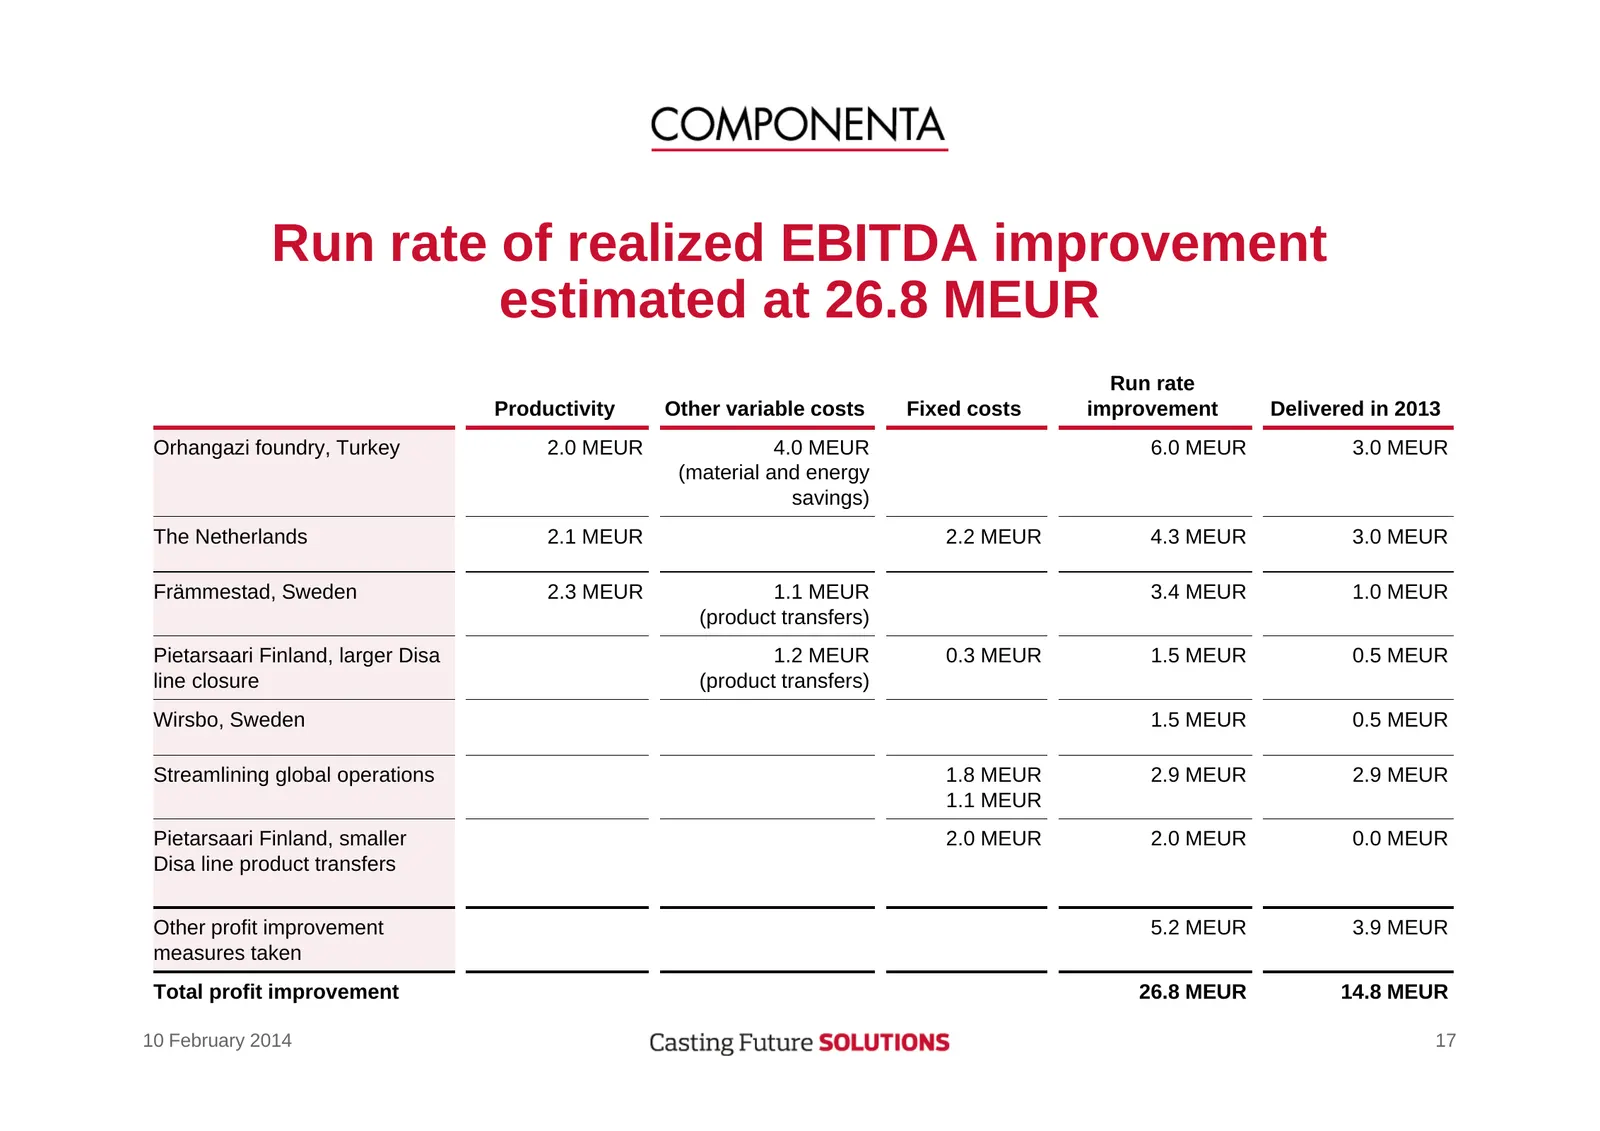
Slide 17: Run rate of realized EBITDA improvement estimated at 26.8 MEUR
Run rate of realized EBITDA improvement estimated at 26.8 MEUR Run rate Productivity Other variable costs Fixed costs improvement Delivered in 2013 Orhangazi foundry, Turkey 2.0 MEUR 4.0 MEUR 6.0 MEUR 3.0 MEUR (material and energy savings) The Netherlands 2.1 MEUR 2.2 MEUR 4.3 MEUR 3.0 MEUR Främmest
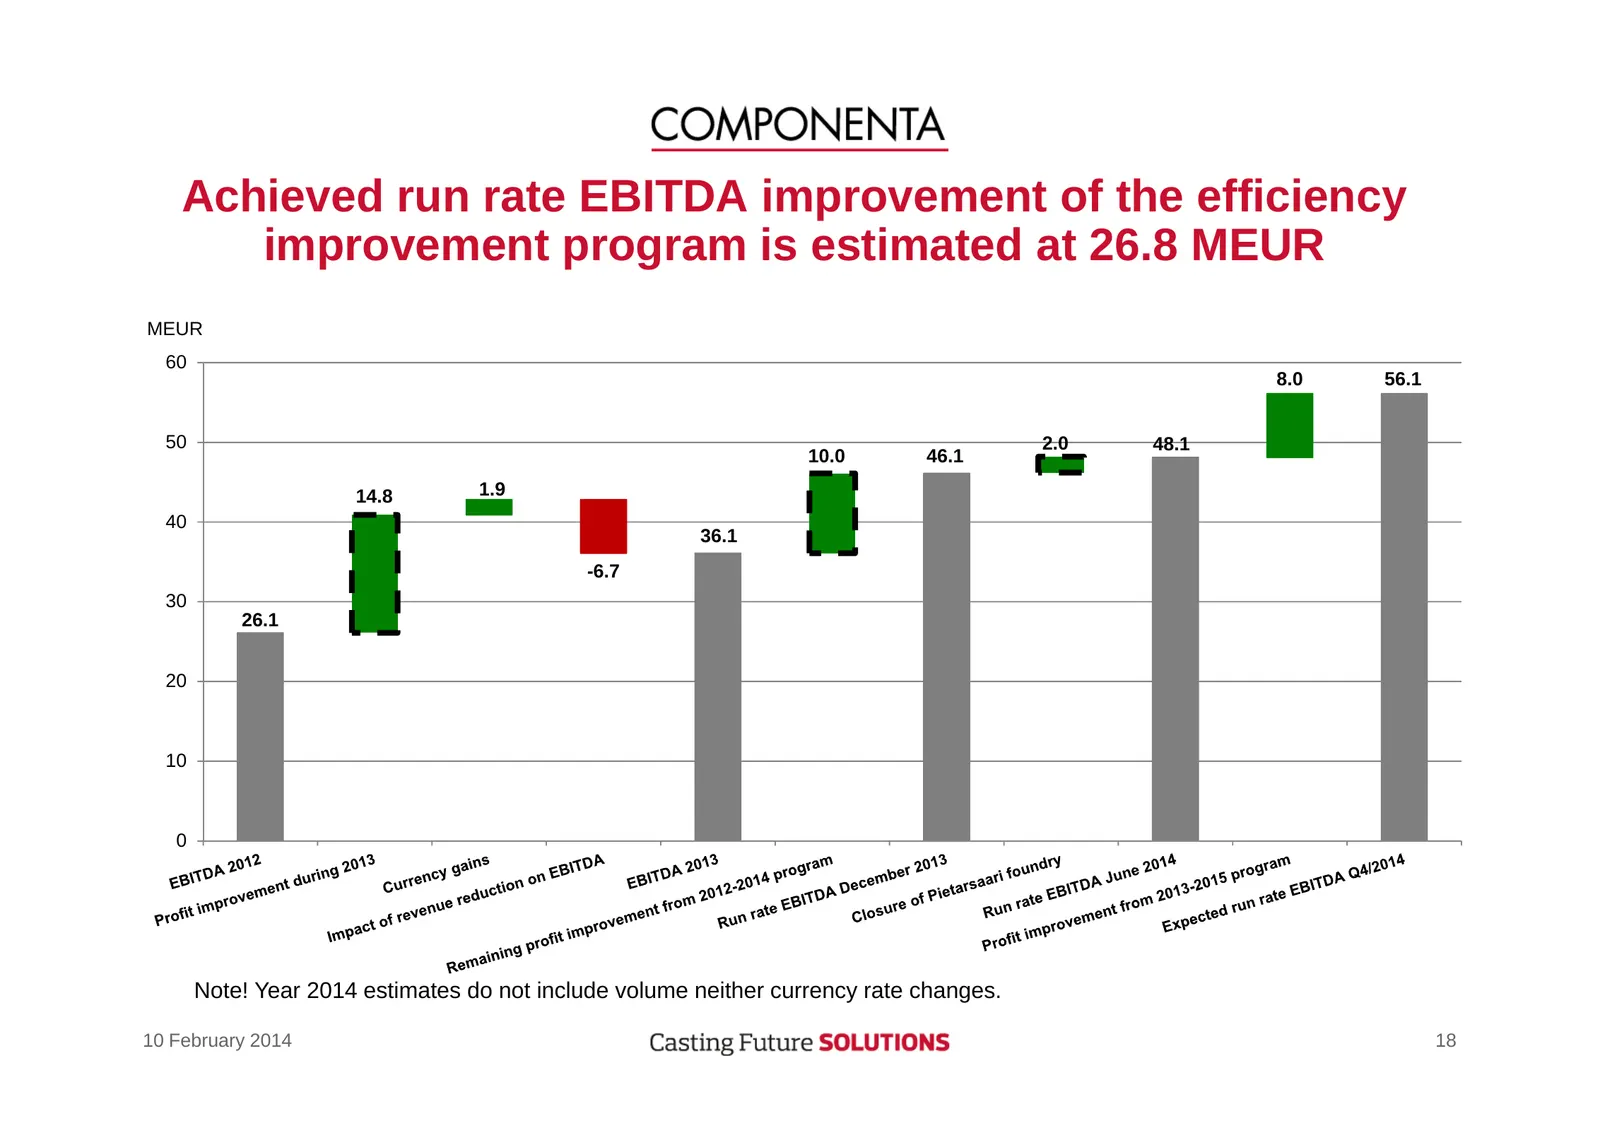
Slide 18: Achieved run rate EBITDA improvement estimated at 26.8 MEUR
Achieved run rate EBITDA improvement of the efficiency improvement program is estimated at 26.8 MEUR MEUR 60 8.0 56.1 50 2.0 48.1 10.0 46.1 14.8 1.9 40 36.1 -6.7 30 26.1 20 10 0 Note! Year 2014 estimates do not include volume neither currency rate changes. 10 February 2014 18
Slide 19: Indicators of economy
Indicators of economy 10 February 2014 19
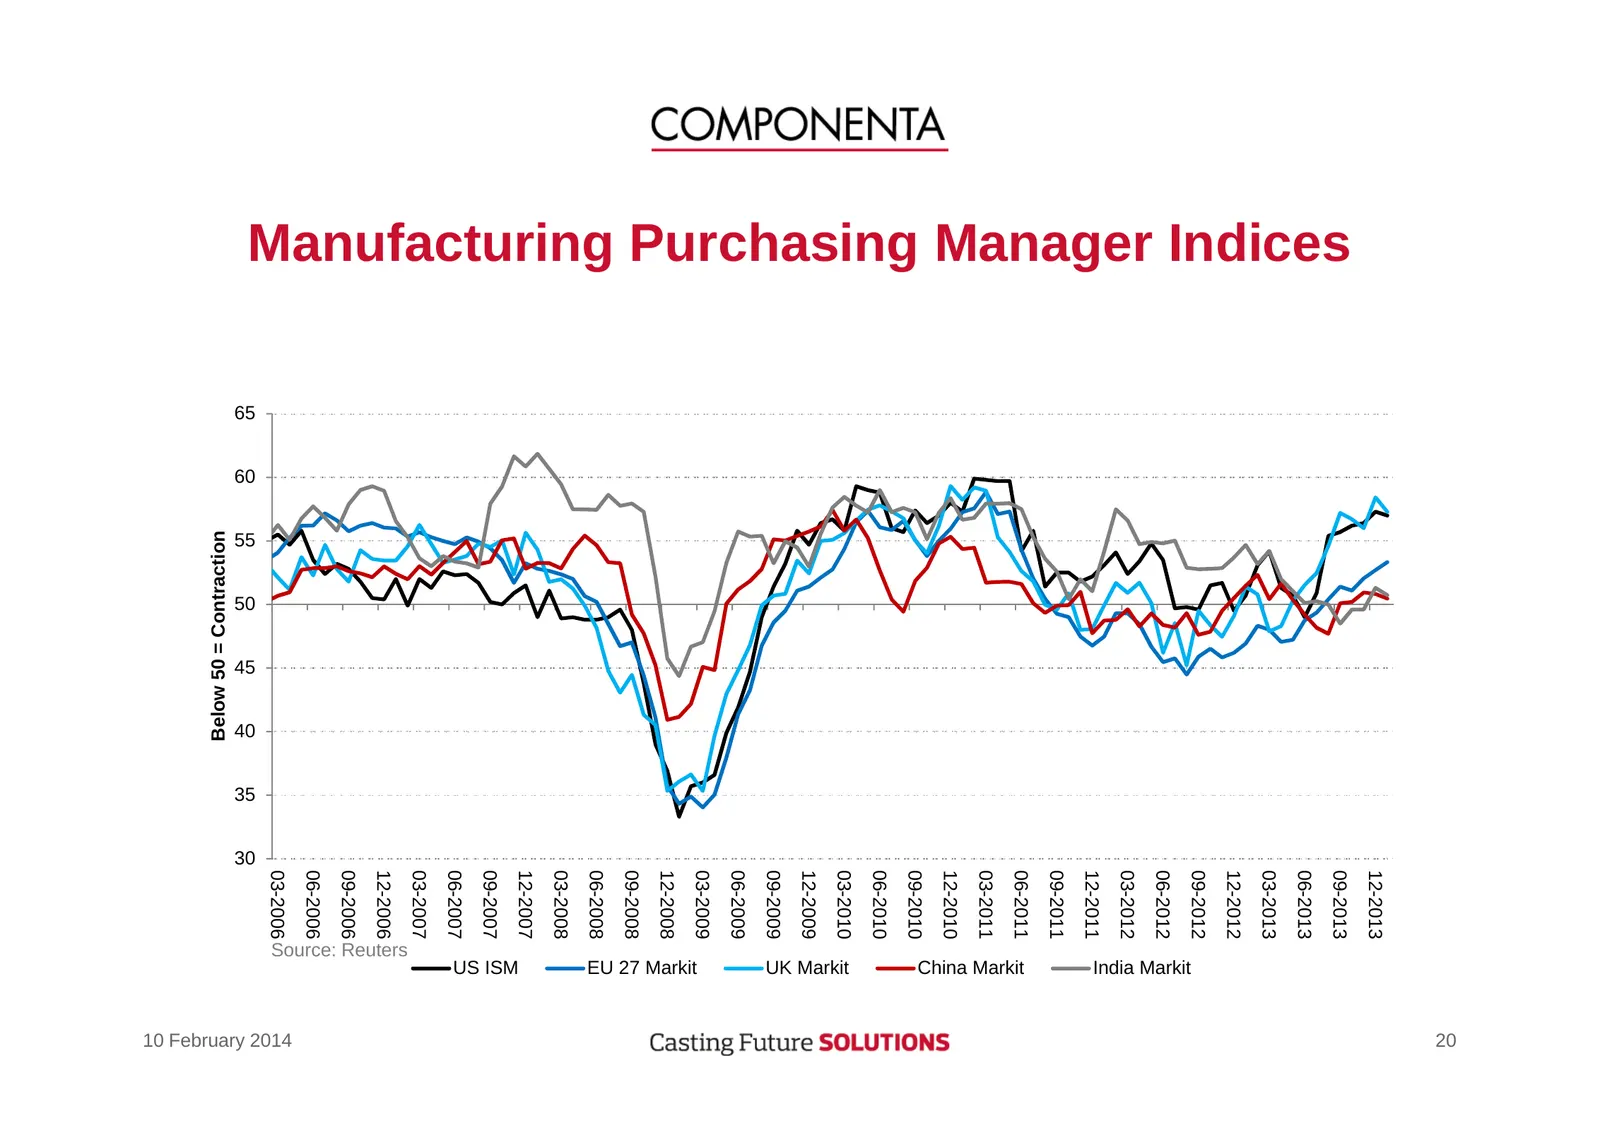
Slide 20: Manufacturing Purchasing Manager Indices
20 12-2013 Manufacturing Purchasing Manager Indices 09-2013 06-2013 03-2013 12-2012 09-2012 India Markit 06-2012 03-2012 12-2011 09-2011 06-2011 03-2011 China Markit 12-2010 09-2010 06-2010 03-2010 UK Markit 12-2009 09-2009 06-2009 03-2009 EU 27 Markit 12-2008 09-2008 06-2008 03-2008 12-2007 US ISM
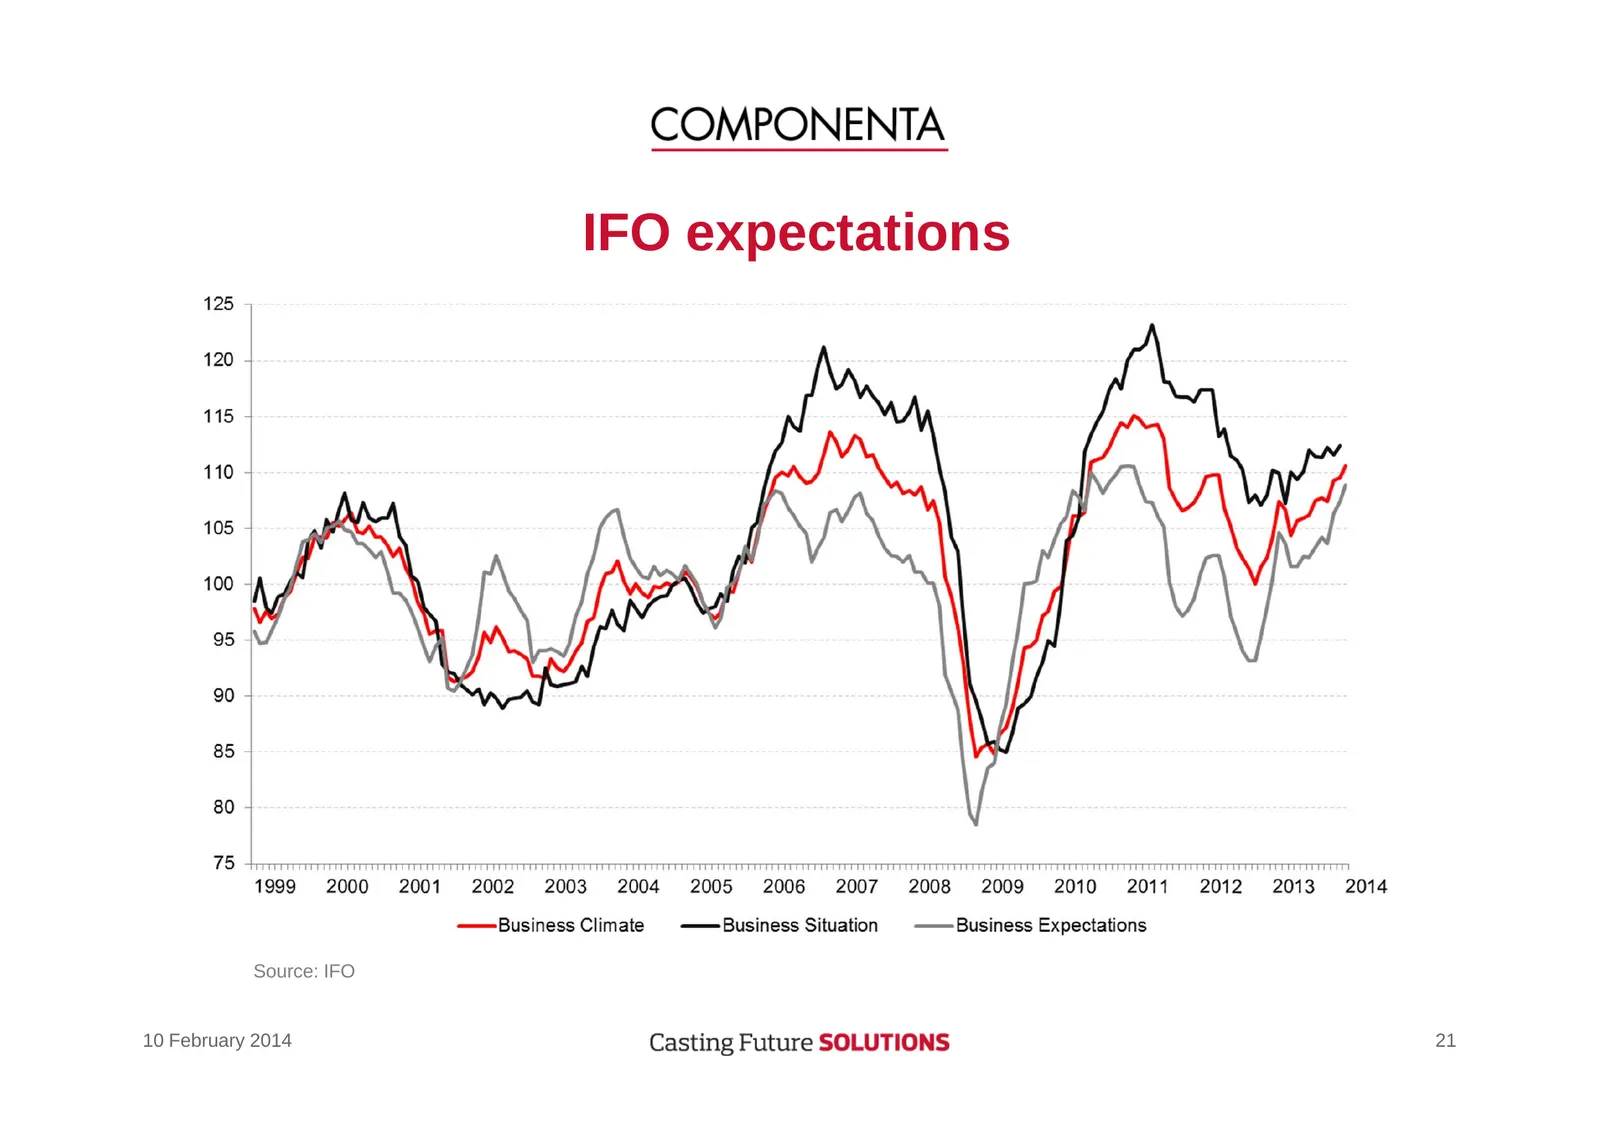
Slide 21: IFO expectations
IFO expectations Source: IFO 10 February 2014 21
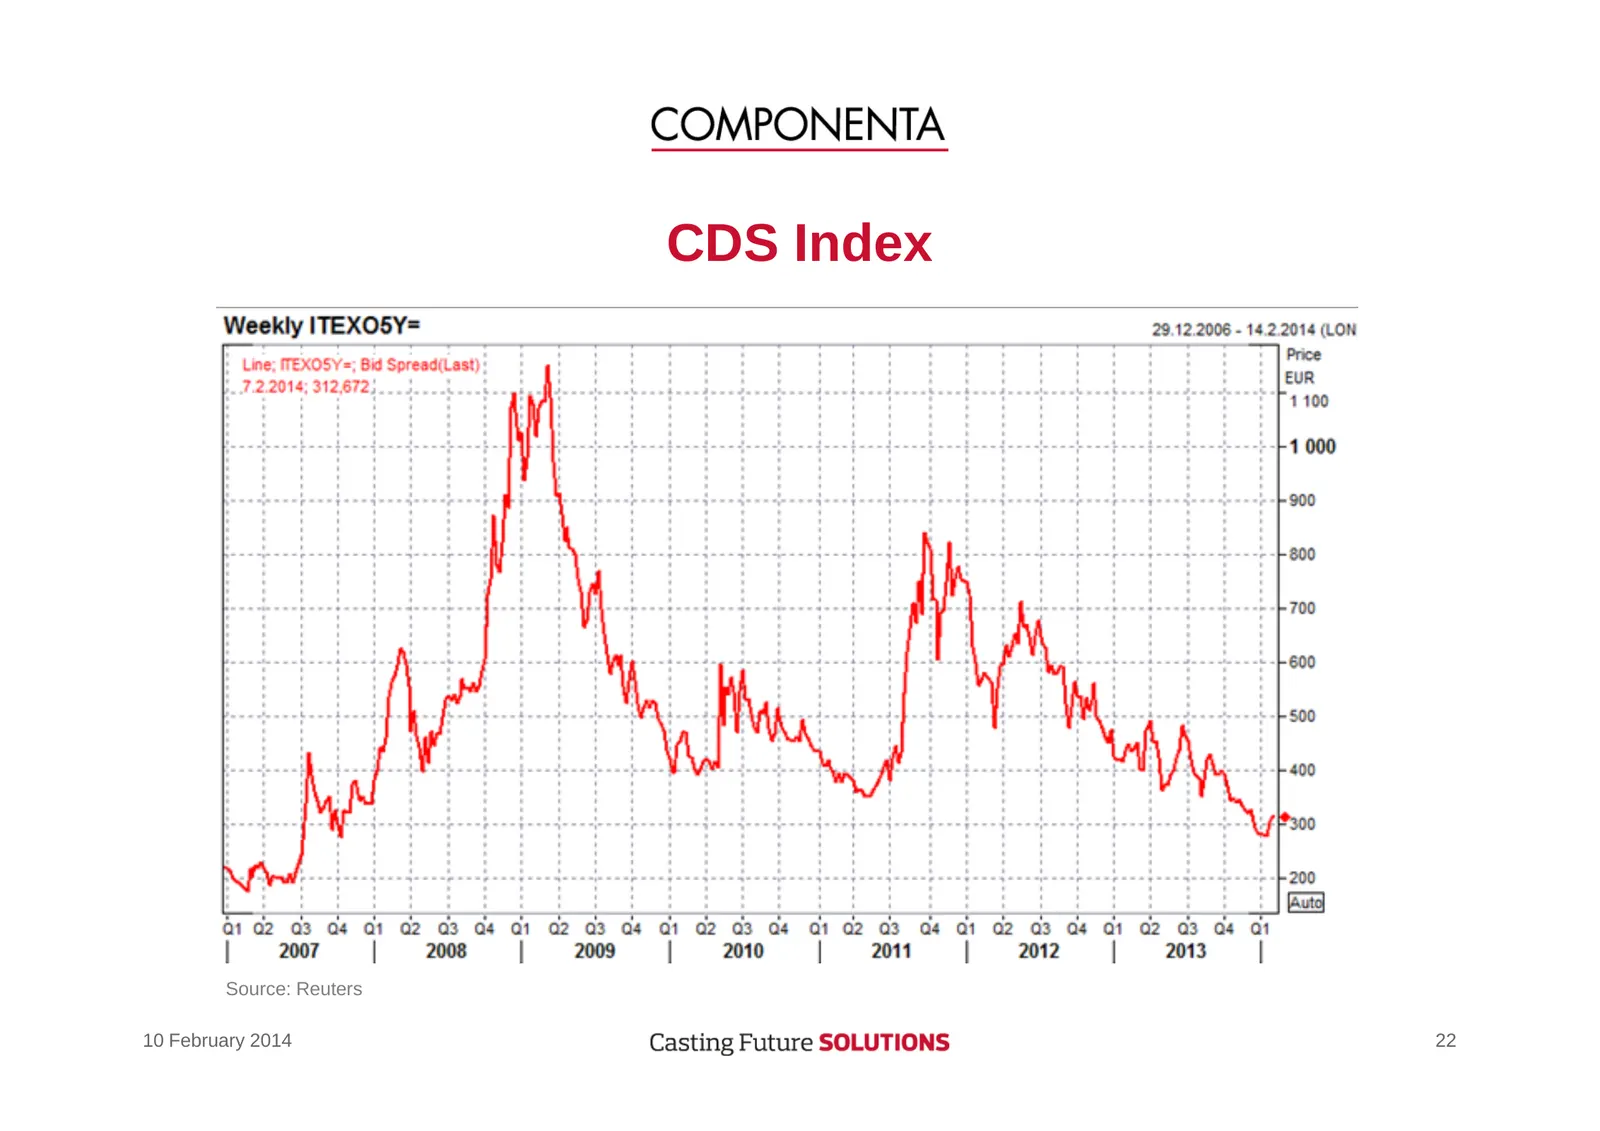
Slide 22: CDS Index
CDS Index Source: Reuters 10 February 2014 22
Slide 23: Development of sales and order book
Development of sales and order book 10 February 2014 23
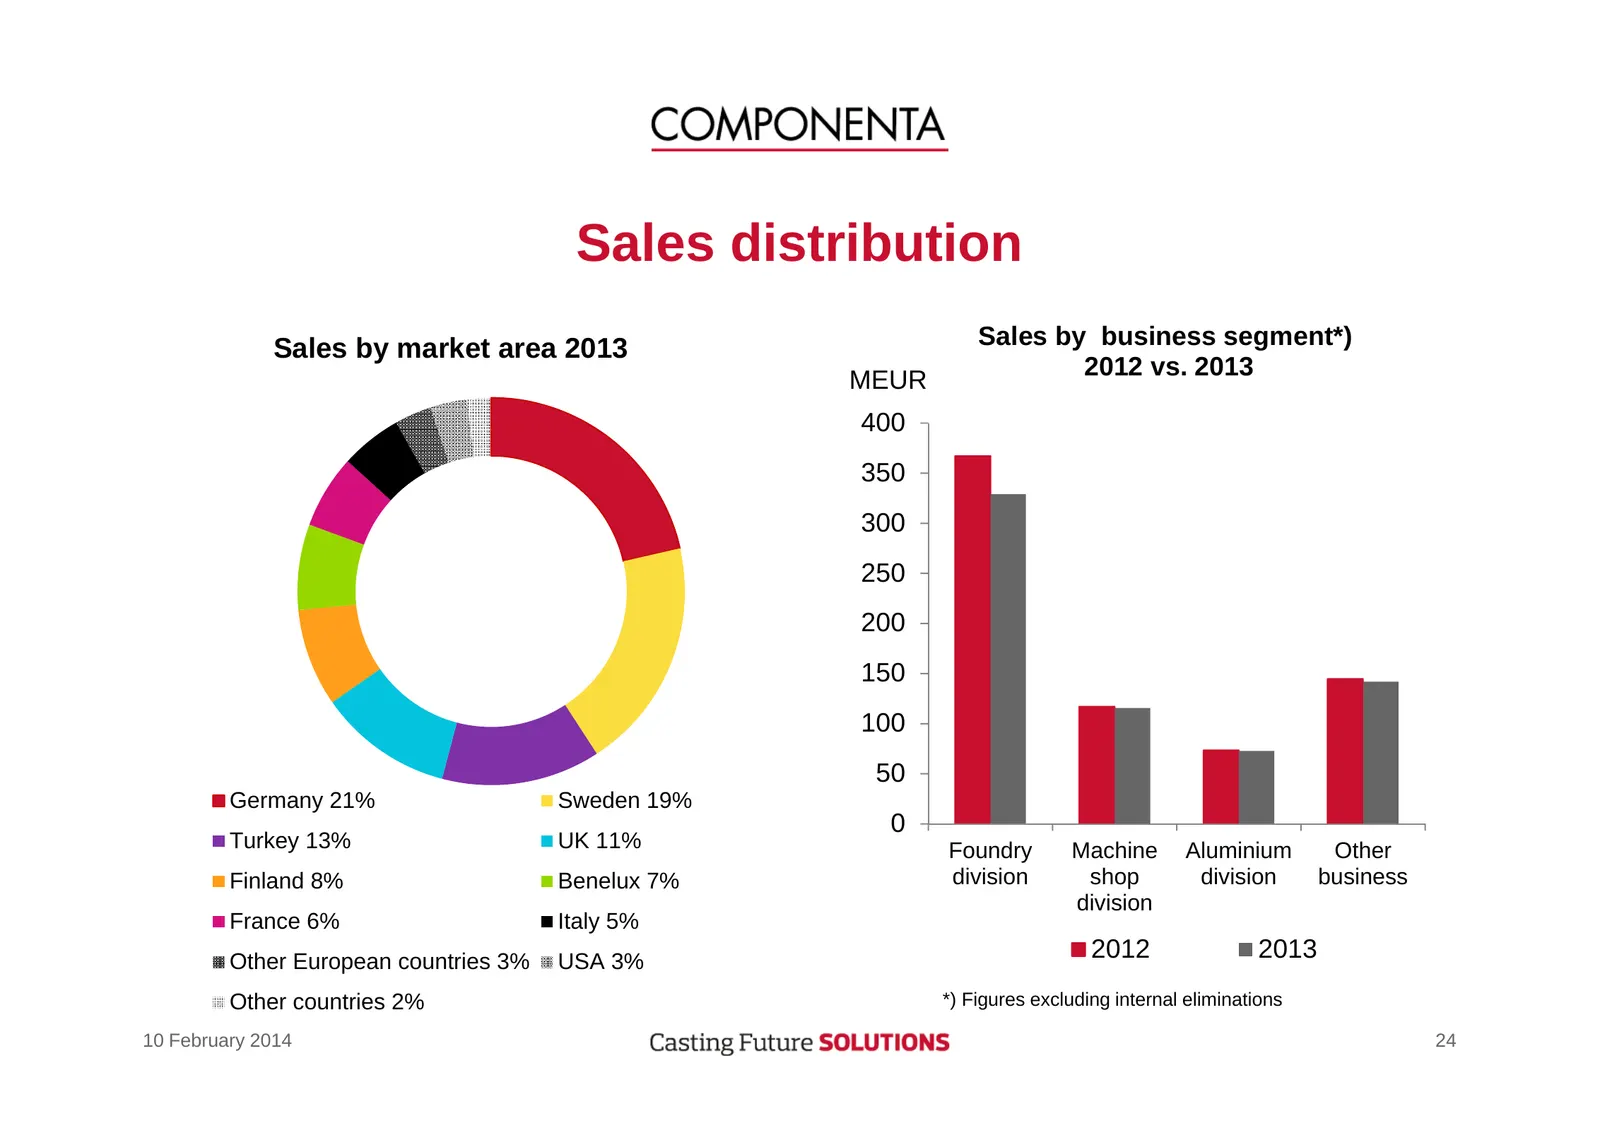
Slide 24: Sales distribution
Sales distribution Sales by market area 2013 Sales by business segment*) 2012 vs. 2013 MEUR 400 350 300 250 200 150 100 50 Germany 21% Sweden 19% 0 Turkey 13% UK 11% Foundry Machine Aluminium Other Finland 8% Benelux 7% division shop division business division France 6% Italy 5% Other European count
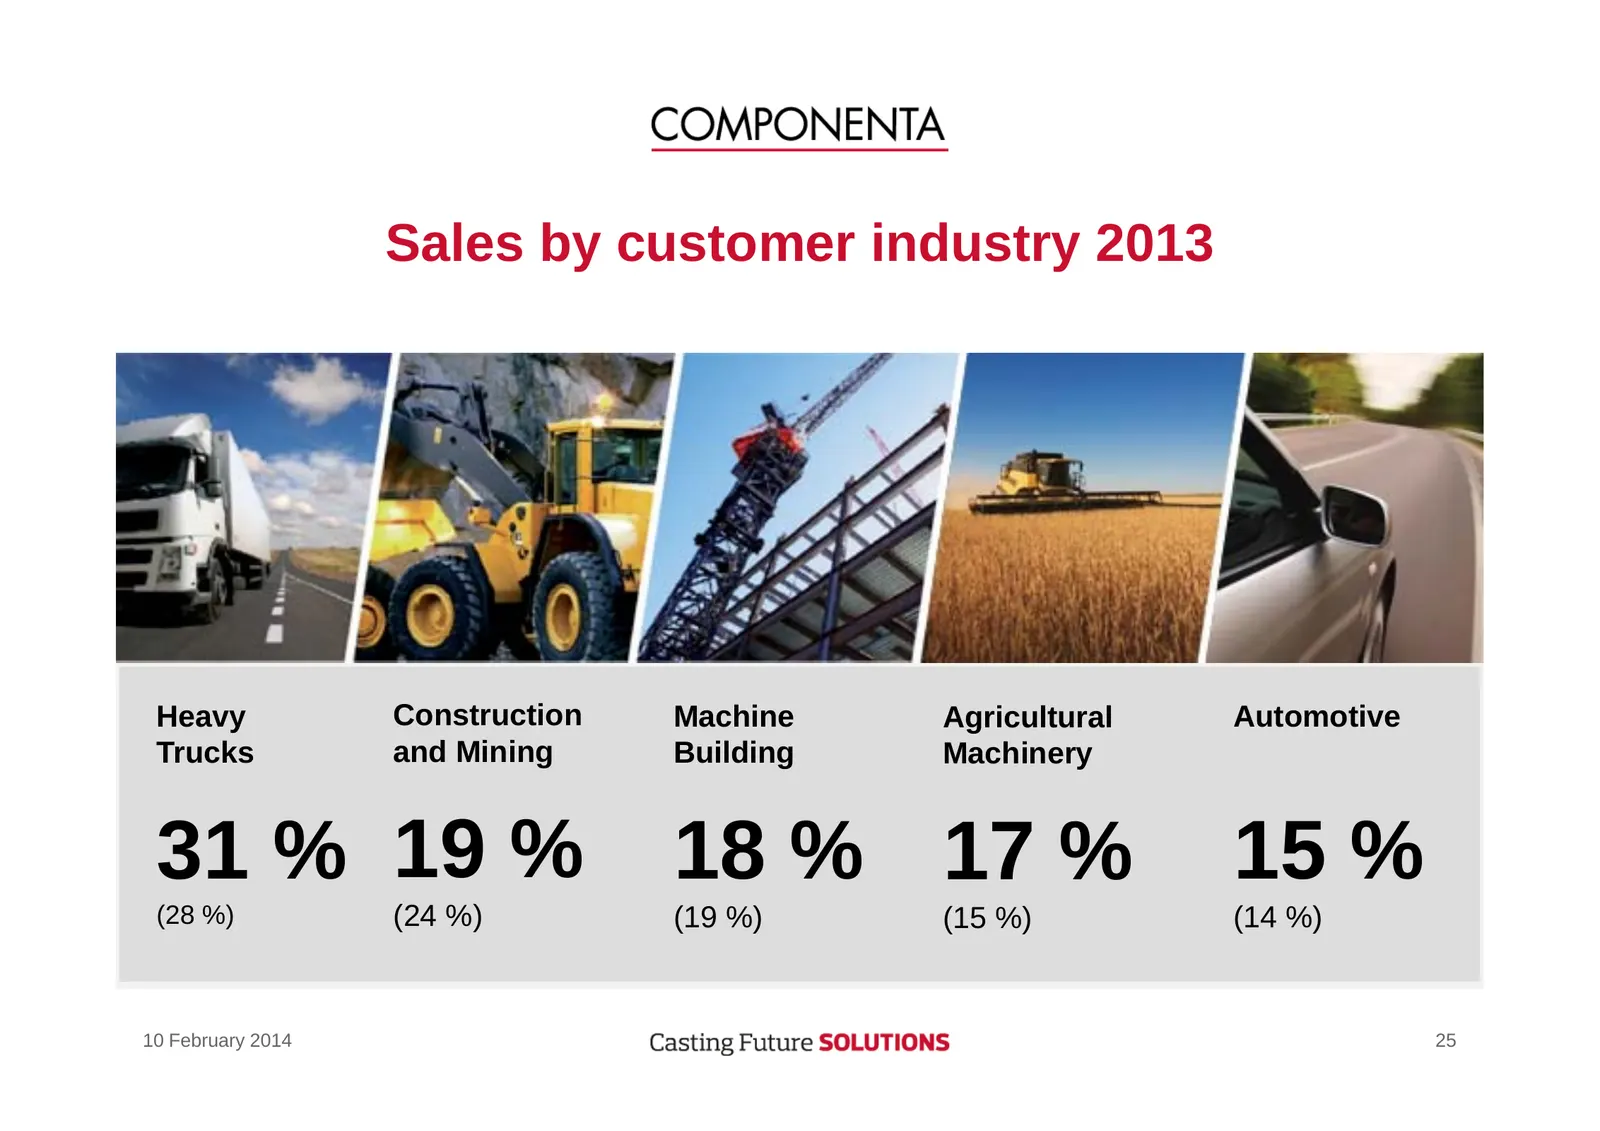
Slide 25: Sales by customer industry 2013
Sales by customer industry 2013 Heavy Construction Machine Agricultural Automotive Trucks and Mining Building Machinery 31 % 19 % 18 % 17 % 15 % (28 %) (24 %) (19 %) (15 %) (14 %) 10 February 2014 25
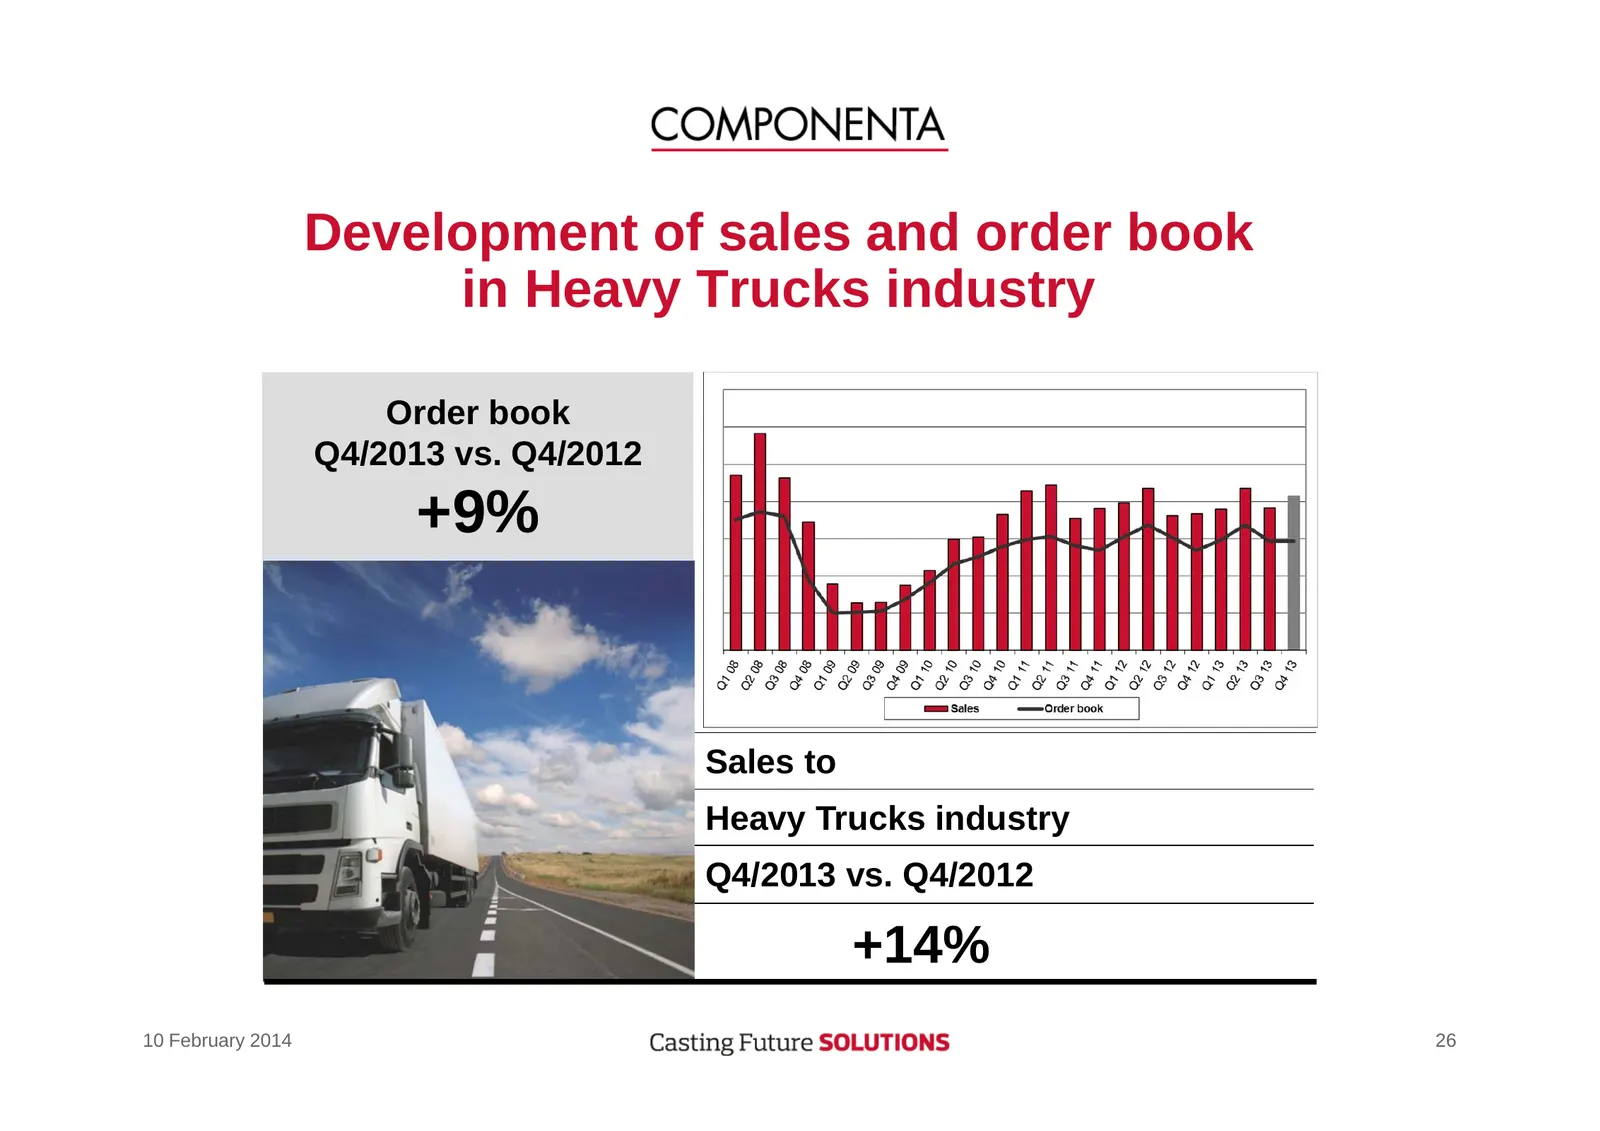
Slide 26: Development of sales and order book in Heavy Trucks industry
Development of sales and order book in Heavy Trucks industry Order book Q4/2013 vs. Q4/2012 +9% Sales to Heavy Trucks industry Q4/2013 vs. Q4/2012 +14% 10 February 2014 26
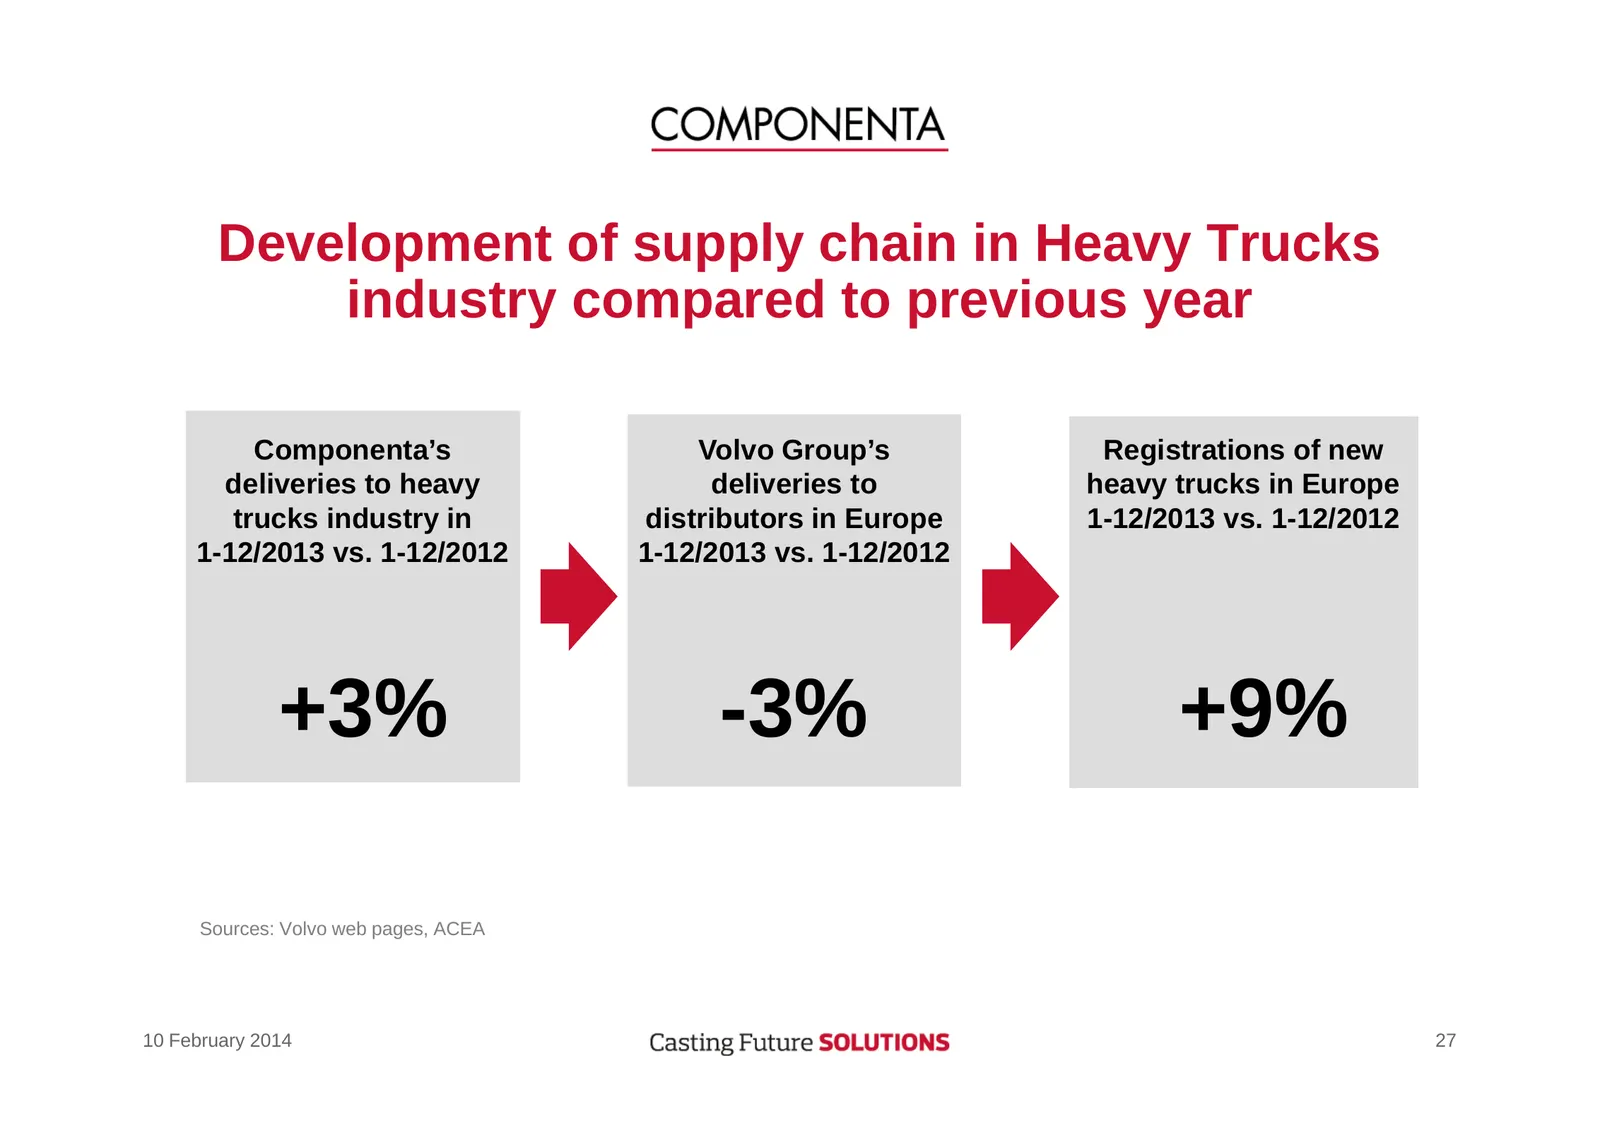
Slide 27: Development of supply chain in Heavy Trucks industry
Development of supply chain in Heavy Trucks industry compared to previous year Componenta’s Volvo Group’s Registrations of new deliveries to heavy deliveries to heavy trucks in Europe trucks industry in distributors in Europe 1-12/2013 vs. 1-12/2012 1-12/2013 vs. 1-12/2012 1-12/2013 vs. 1-12/2012 +3
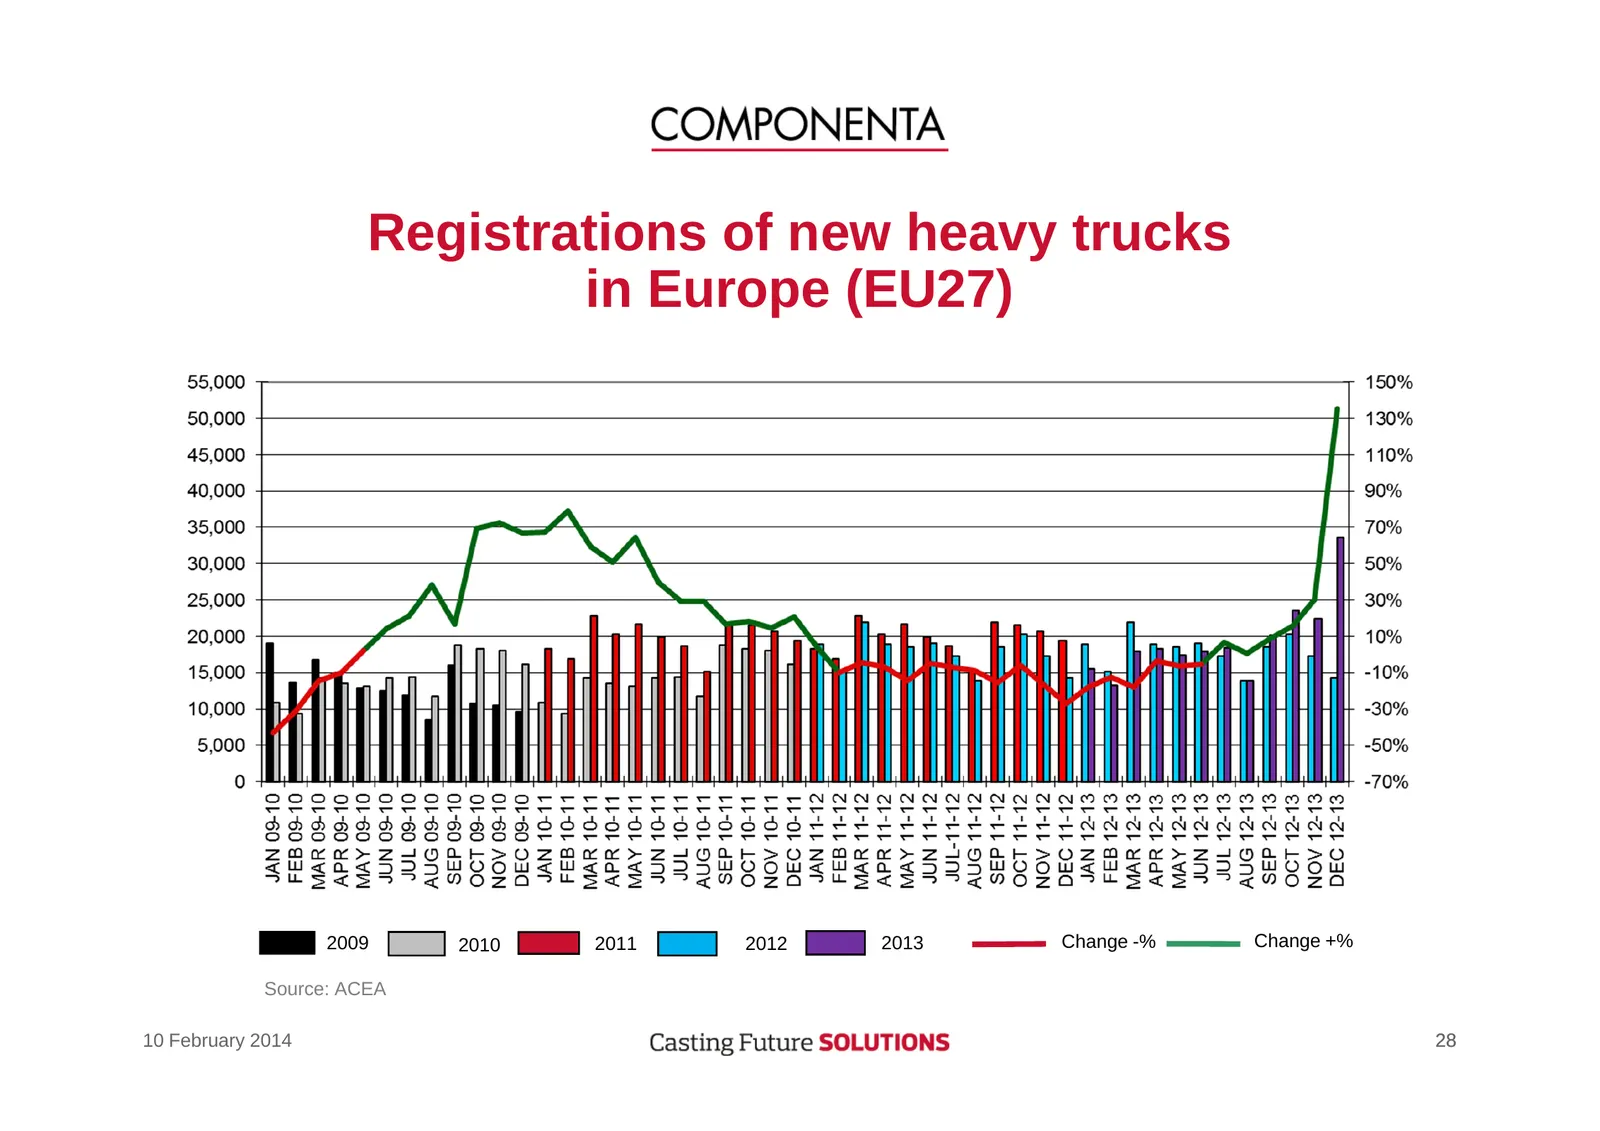
Slide 28: Registrations of new heavy trucks in Europe (EU27)
Registrations of new heavy trucks in Europe (EU27) 2009 2010 2011 2012 2013 Change -% Change +% Source: ACEA 10 February 2014 28
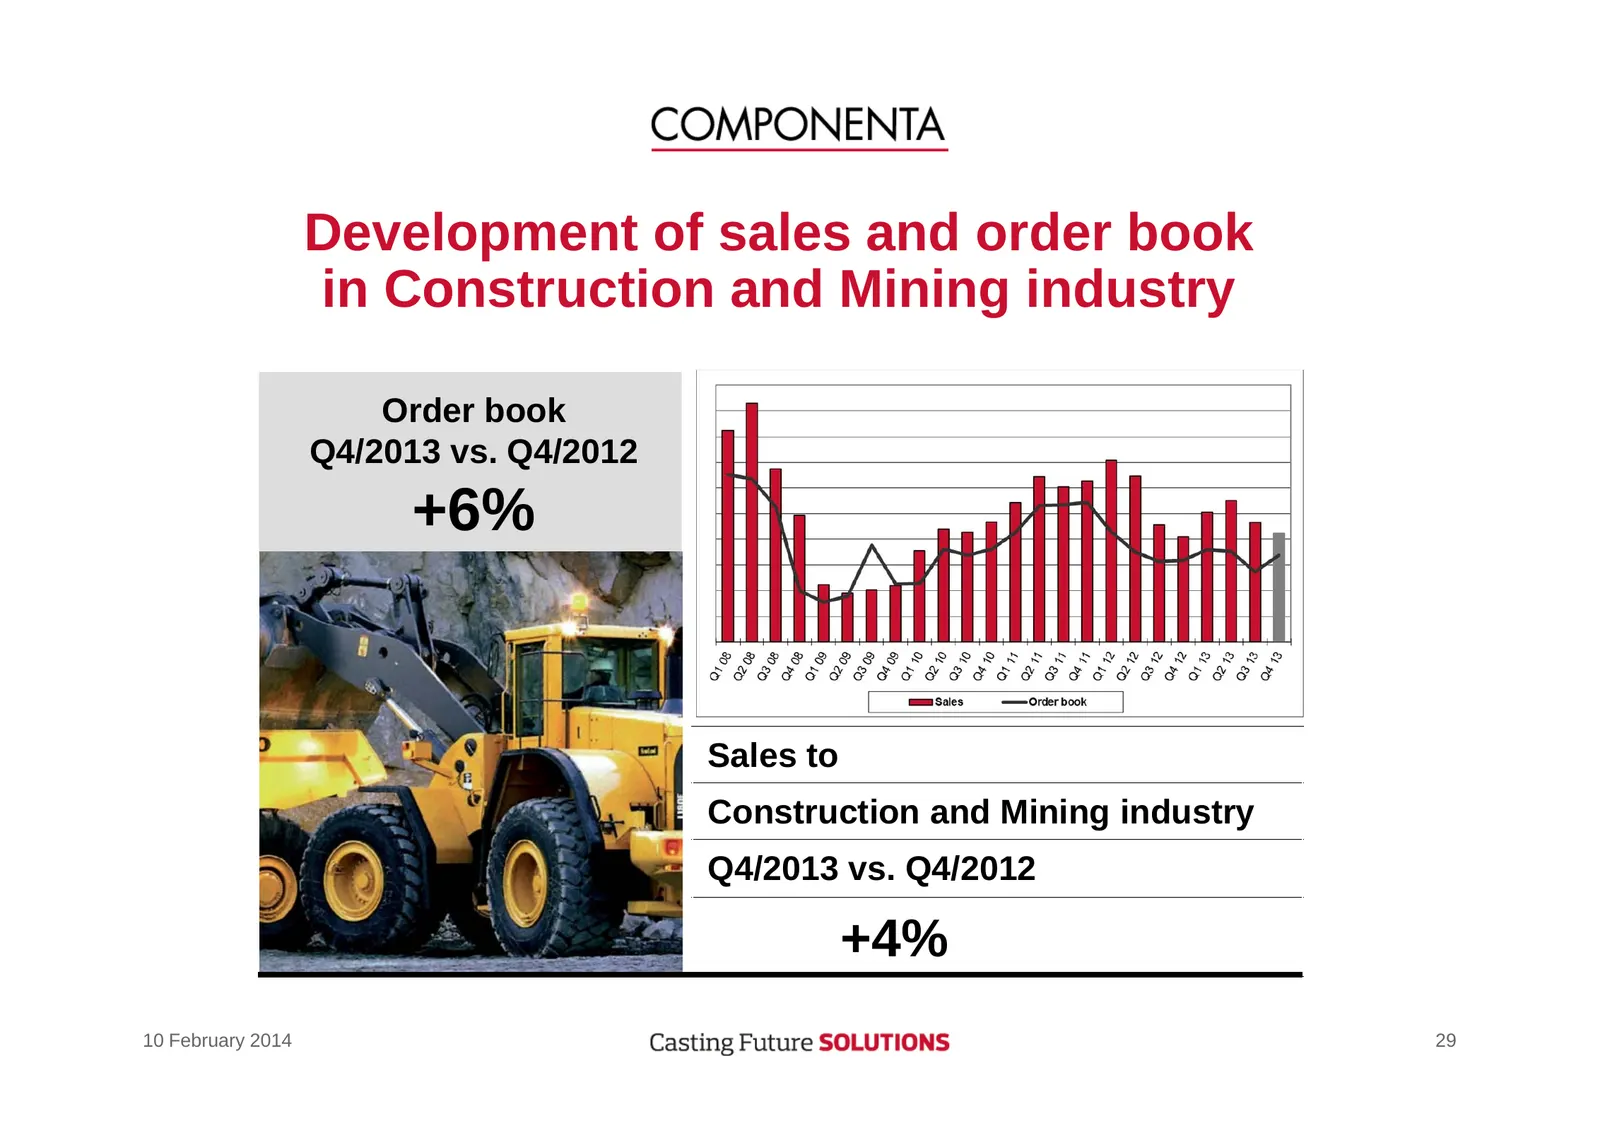
Slide 29: Development of sales and order book in Construction and Mining industry
Development of sales and order book in Construction and Mining industry Order book Q4/2013 vs. Q4/2012 +6% Sales to Construction and Mining industry Q4/2013 vs. Q4/2012 +4% 10 February 2014 29
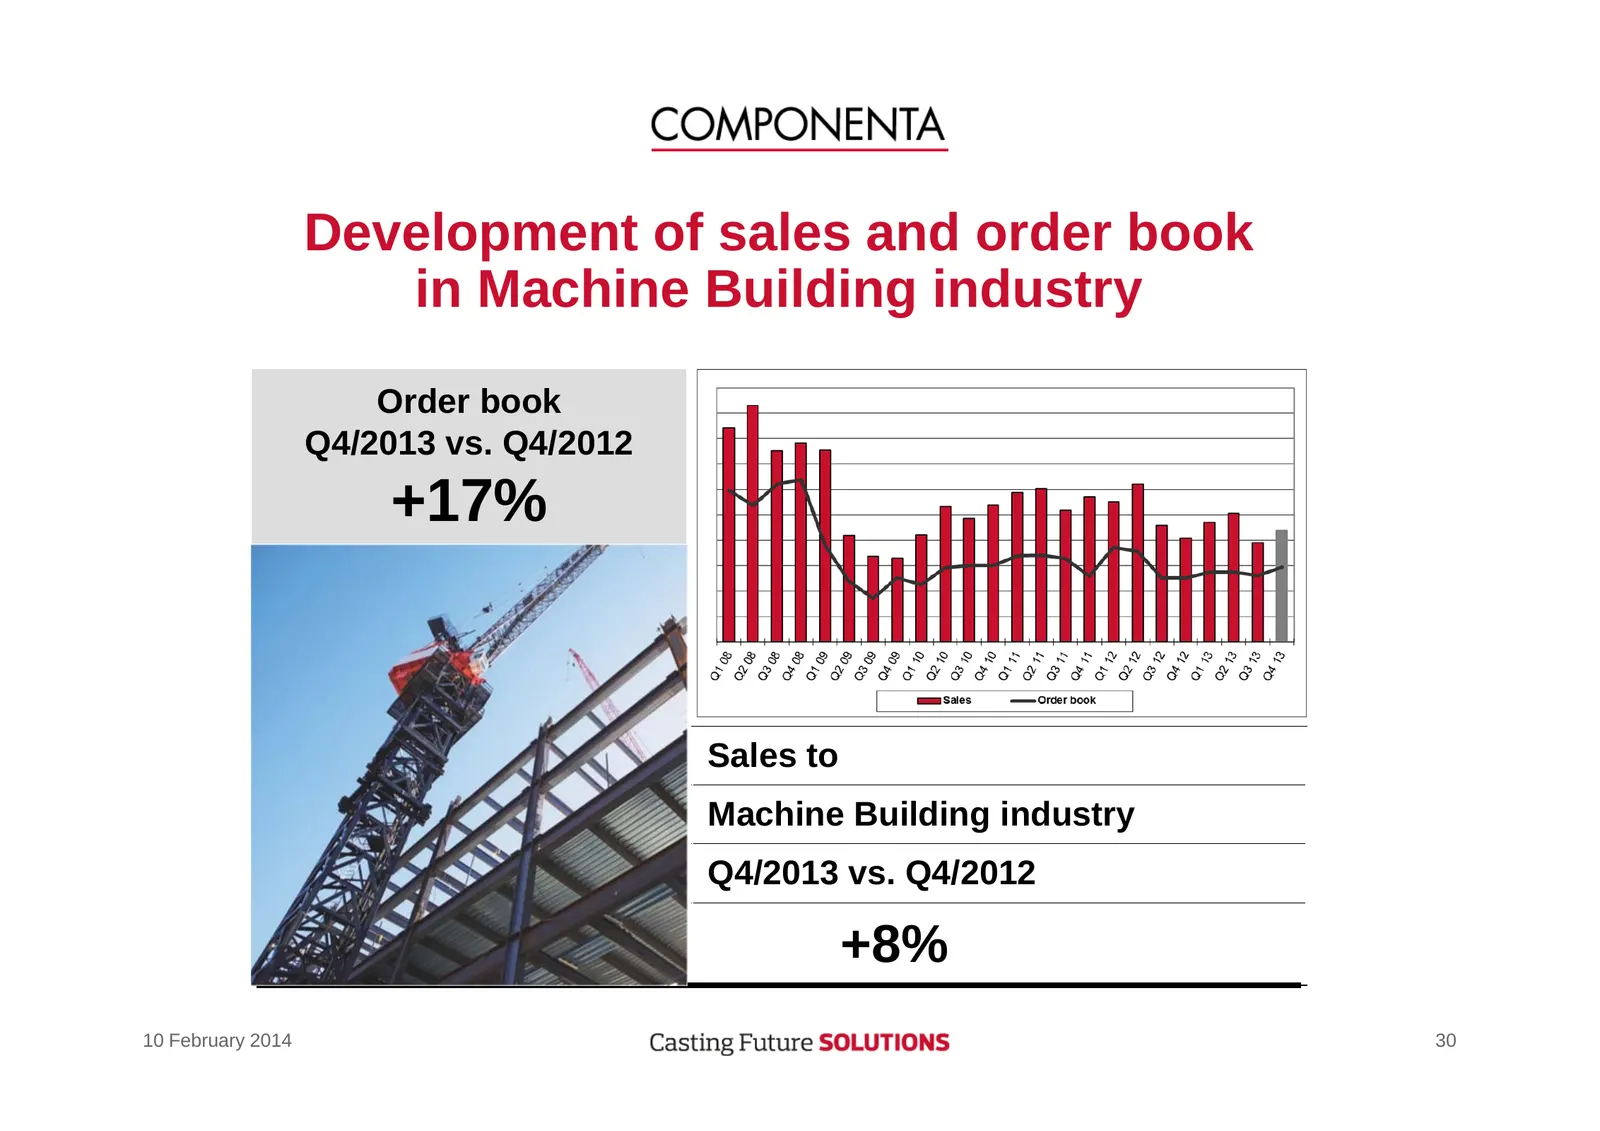
Slide 30: Development of sales and order book in Machine Building industry
Development of sales and order book in Machine Building industry Order book Q4/2013 vs. Q4/2012 +17% Sales to Machine Building industry Q4/2013 vs. Q4/2012 +8% 10 February 2014 30
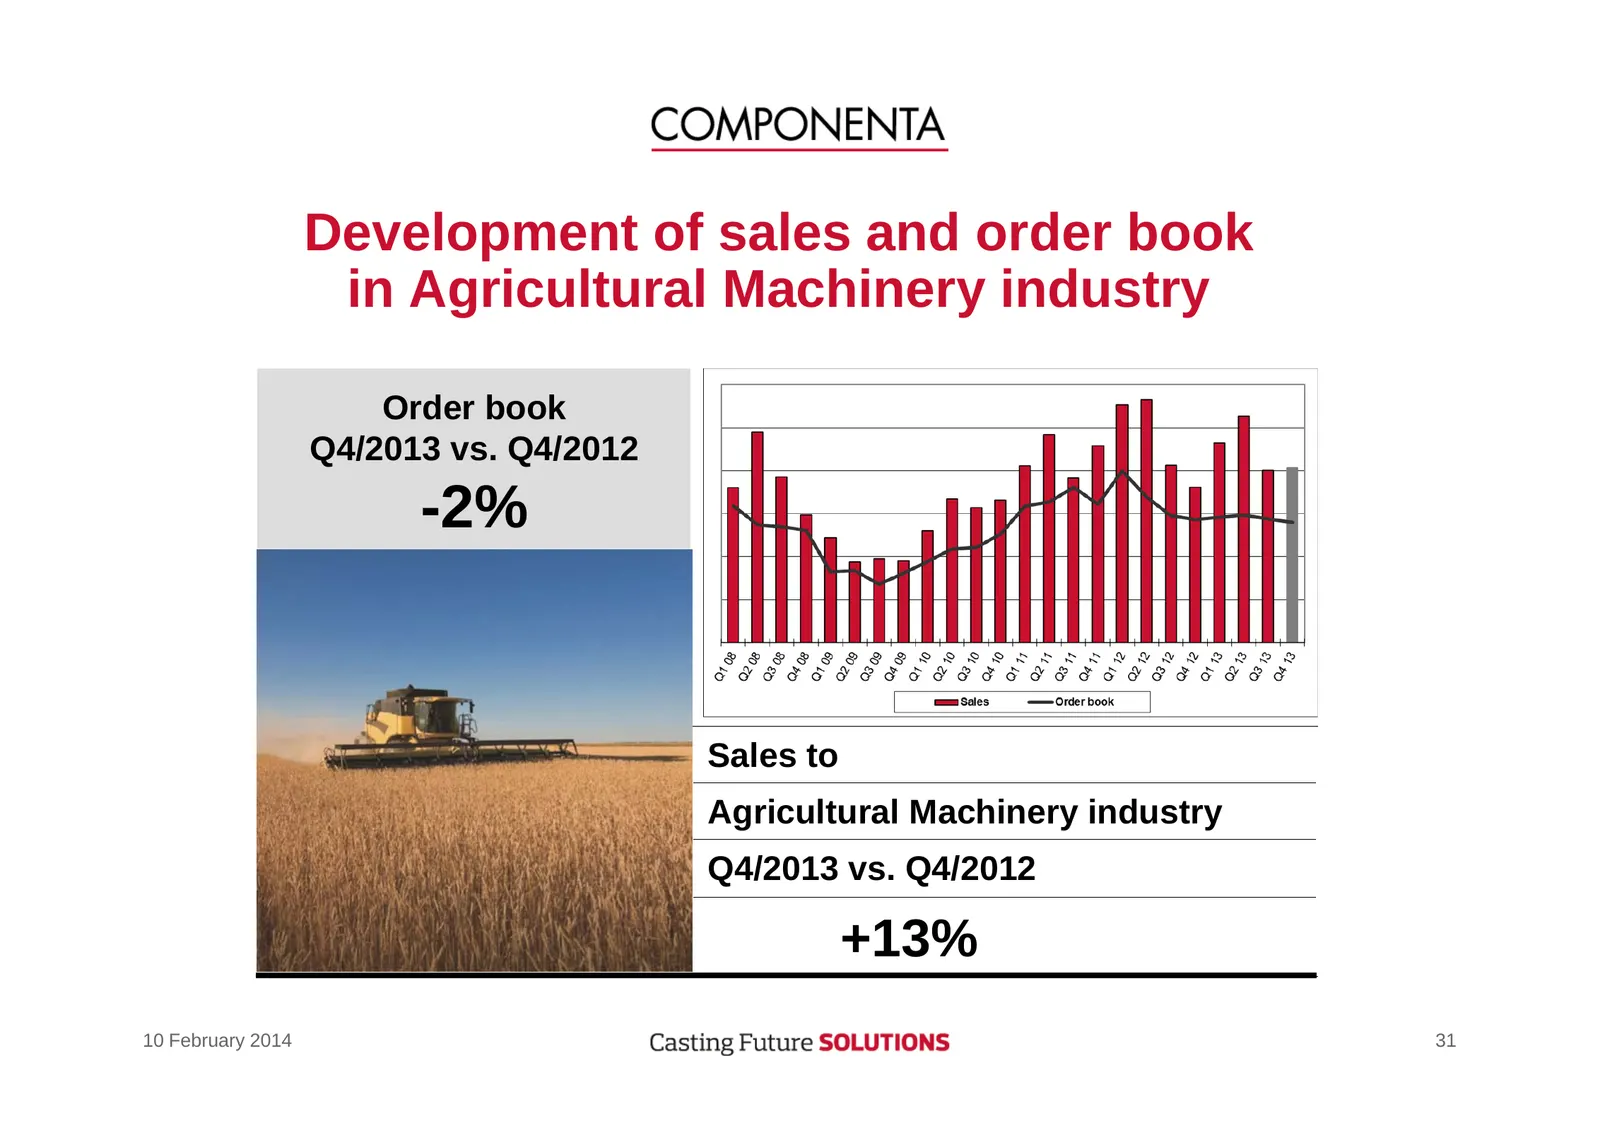
Slide 31: Development of sales and order book in Agricultural Machinery industry
Development of sales and order book in Agricultural Machinery industry Order book Q4/2013 vs. Q4/2012 -2% Sales to Agricultural Machinery industry Q4/2013 vs. Q4/2012 +13% 10 February 2014 31
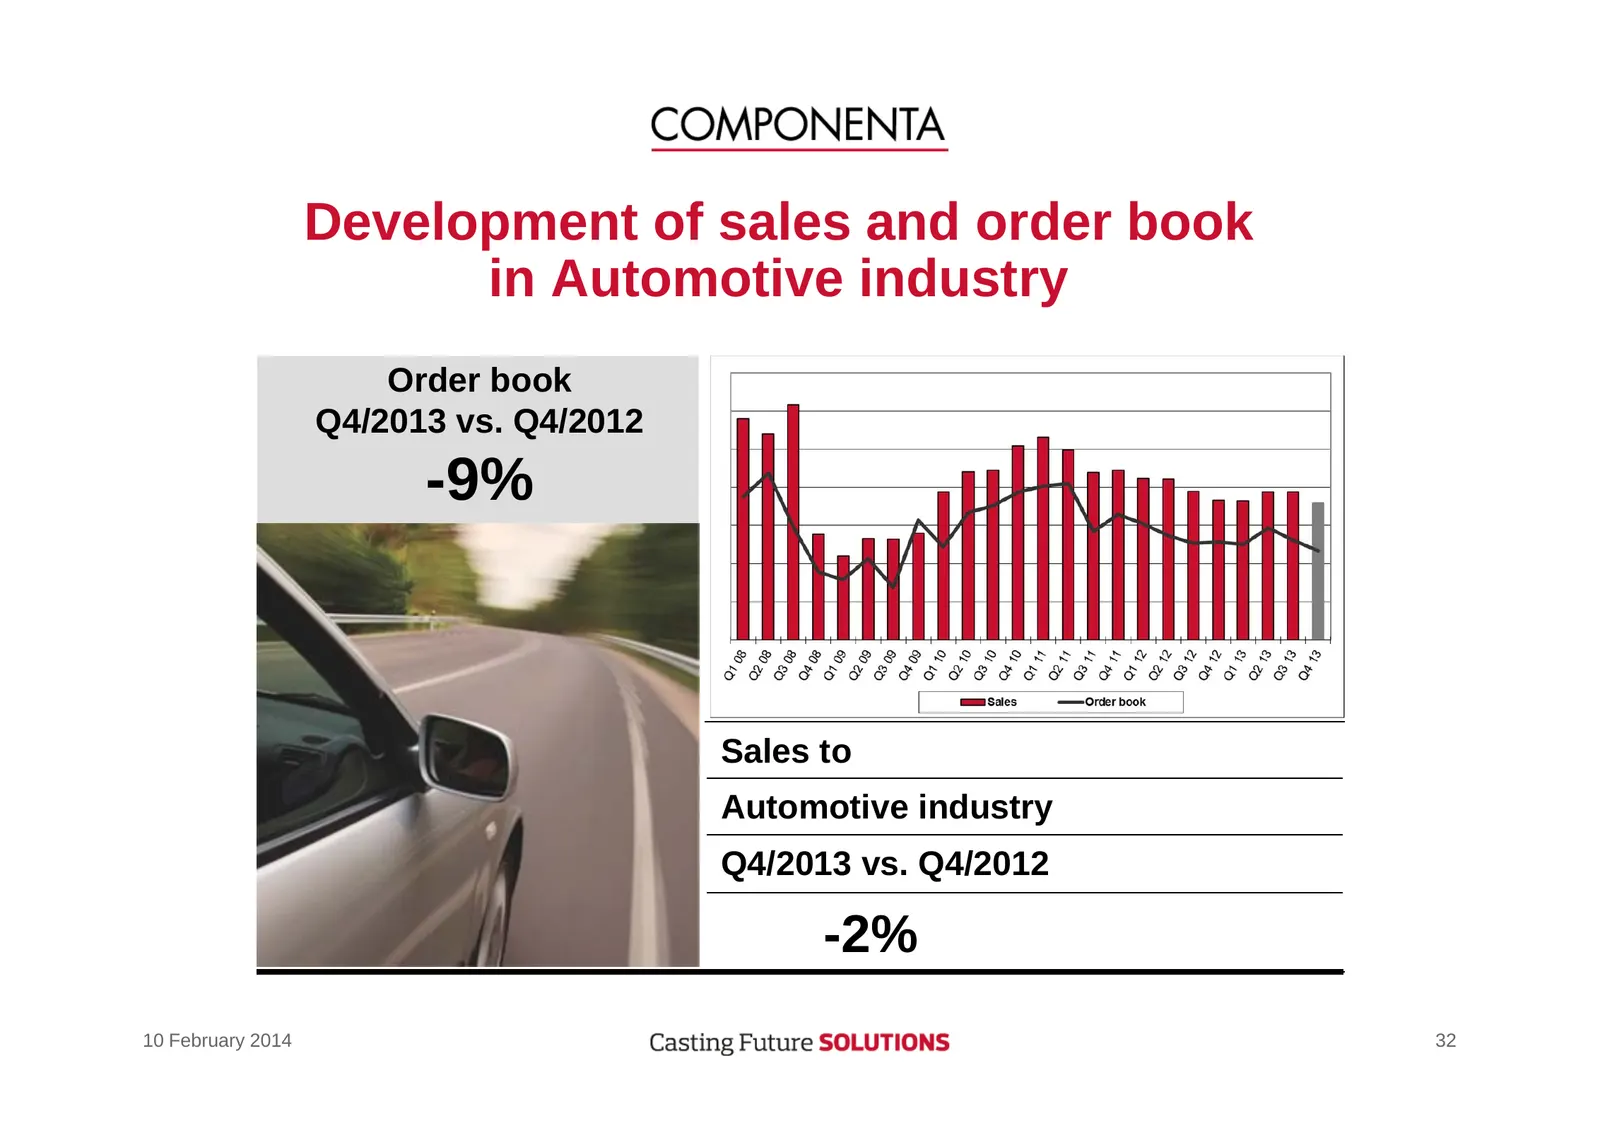
Slide 32: Development of sales and order book in Automotive industry
Development of sales and order book in Automotive industry Order book Q4/2013 vs. Q4/2012 -9% Sales to Automotive industry Q4/2013 vs. Q4/2012 -2% 10 February 2014 32
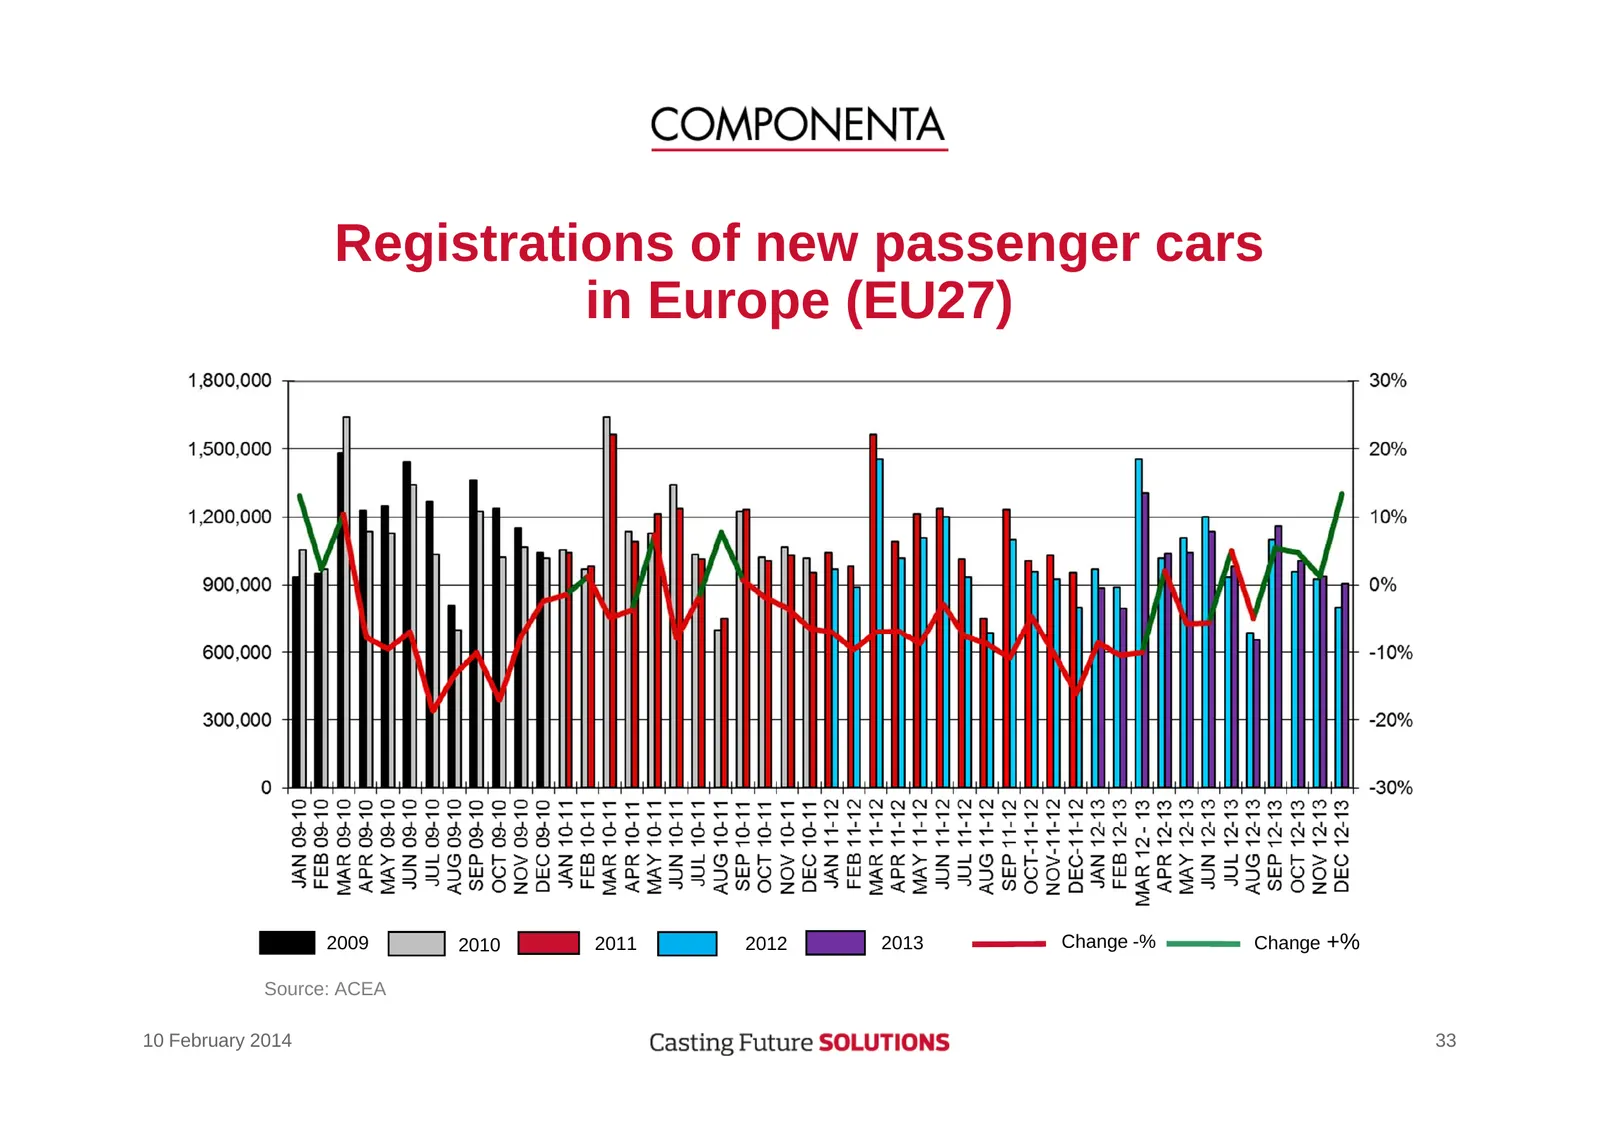
Slide 33: Registrations of new passenger cars in Europe (EU27)
Registrations of new passenger cars in Europe (EU27) 2009 2010 2011 2012 2013 Change -% Change +% Source: ACEA 10 February 2014 33
Slide 34: Offers and new sales
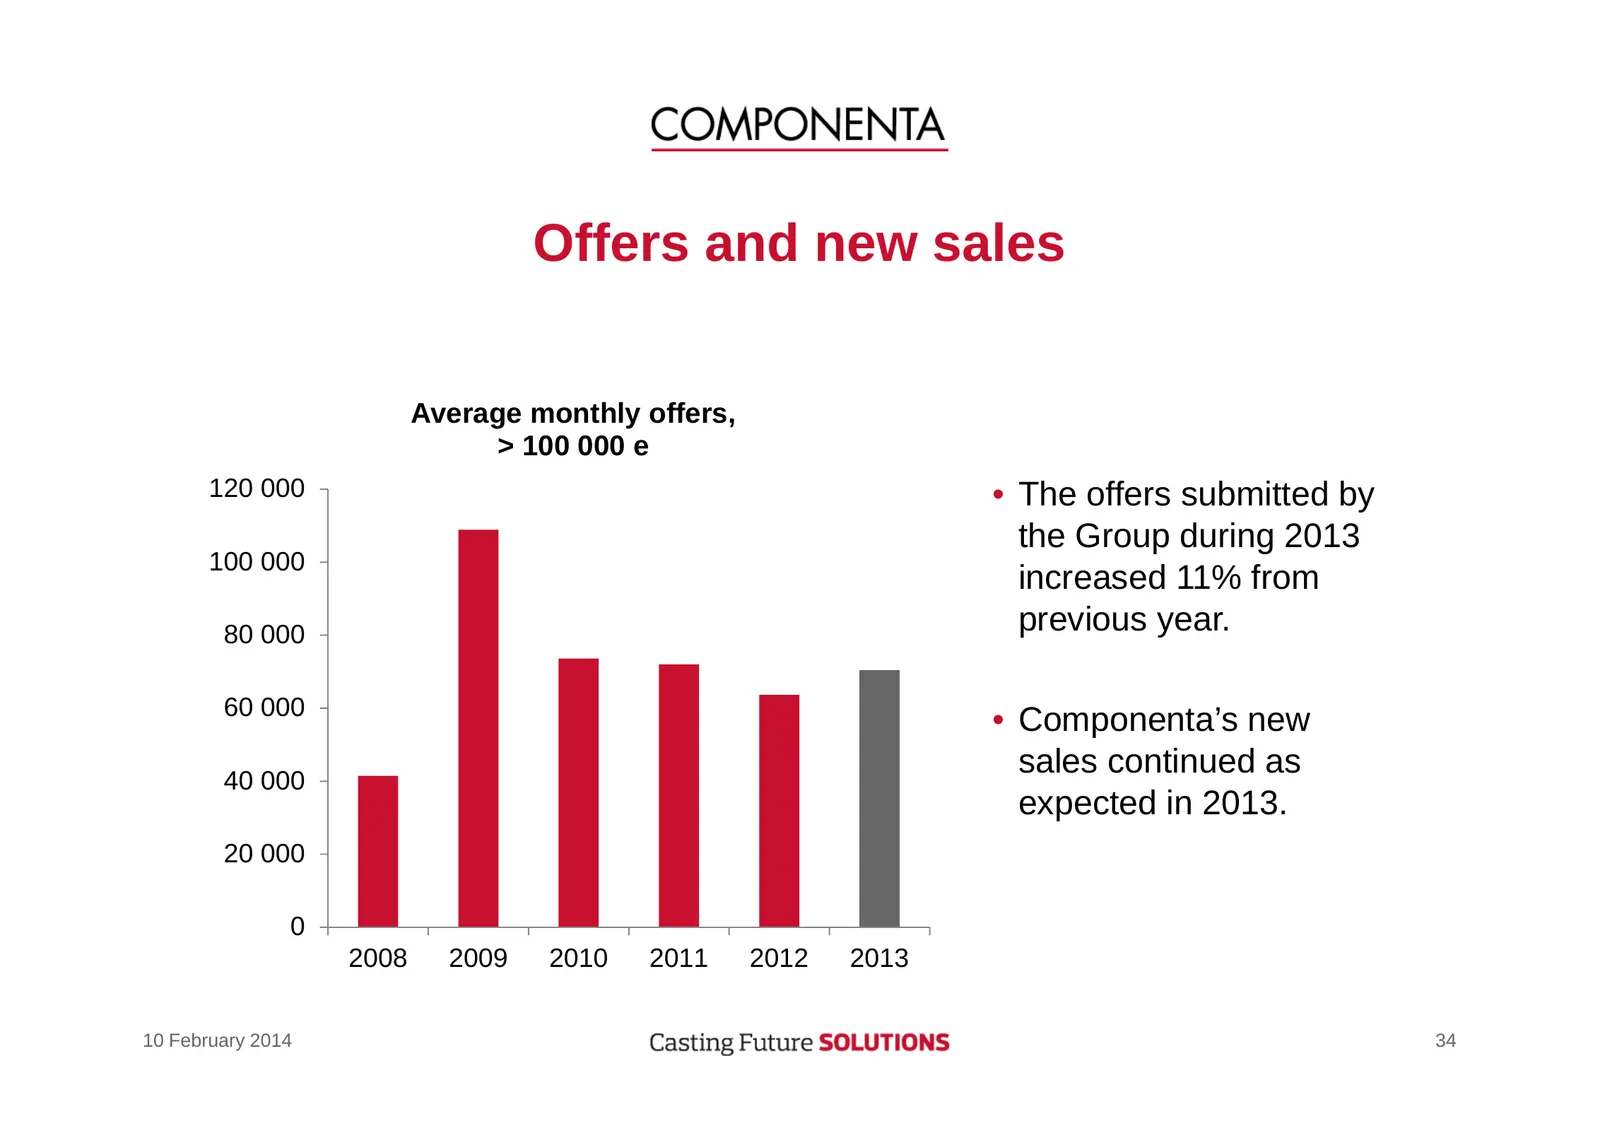
Offers and new sales Average monthly offers, > 100 000 e 120 000 • The offers submitted by the Group during 2013 100 000 increased 11% from 80 000 previous year. 60 000 • Componenta’s new 40 000 sales continued as expected in 2013. 20 000 0 2008 2009 2010 2011 2012 2013 10 February 2014 34
Slide 35: Development of business segments
Development of business segments 10 February 2014 35
Slide 36: Development of Foundry Division
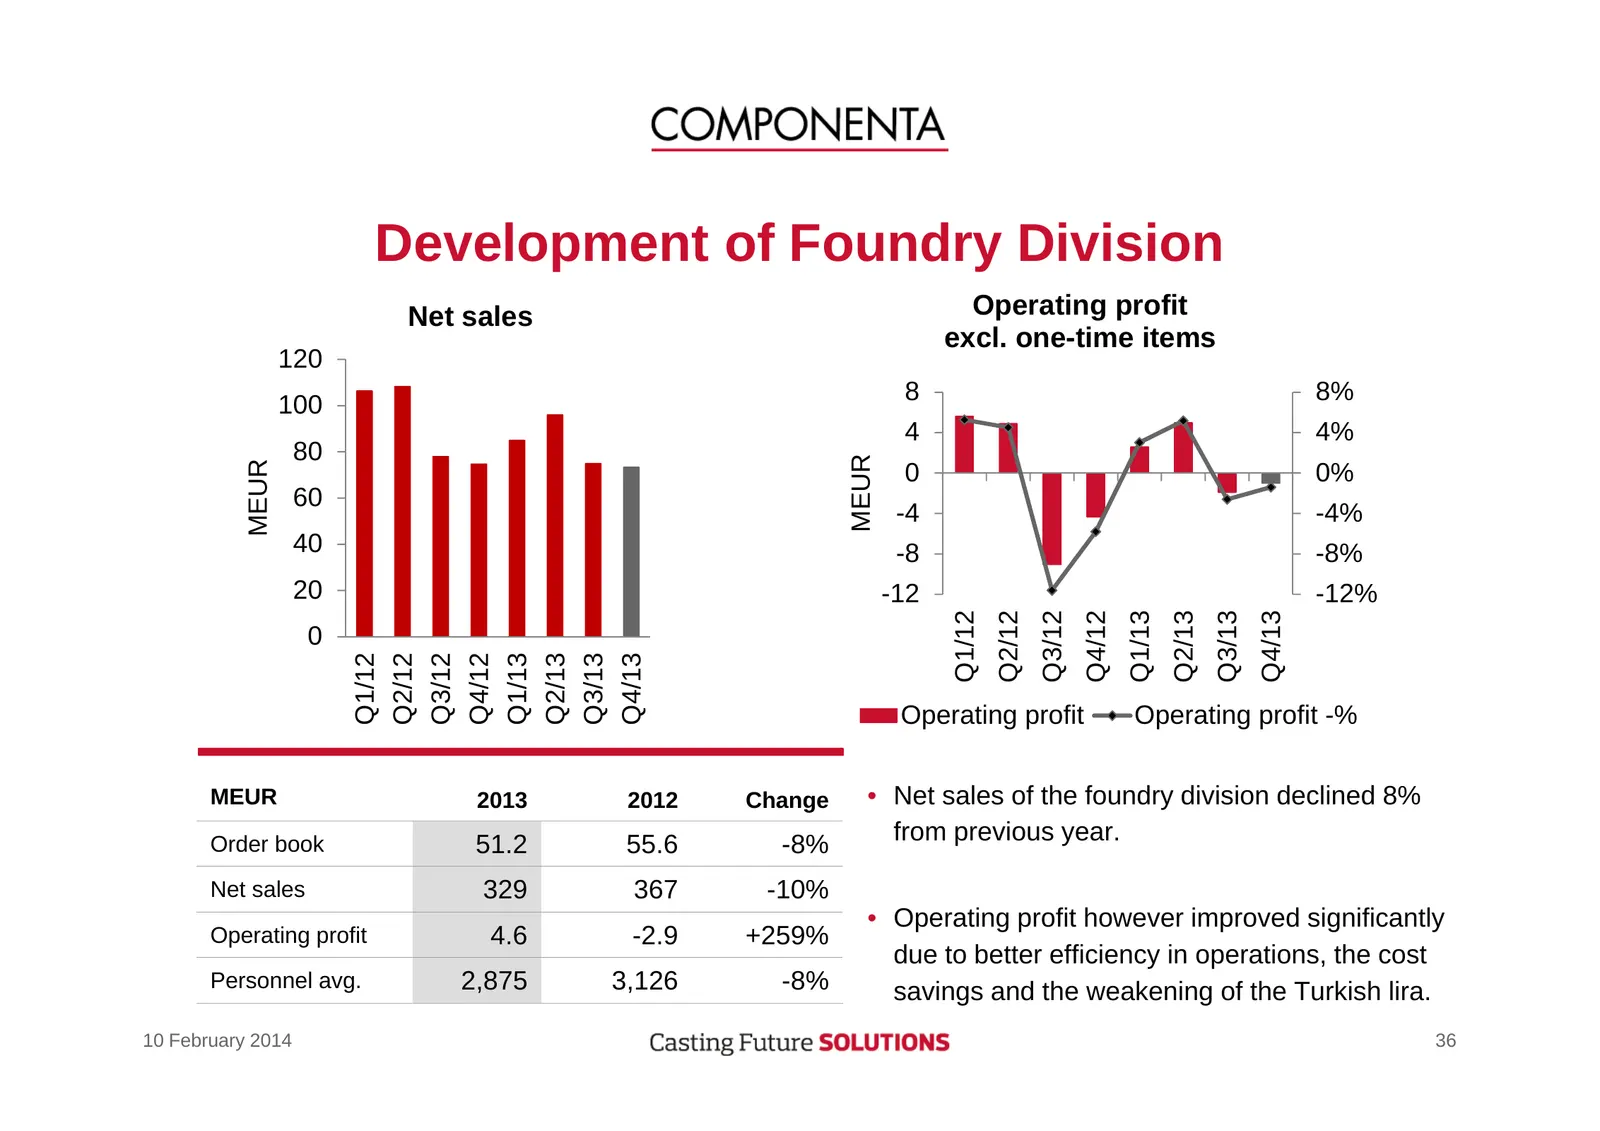
Development of Foundry Division Net sales Operating profit excl. one-time items 120 8 8% 100 4 4% 80 MEUR MEUR 0 0% 60 -4 -4% 40 -8 -8% 20 -12 -12% Q1/12 Q2/12 Q3/12 Q4/12 Q1/13 Q2/13 Q3/13 Q4/13 0 Q1/12 Q2/12 Q3/12 Q4/12 Q1/13 Q2/13 Q3/13 Q4/13 Operating profit Operating profit -% MEUR 2013 2012 Ch
Slide 37: Development of Machine Shop Division
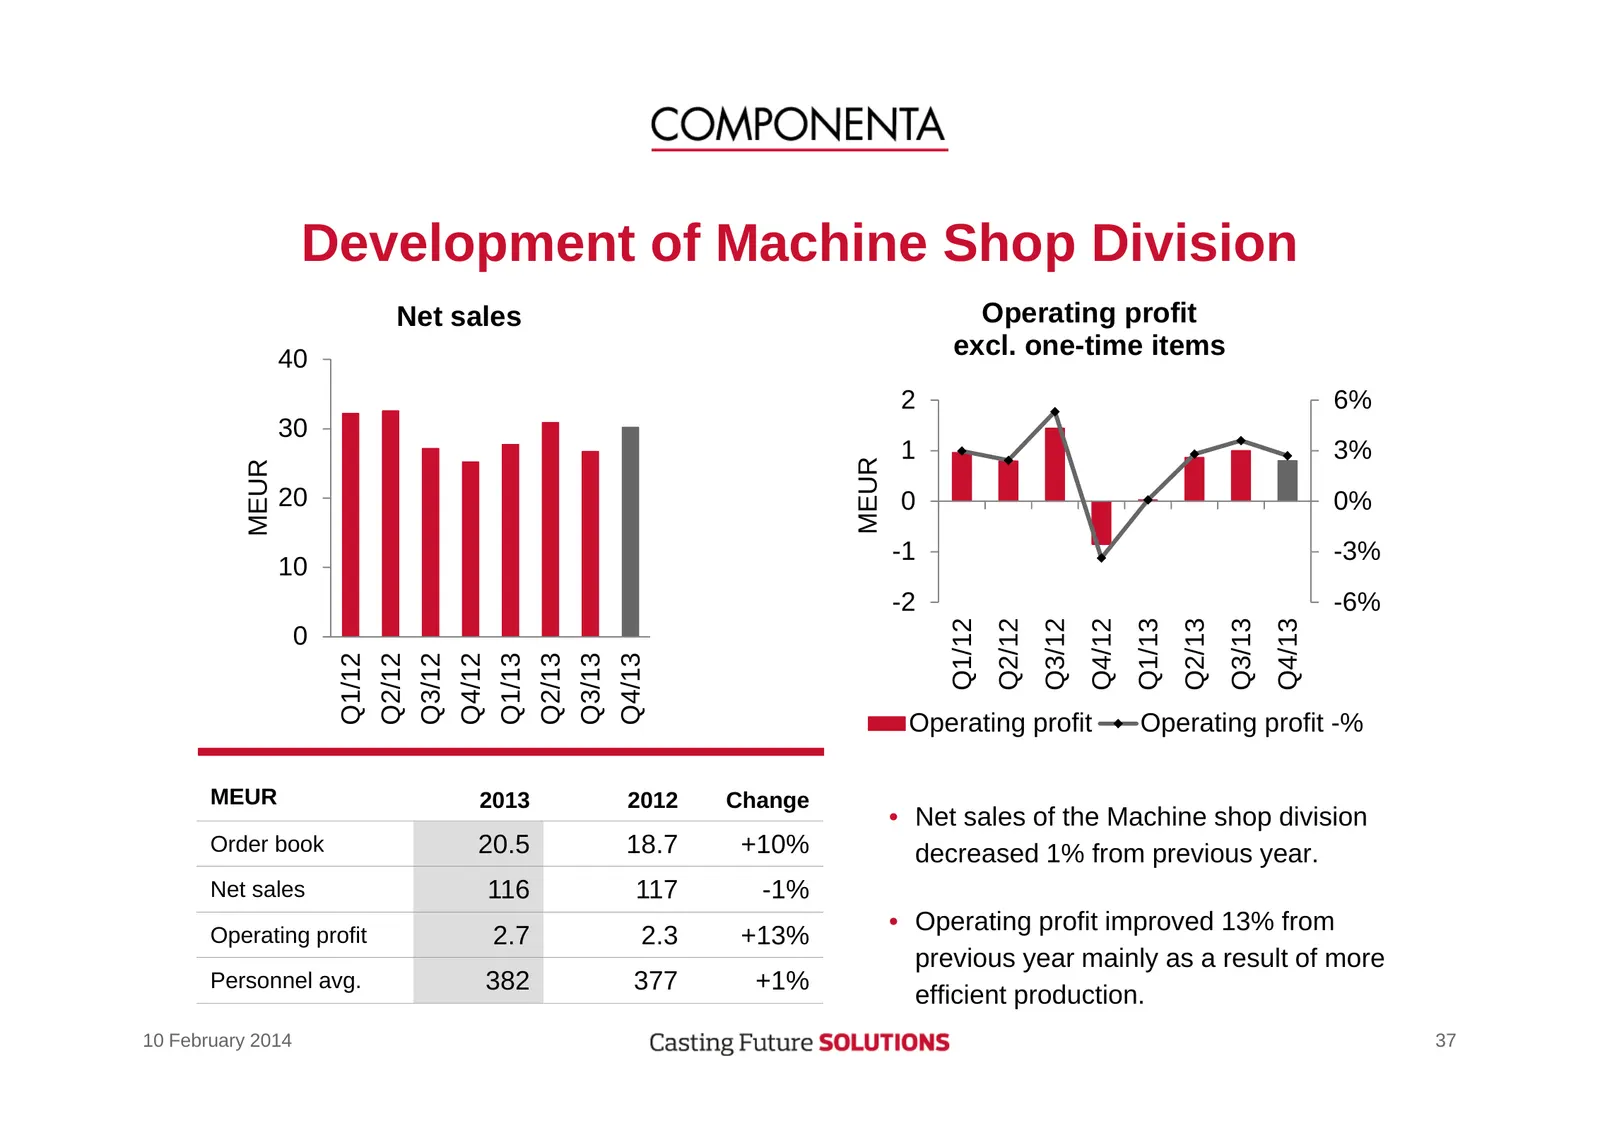
Development of Machine Shop Division Net sales Operating profit 40 excl. one-time items 2 6% 30 1 3% MEUR MEUR 20 0 0% -1 -3% 10 -2 -6% Q1/12 Q2/12 Q3/12 Q4/12 Q1/13 Q2/13 Q3/13 Q4/13 0 Q1/12 Q2/12 Q3/12 Q4/12 Q1/13 Q2/13 Q3/13 Q4/13 Operating profit Operating profit -% MEUR 2013 2012 Change • Net s
Slide 38: Development of Aluminium Division
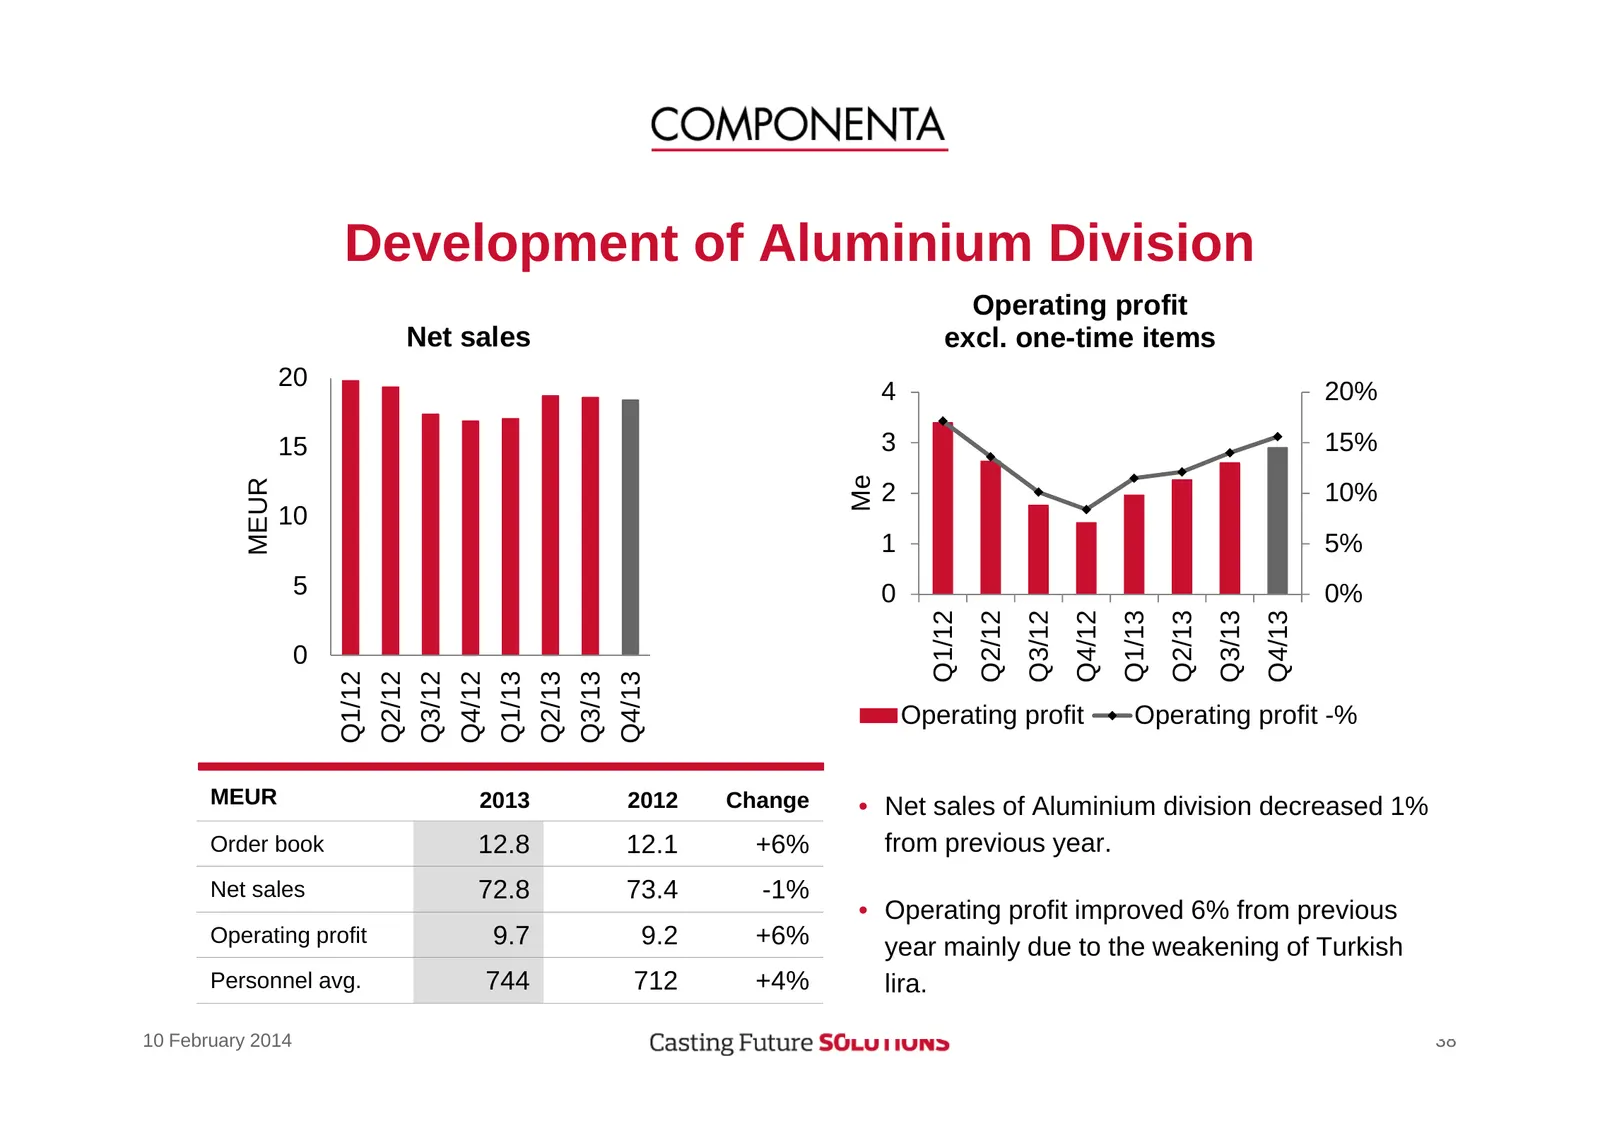
Development of Aluminium Division Operating profit Net sales excl. one-time items 20 4 20% 15 3 15% Me MEUR 2 10% 10 1 5% 5 0 0% Q1/12 Q2/12 Q3/12 Q4/12 Q1/13 Q2/13 Q3/13 Q4/13 0 Q1/12 Q2/12 Q3/12 Q4/12 Q1/13 Q2/13 Q3/13 Q4/13 Operating profit Operating profit -% MEUR 2013 2012 Change • Net sales of

Slide 39: Prospects 2014
Prospects 2014 10 February 2014 39
Slide 40: Business environment 2014
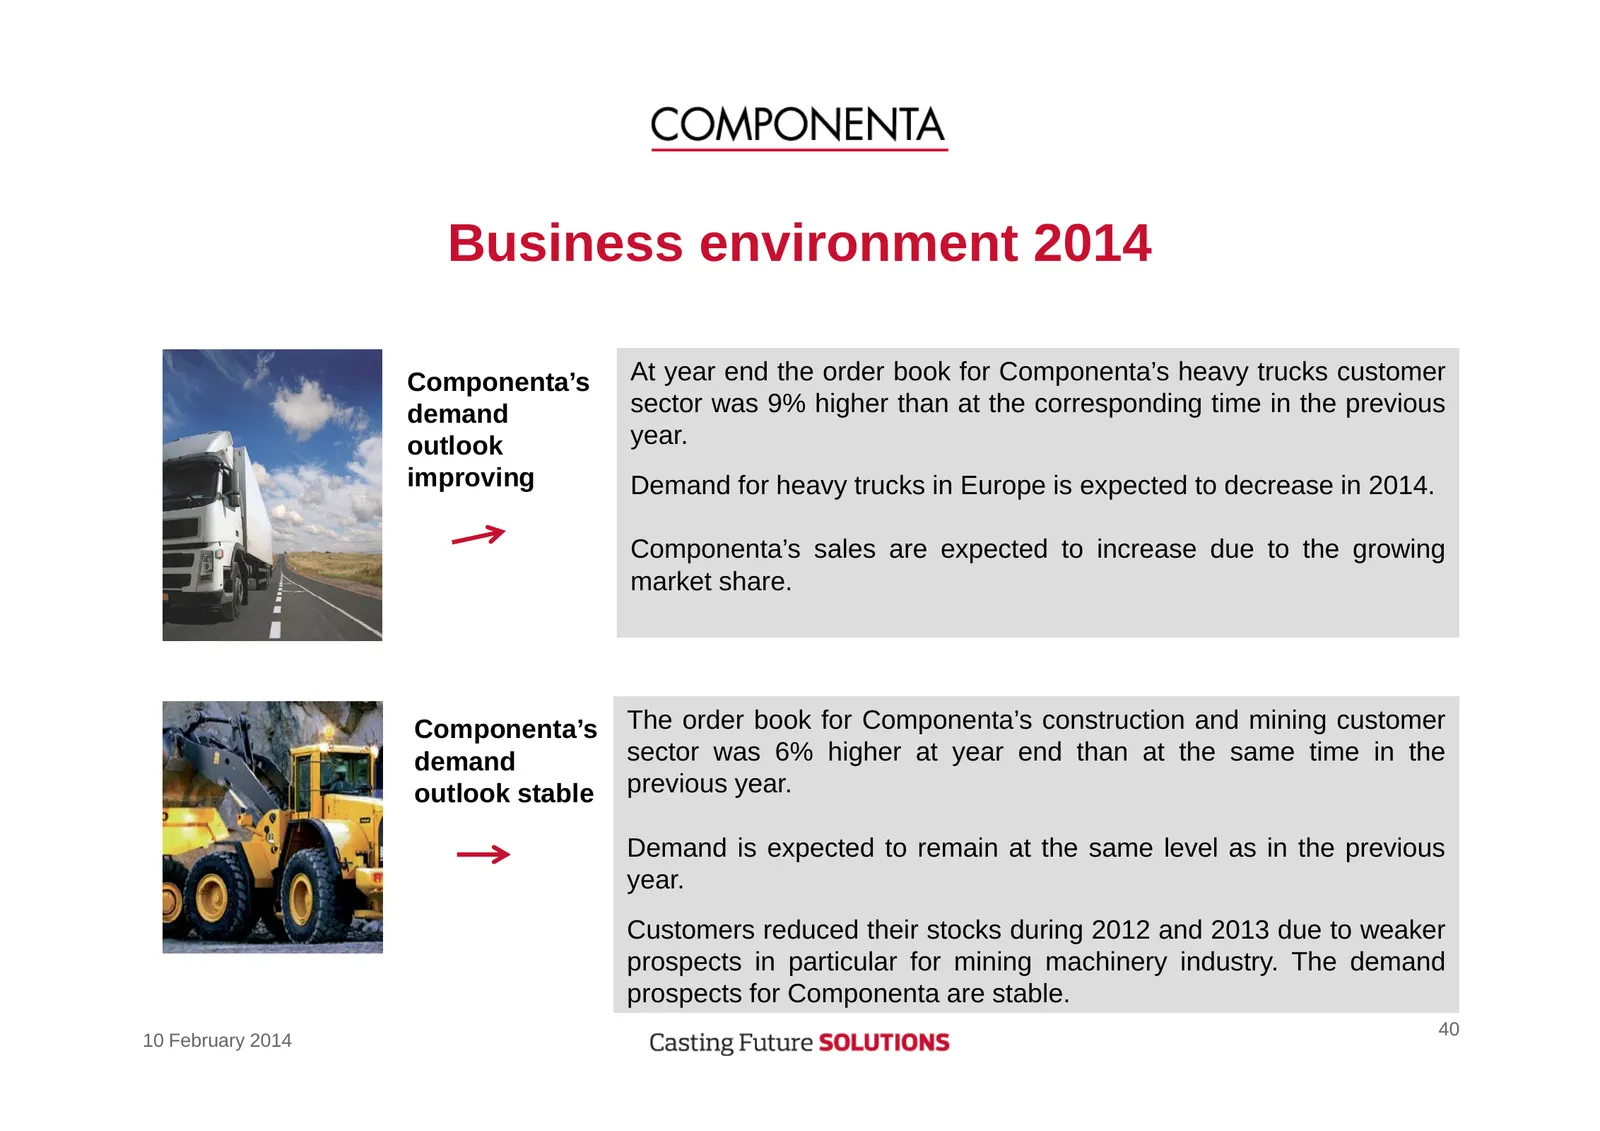
Business environment 2014 Componenta’s At year end the order book for Componenta’s heavy trucks customer demand sector was 9% higher than at the corresponding time in the previous outlook year. improving Demand for heavy trucks in Europe is expected to decrease in 2014. Componenta’s sales are expect
Slide 41: Business environment 2014
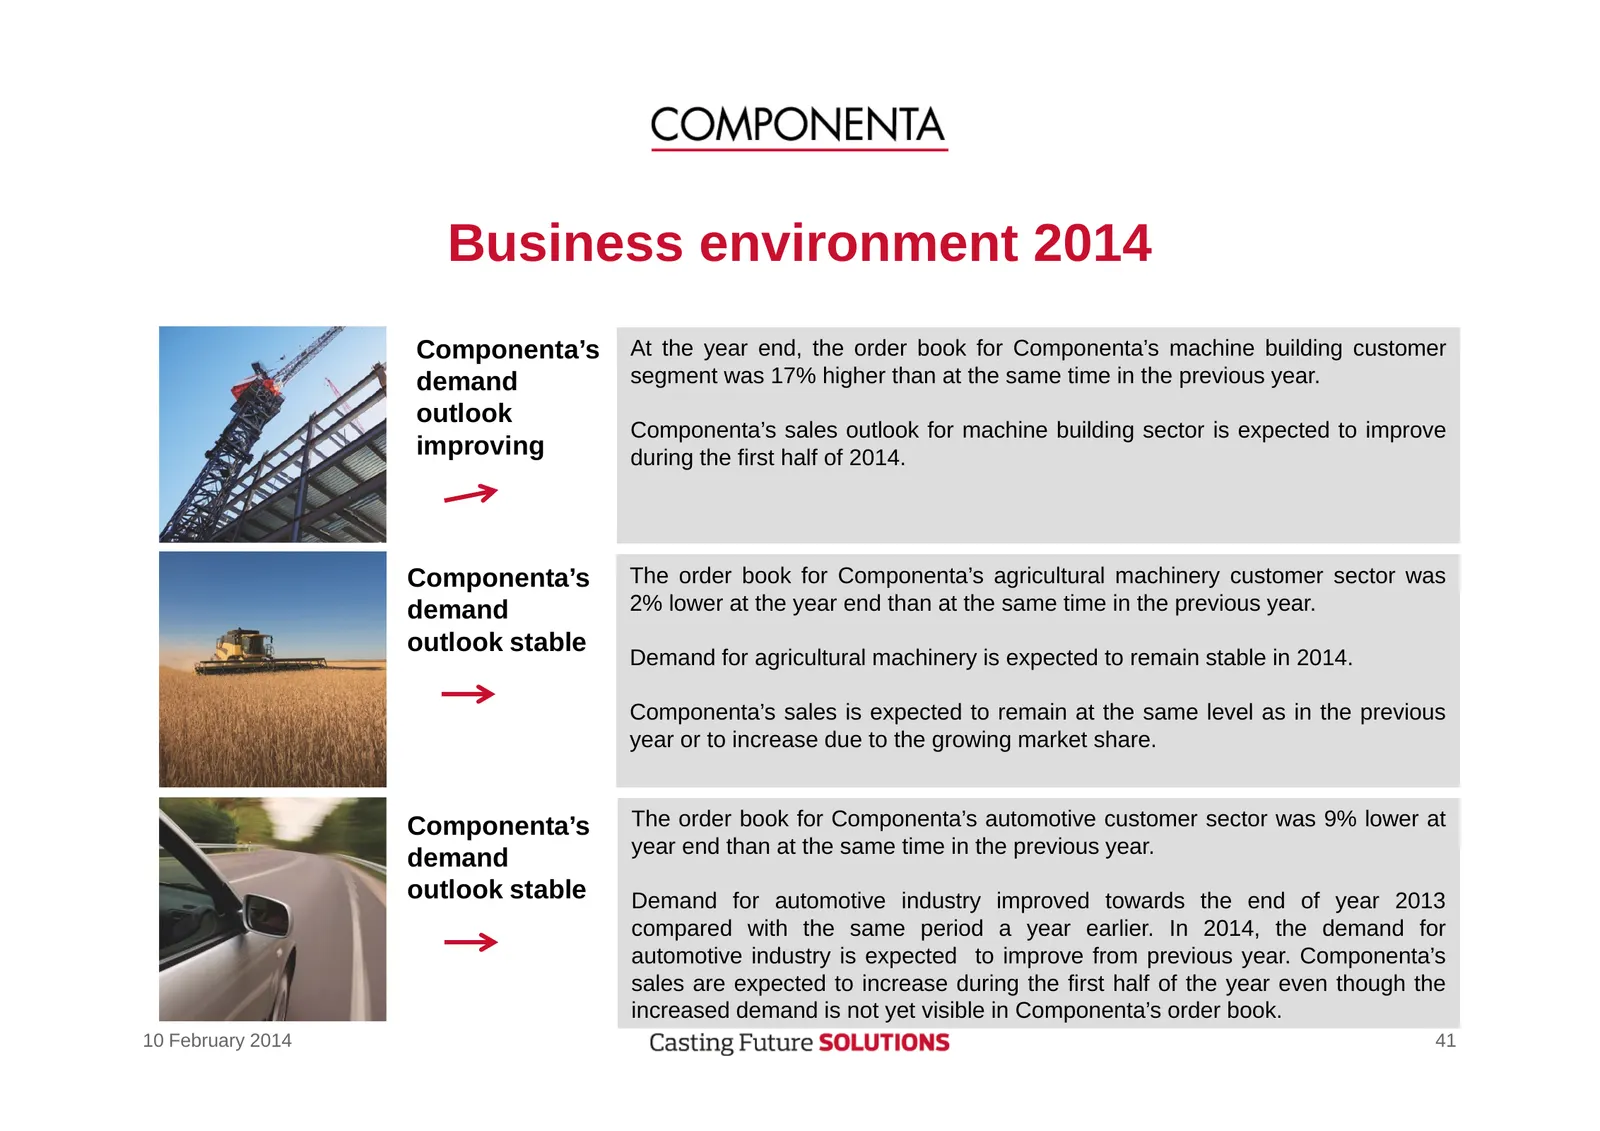
Business environment 2014 Componenta’s At the year end, the order book for Componenta’s machine building customer demand segment was 17% higher than at the same time in the previous year. outlook Componenta’s sales outlook for machine building sector is expected to improve improving during the first
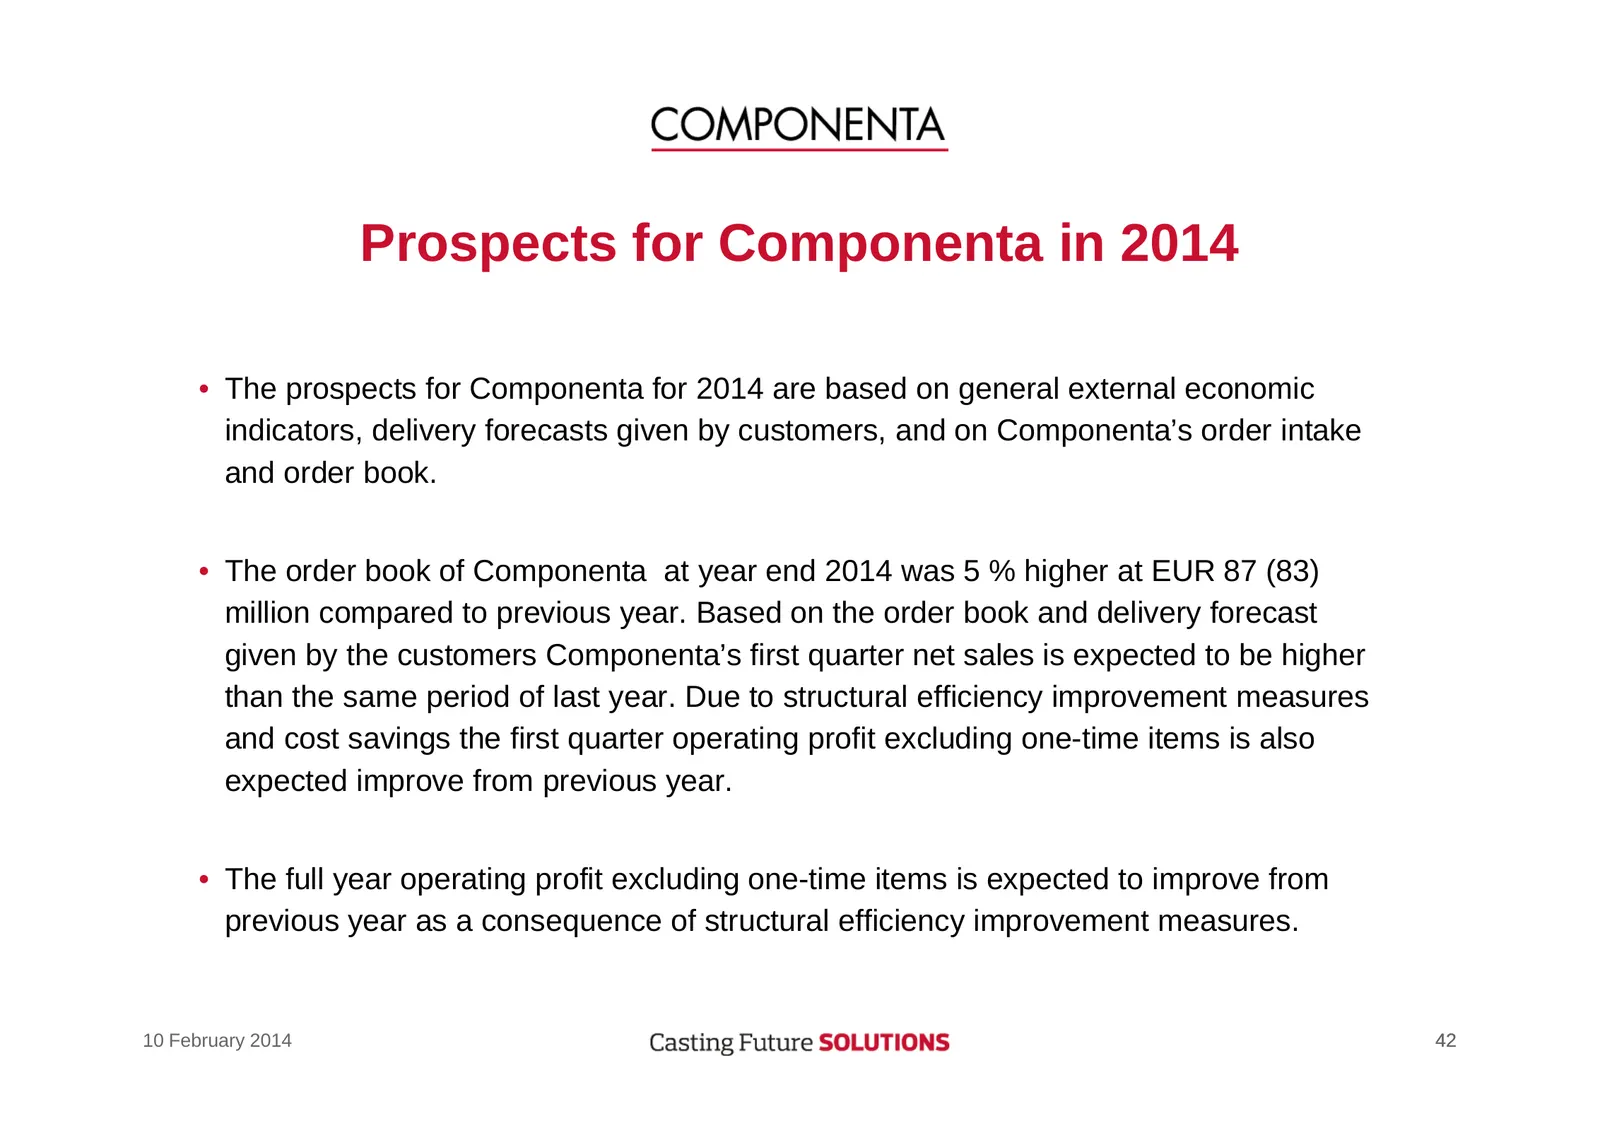
Slide 42: Prospects for Componenta in 2014
Prospects for Componenta in 2014 • The prospects for Componenta for 2014 are based on general external economic indicators, delivery forecasts given by customers, and on Componenta’s order intake and order book. • The order book of Componenta at year end 2014 was 5 % higher at EUR 87 (83) million co

Slide 43: Componenta
COMPONENTA
Source: Internet Archive copy of componenta.com
More decks from Componenta Oyj
 H1 2026 Earnings Presentation11 slides · Jul 23, 2026
 Q1 2026 Earnings Presentation10 slides · May 8, 2026
 FY2025 Earnings Presentation11 slides · Mar 6, 2026
 Q3 2025 Earnings Presentation12 slides · Oct 30, 2025
 H1 2025 Earnings Presentation12 slides · Jul 23, 2025
 Q1 2025 Earnings Presentation11 slides · May 9, 2025