Airtran — Investor Presentation (November 2006)
23 slides from Airtran's investor presentation, Nov 20, 2006
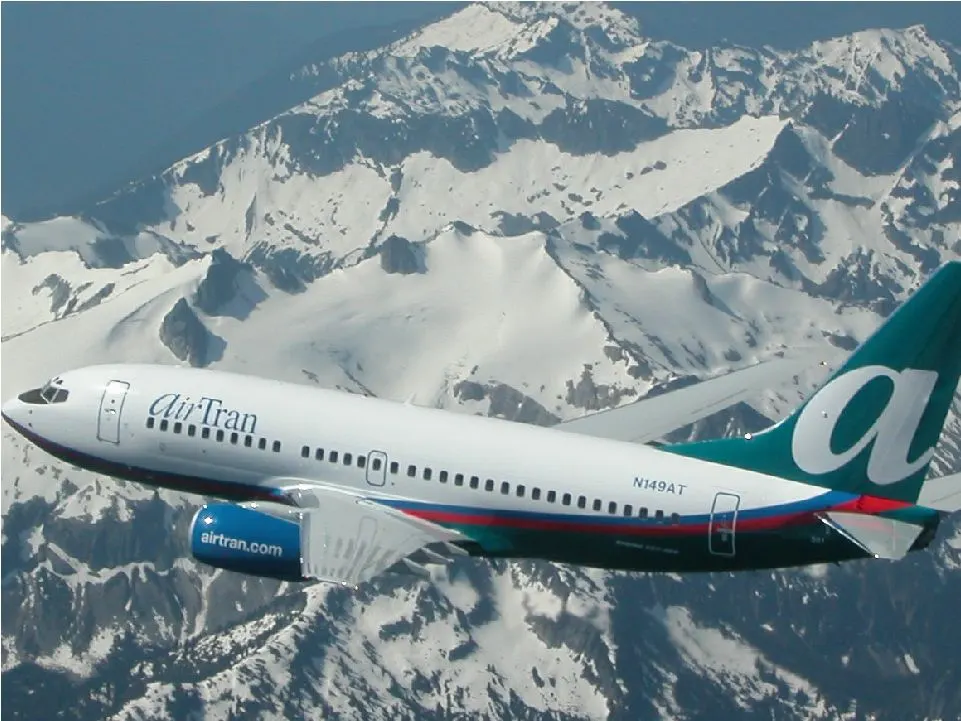
Slide 1: Investor Update November 2006
Investor Update November 2006 Exhibit 99.1
Slide 2: Safe Harbor Disclosure
2 Safe Harbor Disclosure Please note that the discussion today may contain forward looking statements that involve risks and uncertainties including those relating to the company’s ability to develop new markets, its fleet and growth plans, its low cost advantage vs. competitors, its ability to obta
Slide 3: AirTran Airways Today
3 AirTran Airways Today • Youngest all-Boeing fleet in America – 123 Airplanes – 87 717s / 36 737s • 52 cities served • 7 consecutive years of profitability – One of two consistently profitable airlines • Stable and experienced management
Slide 4: AirTran Airways 2006 YTD Highlights
4 AirTran Airways 2006 YTD Highlights • Network expansion – Capacity +25% – RPMs +25% – 15.0 million passengers, +23% – Strong RASM improvement • Opened two new cities in 2006: - White Plains, New York and Seattle, Washington • Announced two new cities starting in 2007: - Newburgh, New York and Dayt
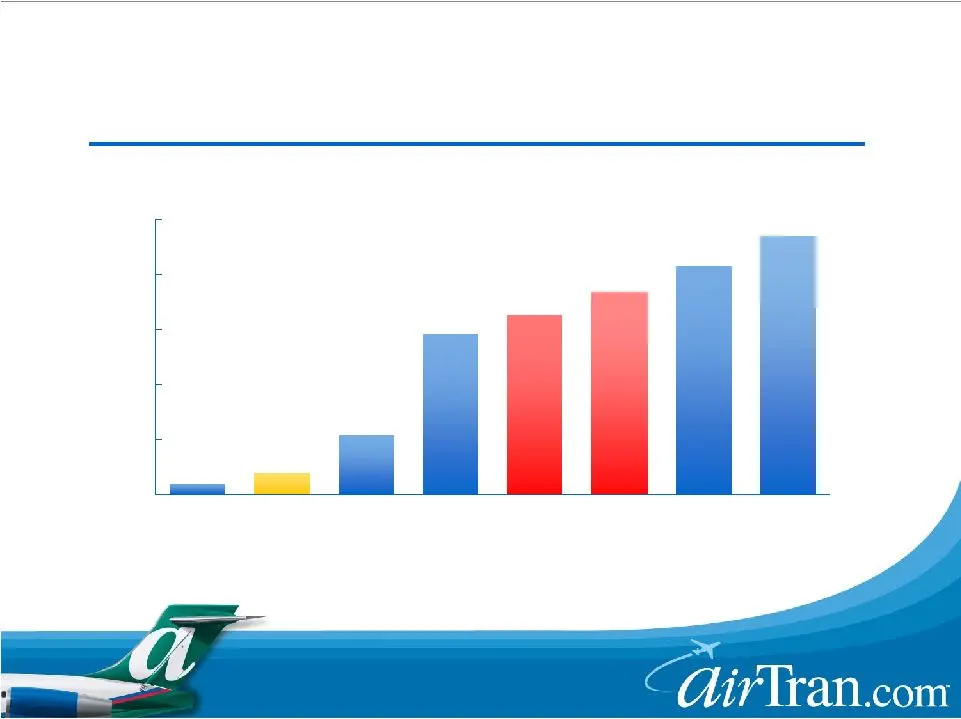
Slide 5: AirTran Has Very Low Costs
5 LUV AAI JBLU LCC NWAC DAL AMR CAL While legacy costs are down, gap remains large AirTran Has Very Low Costs (cents) Non-Fuel Unit Costs at 649 Miles for 1H 2006
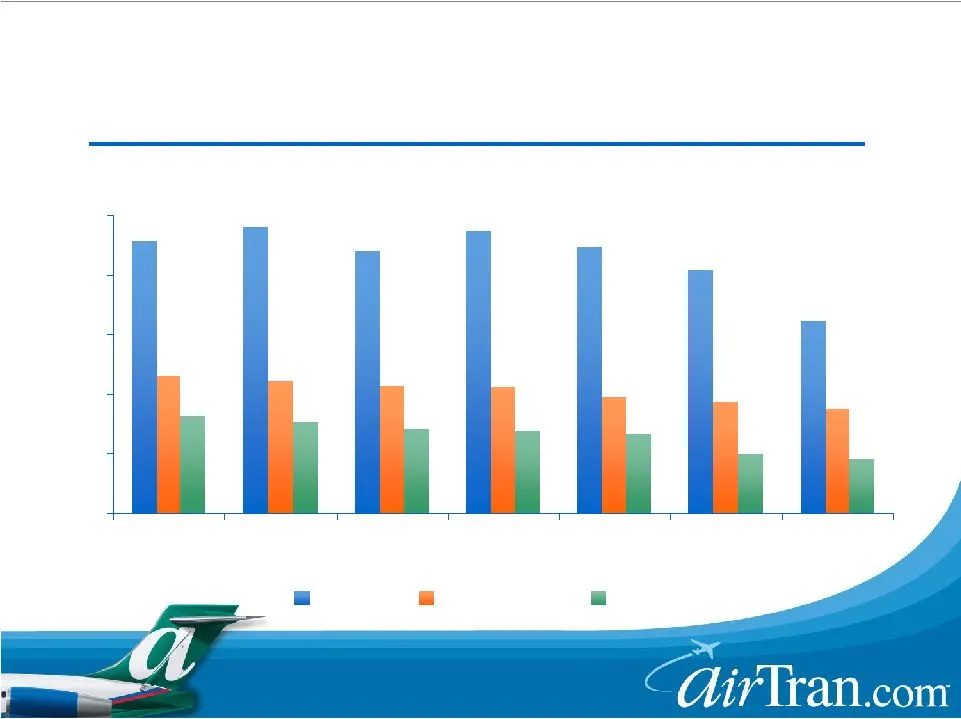
Slide 6: AirTran Has Industry Leading Employee Efficiency
6 AirTran Has Industry Leading Employee Efficiency Q105 Q205 Q305 Q405 Q106 Q206 Q306 jetBlue Southwest AirTran FTE’s per Aircraft JBLU +39% LUV +14%
Slide 7: What Creates AirTran's Low Cost Advantage?
7 What Creates AirTran’s Low Cost Advantage? • Productive workforce at all levels • Young, simplified fleet – Fuel efficient – Attractive ownership costs • Efficient use of facilities • Competition for heavy maintenance contracts • Low cost distribution – Over 70% of sales are directly with AirTran
Slide 8: Lowering Costs Is Not A One Time Event
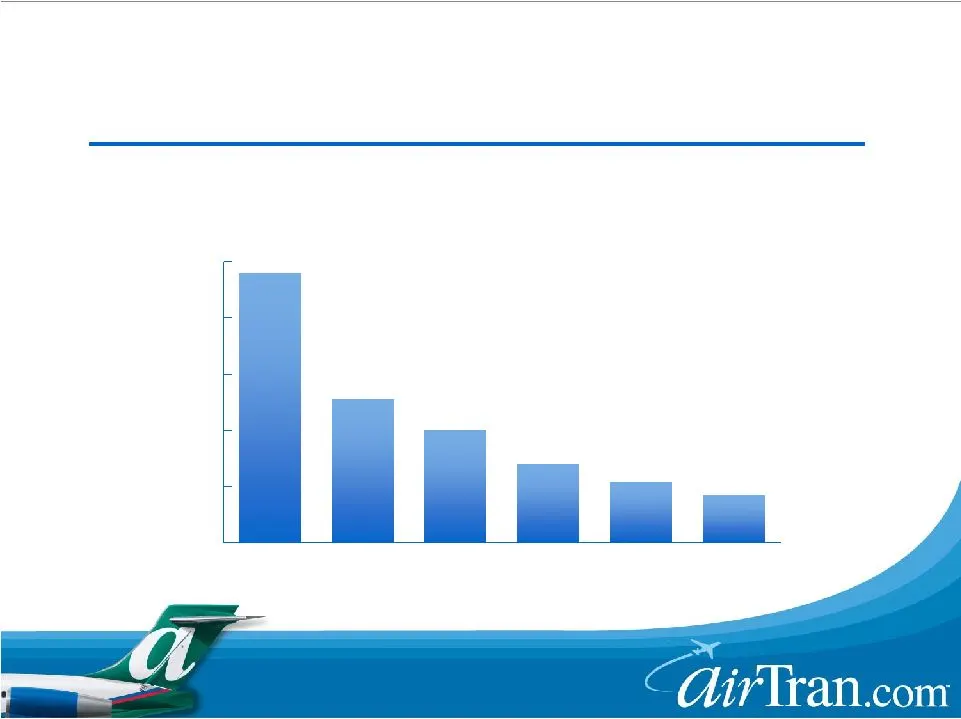
8 Lowering Costs Is Not A One Time Event AirTran's Non-Fuel Unit Cost Trend 6.00 6.25 6.50 6.75 7.00 7.25 2001 2002 2003 2004 2005 2006E * Excludes non-recurring special items (cents per mile)
Slide 9: New Aircraft Will Continue To Drive Down Costs
9 New 737 Aircraft Will Continue To Drive Down Costs • Increases crew productivity – No additional staffing required – 17% increase in seats • Transcontinental range increases productivity – Utilization now 12-13 hrs/day vs. 11 hrs/day on 717’s • Even better fuel economy than the 717 per seat • Orde
Slide 10: Low Cost Fleet Plan
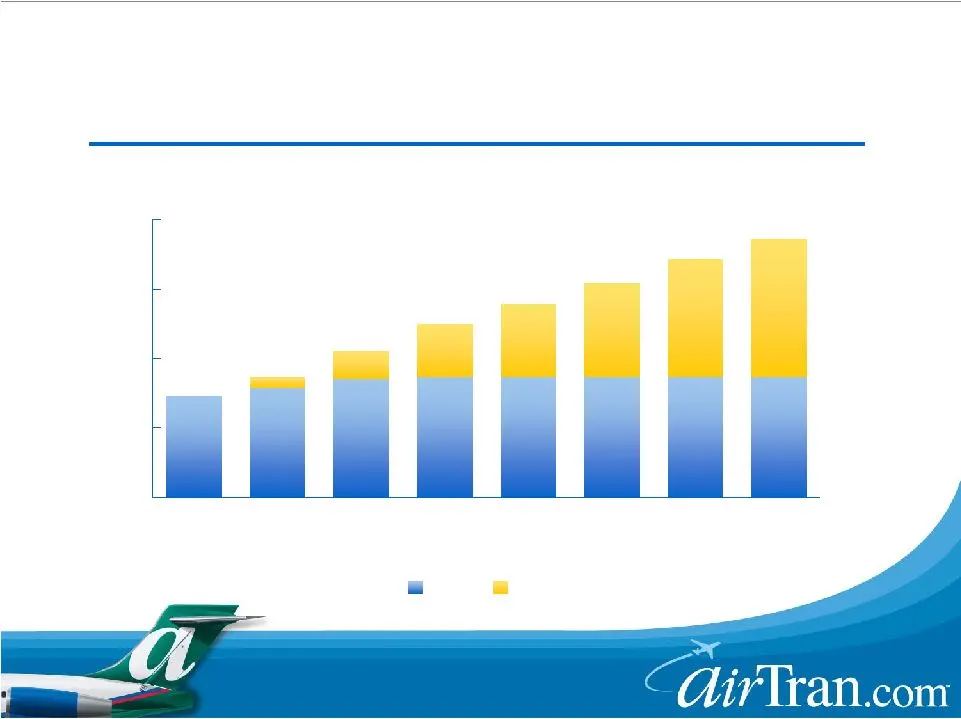
10 Low Cost Fleet Plan 2003 2004 2005 2006 2007 2008 2009 2010 717s 737s Currently 123 Aircraft: 87 717s / 36 737s Aircraft
Slide 11: AirTran Poised To Become Industry's Lowest Cost Provider
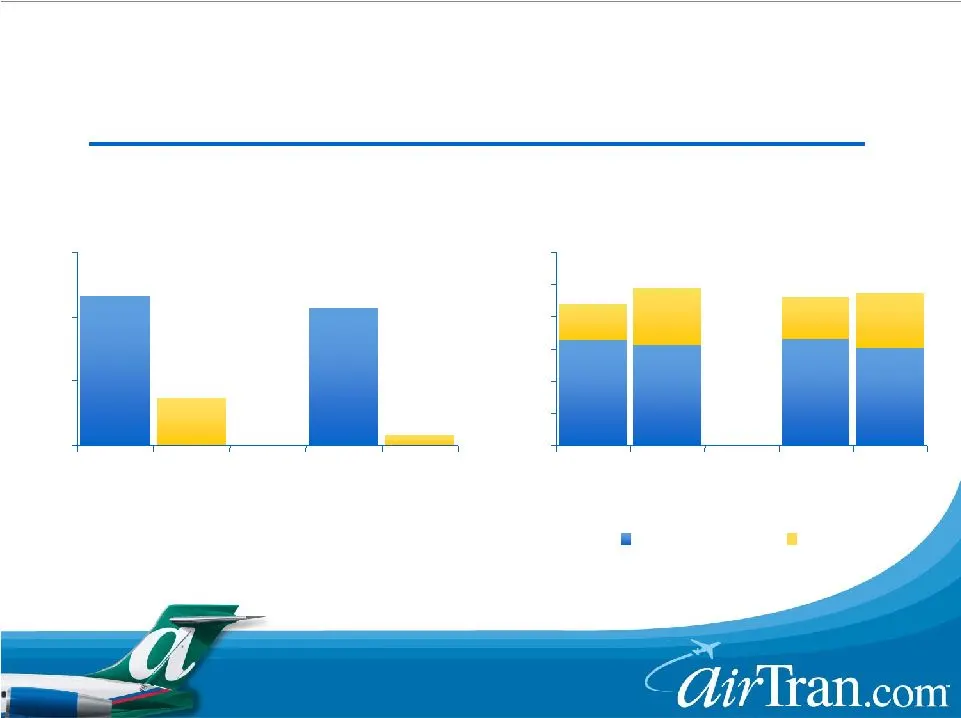
11 AAI 11% Higher AAI 3% Higher AAI -39% Lower AAI -30% Lower Despite Bankruptcy, AAI Cost Advantage Versus DAL Has Widened Among Low Cost Industry Leaders (cents) (cents) Non-Fuel CASM DAL Q201 AAI Q201 DAL Q206 AAI Q206 LUV 2006E AAI 2006E LUV 2007E AAI 2007E Non-Fuel CASM AirTran Poised To Become
Slide 12: Low Costs Does Not Mean Budget Service
12 Low Costs Does Not Mean Budget Service • Assigned seating • Business class – Only major U.S. airline with business class on every flight • Convenient distribution – Internet/Kiosks – Telephone reservations and airport sales – Travel agencies • XM Radio and oversized luggage bins • Friendly crewme
Slide 13: Marketing Alliance With Frontier
13 Marketing Alliance With Frontier • Announced Tuesday, November 14 th • Creates a low cost, low complexity alliance that will generate additional revenue in near term • Combines AirTran’s East coast network with Frontier’s Western U.S. network • Expands the scope and value of the frequent traveler
Slide 14: AirTran route network map
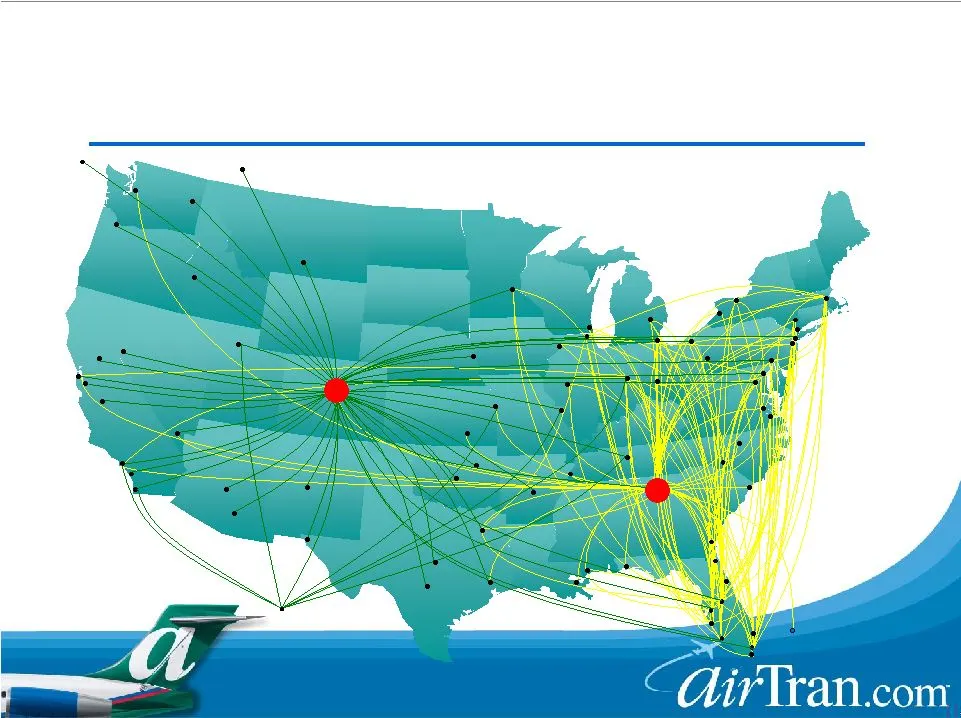
14 Grand Bahama Boston Houston New Orleans Miami Ft. Lauderdale West Palm Beach Seattle Newburgh White Plains New York City Philadelphia Newark Baltimore Washington, D.C. Richmond Newport News/ Williamsburg Raleigh / Durham / Durham Durham Charlotte Myrtle Beach Atlanta Savannah Jacksonville Daytona
Slide 15: AirTran Maintains High Airline Quality Rating
15 2004 2003 2002 2001 2005 * Wichita State University and University of Nebraska, Omaha JetBlue AirTran Southwest United Alaska America West Northwest American Continental ATA JetBlue Alaska Southwest America West US Airways Northwest Continental AirTran United ATA US Airways Alaska Southwest Ameri
Slide 16: Low Costs and Modern Jets Creates Great Growth Opportunities
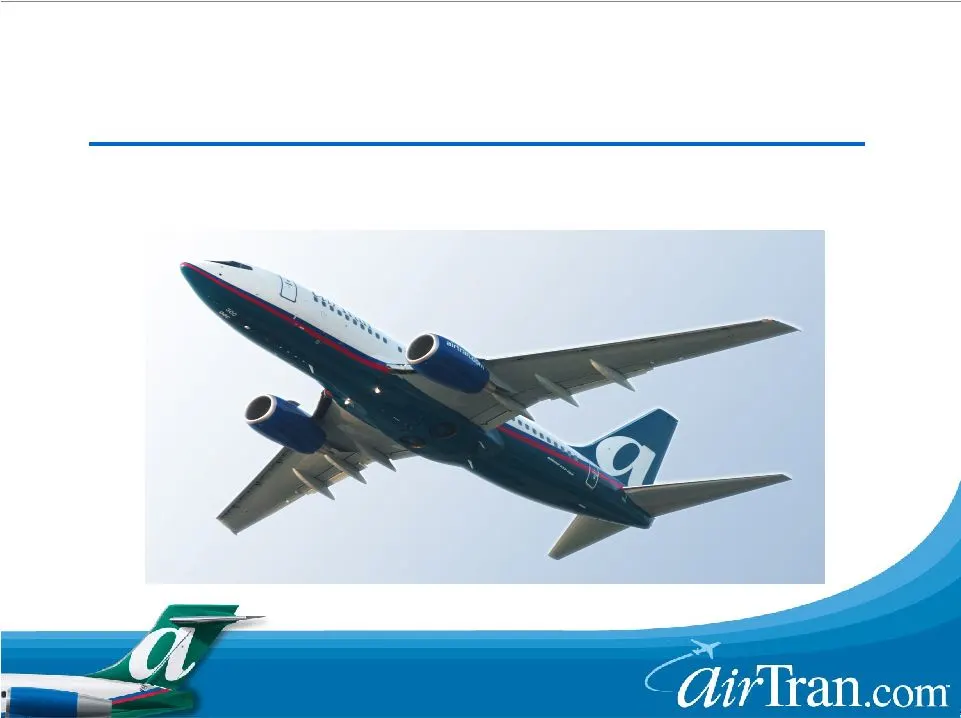
16 Low Costs and Modern Jets Creates Great Growth Opportunities
Slide 17: AirTran 2006: Capitalizing On Opportunities
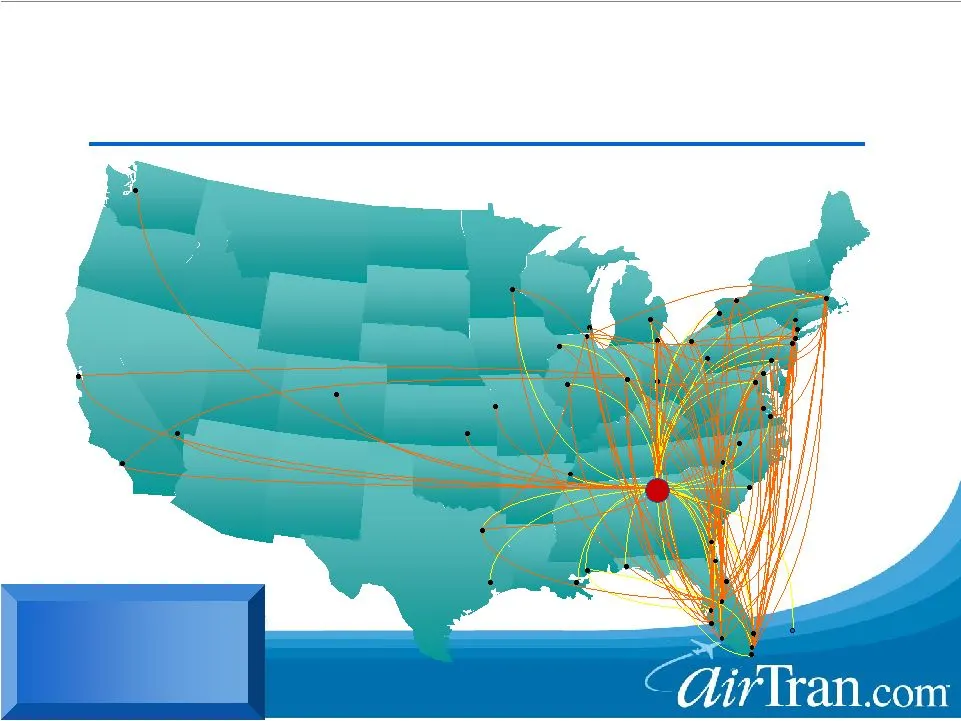
17 Grand Bahama Minneapolis Boston Houston New Orleans Miami Ft. Lauderdale Wichita Kansas City West Palm Beach Chicago Los Angeles San Francisco Seattle Denver Growth Since 9/11/01 Cities: 18 Routes: 83 Newburgh White Plains New York City Philadelphia Newark Baltimore Washington, D.C. Richmond Newp
Slide 18: Cities with 5 or more destinations
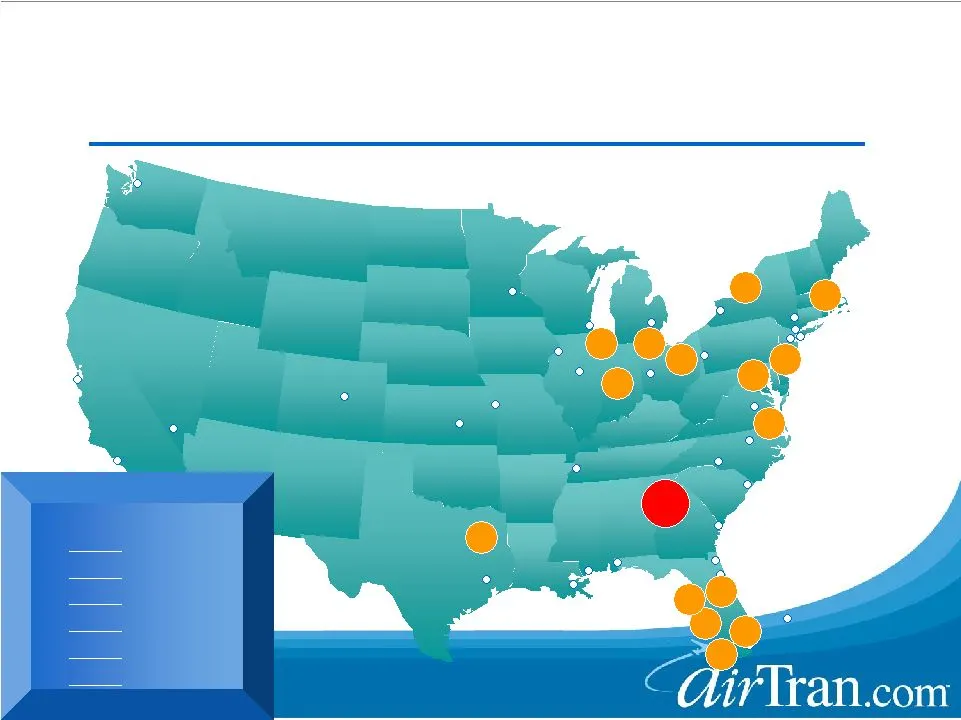
18 Bloomington Buffalo Newark Pittsburgh Miami West Palm Beach Denver Pensacola Freeport Wichita Houston Gulfport Los Angeles Kansas City Memphis Moline Minneapolis New Orleans San Francisco New York Savannah Jacksonville Washington Myrtle Beach Raleigh-Durham Flint Las Vegas Cities >=5 destinations
Slide 19: AirTran's Atlanta Hub is Now One of the Nations Largest Mainline Hubs
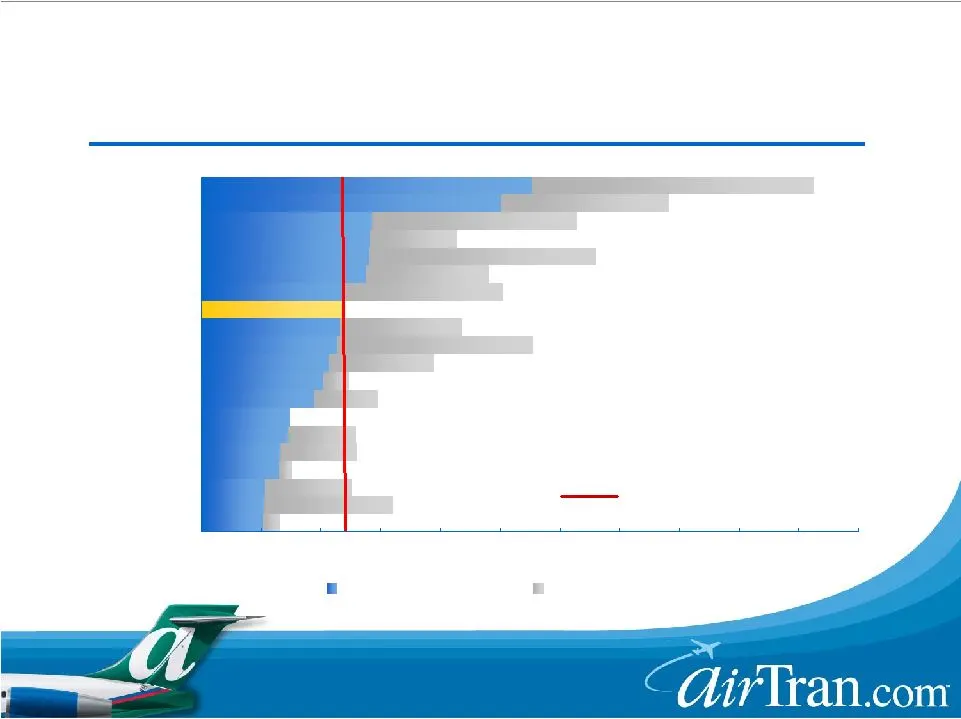
19 AirTran’s Atlanta Hub is Now One of the Nations Largest Mainline Hubs 1,000 1,100 LCC-Las Vegas UAUA-Washington, DC UAUA-Los Angeles Frontier-Denver ALK-Seattle UAUA-San Francisco JBLU-New York LCC-Phoenix AMR-Miami CAL-Newark LCC-Charlotte UAUA-Denver AAI-Atlanta AMR-Chicago NWAC-Detroit CAL-Hou
Slide 20: Adjusted Fleet Plan
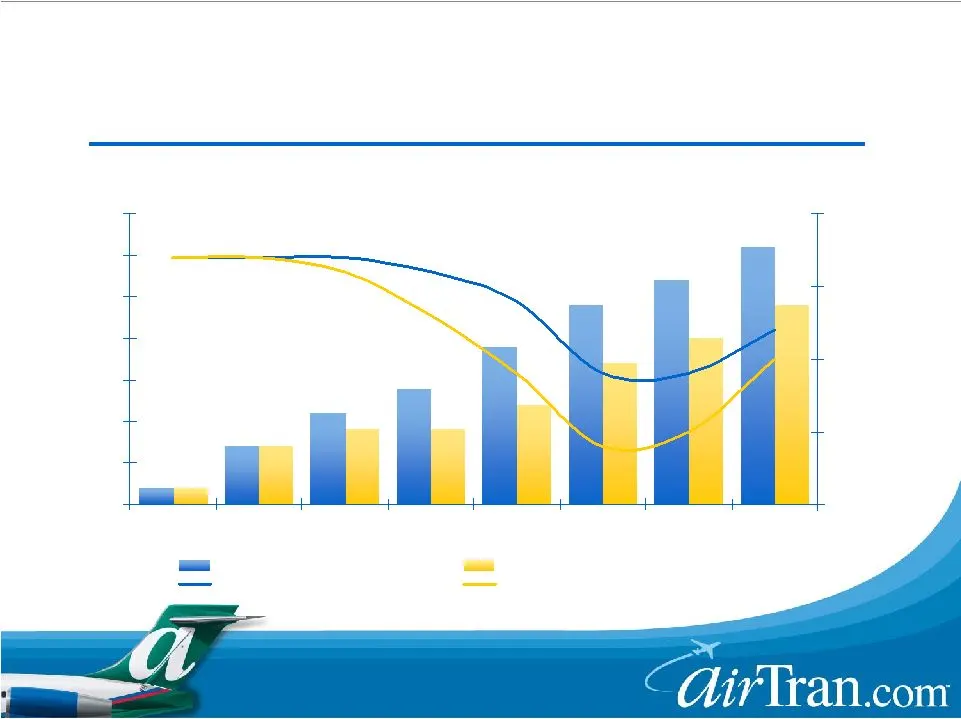
20 Adjusted Fleet Plan Q107 Q207 Q307 Q407 Q108 Q208 Q308 Q408 5% 10% 15% 20% 25% Original Aircraft Adjusted Aircraft Original ASM Growth Adjusted ASM Growth Total Aircraft ASM Growth Rate
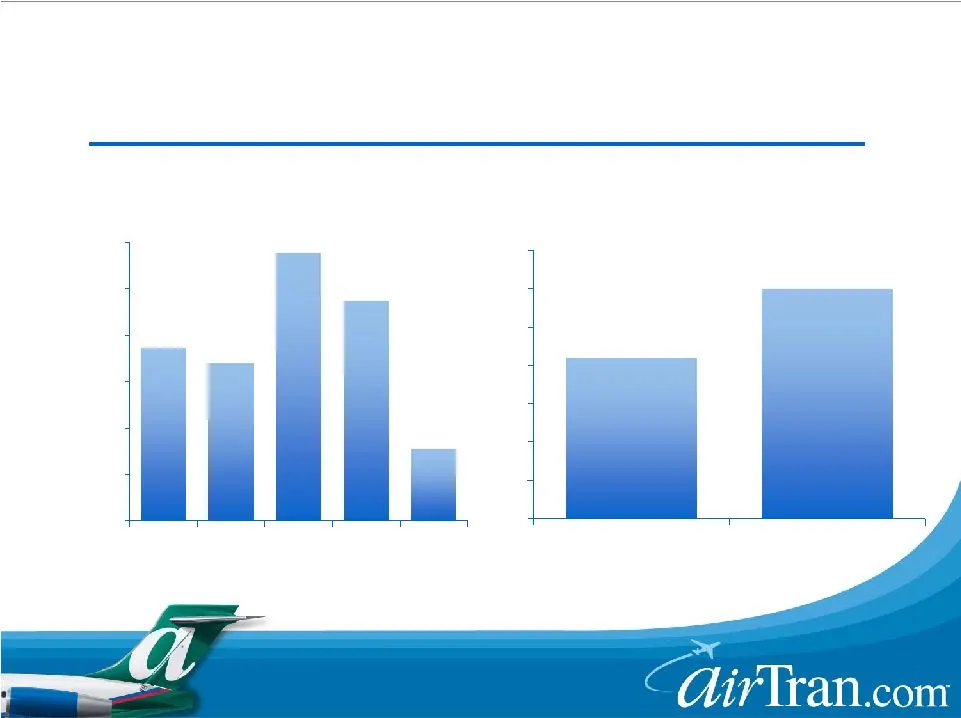
Slide 21: AirTran Continues to Manage Fuel Exposure
21 48% 16% 34% 37% 58% AirTran Continues to Manage Fuel Exposure ASMs per Gallon 2000 2006 >40% improvement AirTran's Current Hedge Position 0% 10% 20% 30% 40% 50% 60% Q106 Q206 Q306 Q406 2007 $2.09/gal actual $2.40/gal actual $2.22/gal forecast $2.05/gal forecast $2.02/gal actual

Slide 22: Fuel Sensitivity
22 Fuel Sensitivity $65 Crude $60 Crude $70 Crude 2007E Fuel Expense ($MM) $780 $740 $820 Change from $65 ($MM) NA +$40 -$40 EPS Change from $65 NA +$0.23 -$0.23 Forward Curve * Based on estimates
Slide 23: Summary
23 Summary • AirTran has good fundamentals – Young fleet – Better growth plan with balanced deliveries – Experienced management – Positioned to become the low cost leader • Significant opportunities remain – 4 to 5 new cities per year – Connecting existing cities • Taking steps to reduce growth rate
Source: SEC EDGAR · 8-K filed Nov 20, 2006
More decks from Airtran Holdings Inc
 Merger or Acquisition (September 2010)21 slides · Sep 27, 2010
 Bank of America - Merrill Lynch Global Transportation Conference 201025 slides · Jun 15, 2010
 Shareholder Meeting (May 2010)33 slides · May 18, 2010
 Investor Presentation (May 2010)26 slides · May 13, 2010
 JP Morgan Aviation, Transportation and Defense Conference 201025 slides · Mar 9, 2010
 Raymond James 2010 Growth Airline Conference25 slides · Feb 4, 2010